guns & ammunition manufacturing in the us - …sanpete.com/downloads/33299a.pdf · guns &...
TRANSCRIPT
WWW.IBISWORLD.COM Guns & Ammunition Manufacturing in the US June 2017 1
IBISWorld Industry Report 33299aGuns & Ammunition Manufacturing in the USJune 2017 Daniel Longo
Lock and load: After recent sales surge, demand normalizes as fears of gun control subside
2 About this Industry2 Industry Definition
2 Main Activities
2 Similar Industries
3 Additional Resources
4 Industry at a Glance
5 Industry Performance5 Executive Summary
5 Key External Drivers
7 Current Performance
10 Industry Outlook
12 Industry Life Cycle
14 Products & Markets14 Supply Chain
14 Products & Services
15 Demand Determinants
16 Major Markets
17 International Trade
19 Business Locations
21 Competitive Landscape21 Market Share Concentration
21 Key Success Factors
21 Cost Structure Benchmarks
23 Basis of Competition
24 Barriers to Entry
25 Industry Globalization
26 Major Companies26 General Dynamics Corp.
27 Vista Outdoor Operations LLC
28 Remington Outdoor Company
28 American Outdoor Brands Corporation
30 Olin Corp.
31 Orbital ATK Inc.
32 Operating Conditions32 Capital Intensity
33 Technology & Systems
34 Revenue Volatility
34 Regulation & Policy
36 Industry Assistance
38 Key Statistics38 Industry Data
38 Annual Change
38 Key Ratios
39 Industry Financial Ratios
40 Jargon & Glossary
www.ibisworld.com | 1-800-330-3772 | [email protected]
This report was provided toUniversity of Nevada, Reno (2126926196)by IBISWorld on 01 September 2017 in accordance with their license agreement with IBISWorld
WWW.IBISWORLD.COM Guns & Ammunition Manufacturing in the US June 2017 2
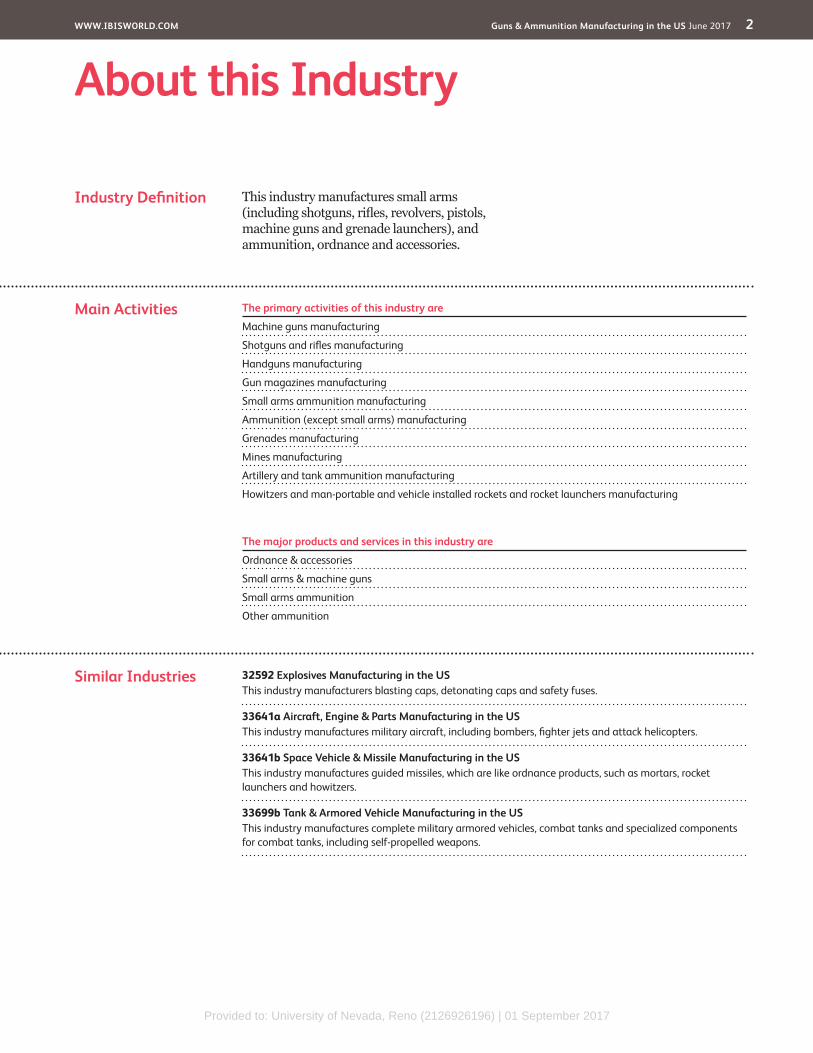
This industry manufactures small arms (including shotguns, rifles, revolvers, pistols, machine guns and grenade launchers), and ammunition, ordnance and accessories.
The primary activities of this industry are
Machine guns manufacturing
Shotguns and rifles manufacturing
Handguns manufacturing
Gun magazines manufacturing
Small arms ammunition manufacturing
Ammunition (except small arms) manufacturing
Grenades manufacturing
Mines manufacturing
Artillery and tank ammunition manufacturing
Howitzers and man-portable and vehicle installed rockets and rocket launchers manufacturing
32592 Explosives Manufacturing in the USThis industry manufacturers blasting caps, detonating caps and safety fuses.
33641a Aircraft, Engine & Parts Manufacturing in the USThis industry manufactures military aircraft, including bombers, fighter jets and attack helicopters.
33641b Space Vehicle & Missile Manufacturing in the USThis industry manufactures guided missiles, which are like ordnance products, such as mortars, rocket launchers and howitzers.
33699b Tank & Armored Vehicle Manufacturing in the USThis industry manufactures complete military armored vehicles, combat tanks and specialized components for combat tanks, including self-propelled weapons.
Industry Definition
Main Activities
Similar Industries
About this Industry
The major products and services in this industry are
Ordnance & accessories
Small arms & machine guns
Small arms ammunition
Other ammunition
Provided to: University of Nevada, Reno (2126926196) | 01 September 2017
WWW.IBISWORLD.COM Guns & Ammunition Manufacturing in the US June 2017 3
About this Industry
Additional Resources For additional information on this industry
www.atf.gov Bureau of Alcohol, Tobacco, Firearms and Explosives
www.nra.org National Rifle Association
www.nssf.org National Shooting Sports Foundation
www.defense.gov US Department of Defense
IBISWorld writes over 1000 US industry reports, which are updated up to four times a year. To see all reports, go to www.ibisworld.com
Provided to: University of Nevada, Reno (2126926196) | 01 September 2017
WWW.IBISWORLD.COM Guns & Ammunition Manufacturing in the US June 2017 4
% c
hang
e
10
-10
-5
0
5
2210 12 14 16 18 20Year
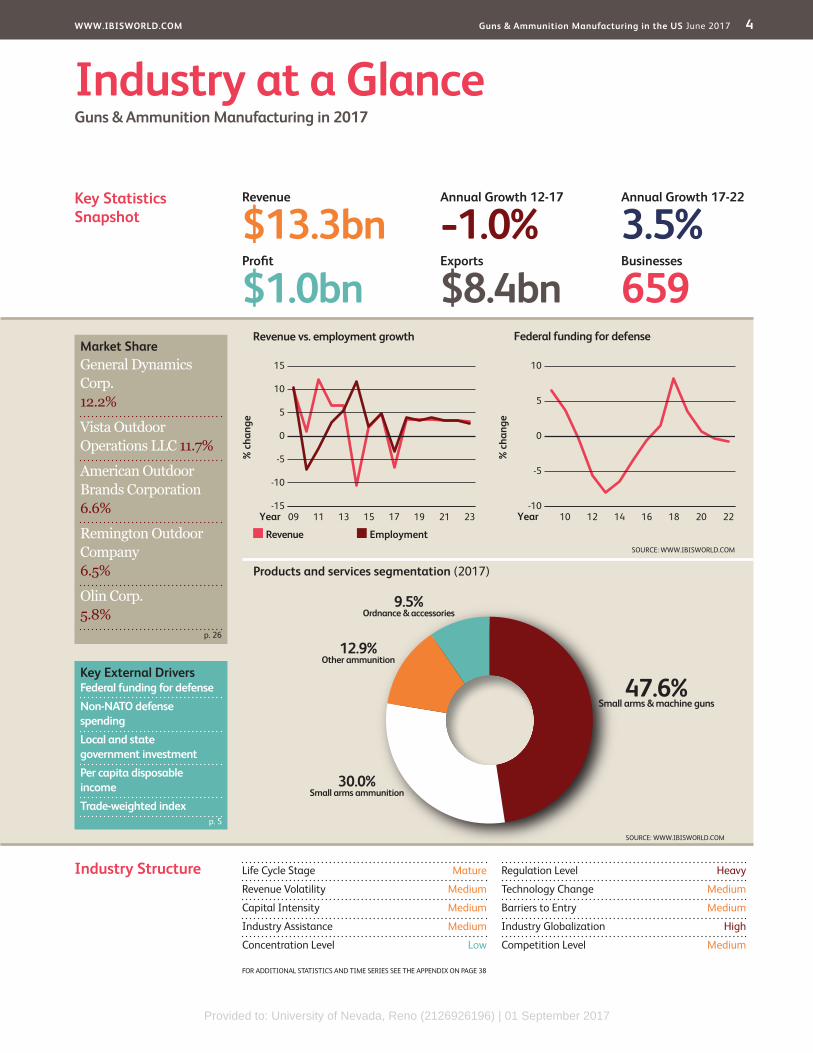
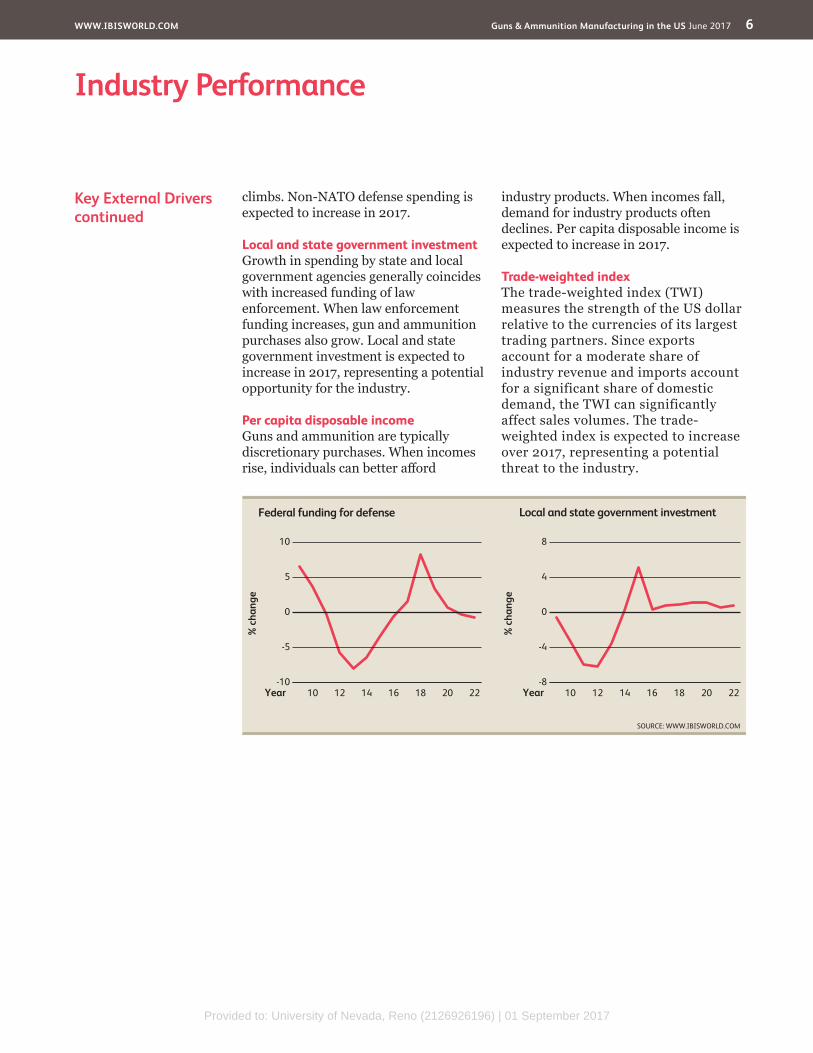
Federal funding for defense
SOURCE: WWW.IBISWORLD.COM
% c
hang
e
15
-15
-10
-5
0
5
10
2309 11 13 15 17 19 21Year
Revenue Employment
Revenue vs. employment growth
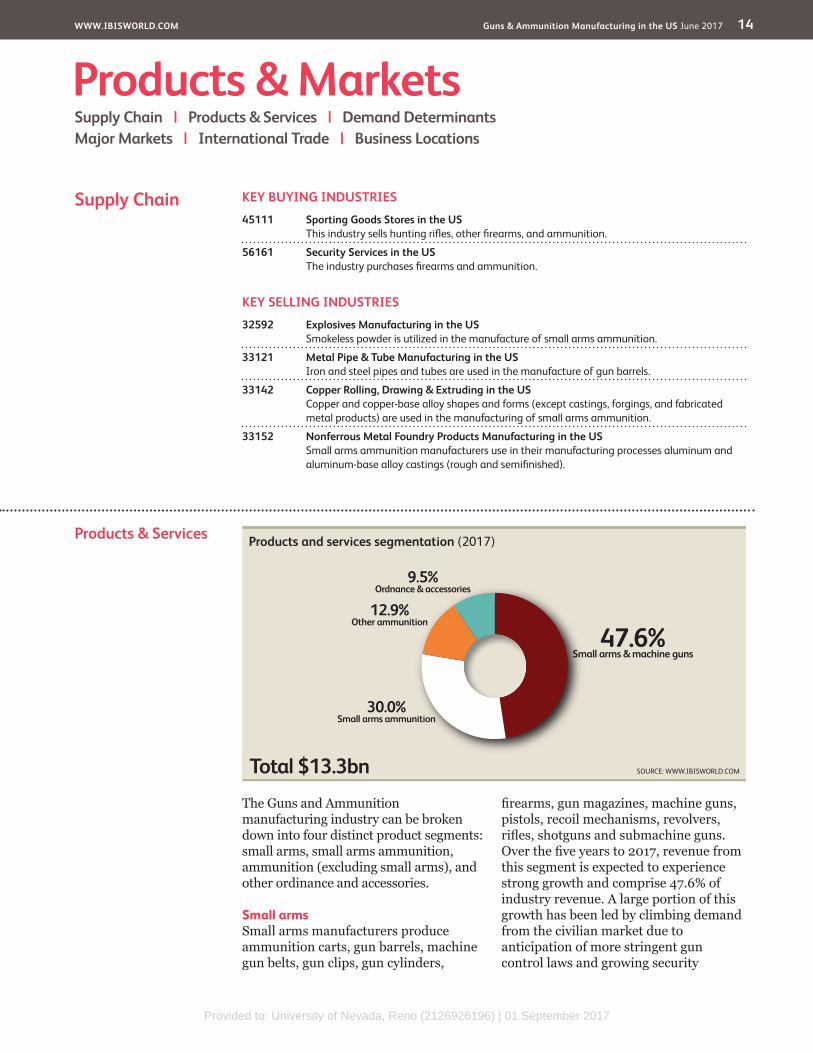
Products and services segmentation (2017)
47.6%Small arms & machine guns
30.0%Small arms ammunition
12.9%Other ammunition
9.5%Ordnance & accessories
SOURCE: WWW.IBISWORLD.COM
Key Statistics Snapshot
Industry at a GlanceGuns & Ammunition Manufacturing in 2017
Industry Structure Life Cycle Stage Mature
Revenue Volatility Medium
Capital Intensity Medium
Industry Assistance Medium
Concentration Level Low
Regulation Level Heavy
Technology Change Medium
Barriers to Entry Medium
Industry Globalization High
Competition Level Medium
Revenue
$13.3bnProfit
$1.0bnExports
$8.4bnBusinesses
659
Annual Growth 17-22
3.5%Annual Growth 12-17
-1.0%
Key External DriversFederal funding for defenseNon-NATO defense spendingLocal and state government investmentPer capita disposable incomeTrade-weighted index
Market ShareGeneral Dynamics Corp. 12.2%
Vista Outdoor Operations LLC 11.7%
American Outdoor Brands Corporation 6.6%
Remington Outdoor Company 6.5%
Olin Corp. 5.8%
p. 26
p. 5
FOR ADDITIONAL STATISTICS AND TIME SERIES SEE THE APPENDIX ON PAGE 38
Provided to: University of Nevada, Reno (2126926196) | 01 September 2017
WWW.IBISWORLD.COM Guns & Ammunition Manufacturing in the US June 2017 5
Key External Drivers Federal funding for defenseThe US government, especially the Department of Defense, is a major purchaser of industry products, particularly those of a higher caliber and complexity. As the expenditure allocated for these items increases, sales and revenue typically grow. Government funding for defense is influenced by fears of terrorism, defense expenditures of rival nations, outbreaks of conflict and other geopolitical factors. Federal
funding for defense is expected to increase in 2017.
Non-NATO defense spendingNon-NATO defense spending is the sum of global military spending, excluding the 29 members of the North Atlantic Treaty Organization. Therefore, this driver excludes spending by most Western states, focusing more on non-Western nations. When non-NATO spending increases, the market for industry exports
Executive Summary
The Guns and Ammunition Manufacturing industry has experienced inconsistent growth over the past five years. Industry operators design and manufacture small arms, bombs, ordnances, ammunition, artillery and related parts. Companies in this industry vary between small arms manufacturers to large multibillion-dollar defense contractors, with many companies serving both the civilian and military markets. During the period, often-diverging trends in these two markets drove industry performance. As a result,
over the five years to 2017, industry revenue is expected to decrease at an annualized rate of 1.0% to $13.3 billion, including a 6.8% decline in 2017.
Prior to the five-year period, the expanding US defense budget and combat operations in the Middle East greatly increased demand for military-related small arms, ammunition, bombs, artillery shells, ordnances and other munitions. However, as the United States began to wind down combat operations and Congress attempted to reduce the federal
budget deficit, spending on industry-related products fell. While the defense market lost demand, the civilian small arms and ammunition segment performed very well. Increasing consumer concerns about stricter gun control laws led many to purchase industry products in anticipation of a ban. As a result, despite defense cuts, industry revenue made strong gains. However, as fears of gun regulation subsided following President Trump’s electoral victory in November 2016, demand for industry products fell, negatively impacting industry revenue. In response to a weakening domestic military market, industry players have increasingly sought growth in exports, which have been rising due to geopolitical tensions and global instability.
Over the five years to 2022, industry revenue is forecast to grow at an annualized rate of 3.5% to $15.8 billion. The defense market is anticipated to remain at historically low levels, and the domestic side is also set to remain weaker than average due to allayed fears of national gun control legislation under the Trump administration. As a result, industry operators will increasingly turn to export markets to offset weaker domestic demand. Moreover, industry profit is projected to slightly increase due to increased consumer demand and defense contractor restructuring.
Industry PerformanceExecutive Summary | Key External Drivers | Current Performance Industry Outlook | Life Cycle Stage
Industry operators will increasingly turn to export markets to offset weaker domestic demand
Provided to: University of Nevada, Reno (2126926196) | 01 September 2017
WWW.IBISWORLD.COM Guns & Ammunition Manufacturing in the US June 2017 6
Industry Performance
Key External Driverscontinued
climbs. Non-NATO defense spending is expected to increase in 2017.
Local and state government investmentGrowth in spending by state and local government agencies generally coincides with increased funding of law enforcement. When law enforcement funding increases, gun and ammunition purchases also grow. Local and state government investment is expected to increase in 2017, representing a potential opportunity for the industry.
Per capita disposable incomeGuns and ammunition are typically discretionary purchases. When incomes rise, individuals can better afford
industry products. When incomes fall, demand for industry products often declines. Per capita disposable income is expected to increase in 2017.
Trade-weighted indexThe trade-weighted index (TWI) measures the strength of the US dollar relative to the currencies of its largest trading partners. Since exports account for a moderate share of industry revenue and imports account for a significant share of domestic demand, the TWI can significantly affect sales volumes. The trade-weighted index is expected to increase over 2017, representing a potential threat to the industry.
% c
hang
e
8
-8
-4
0
4
2210 12 14 16 18 20Year
Local and state government investment
SOURCE: WWW.IBISWORLD.COM
% c
hang
e
10
-10
-5
0
5
2210 12 14 16 18 20Year
Federal funding for defense
Provided to: University of Nevada, Reno (2126926196) | 01 September 2017

WWW.IBISWORLD.COM Guns & Ammunition Manufacturing in the US June 2017 7
Industry Performance
War and government expenditure
The wars in Iraq and Afghanistan ushered in substantial increases in military spending by the government, resulting in additional purchases of the industry’s products. The industry especially increased sales of its military-grade, high-caliber weapons systems and munitions, such as tank ammo and howitzers.
However, this initial boom has recently become a detriment. In 2011, the United States completed the withdrawal of its troops from Iraq and has more recently begun curtailing combat operations in Afghanistan. The withdrawal of US troops from the Middle East resulted in a sharp
decline in demand for industry products, as warfare requires extensive resupply of ammunition. The United States stationed 90,000 troops in Afghanistan in 2012, compared with 10,000 at the beginning of 2016. In addition, budget sequestration has led to cuts in military spending. IBISWorld expects federal funding for defense to fall from $644.3 billion in 2012 to $540.9 billion in 2017. The military’s decline in gun and ammunition purchases has played a significant role in slowing down industry revenue growth. However, most recently, US military spending on industry products has climbed as bombing
Current Performance
The Guns and Ammunition Manufacturing industry has experienced increased volatility over the past five years. The industry experienced aggressive revenue growth in the years after the recession as fears of more restrictive gun control laws overrode consumers’ financial constraints. However, as the US military began to withdraw from the Middle East and Congress sought to address deficit spending, federal funding for defense dropped, greatly tempering overall revenue growth. In addition, fears of greater gun control subsided in 2014 after a series of measures proposed by the Obama administration failed in the Senate, including a ban on assault weapons. The subsequent combination of falling military and consumer spending caused revenue to fall.
Consumer demand was rekindled following renewed emphasis on gun control in 2016, as well as security fears. The June 2016 mass shooting at a nightclub in Orlando, FL, combined with pollsters’ favored odds of Hillary Clinton winning the November election, stoked fears of impending legislation. On the military side, many manufacturers used growing foreign demand for US arms and
ammunition to partially offset a weakening defense market at home. Even domestic military demand recently picked up as US bombing operations against ISIS intensified.
The 2016 US presidential election may have exerted the greatest impact on the industry. Donald J. Trump’s victory over Hillary Clinton eased concerns over sweeping gun reform. Indeed, his win caused a 6.8% revenue decline in 2017 alone. Therefore, industry revenue is expected to decline at an annualized rate of 1.0% to $13.3 billion over the five years to 2017.
% c
hang
e
15
-15
-10
-5
0
5
10
2309 11 13 15 17 19 21Year
Industry revenue
SOURCE: WWW.IBISWORLD.COM
Provided to: University of Nevada, Reno (2126926196) | 01 September 2017
WWW.IBISWORLD.COM Guns & Ammunition Manufacturing in the US June 2017 8
Industry Performance
International trade Amid a weakening domestic military market, the industry’s defense contractors have increasingly sought growth in foreign markets. Fortunately for operators, growing geopolitical tensions and instability around the world have boosted military spending in many regions. Over the five years to 2017, non-NATO defense
spending, which excludes most Western military expenditure, is expected to climb an annualized 2.9% to $865.6 billion. Demand for munitions from US allies in the Middle East has surged in recent years as tensions with Iran climbed and conflict and instability proliferated. Tensions in Asia have also increased, creating further
Commercial demand Overall, private-sector demand has been the biggest driver of industry revenue growth, even picking up the slack caused by declining military spending. The past five years’ growth is mainly attributable to fears of potentially tougher gun control legislation. In 2012, with the presidential election looming, many consumers looking to purchase industry products wondered what another four years of the Obama administration might hold for gun laws, and whether purchasing a firearm in the future would prove more difficult. The situation was exacerbated by high-profile mass shootings, such as in Aurora, CO, and Sandy Hook Elementary School in Newtown, CT, both of which took place in 2012. In December 2012, the Obama administration announced its intention to reform gun laws to prevent similar tragedies from occurring.
As a result, consumers purchased firearms and ammunition at record rates, with industry revenue surging through 2013. In 2014, demand began to normalize as it became clear that more stringent gun control laws would not be passed on a
federal level. Therefore, industry revenue fell 10.6% that year. However, this dip was only temporary, as attacks such as the Charleston, SC church shooting and the San Bernardino, CA, terrorist attacks stoked consumer fears of regulation and the need for self-defense, all during a heated presidential campaign. Domestic demand for guns and ammunition surged in the second half of 2015, breaking previous records, with the FBI National Instant Criminal Background Check System (NICS) recording an all-time high for checks during the year. Moreover, in early 2016, President Barack Obama issued an executive order that expanded gun sales licensing and background check coverage, likely further heightening consumer anxiety over regulations. The new administration has rolled back Mr. Obama’s efforts.
operations against ISIS has created demand for bombs and ammunition.
Federal government and local law enforcement agencies’ budgets also grew over the past five years. As a result of the sustained risk of terrorism, the responsibilities of federal, state and local departments have expanded to include
terrorist attack prevention, thereby increasing budgets for guns and ammunition. Nevertheless, falling tax receipts caused by poor economic conditions have put pressure on law enforcement budgets, with local and state government investment growing at a tepid annualized rate of 0.6% over the five years to 2017.
War and government expenditure continued
Private-sector demand has been the biggest driver of industry revenue growth
Provided to: University of Nevada, Reno (2126926196) | 01 September 2017
WWW.IBISWORLD.COM Guns & Ammunition Manufacturing in the US June 2017 9
Industry Performance
Consolidation Declining demand from the military and the 2014 contraction is expected to cause industry profit to drop from 9.8% of revenue in 2012 to 7.8% in 2017. Overall market share concentration, defined as the top players’ share of industry revenue, has declined over the five years to 2017 due to declining revenue for the industry’s biggest defense suppliers. The military market has high barriers to entry, and its products tend to be more sophisticated and expensive. Therefore, this segment accounts for a large portion of industry revenue and is dominated by a few large companies, including General Dynamics Corporation and BAE Systems PLC. As a result, this segment skews overall industry concentration. When defense spending declined, the resulting loss in revenue among defense contractors caused overall industry concentration to also decline. The industry further fragmented when Alliant Techsystems spun off its commercial business, now called Vista Outdoor, and merged its defense business with Orbital Sciences, creating Orbital ATK.
However, in the consumer market, mergers and acquisitions have been more
prevalent. For example, private equity firm Cerberus Capital went on an acquisition spree for weapons manufacturers prior to gun and ammunition conglomerate Freedom Group’s attempted public offering. This trend toward consolidation indicates that major players within this segment are realizing the benefits of economies of scale and are attempting to gain a competitive advantage through acquisition and growth.
Over the five years to 2017, the number of industry establishments is expected to grow at an annualized rate of 6.0% to 690. However, as defense contractors and some consumer manufacturers restructured, the number of employees expanded at a slower rate and even declined in recent years. Therefore, industry employment is expected to grow at an annualized rate of only 4.0% to 45,308 workers during the five-year period.
Declining demand from the military is expected to cause industry profit to drop
demand for US-made guns and ammunition. As a result, industry exports are expected to grow at an annualized rate of 5.9% to $8.4 billion over the five years to 2017.
Unlike exports, industry imports are much more focused on the consumer
market. Once consumer demand for industry products declined in 2014, imports plunged. However, the recent pickup in demand has helped imports recover. Over the five years to 2017, imports are expected to increase at an annualized rate of 4.9% to $6.9 billion.
International trade continued
Provided to: University of Nevada, Reno (2126926196) | 01 September 2017
WWW.IBISWORLD.COM Guns & Ammunition Manufacturing in the US June 2017 10
Industry Performance
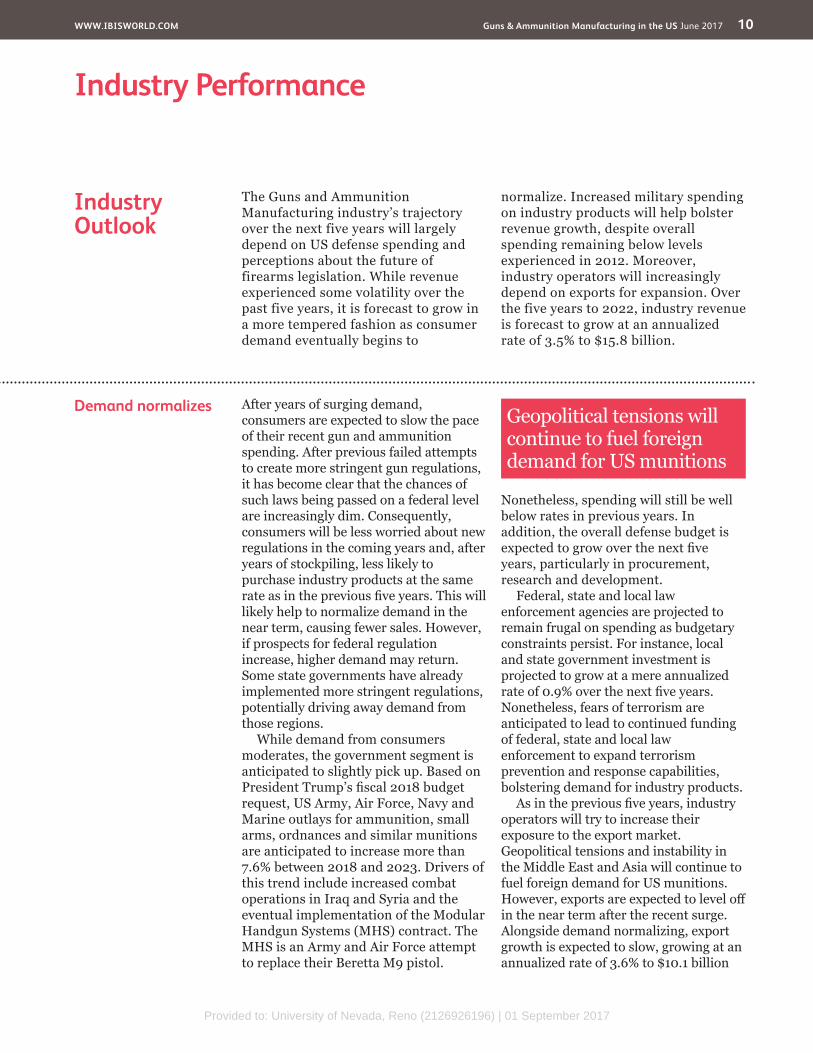
Demand normalizes After years of surging demand, consumers are expected to slow the pace of their recent gun and ammunition spending. After previous failed attempts to create more stringent gun regulations, it has become clear that the chances of such laws being passed on a federal level are increasingly dim. Consequently, consumers will be less worried about new regulations in the coming years and, after years of stockpiling, less likely to purchase industry products at the same rate as in the previous five years. This will likely help to normalize demand in the near term, causing fewer sales. However, if prospects for federal regulation increase, higher demand may return. Some state governments have already implemented more stringent regulations, potentially driving away demand from those regions.
While demand from consumers moderates, the government segment is anticipated to slightly pick up. Based on President Trump’s fiscal 2018 budget request, US Army, Air Force, Navy and Marine outlays for ammunition, small arms, ordnances and similar munitions are anticipated to increase more than 7.6% between 2018 and 2023. Drivers of this trend include increased combat operations in Iraq and Syria and the eventual implementation of the Modular Handgun Systems (MHS) contract. The MHS is an Army and Air Force attempt to replace their Beretta M9 pistol.
Nonetheless, spending will still be well below rates in previous years. In addition, the overall defense budget is expected to grow over the next five years, particularly in procurement, research and development.
Federal, state and local law enforcement agencies are projected to remain frugal on spending as budgetary constraints persist. For instance, local and state government investment is projected to grow at a mere annualized rate of 0.9% over the next five years. Nonetheless, fears of terrorism are anticipated to lead to continued funding of federal, state and local law enforcement to expand terrorism prevention and response capabilities, bolstering demand for industry products.
As in the previous five years, industry operators will try to increase their exposure to the export market. Geopolitical tensions and instability in the Middle East and Asia will continue to fuel foreign demand for US munitions. However, exports are expected to level off in the near term after the recent surge. Alongside demand normalizing, export growth is expected to slow, growing at an annualized rate of 3.6% to $10.1 billion
Industry Outlook
The Guns and Ammunition Manufacturing industry’s trajectory over the next five years will largely depend on US defense spending and perceptions about the future of firearms legislation. While revenue experienced some volatility over the past five years, it is forecast to grow in a more tempered fashion as consumer demand eventually begins to
normalize. Increased military spending on industry products will help bolster revenue growth, despite overall spending remaining below levels experienced in 2012. Moreover, industry operators will increasingly depend on exports for expansion. Over the five years to 2022, industry revenue is forecast to grow at an annualized rate of 3.5% to $15.8 billion.
Geopolitical tensions will continue to fuel foreign demand for US munitions
Provided to: University of Nevada, Reno (2126926196) | 01 September 2017
WWW.IBISWORLD.COM Guns & Ammunition Manufacturing in the US June 2017 11
Industry Performance
Other industry trends Over the next five years, profitability is projected to recover and stabilize as demand and revenue grow. Defense contractors and some commercial manufacturers will continue restructuring to improve profitability. Market share is also expected to shift in favor of the industry’s larger participants, mostly through acquisitions. These operators have sizable manufacturing facilities with lower production costs, enabling them to capture an increasing portion of the market at the expense of smaller players.
Over the next five years, the number of establishments is projected to grow an annualized 3.9% to total 836. Similarly, employment is forecast to climb an annualized 3.6% to 54,084 workers during the five-year period.
over the five years to 2022. Nonetheless, average export values over the next five years will be significantly higher compared with the past five years. Similarly, imports will also rise, with
their value projected to rise at an annualized rate of 3.3% to $8.1 billion during the five-year period. A stronger US dollar should make imports more price-competitive with US products.
Demand normalizes continued
Market share is expected to shift in favor of the industry’s larger participants
Provided to: University of Nevada, Reno (2126926196) | 01 September 2017
WWW.IBISWORLD.COM Guns & Ammunition Manufacturing in the US June 2017 12
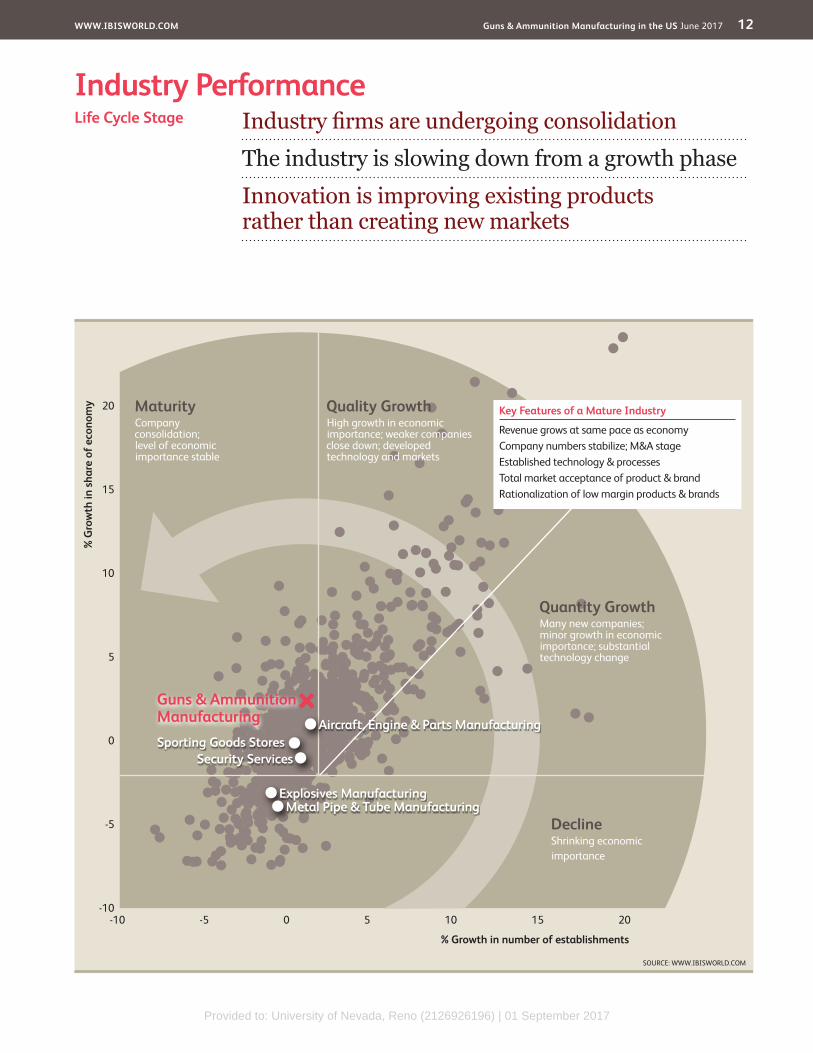
Industry PerformanceIndustry firms are undergoing consolidation
The industry is slowing down from a growth phase
Innovation is improving existing products rather than creating new markets
Life Cycle Stage
SOURCE: WWW.IBISWORLD.COM
20
15
10
5
0
-5
-10
% G
row
th in
sha
re o
f eco
nom
y
% Growth in number of establishments
-10 -5 0 5 10 15 20
DeclineShrinking economicimportance
Quality GrowthHigh growth in economic importance; weaker companies close down; developed technology and markets
MaturityCompany consolidation;level of economic importance stable
Quantity GrowthMany new companies; minor growth in economic importance; substantial technology change
Key Features of a Mature Industry
Revenue grows at same pace as economyCompany numbers stabilize; M&A stageEstablished technology & processesTotal market acceptance of product & brandRationalization of low margin products & brands
Explosives Manufacturing
Sporting Goods Stores
Metal Pipe & Tube Manufacturing
Aircraft, Engine & Parts Manufacturing
Security Services
Guns & Ammunition Manufacturing
Provided to: University of Nevada, Reno (2126926196) | 01 September 2017

WWW.IBISWORLD.COM Guns & Ammunition Manufacturing in the US June 2017 13
Industry Performance
Industry Life Cycle After years of growth, the industry has entered a mature stage of its life cycle. A resurgence of demand from the civilian sector, among other factors, supported industry revenue over the past few years. Exports and defense spending are expected to offset waning revenue gains on the commercial side of the industry. Over the 10 years to 2022, industry value added (IVA), which measures an industry’s contribution to the economy, is expected to grow an annualized1.8%, compared with 2.1% annualized GDP growth anticipated over the same period.
Over the past five years, significant players have engaged in a multitude of mergers and acquisitions, including Freedom Group’s recent acquisition spree and both Smith & Wesson’s and Sturm, Ruger & Company’s acquisitions of small companies to expand their product lines. Large players within this
industry have experienced the spike in demand and have been scrambling to expand their product lines to accommodate growing customer bases.
While the industry is constantly innovating existing products, its core products and major markets have essentially been established and its participants are mostly focused on winning market share from competing countries and companies. However, over the next five years, technological advancements are expected to begin changing how the industry operates. Smart guns, which use fingerprint or radio-frequency identification (RFID) technology to identify their owners, are anticipated to carve out market share from more conventional firearms manufacturers. Moreover, 3D printing technology could increase the speed and efficiency of industry production.
This industry is Mature
Provided to: University of Nevada, Reno (2126926196) | 01 September 2017
WWW.IBISWORLD.COM Guns & Ammunition Manufacturing in the US June 2017 14
Products & Services
The Guns and Ammunition manufacturing industry can be broken down into four distinct product segments: small arms, small arms ammunition, ammunition (excluding small arms), and other ordinance and accessories.
Small armsSmall arms manufacturers produce ammunition carts, gun barrels, machine gun belts, gun clips, gun cylinders,
firearms, gun magazines, machine guns, pistols, recoil mechanisms, revolvers, rifles, shotguns and submachine guns. Over the five years to 2017, revenue from this segment is expected to experience strong growth and comprise 47.6% of industry revenue. A large portion of this growth has been led by climbing demand from the civilian market due to anticipation of more stringent gun control laws and growing security
Products & MarketsSupply Chain | Products & Services | Demand Determinants Major Markets | International Trade | Business Locations
KEY BUYING INDUSTRIES
45111 Sporting Goods Stores in the US This industry sells hunting rifles, other firearms, and ammunition.
56161 Security Services in the US The industry purchases firearms and ammunition.
KEY SELLING INDUSTRIES
32592 Explosives Manufacturing in the US Smokeless powder is utilized in the manufacture of small arms ammunition.
33121 Metal Pipe & Tube Manufacturing in the US Iron and steel pipes and tubes are used in the manufacture of gun barrels.
33142 Copper Rolling, Drawing & Extruding in the US Copper and copper-base alloy shapes and forms (except castings, forgings, and fabricated metal products) are used in the manufacturing of small arms ammunition.
33152 Nonferrous Metal Foundry Products Manufacturing in the US Small arms ammunition manufacturers use in their manufacturing processes aluminum and aluminum-base alloy castings (rough and semifinished).
Supply Chain
Products and services segmentation (2017)
Total $13.3bn
47.6%Small arms & machine guns
30.0%Small arms ammunition
12.9%Other ammunition
9.5%Ordnance & accessories
SOURCE: WWW.IBISWORLD.COM
Provided to: University of Nevada, Reno (2126926196) | 01 September 2017

WWW.IBISWORLD.COM Guns & Ammunition Manufacturing in the US June 2017 15
Products & Markets
Demand Determinants
Economic conditionsFor most people, guns and ammunition are expensive discretionary goods. As a result, demand for industry products depends on factors such as disposable income, the unemployment rate and consumer confidence. When unemployment is low and consumers’ income and confidence are high, individuals are more willing to purchase industry products. However, many other factors influence gun purchases, some of which override economic conditions.
RegulationRegulations can have a substantial impact on demand for guns and ammunition. Certain states restrict the types of small arms and ammunition that consumers can purchase, thus limiting
consumption of industry goods. Strict licensing requirements can also reduce the industry’s customer base, as fewer people can make gun purchases. On the other hand, loose firearm regulations in other states increase not only the customer base but also the range of products manufacturers offer.
Public perception of gun laws, politics, security and crimeOver the past few years, a major driver of gun and ammunition consumption has been the public perception of gun regulations. Recent shootings have brought the idea of stricter gun regulations to the national forefront. As a result, many consumers began to fear that they only have a limited amount of time to purchase small arms and ammunition and have
Products & Servicescontinued
concerns. Falling orders from the military market has tampered this growth. However, the recent pick-up in US combat involvement in the Middle East and rising foreign military demand has recently bolstered the defense segment.
AmmunitionThe sale of ammunition is almost as large as the sale of arms. Small arms ammunition (ammo 30mm or less) includes handgun, shotgun, rifle, machine gun and even 30mm autocannon ammunition. It also includes blank cartridges, bullet jackets and percussion caps. Over the past five years, small arms ammunition’s share of industry revenue has reached 30.0%. Because ammo sales generally follow arms sales, their share of revenue changes little. Just like small arms, sales of ammunition to civilians has surged over the past five years, while military grade ammunition declined.
The sale of other ammunition accounts for about 12.9% of industry revenue. This
product category mostly consists of military grade ammunition that is greater than 30mm, including bombs, mortar, tank and artillery shells, fuses, missile warheads, mines, torpedoes and related components. Due to reduced defense spending, other ammunitions’ share of revenue has declined over the past five years (from 15.1% in 2011, closest data available). However, the recent pick-up in US bombing in Iraq and Syria has increased demand for bomb and similar items.
Ordnance and accessoriesOrdnance manufacturing involves more explosive weaponry and includes aircraft and antiaircraft artillery, antitank rocket, cannons, field artillery, gun turrets, howitzers, mortars, naval artillery, rocket projectors, tampions, line-throwing guns, tank artillery, torpedo tubes, flamethrowers and gun turrets. This segment’s products are almost exclusively bought by the military and has thus dropped in value as defense spending fell. It represents 9.5% of industry revenue in 2017.
Provided to: University of Nevada, Reno (2126926196) | 01 September 2017
WWW.IBISWORLD.COM Guns & Ammunition Manufacturing in the US June 2017 16
Products & Markets
Major Markets
Civilian and law enforcementCivilians constitute the largest market for gun and ammunition purchases and take place through gun stores, individual
sellers, sporting goods stores and some large retail stores like Walmart. This market segment has experienced surprisingly strong growth over the past
Demand Determinantscontinued
therefore gone on a buying spree. Others view the purchases as a form of political protest against advocates of gun control, citing and exercising their constitutional right to bear arms. An increase in terrorism-related shootings and the politicization of gun rights issues during the current presidential campaign has further boosted demand for guns and ammunition. The crime rate can also impact demand. When people feel or see that crime has increased, they may wish to purchase guns for protection. Even without an actual rise in crime rates, gun purchases can increase when individuals perceive or anticipate an increase in crime.
Defense fundingThe military is a major purchaser of industry goods and is almost the exclusive buyer of the industry’s more sophisticated and heavier munitions. Examples of such weapons include naval artillery, howitzers, tank munitions, bombs and warheads. When defense
spending and combat operations increase, industry sales rise. However, with the United States winding down operations in the Middle East and military spending declining due to budgetary issues, industry sales of related products have severely declined. However, the recent uptick in US bombing operations against ISIS has started to reverse this trend.
International tradeThe level of industry imports also affects demand for domestically produced industry products as they can serve a substitute for domestic ones. Export markets are also an important source of industry demand. The industry is a net exporter and American gun and ammunition are popular in many international markets. Export sales are particularly important for military suppliers. Recent defense cuts in the United States have encouraged contractors to look for clients in overseas markets like Asia and the Middle East.
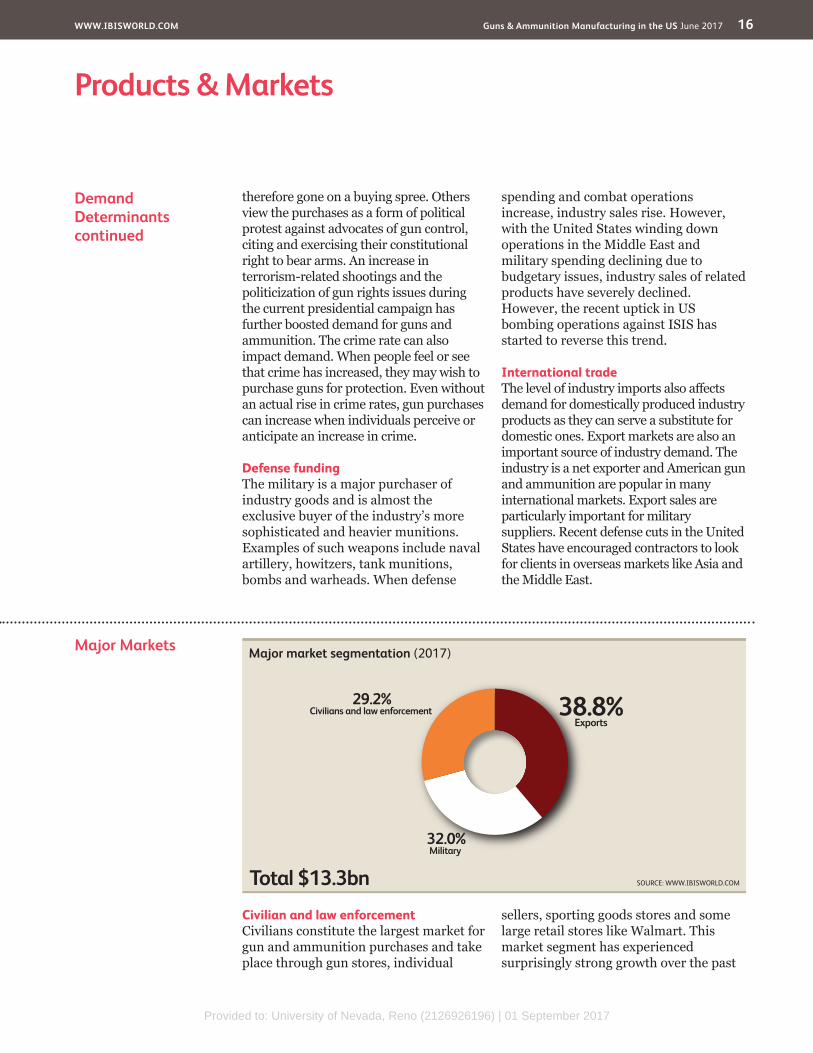
Major market segmentation (2017)
Total $13.3bn
38.8%Exports
32.0%Military
29.2%Civilians and law enforcement
SOURCE: WWW.IBISWORLD.COM
Provided to: University of Nevada, Reno (2126926196) | 01 September 2017
WWW.IBISWORLD.COM Guns & Ammunition Manufacturing in the US June 2017 17
Products & Markets
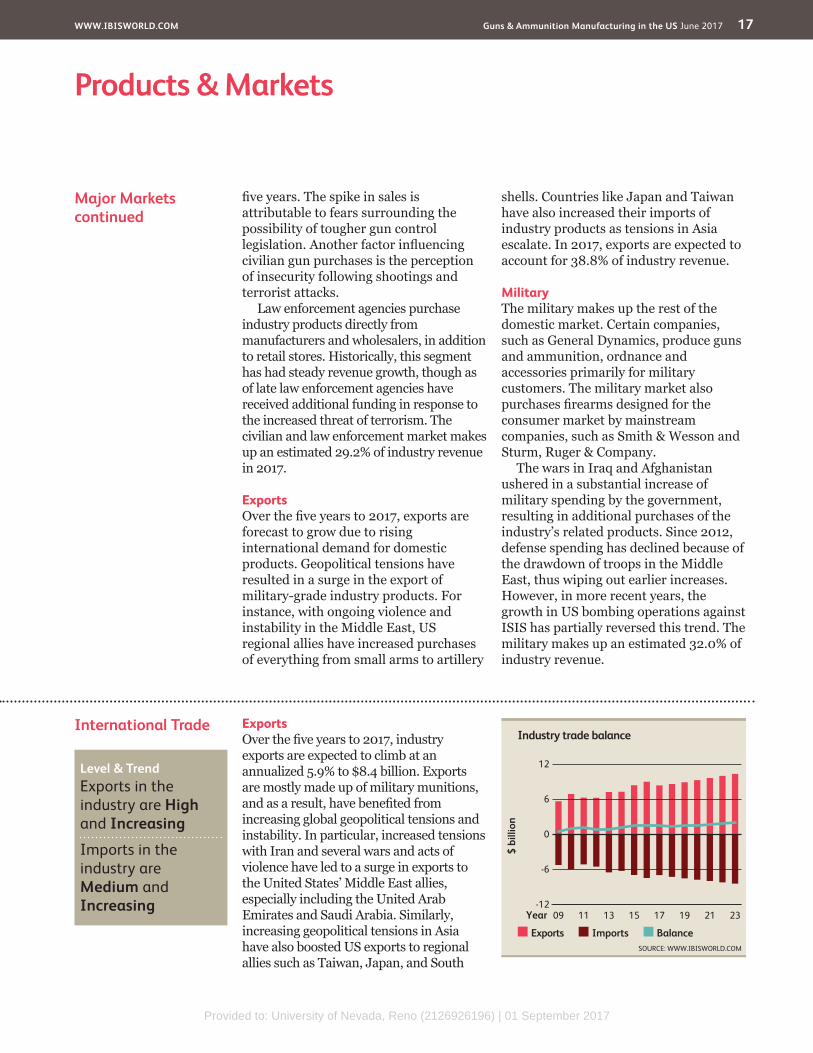
International Trade ExportsOver the five years to 2017, industry exports are expected to climb at an annualized 5.9% to $8.4 billion. Exports are mostly made up of military munitions, and as a result, have benefited from increasing global geopolitical tensions and instability. In particular, increased tensions with Iran and several wars and acts of violence have led to a surge in exports to the United States’ Middle East allies, especially including the United Arab Emirates and Saudi Arabia. Similarly, increasing geopolitical tensions in Asia have also boosted US exports to regional allies such as Taiwan, Japan, and South
Major Marketscontinued
five years. The spike in sales is attributable to fears surrounding the possibility of tougher gun control legislation. Another factor influencing civilian gun purchases is the perception of insecurity following shootings and terrorist attacks.
Law enforcement agencies purchase industry products directly from manufacturers and wholesalers, in addition to retail stores. Historically, this segment has had steady revenue growth, though as of late law enforcement agencies have received additional funding in response to the increased threat of terrorism. The civilian and law enforcement market makes up an estimated 29.2% of industry revenue in 2017.
ExportsOver the five years to 2017, exports are forecast to grow due to rising international demand for domestic products. Geopolitical tensions have resulted in a surge in the export of military-grade industry products. For instance, with ongoing violence and instability in the Middle East, US regional allies have increased purchases of everything from small arms to artillery
shells. Countries like Japan and Taiwan have also increased their imports of industry products as tensions in Asia escalate. In 2017, exports are expected to account for 38.8% of industry revenue.
MilitaryThe military makes up the rest of the domestic market. Certain companies, such as General Dynamics, produce guns and ammunition, ordnance and accessories primarily for military customers. The military market also purchases firearms designed for the consumer market by mainstream companies, such as Smith & Wesson and Sturm, Ruger & Company.
The wars in Iraq and Afghanistan ushered in a substantial increase of military spending by the government, resulting in additional purchases of the industry’s related products. Since 2012, defense spending has declined because of the drawdown of troops in the Middle East, thus wiping out earlier increases. However, in more recent years, the growth in US bombing operations against ISIS has partially reversed this trend. The military makes up an estimated 32.0% of industry revenue.
Level & Trend Exports in the industry are High and Increasing
Imports in the industry are Medium and Increasing
$ bi
llion
12
-12
-6
0
6
2309 11 13 15 17 19 21Year
Exports Imports Balance
Industry trade balance
SOURCE: WWW.IBISWORLD.COM
Provided to: University of Nevada, Reno (2126926196) | 01 September 2017

WWW.IBISWORLD.COM Guns & Ammunition Manufacturing in the US June 2017 18
Products & Markets
International Tradecontinued
Korea. These countries have close defense relationships with the United States and are dealing with an increasingly powerful China. Canada accounts for a sizable share of exports due to the country’s proximity to the United States, membership in the North American Free Trade Agreement and US defense ties. The surge in industry exports has helped domestic defense contractors partially offset a weak domestic military market, with exports’ share of industry revenue expected to rise from a low of 45.1% in 2012 to 63.3% in 2017.
ImportsUnlike exports, industry imports primarily consist of small arms and ammunition tailored to the consumer and law
enforcement segments. Initially, as demand for civilian industry products surged, many customers have turned to imports to satisfy their needs. In the five years to 2017, imports are expected to climb at an annualized 4.9% to $6.9 billion. But imports’ share of domestic demand has fallen in the last two years to 51.8% in 2017, due to normalization of demand in 2014 and a stronger dollar. European manufacturers such as Italy, Austria, the United Kingdom and Germany dominate the import markets, and all four have close defense ties with the United States. Germany, Austria and Italy are also famous for small arms manufactures such as Heckler & Koch (Germany), Glock (Austria) and Beretta (Italy).
Imports From...
Total $6.9bn
6.1%United
Kingdom
7.5%Germany9.1%
Italy
12.5%Austria
64.8%All others
Exports To...
Total $8.4bn
61.5%All others
17.1%United Arab
Emirates
7.3%Saudi Arabi
7.1%South Korea
7.0%Canada
Year: 2017SIZE OF CHARTS DOES NOT REPRESENT ACTUAL DATA SOURCE: USITC
Provided to: University of Nevada, Reno (2126926196) | 01 September 2017

WWW.IBISWORLD.COM Guns & Ammunition Manufacturing in the US June 2017 19
Products & Markets
Business Locations 2017
MO1.4
West
West
West
Rocky Mountains Plains
Southwest
Southeast
New England
Great Lakes
VT0.2
MA0.7
RI0.1
NJ0.3
DE0.0
NH0.3
CT22.5
MD0.1
DC0.0
1
5
3
7
2
6
4
8 9
Additional States (as marked on map)
AZ2.3
CA2.0
NV0.6
OR1.4
WA1.5
MT1.9
NE0.5
MN0.6
IA0.8
OH2.2 VA
0.5
FL3.0
KS0.6
CO1.1
UT1.2
ID0.8
TX3.9
OK0.2
NC1.3
AK31.3
WY0.4
TN1.6
KY0.7
GA1.6
IL1.4
ME0.4
ND0.1
WI1.8 MI
1.0 PA2.3
WV0.3
SD0.6
NM0.1
AR1.1
MS0.5
AL0.7
SC0.3
LA0.1
HI0.1
IN0.9
NY1.1 5
67
8
321
4
9
SOURCE: WWW.IBISWORLD.COM
Mid- Atlantic
Establishments (%)
Less than 3% 3% to less than 10% 10% to less than 20% 20% or more
Provided to: University of Nevada, Reno (2126926196) | 01 September 2017
WWW.IBISWORLD.COM Guns & Ammunition Manufacturing in the US June 2017 20
Products & Markets
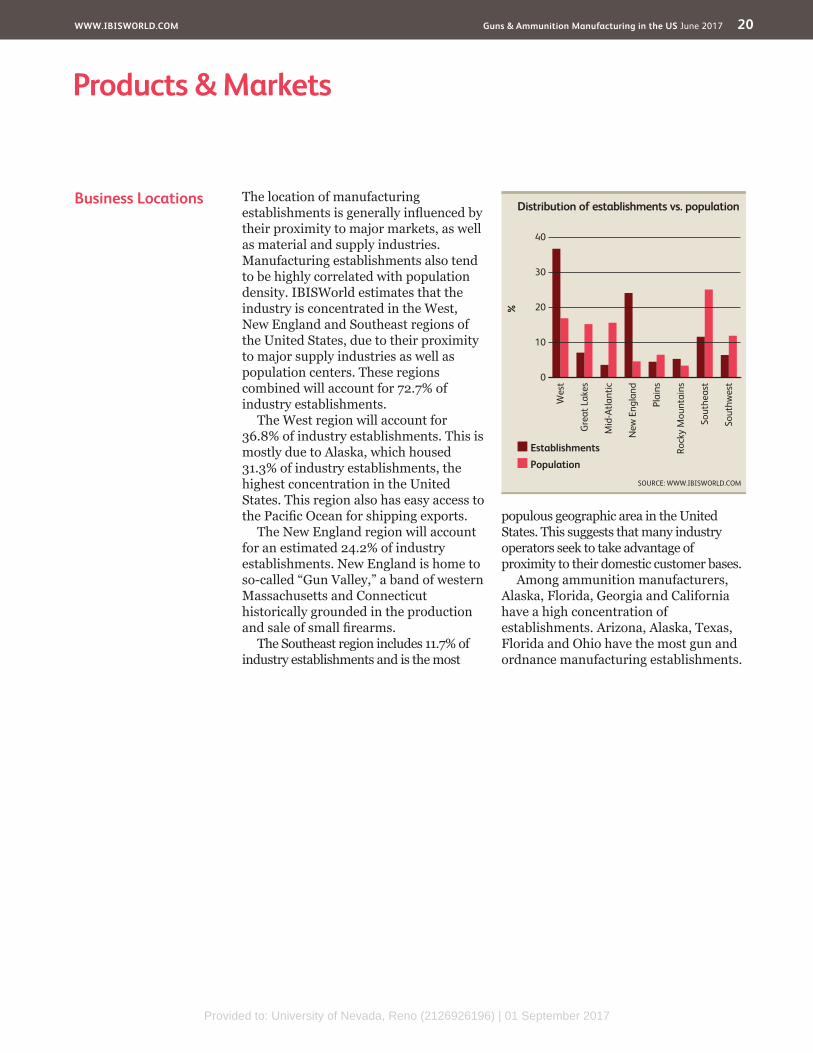
Business Locations The location of manufacturing establishments is generally influenced by their proximity to major markets, as well as material and supply industries. Manufacturing establishments also tend to be highly correlated with population density. IBISWorld estimates that the industry is concentrated in the West, New England and Southeast regions of the United States, due to their proximity to major supply industries as well as population centers. These regions combined will account for 72.7% of industry establishments.
The West region will account for 36.8% of industry establishments. This is mostly due to Alaska, which housed 31.3% of industry establishments, the highest concentration in the United States. This region also has easy access to the Pacific Ocean for shipping exports.
The New England region will account for an estimated 24.2% of industry establishments. New England is home to so-called “Gun Valley,” a band of western Massachusetts and Connecticut historically grounded in the production and sale of small firearms.
The Southeast region includes 11.7% of industry establishments and is the most
populous geographic area in the United States. This suggests that many industry operators seek to take advantage of proximity to their domestic customer bases.
Among ammunition manufacturers, Alaska, Florida, Georgia and California have a high concentration of establishments. Arizona, Alaska, Texas, Florida and Ohio have the most gun and ordnance manufacturing establishments.
%
40
0
10
20
30
Sout
hwes
t
Wes
t
Gre
at L
akes
Mid
-Atla
ntic
New
Eng
land
Plai
ns
Rock
y M
ount
ains
Sout
heas
t
EstablishmentsPopulation
Distribution of establishments vs. population
SOURCE: WWW.IBISWORLD.COM
Provided to: University of Nevada, Reno (2126926196) | 01 September 2017
WWW.IBISWORLD.COM Guns & Ammunition Manufacturing in the US June 2017 21
Cost Structure Benchmarks
The Guns and Ammunition Manufacturing industry has been making the gradual shift toward higher levels of capital investment in manufacturing automation with the goal of creating more efficient and profitable enterprises.
ProfitIndustry profit is based on earnings before interest and taxes recorded by industry operators. Profit will vary between players depending on the size of the manufacturing facility that they
Key Success Factors Having a loyal customer baseThere is a distinct competitive advantage in cultivating and maintaining strong long-term customer relationship.
Access to high quality inputsCompanies within this industry group must be able to source a variety of raw materials, both from within the United States and overseas.
Effective quality controlIn providing high-quality products and services, operators must maintain detailed and extensive quality assurance programs.
Having a good technical knowledge of the productHaving a good technical knowledge of the product is a key success factor within this industry group because companies must provide strong engineering, design and technical support to clients.
Establishment of brand namesStrong brand recognition is considered to be a major basis of competition.
Control of distribution arrangementsThe cultivation, maintenance and control of downstream distribution channels are a distinct advantage.
Market Share Concentration
The Guns and Ammunition Manufacturing industry consists of many small to medium operators. The wide variety of products produced in this industry and the diverse buying markets make it difficult for individual companies to grab a large portion of industry’s entire market share. Overall industry market concentration is low and lost some ground over the last five years before rebounding a bit in 2017. The top four players account for an estimated 37.0% of industry revenue. However, this drop has been primarily led by the huge exposure the top players have to defense spending.
Due to the high barriers to entry and sophistication of the military market, concentration in the defense segment of the industry is very high and is dominated by General Dynamics and
Orbital ATK. Because the military is such a big buyer of guns and ammunition and the increased prices of more complex weapon systems, this segment also represents a large portion of overall industry revenue. Defense bias also explains why concentration decreased when falling military spending caused defense contractors to lose money. Moreover, the 2015 breakup of ATK’s industry-specific operations between Orbital ATK and Vista Outdoor fragmented the industry further.
For most of the past five years, concentration in the civilian market has been increasing. Within this period, major players such as the Freedom Group have undergone acquisition sprees. Smith & Wesson and Sturm, Ruger & Company have also acquired small gun manufacturers to expand their product lines.
Competitive LandscapeMarket Share Concentration | Key Success Factors | Cost Structure Benchmarks Basis of Competition | Barriers to Entry | Industry Globalization
Level Concentration in this industry is Low
IBISWorld identifies 250 Key Success Factors for a business. The most important for this industry are:
Provided to: University of Nevada, Reno (2126926196) | 01 September 2017

WWW.IBISWORLD.COM Guns & Ammunition Manufacturing in the US June 2017 22
Competitive Landscape
Cost Structure Benchmarkscontinued
operate, with larger operators generally benefiting from economies of scale. IBISWorld estimates that in 2017, the industry will obtain profit equivalent to 7.8% of an average operator’s revenue. Overall, industry profitability has declined as reduced defense spending has squeezed the profit of large defense contractors. Moreover, the recent reversal of the boom in civilian gun and ammunition sales further pressure profitability. Nonetheless, profitability has increased since 2014, amid a resurgence in civilian and eventually military sales.
PurchasesOne of the largest expenses of the average industry player’s cost structure consists of purchases. These principally consist of the cost of raw materials that are used during the manufacturing process. Commonly used production
inputs include metals such as steel, copper tubing, aluminum and iron castings. Fluctuations in the prices of these materials affect operators’ revenue and profitability.
In many cases, companies can pass a significant portion of raw material price increases on to customers in the form of product price increases or surcharges. Most industry operators enter into fixed-price contracts, so short-term fluctuations in raw material prices have little impact on profitability. However, the persistent higher raw material prices experienced during the past five years have placed increasing upward pressure on the cost structure of industry participants.
Across product segments, manufacturing costs associated with raw material expenditure fluctuate due to the differences in the size and density of the product being manufactured. The
Sector vs. Industry Costs
n Profi tn Wagesn Purchasesn Depreciationn Marketingn Rent & Utilitiesn Other
Average Costs of all Industries in sector (2017)
Industry Costs (2017)
0
20
40
60
Perc
enta
ge o
f rev
enue
80
100
SOURCE: WWW.IBISWORLD.COM
7.6 7.8
23.1
5.4 1.03.1
38.8
20.8
19.9
2.3 0.52.5
54.4
12.3
Provided to: University of Nevada, Reno (2126926196) | 01 September 2017

WWW.IBISWORLD.COM Guns & Ammunition Manufacturing in the US June 2017 23
Competitive Landscape
Basis of Competition InternalAn assortment of competitive factors encourage competition within the Guns and Ammunition Manufacturing industry. Factors like medium barriers to entry increase the threat of competition from firms outside the industry, while low levels of product differentiation encourage direct competition among industry players on the basis of price.
While players in this industry compete primarily based on product pricing, other factors such as product innovation and branding are also important for some product segments. Price competition is particularly evident in product segments where the pace of product development has virtually ground to a halt. This is the case for the majority of industry products. However, price competition
occurs while maintaining a standard level of product quality.
There are also other competitive differentiation strategies used within the industry. These include service quality, brand recognition, effective and timely distribution and technical support. The introduction of new and improved product designs and the acquisition of product lines at different price points is a key to maintaining and increasing product and market share. Products manufactured and developed in the industry also have a high research and development (R&D) component. As a result, technical excellence rather than price can be more important to remaining competitive within certain segments. In technologically advanced segments (i.e. specialized military munitions), R&D is particularly important in developing new
Cost Structure Benchmarkscontinued
complexity, quality and quantity of raw materials used are also factors influencing cost. Shortages and changes in the price of raw materials are common (availability and cost are influenced by, among other factors, political stability in exporting nations). In 2017, purchases are estimated to account for 38.8% of an average operator’s revenue.
WagesThe industry has a high level of capital intensity compared to other industries. Despite this, labor costs are high relative to other manufacturing industries because of the level of skill required to manufacture certain products, especially military grade equipment. IBISWorld estimates that in 2017, wage costs incurred by the industry will account for 20.8% of an average company’s revenue. They comprised 18.5% in 2012, suggesting little change in demand for highly skilled workers.
Depreciation, rent and utilitiesThe cost of depreciation will invariably fluctuate between operators depending on their size and the amount of capital expenses involved. The cost of new plant and equipment used to manufacture industry products is significant and periodic product innovation necessitates regular investment in new capital. In 2017, depreciation is estimated to account for 2.1% of an average operator’s revenue. Companies may reduce facility depreciation by leasing or renting the factories, with rent and utilities accounting for an estimated 5.4% of industry revenue.
OtherOther expenditures include communications, legal, accounting fees. Advertising expenses make up 0.9% of revenue. In 2017, all other expenses are expected to equal about 24.1% of Guns and Ammunition Manufacturing industry revenue.
Level & Trend Competition in this industry is Medium and the trend is Increasing
Provided to: University of Nevada, Reno (2126926196) | 01 September 2017
WWW.IBISWORLD.COM Guns & Ammunition Manufacturing in the US June 2017 24
Competitive Landscape
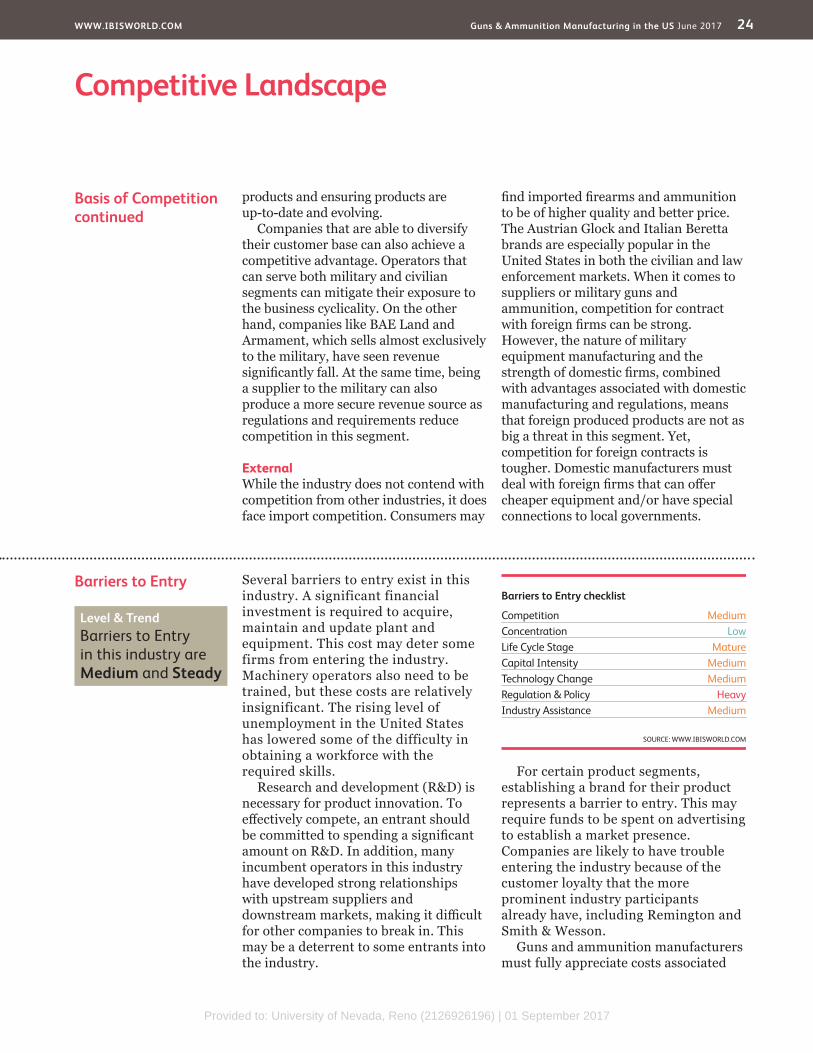
Barriers to Entry Several barriers to entry exist in this industry. A significant financial investment is required to acquire, maintain and update plant and equipment. This cost may deter some firms from entering the industry. Machinery operators also need to be trained, but these costs are relatively insignificant. The rising level of unemployment in the United States has lowered some of the difficulty in obtaining a workforce with the required skills.
Research and development (R&D) is necessary for product innovation. To effectively compete, an entrant should be committed to spending a significant amount on R&D. In addition, many incumbent operators in this industry have developed strong relationships with upstream suppliers and downstream markets, making it difficult for other companies to break in. This may be a deterrent to some entrants into the industry.
For certain product segments, establishing a brand for their product represents a barrier to entry. This may require funds to be spent on advertising to establish a market presence. Companies are likely to have trouble entering the industry because of the customer loyalty that the more prominent industry participants already have, including Remington and Smith & Wesson.
Guns and ammunition manufacturers must fully appreciate costs associated
Basis of Competitioncontinued
products and ensuring products are up-to-date and evolving.
Companies that are able to diversify their customer base can also achieve a competitive advantage. Operators that can serve both military and civilian segments can mitigate their exposure to the business cyclicality. On the other hand, companies like BAE Land and Armament, which sells almost exclusively to the military, have seen revenue significantly fall. At the same time, being a supplier to the military can also produce a more secure revenue source as regulations and requirements reduce competition in this segment.
ExternalWhile the industry does not contend with competition from other industries, it does face import competition. Consumers may
find imported firearms and ammunition to be of higher quality and better price. The Austrian Glock and Italian Beretta brands are especially popular in the United States in both the civilian and law enforcement markets. When it comes to suppliers or military guns and ammunition, competition for contract with foreign firms can be strong. However, the nature of military equipment manufacturing and the strength of domestic firms, combined with advantages associated with domestic manufacturing and regulations, means that foreign produced products are not as big a threat in this segment. Yet, competition for foreign contracts is tougher. Domestic manufacturers must deal with foreign firms that can offer cheaper equipment and/or have special connections to local governments.
Level & Trend Barriers to Entry in this industry are Medium and Steady
Barriers to Entry checklist
Competition MediumConcentration LowLife Cycle Stage MatureCapital Intensity MediumTechnology Change MediumRegulation & Policy HeavyIndustry Assistance Medium
SOURCE: WWW.IBISWORLD.COM
Provided to: University of Nevada, Reno (2126926196) | 01 September 2017
WWW.IBISWORLD.COM Guns & Ammunition Manufacturing in the US June 2017 25
Competitive Landscape
Industry Globalization
Globalization is on the rise within the Guns and Ammunition Manufacturing industry. Although the level of foreign ownership in domestic firms is low, some US-based industry operators have begun investing in and purchasing foreign weapons and ammunition manufacturers.
Over the five years to 2017, exports are expected grow at an annualized 5.9% due to rising international
demand for domestically manufactured products. In particular, the recent surge in instability in the Middle East and the general rise in geopolitical tensions around the world have driven demand for US-made munitions and weapon systems. In turn, this surge in foreign demand has helped US defense contractors partially offset declining sales at home.
Barriers to Entrycontinued
with specialized labor and machinery and high levels of research and development. In addition, the hazardous nature of the products (small arms, ordnance, and ammunition) increases operators’ costs, as they must adhere to additional regulations. To the extent that these regulatory costs increase industry participation costs, they pose a barrier to entry.
The barriers to entry for military suppliers are significantly higher than for companies just selling to civilians. Regulations are in place that dictate not
only the quality of products but also the production process and labor relations. Contractors must have enough capacity to be able to fulfill orders that can range from small acquisitions to massive purchases. Military grade products like tank munitions and howitzers also tend to be more sophisticated and require additional investment in facilities and skilled labor. Companies dealing with highly advanced equipment might also have to obtain security clearance and deal with restrictions on the use of technology, even if they developed it.
SOURCE: WWW.IBISWORLD.COM
Trade Globalization Going Global: Guns & Ammunition Manufacturing 2002-2017
Expo
rts/
Reve
nue
Expo
rts/
Reve
nue
200
150
100
50
0
200
150
100
50
0
Imports/Domestic Demand Imports/Domestic Demand0 040 4080 80120 120160 160
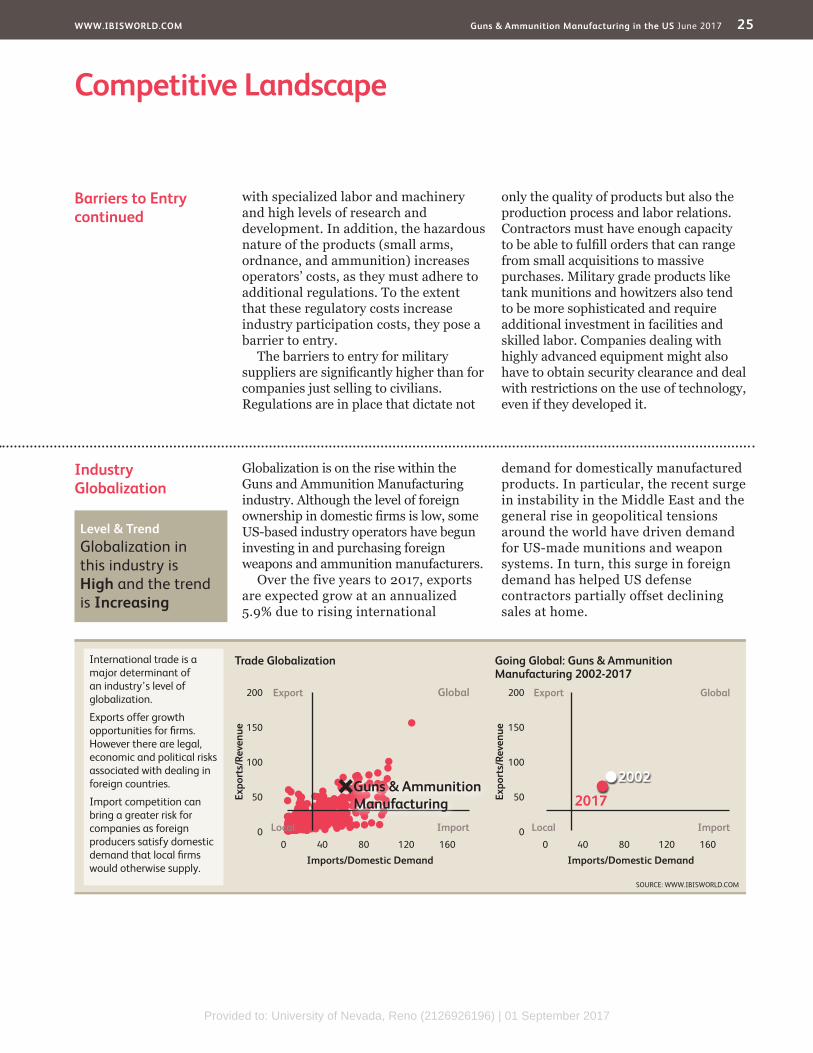
International trade is a major determinant of an industry’s level of globalization.
Exports offer growth opportunities for fi rms. However there are legal, economic and political risks associated with dealing in foreign countries.
Import competition can bring a greater risk for companies as foreign producers satisfy domestic demand that local fi rms would otherwise supply.
Export ExportGlobal Global
ImportLocal ImportLocal
Guns & Ammunition Manufacturing
2002
2017
Level & Trend Globalization in this industry is High and the trend is Increasing
Provided to: University of Nevada, Reno (2126926196) | 01 September 2017
WWW.IBISWORLD.COM Guns & Ammunition Manufacturing in the US June 2017 26
Player Performance General Dynamics Combat Systems (GDCS) is a business group of Falls Church, Virginia-based General Dynamics, one of the world’s biggest aerospace and defense firms. GDSC produces a wide variety of land combat systems ranging from main battle tanks and wheeled combat vehicles to rockets and munitions. The group’s sales are almost exclusively made to armed forces, with the US military being the largest procurer. Other customers include US allies in Europe, Asia and the Middle East. In 2015, GDCS generated $5.6 billion, accounting for almost 20.0% of General Dynamics’ total revenue.
GDCS competes in the Guns and Ammunition Manufacturing industry through its ordnance and tactical systems division. This division produces small, medium and large caliber munitions (including tank
ammunition), machine guns, mortar weapons, artillery projectiles, propellants, rockets and gun systems.
In recent years, General Dynamics has been spending billions of dollars on acquisitions to enhance capabilities, eliminate middlemen and diversify operations to mitigate lost revenue from defense spending cuts. In 2012, the company purchased the defense operations of Gayston Corporation, a privately held company that produces metal components for munitions.
Financial performanceOver the five years to 2017, GDCS’s industry-specific revenue is expected to decline an annualized 3.6% to $1.6 billion. The company’s revenue fell steadily from 2012 to 2015, hurting profit margins and prompting corporate restructuring. Like many other defense
Major CompaniesGeneral Dynamics Corp. | Vista Outdoor Operations LLC | American Outdoor Brands Corporation Remington Outdoor Company | Olin Corp. | Orbital ATK Inc. | Other Companies
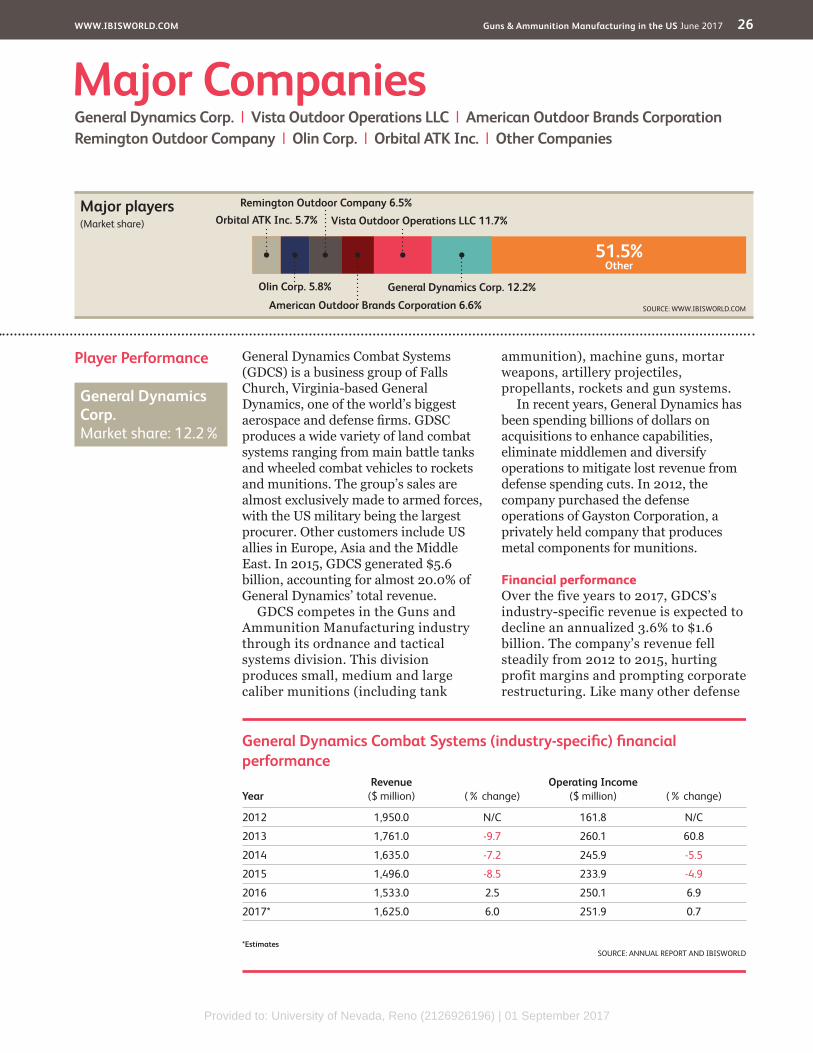
51.5%Other
General Dynamics Corp. 12.2%
Vista Outdoor Operations LLC 11.7%
American Outdoor Brands Corporation 6.6%
Remington Outdoor Company 6.5%
Olin Corp. 5.8%
Orbital ATK Inc. 5.7%
SOURCE: WWW.IBISWORLD.COM
Major players(Market share)
General Dynamics Combat Systems (industry-specifi c) fi nancial performance
YearRevenue
($ million) (% change)Operating Income
($ million) (% change)
2012 1,950.0 N/C 161.8 N/C
2013 1,761.0 -9.7 260.1 60.8
2014 1,635.0 -7.2 245.9 -5.5
2015 1,496.0 -8.5 233.9 -4.9
2016 1,533.0 2.5 250.1 6.9
2017* 1,625.0 6.0 251.9 0.7
*Estimates SOURCE: ANNUAL REPORT AND IBISWORLD
General Dynamics Corp. Market share: 12.2%
Provided to: University of Nevada, Reno (2126926196) | 01 September 2017
WWW.IBISWORLD.COM Guns & Ammunition Manufacturing in the US June 2017 27
Major Companies
Player Performance Formerly the sporting division of Alliant Techsystems (ATK), Vista Outdoor was spun off from ATK when the company merged with Orbital Sciences in early 2015 to form Orbital ATK. The Farmington, Utah-based company is one of the nation’s largest manufacturers of ammunition, accessories, rifles and shotguns for the civilian and law enforcement markets. It operates in the industry through its shooting sports and outdoor products groups. The Shooting Sports business segment accounts for the majority of revenue and manufactures guns and ammunition. Its brands include Savage Arms, Federal Premium and Speer. The Outdoor Products group makes accessories ranging from rifle scopes to camera traps; however, these products are not relevant to the industry.
Over the past five years, the company has acquired several competitors, including Caliber Company in June 2013.
Financial performanceOver the five years to fiscal year 2018, Vista Outdoors’ industry-specific revenue is expected to increase an annualized 11.5% to $1.6 billion. Booming civilian sales and acquisitions of consumer-oriented companies have been the primary drivers of growth in both company revenue and profit. In particular, the purchase of the Caliber Company in 2013 significantly boosted revenue. However, industry revenue declined in 2014 as concerns over stricter gun laws abated, causing consumer demand to fall. Nonetheless, the recent uptick in demand has reversed that trend.
Player Performancecontinued
contractors, the company has suffered from reduced demand from the US military as a result of budget cuts and the winding down of US combat operations in the Middle East. In 2012 alone, profit shrank an estimated 48.0% as the company had to backlog
contracts and deal with reduced procurement volumes in weapon systems, such as the Hydra-70 rocket and MK47 grenade launcher. However, in 2017, industry-specific revenue is estimated to increase as US military and international demand picks up.
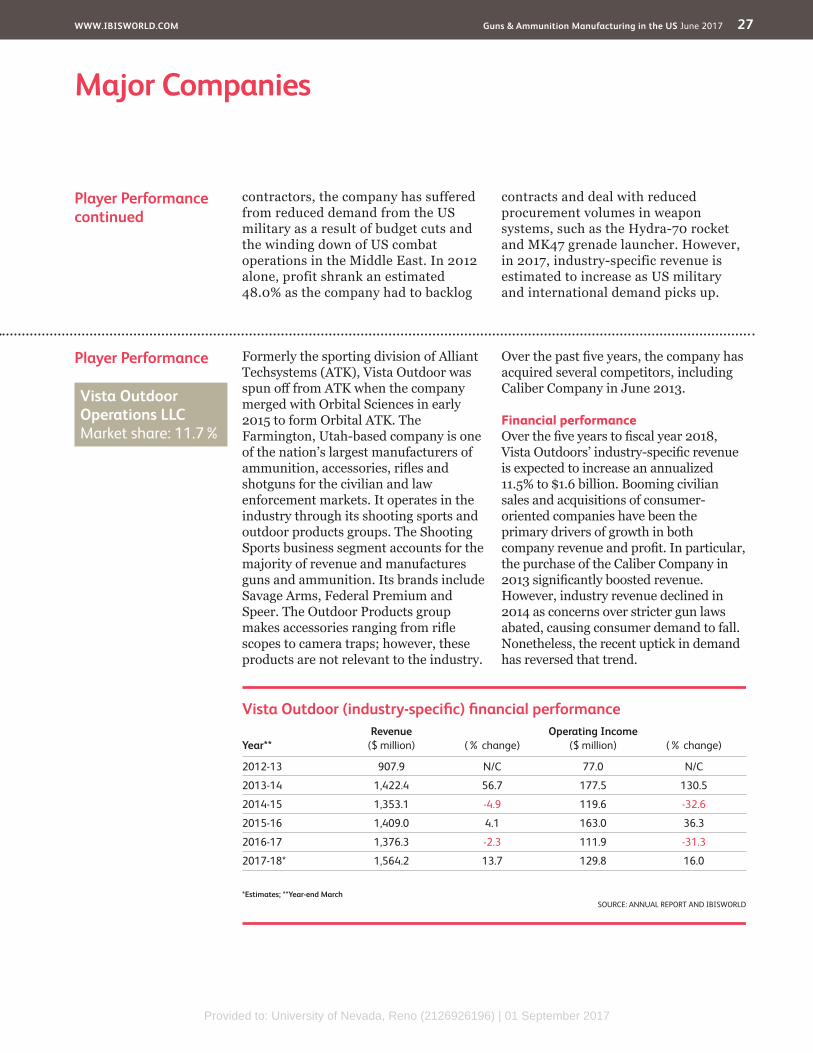
Vista Outdoor (industry-specifi c) fi nancial performance
Year**Revenue
($ million) (% change)Operating Income
($ million) (% change)
2012-13 907.9 N/C 77.0 N/C
2013-14 1,422.4 56.7 177.5 130.5
2014-15 1,353.1 -4.9 119.6 -32.6
2015-16 1,409.0 4.1 163.0 36.3
2016-17 1,376.3 -2.3 111.9 -31.3
2017-18* 1,564.2 13.7 129.8 16.0
*Estimates; **Year-end March SOURCE: ANNUAL REPORT AND IBISWORLD
Vista Outdoor Operations LLC Market share: 11.7%
Provided to: University of Nevada, Reno (2126926196) | 01 September 2017
WWW.IBISWORLD.COM Guns & Ammunition Manufacturing in the US June 2017 28
Major Companies
Player Performance Remington Outdoor Company is a Madison, North Carolina-based manufacturer of guns, ammunition and other firearm-related accessories. Bushmaster Firearms International LLC, its predecessor, was created in 2006 when Cerberus Capital Management acquired Bushmaster Firearms Inc. In 2007, Bushmaster and Remington Arms
Company Inc. merged, creating Freedom Group Inc., which was recently renamed Remington Outdoor Company.
It is one of the leading firearms, ammunition and related products companies in the world, with top commercial market positions across all the major product categories in the United States, and the largest firearms
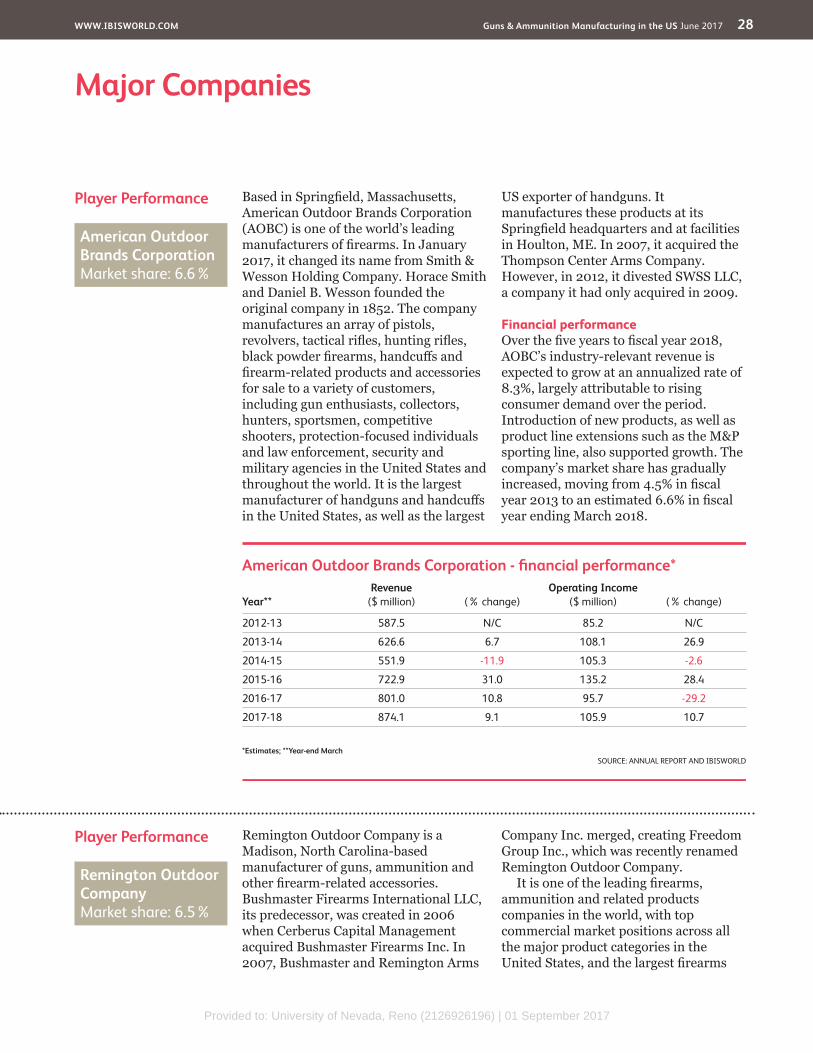
Player Performance Based in Springfield, Massachusetts, American Outdoor Brands Corporation (AOBC) is one of the world’s leading manufacturers of firearms. In January 2017, it changed its name from Smith & Wesson Holding Company. Horace Smith and Daniel B. Wesson founded the original company in 1852. The company manufactures an array of pistols, revolvers, tactical rifles, hunting rifles, black powder firearms, handcuffs and firearm-related products and accessories for sale to a variety of customers, including gun enthusiasts, collectors, hunters, sportsmen, competitive shooters, protection-focused individuals and law enforcement, security and military agencies in the United States and throughout the world. It is the largest manufacturer of handguns and handcuffs in the United States, as well as the largest
US exporter of handguns. It manufactures these products at its Springfield headquarters and at facilities in Houlton, ME. In 2007, it acquired the Thompson Center Arms Company. However, in 2012, it divested SWSS LLC, a company it had only acquired in 2009.
Financial performanceOver the five years to fiscal year 2018, AOBC’s industry-relevant revenue is expected to grow at an annualized rate of 8.3%, largely attributable to rising consumer demand over the period. Introduction of new products, as well as product line extensions such as the M&P sporting line, also supported growth. The company’s market share has gradually increased, moving from 4.5% in fiscal year 2013 to an estimated 6.6% in fiscal year ending March 2018.
American Outdoor Brands Corporation - fi nancial performance*
Year**Revenue
($ million) (% change)Operating Income
($ million) (% change)
2012-13 587.5 N/C 85.2 N/C
2013-14 626.6 6.7 108.1 26.9
2014-15 551.9 -11.9 105.3 -2.6
2015-16 722.9 31.0 135.2 28.4
2016-17 801.0 10.8 95.7 -29.2
2017-18 874.1 9.1 105.9 10.7
*Estimates; **Year-end March SOURCE: ANNUAL REPORT AND IBISWORLD
American Outdoor Brands Corporation Market share: 6.6%
Remington Outdoor Company Market share: 6.5%
Provided to: University of Nevada, Reno (2126926196) | 01 September 2017
WWW.IBISWORLD.COM Guns & Ammunition Manufacturing in the US June 2017 29
Major Companies
Player Performancecontinued
and ammunition market globally. Furthermore, it is the United States’ oldest and one of its largest manufacturers of firearms and ammunition, with a history dating back to 1816. It serves the hunting, shooting sports, law enforcement and military markets under some of the most globally recognized brands, including Marlin, Bushmaster and DPMS. It has seven primary manufacturing facilities with about 3,400 full-time employees and delivers products throughout the United States and to about 52 countries.
This company claims to be the largest manufacturer of commercial firearms, with the number one market share in domestic shotgun sales and commercial AR-style rifle sales. It also boasts more caliber offerings than any other manufacturer, a top market share in lever action sales. Remington Outdoor Company generally sells more than 2.0 billion rounds of ammunition annually. In 2015, firearm products accounted for an estimated 46.4% of company revenue, with ammunition at 44.0% of revenue and consumer products making up the remaining 9.6%.
Over the past five years, Remington Outdoor Company has added several companies to its already diverse portfolio. In 2012, the company acquired
Para USA and Tapco. Lastly, the company purchased Storm Lake, bought assets of SMK and acquired a new facility in Huntsville, AL. In December 2012, Freedom Group’s parent private equity firm, Cerberus, announced its intention sell the Freedom Group, though it has had difficulty finding a buyer. In 2014, the company declared a restructuring initiative which resulting in the shuttering of its facilities in Lawrenceville, GA, St. Cloud, MN, Elizabethtown, KY, West Jordan, UT, Kalispell, MT, and Pineville, NC, in addition to part of the company’s Ilion, NY, facilities, with production moving to the new Huntsville site.
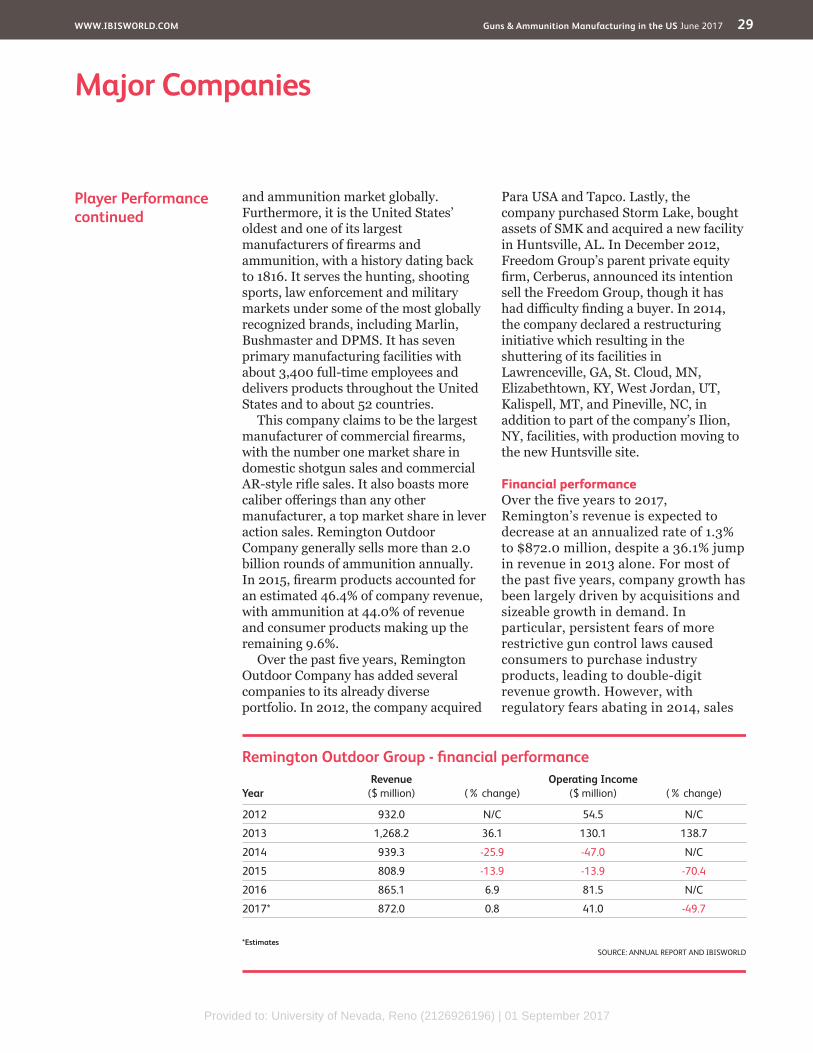
Financial performanceOver the five years to 2017, Remington’s revenue is expected to decrease at an annualized rate of 1.3% to $872.0 million, despite a 36.1% jump in revenue in 2013 alone. For most of the past five years, company growth has been largely driven by acquisitions and sizeable growth in demand. In particular, persistent fears of more restrictive gun control laws caused consumers to purchase industry products, leading to double-digit revenue growth. However, with regulatory fears abating in 2014, sales
Remington Outdoor Group - fi nancial performance
YearRevenue
($ million) (% change)Operating Income
($ million) (% change)
2012 932.0 N/C 54.5 N/C
2013 1,268.2 36.1 130.1 138.7
2014 939.3 -25.9 -47.0 N/C
2015 808.9 -13.9 -13.9 -70.4
2016 865.1 6.9 81.5 N/C
2017* 872.0 0.8 41.0 -49.7
*Estimates SOURCE: ANNUAL REPORT AND IBISWORLD
Provided to: University of Nevada, Reno (2126926196) | 01 September 2017

WWW.IBISWORLD.COM Guns & Ammunition Manufacturing in the US June 2017 30
Major Companies
Player Performance Clayton, Missouri-based Olin Corp. is a major chemicals and munitions company. Started in 1892, the company employs about 6,200 people and operates through three divisions. Olin Chlor Alkali Products and Vinyls produces and distributes chlorine and caustic soda, hydrochloric acid, hydrogen, bleach products and potassium hydroxide. The epoxy division manufactures epoxy resins, curing agents and intermediates. Finally, the Winchester division produces sporting ammunition, related components and small caliber military ammunition. In 2015, the company generated $2.9 billion in worldwide revenue.
Financial performanceThe company’s industry-specific operations are conducted exclusively
through its Winchester division, which accounts for about a quarter of the company’s total sales. Winchester is more than 148 years old and is a leading producer of ammunition for the recreational shooter, hunter, law enforcement and military markets. The division operates two facilities in the United States and one in Australia. In 2010, the company announced plans to relocate the Winchester centerfire pistol and rifle ammunition manufacturing operations from East Alton, IL, to Oxford, MS. This relocation was completed in 2014. Olin’s industry-relevant revenue grew at an annualized rate of 6.5% over the period to an estimated $771.4 million in 2017.
Player Performancecontinued
fell 25.9% in 2014, with more declines in 2015. Revenue growth returned in 2016 and 2017 as the recent surge in consumer demand drives sales.
Olin Corp. (industry-specifi c) fi nancial performance
YearRevenue
($ million) (% change)Operating Income
($ million) (% change)
2012 562.0 N/C 50.2 N/C
2013 707.6 25.9 130.3 159.6
2014 671.9 -5.0 115.8 -11.1
2015 647.4 -3.6 105.2 -9.2
2016 663.7 2.5 110.0 4.6
2017* 771.4 16.2 102.3 -7.0
*Estimates SOURCE: ANNUAL REPORT AND IBISWORLD
Olin Corp. Market share: 5.8%
Provided to: University of Nevada, Reno (2126926196) | 01 September 2017
WWW.IBISWORLD.COM Guns & Ammunition Manufacturing in the US June 2017 31
Major Companies
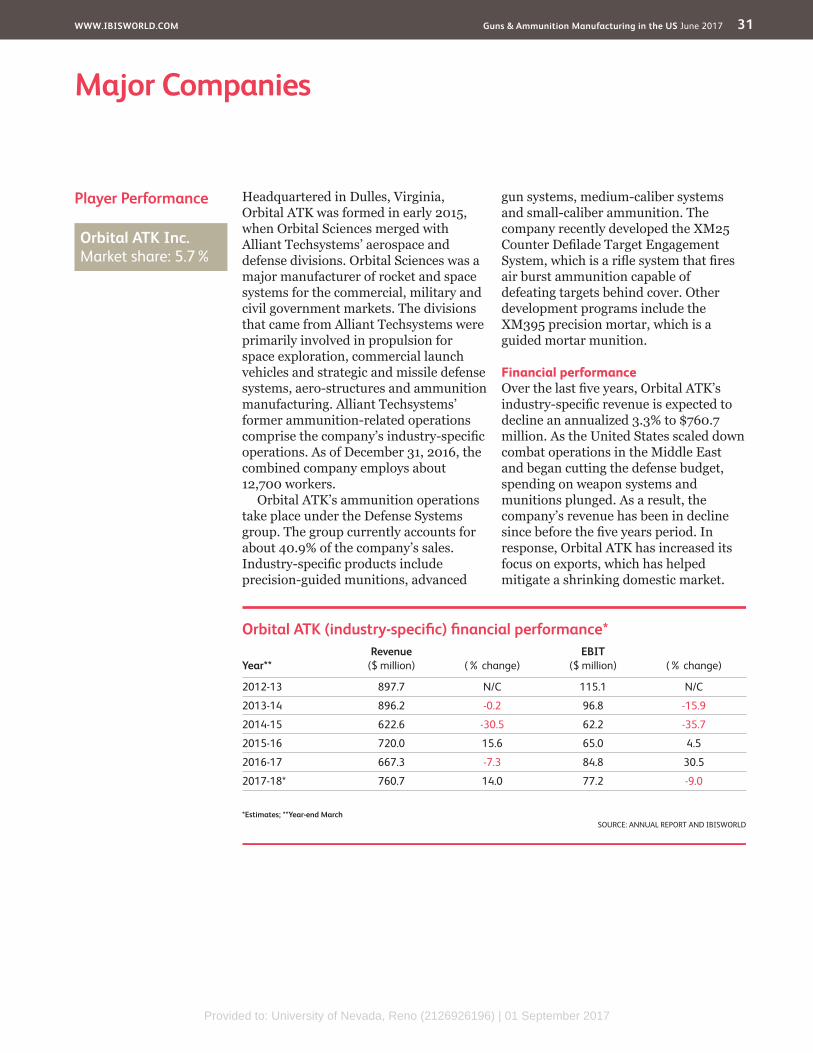
Orbital ATK (industry-specifi c) fi nancial performance*
Year**Revenue
($ million) (% change)EBIT
($ million) (% change)
2012-13 897.7 N/C 115.1 N/C
2013-14 896.2 -0.2 96.8 -15.9
2014-15 622.6 -30.5 62.2 -35.7
2015-16 720.0 15.6 65.0 4.5
2016-17 667.3 -7.3 84.8 30.5
2017-18* 760.7 14.0 77.2 -9.0
*Estimates; **Year-end March SOURCE: ANNUAL REPORT AND IBISWORLD
Player Performance Headquartered in Dulles, Virginia, Orbital ATK was formed in early 2015, when Orbital Sciences merged with Alliant Techsystems’ aerospace and defense divisions. Orbital Sciences was a major manufacturer of rocket and space systems for the commercial, military and civil government markets. The divisions that came from Alliant Techsystems were primarily involved in propulsion for space exploration, commercial launch vehicles and strategic and missile defense systems, aero-structures and ammunition manufacturing. Alliant Techsystems’ former ammunition-related operations comprise the company’s industry-specific operations. As of December 31, 2016, the combined company employs about 12,700 workers.
Orbital ATK’s ammunition operations take place under the Defense Systems group. The group currently accounts for about 40.9% of the company’s sales. Industry-specific products include precision-guided munitions, advanced
gun systems, medium-caliber systems and small-caliber ammunition. The company recently developed the XM25 Counter Defilade Target Engagement System, which is a rifle system that fires air burst ammunition capable of defeating targets behind cover. Other development programs include the XM395 precision mortar, which is a guided mortar munition.
Financial performanceOver the last five years, Orbital ATK’s industry-specific revenue is expected to decline an annualized 3.3% to $760.7 million. As the United States scaled down combat operations in the Middle East and began cutting the defense budget, spending on weapon systems and munitions plunged. As a result, the company’s revenue has been in decline since before the five years period. In response, Orbital ATK has increased its focus on exports, which has helped mitigate a shrinking domestic market.
Orbital ATK Inc. Market share: 5.7%
Provided to: University of Nevada, Reno (2126926196) | 01 September 2017
WWW.IBISWORLD.COM Guns & Ammunition Manufacturing in the US June 2017 32
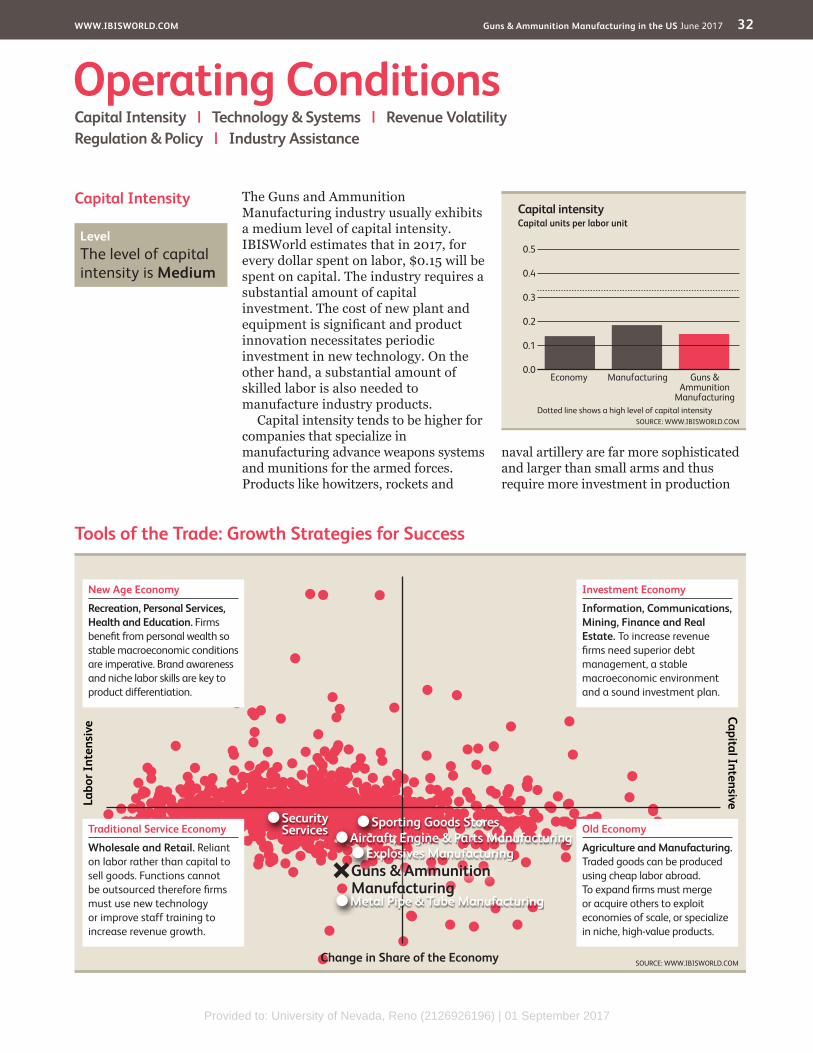
Capital Intensity The Guns and Ammunition Manufacturing industry usually exhibits a medium level of capital intensity. IBISWorld estimates that in 2017, for every dollar spent on labor, $0.15 will be spent on capital. The industry requires a substantial amount of capital investment. The cost of new plant and equipment is significant and product innovation necessitates periodic investment in new technology. On the other hand, a substantial amount of skilled labor is also needed to manufacture industry products.
Capital intensity tends to be higher for companies that specialize in manufacturing advance weapons systems and munitions for the armed forces. Products like howitzers, rockets and
naval artillery are far more sophisticated and larger than small arms and thus require more investment in production
Operating ConditionsCapital Intensity | Technology & Systems | Revenue VolatilityRegulation & Policy | Industry Assistance
Tools of the Trade: Growth Strategies for Success
SOURCE: WWW.IBISWORLD.COM
Labo
r Int
ensi
veCapital Intensive
Change in Share of the Economy
New Age Economy
Recreation, Personal Services, Health and Education. Firms benefi t from personal wealth so stable macroeconomic conditions are imperative. Brand awareness and niche labor skills are key to product differentiation.
Traditional Service Economy
Wholesale and Retail. Reliant on labor rather than capital to sell goods. Functions cannot be outsourced therefore fi rms must use new technology or improve staff training to increase revenue growth.
Old Economy
Agriculture and Manufacturing. Traded goods can be produced using cheap labor abroad. To expand fi rms must merge or acquire others to exploit economies of scale, or specialize in niche, high-value products.
Investment Economy
Information, Communications, Mining, Finance and Real Estate. To increase revenue fi rms need superior debt management, a stable macroeconomic environment and a sound investment plan.
Explosives Manufacturing
Sporting Goods Stores
Metal Pipe & Tube Manufacturing
Aircraft, Engine & Parts ManufacturingSecurity Services
Guns & Ammunition Manufacturing
Capital intensity
0.5
0.0
0.1
0.2
0.3
0.4
SOURCE: WWW.IBISWORLD.COMDotted line shows a high level of capital intensity
Capital units per labor unit
Guns & Ammunition
Manufacturing
ManufacturingEconomy
Level The level of capital intensity is Medium
Provided to: University of Nevada, Reno (2126926196) | 01 September 2017

WWW.IBISWORLD.COM Guns & Ammunition Manufacturing in the US June 2017 33
Operating Conditions
Technology & Systems Product development is essential to maintaining market share and market-leader status. This requires research and development (R&D.) Applied research is directed at particular objectives (e.g. searching for new or alternative materials for a product) and the ability to expand businesses across product lines or geographic markets. In general, the introduction of computer technologies has lowered the industry’s labor intensity but raised the minimum skills required.
Product technologyThe functional design of small arms has remained relatively stable with incremental improvements in metallurgy, ammunition and manufacturing technologies. Recent product development initiatives have focused on improving the products capability and safety. Recent technological developments have included enhancements to the overall lethality of military small arms through increased accuracy, penetration and rate of fire.
Companies in this industry focus on product development and introducing new products that satisfy the need for specialized, high-performance firearms. For example, providing new products such as lightweight and soft recoiling auto-loading weapons with advanced operating systems enhance product viability. Additionally, providing
specialized, high-performance ammunition that offers hunters better on-game performance at all ranges also enhances product and brand viability. There has also been increased emphasis on firearm safety, with a number of companies developing or already selling smart guns. Such firearms, use fingerprint or radio-frequency identification (RFID) technology to identify the gun’s proper owner and fire only within their hand.
Defense contractors that supply goods like artillery and guns systems for tanks and helicopters can spend heavily on R&D and make systems upgrades in order to stay competitive and outdo suppliers in other countries, especially if the government wishes to maintain military superiority. Governments may also task suppliers with the development of completely new weapon systems based on undeveloped technology. For example, ATK is under contract to develop the XM25 Counter Defilade Target Engagement System, which is a rifle system that fires air burst ammunition capable of defeating targets behind cover.
Manufacturing technologyCompanies in the industry make use of automated handling and assembly technology (including robotics) to perform repetitive tasks, thus promoting manufacturing efficiencies. While being
Capital Intensitycontinued
facilities and equipment. On the other hand, labor expenses for these companies are also higher because of the increased complexity and engineering of certain military products.
The industry has trended toward mechanization over the past five years, although wages and employment have increased between 2012 and 2017. Manufacturers can lower production costs by making one-time or periodic
(depending on the rate of technology change) investments in equipment, though demand for a higher output has increased employment and wages. Defense contracts have also sought to produce more with less labor as military budgets around the world shrink. A similar trend has also developed among civilian manufacturers as consumer demand for industry products wanes.
Level The level of Technology Change is Medium
Provided to: University of Nevada, Reno (2126926196) | 01 September 2017

WWW.IBISWORLD.COM Guns & Ammunition Manufacturing in the US June 2017 34
Operating Conditions
Revenue Volatility This industry has a moderate level of volatility as represented by the 8.9% average annual fluctuation in industry revenue in the past five years. Volatility has increased in response to initially surging demand for the industry’s civilian products, the subsequent normalization of this demand and then the recent resurgence of civilian demand. Companies are also subject to the volatility associated
with changes in the price of purchased inputs, such as zinc, steel and other input materials. These associated costs are passed on to consumers. Defense contractors have seen a high amount of volatility as military spending has been cut, thereby significantly reducing order volumes and revenue. However, securing long-term defense contracts can smooth out revenue swings.
Technology & Systemscontinued
relatively expensive to set up and install, once the machinery is working, an increase in the total output of parts produced reduces the unit cost as fixed costs are spread across the company. Much of the technology in use is in the public domain, but there are some proprietary processes
used in the manufacturing of goods produced by this industry that are patented, particularly in the military sphere. Manufacturing more advanced systems for the military, especially prototypes, may require companies to introduce new production methods.
SOURCE: WWW.IBISWORLD.COM
Volatility vs Growth
Reve
nue
vola
tility
* (%
)
1000
100
10
1
0.1
Five-year annualized revenue growth (%)–30 –10 10 30 50 70
Hazardous
Stagnant
Rollercoaster
Blue Chip
* Axis is in logarithmic scale
A higher level of revenue volatility implies greater industry risk. Volatility can negatively affect long-term strategic decisions, such as the time frame for capital investment.
When a fi rm makes poor investment decisions it may face underutilized capacity if demand suddenly falls, or capacity constraints if it rises quickly.
Guns & Ammunition Manufacturing
Level The level of Volatility is Medium
Regulation & Policy Industry operators are subject to various federal, state and local laws and regulations relating to the protection of the environment. These laws and regulations impose limitations on the discharge of materials into the environment and require companies to obtain and operate in compliance with government regulations. Because of
government regulation in this industry, most companies have developed extensive environmental, health and safety policies and procedures that include the proper handling, storage and disposal of hazardous materials. Although manufacturers design their equipment and manufacturing process to comply with these standards, the
Level & Trend The level of Regulation is Heavy and the trend is Steady
Provided to: University of Nevada, Reno (2126926196) | 01 September 2017
WWW.IBISWORLD.COM Guns & Ammunition Manufacturing in the US June 2017 35
Operating Conditions
regulations have nonetheless increased the price of the equipment and the cost of production. The higher costs associated with these environmental regulations are one of the reasons that companies are now looking to manufacture in countries with less stringent laws.
The industry’s products have their own set of regulations. These are design standards, which specify dimensions, tolerances or other physical characteristics of products, and performance standards, which provide a voluntary method of rating products. Government control and regulation regarding the manufacture and trade of firearms and ammunition is much more stringent. Manufacturers in this industry must complete numerous reports, including the Annual Firearms Manufacturing and Exportation Report.
In addition, an assortment of laws and regulations govern arms exports that industry participants must abide by. Such laws and regulations include the Arms Export Control Act of 1976 (as amended), which establishes procedures for sales and transfers of military equipment and related services, and the Foreign Assistance Act of 1961, which provides for economic and military assistance to foreign governments. Other laws and regulations include the Legislation on Foreign Relations Through 2005 (which includes Arms Export Control Act, Foreign Assistance Act, Gun Control Act, National Firearms Act and several other pieces of legislation); the International Traffic in Arms Regulations, which establishes the rules of operation used to control the import and export of defense articles and services; and the Export Administration Regulations, which are rules for the export of dual use (both civil and military) goods and technology.
Specific regulationsThe manufacture, sale and purchase of firearms are subject to extensive federal,
state and local governmental regulation. The basic federal laws are the National Firearms Act, the Federal Firearms Act, and the Gun Control Act of 1968. These laws generally prohibit the private ownership of fully automatic weapons and place certain restrictions on the interstate sale of firearms unless certain licenses are obtained. From time to time, congressional committees review proposed bills relating to the regulation of firearms. These proposed bills generally seek either to restrict or ban the sale and, in some cases, the ownership of various types of firearms. Several states currently have laws in effect similar to the aforementioned legislation.
Until November 30, 1998, the Brady Law mandated a nationwide five-day waiting period and background check prior to the purchase of a handgun. As of November 30, 1998, the National Instant Check System, which applies to both handguns and long guns, replaced the five-day waiting period. On September 13, 1994, the Crime Bill banned so-called “assault weapons.” This ban expired by operation of law on September 13, 2004. Various states and cities have adopted or proposed their own version of the ban.
Bills have been introduced in Congress to establish, and to consider the feasibility of establishing, a nationwide database recording so-called “ballistic images” of ammunition fired from new guns. Should such a mandatory database be established, the cost to operators in these industries and their customers could increase, depending on the type of firearms and ballistic information included in the database. To date, only two states have established such registries.
Some states are considering mandating certain design features on safety grounds, most of which would be applicable only to handguns. IBISWorld expects that hunter safety issues may affect sales of firearms, ammunition and other shooting-related
Regulation & Policy continued
Provided to: University of Nevada, Reno (2126926196) | 01 September 2017

WWW.IBISWORLD.COM Guns & Ammunition Manufacturing in the US June 2017 36
Operating Conditions
Industry Assistance TariffsThere are numerous tariffs levied on products made within the industry. The majority of industry products imported into the United States incur a normal trade relations (NTR) duty of between 0% and 4.3%. A non-NTR duty rate of between 27.5% and 45% applies to all imports of products from a small number of countries that do not enjoy NTR duty status, such as Cuba, North Korea, Iran, Iraq and Libya. In some cases, free trade importation agreements are in place.
To export their products, US-based companies must register with the Bureau of Industry and Security, which is responsible for implementing and enforcing the Export Administration Regulations, which regulate the export and re-export of most commercial items into and out of the United States. These regulations do not control all goods, services and technologies as other US government agencies regulate more
specialized exports, such as the Department of Defense (DOD).
As of October 1, 2005, any pistol, revolver or firearm that was manufactured, produced or imported by a person who manufactures, produces or imports less than an aggregate of 50 such articles during the calendar year is exempt from Federal Firearms and Ammunition Excise Tax.
Manufacturers of military products may also have extensive restrictions on not only to whom they can export to, but also where they may manufacture products. Systems that incorporate technology deemed a state secret may have to be exclusively manufactured in the United States.
Industry associationsIndustry associations that represent firms in this industry include the National Association of Manufacturers (NAM), the Sporting Arms and Ammunition
Level & Trend The level of Industry Assistance is Medium and the trend is Steady
products. In the northeastern United States, for example, some communities permit deer hunters to use only shotguns (which have a shorter average range than rifles) to minimize the possibility of shooting accidents in more densely populated areas.
Bills have been introduced in Congress in the past several years that may potentially affect the manufacture and sale of handgun ammunition, including bills to regulate the manufacture, import and sale of any projectile that is capable of penetrating body armor, to impose a tax and import controls on bullets designed to penetrate bulletproof vests. There have also been bills introduced that seek to prohibit the manufacture, transfer or importation of .25-caliber, .32-caliber and 9-millimeter handgun ammunition, to increase the tax on handgun ammunition, to impose a
special occupational tax and registration requirements on manufacturers of handgun ammunition, and to drastically increase the tax on certain handgun ammunition, such as 9-millimeter, .25-caliber and .32-caliber bullets.
In early 2016, President Obama announced an executive order designed to expand licensing requirements and background checks. One key feature of the order mandated the Social Security Administration to report information about mentally ill individuals, which would then be used in conducting background checks for firearms purchases. On February 28, 2017, President Donald J. Trump signed a law nullifying that rule. “Applications of this rule could endanger the Second Amendment rights of law abiding citizens,” the White House said in a statement.
Regulation & Policy continued
Provided to: University of Nevada, Reno (2126926196) | 01 September 2017

WWW.IBISWORLD.COM Guns & Ammunition Manufacturing in the US June 2017 37
Operating Conditions
Industry Assistancecontinued
Manufacturers Association (SAAMA), the National Rifle Association (NRA) and the America Firearms Retailers Association (AFRA.) These associations represent the interests of industry operators by facilitating technology councils and conferences and providing networking
opportunities, industry information, resources, regulatory information, education and standards advice. Associations like the NRA are also known for the extensive industry advocacy before lawmakers and agencies at the local, state and federal level.
Provided to: University of Nevada, Reno (2126926196) | 01 September 2017

WWW.IBISWORLD.COM Guns & Ammunition Manufacturing in the US June 2017 38
Key StatisticsRevenue
($m)
Industry Value Added
($m)Establish-
ments Enterprises EmploymentExports
($m)Imports
($m)Wages ($m)
Domestic Demand
Federal funding for defense
($b)2008 10,608.2 3,545.1 482 451 36,172 5,345.8 4,576.1 2,208.5 9,838.5 620.72009 11,672.0 4,366.9 498 466 39,921 5,737.1 5,164.8 2,604.4 11,099.7 661.02010 11,777.2 4,374.2 491 462 37,087 6,968.4 5,918.5 2,419.3 10,727.3 685.22011 13,196.0 3,698.5 503 474 36,111 6,348.8 5,060.6 2,365.6 11,907.8 683.02012 14,050.9 4,331.2 515 482 37,162 6,337.8 5,449.2 2,602.9 13,162.3 644.32013 14,973.1 5,221.7 572 539 39,179 7,321.0 6,430.5 2,646.3 14,082.6 592.52014 13,381.5 3,523.5 649 616 43,802 7,358.7 6,175.2 2,720.6 12,198.0 554.52015 13,630.3 3,961.7 663 630 44,714 8,461.4 6,887.0 2,762.2 12,055.9 536.12016 14,301.3 4,584.7 692 658 46,869 9,065.9 7,398.3 2,909.6 12,633.7 532.52017 13,334.4 4,231.0 690 659 45,308 8,441.0 6,907.9 2,773.0 11,801.3 540.92018 13,796.8 4,431.4 719 687 47,120 8,673.2 7,196.9 2,890.6 12,320.5 585.62019 14,290.5 4,598.5 745 711 48,672 8,987.2 7,451.5 2,997.8 12,754.8 605.82020 14,796.7 4,800.4 775 741 50,620 9,339.7 7,687.1 3,125.6 13,144.1 610.02021 15,301.3 4,984.8 803 768 52,275 9,698.6 7,916.0 3,239.4 13,518.7 608.22022 15,804.3 5,166.6 836 799 54,084 10,063.6 8,138.6 3,361.0 13,879.3 603.8Sector Rank 121/436 97/435 130/436 114/436 91/436 33/399 71/399 85/436 142/399 N/AEconomy Rank 645/1729 582/1568 1116/1729 1047/1729 706/1729 43/524 83/524 584/1729 168/524 N/A
IVA/Revenue (%)
Imports/ Demand
(%)
Exports/ Revenue
(%)
Revenue per Employee
($’000)Wages/Revenue
(%)Employees
per Est.Average Wage
($)
Share of the Economy
(%)2008 33.42 46.51 50.39 293.27 20.82 75.05 61,055.51 0.022009 37.41 46.53 49.15 292.38 22.31 80.16 65,238.85 0.032010 37.14 55.17 59.17 317.56 20.54 75.53 65,233.10 0.032011 28.03 42.50 48.11 365.43 17.93 71.79 65,509.12 0.022012 30.83 41.40 45.11 378.10 18.52 72.16 70,041.98 0.032013 34.87 45.66 48.89 382.17 17.67 68.49 67,543.84 0.032014 26.33 50.62 54.99 305.50 20.33 67.49 62,111.32 0.022015 29.07 57.13 62.08 304.83 20.27 67.44 61,774.84 0.022016 32.06 58.56 63.39 305.13 20.35 67.73 62,079.41 0.032017 31.73 58.54 63.30 294.31 20.80 65.66 61,203.32 0.022018 32.12 58.41 62.86 292.80 20.95 65.54 61,345.50 0.032019 32.18 58.42 62.89 293.61 20.98 65.33 61,591.88 0.032020 32.44 58.48 63.12 292.31 21.12 65.32 61,746.35 0.032021 32.58 58.56 63.38 292.71 21.17 65.10 61,968.44 0.032022 32.69 58.64 63.68 292.22 21.27 64.69 62,144.07 0.03Sector Rank 80/435 44/399 11/399 322/436 89/436 140/436 152/436 97/435Economy Rank 779/1568 60/524 19/524 828/1729 775/1729 230/1729 597/1729 582/1568
Figures are in inflation-adjusted 2017 dollars. Rank refers to 2017 data.
Revenue (%)
Industry Value Added
(%)
Establish-ments
(%)Enterprises
(%)Employment
(%)Exports
(%)Imports
(%)Wages
(%)
Domestic Demand
(%)
Federal funding for defense
(%)2009 10.0 23.2 3.3 3.3 10.4 7.3 12.9 17.9 12.8 6.52010 0.9 0.2 -1.4 -0.9 -7.1 21.5 14.6 -7.1 -3.4 3.72011 12.0 -15.4 2.4 2.6 -2.6 -8.9 -14.5 -2.2 11.0 -0.32012 6.5 17.1 2.4 1.7 2.9 -0.2 7.7 10.0 10.5 -5.72013 6.6 20.6 11.1 11.8 5.4 15.5 18.0 1.7 7.0 -8.02014 -10.6 -32.5 13.5 14.3 11.8 0.5 -4.0 2.8 -13.4 -6.42015 1.9 12.4 2.2 2.3 2.1 15.0 11.5 1.5 -1.2 -3.32016 4.9 15.7 4.4 4.4 4.8 7.1 7.4 5.3 4.8 -0.72017 -6.8 -7.7 -0.3 0.2 -3.3 -6.9 -6.6 -4.7 -6.6 1.62018 3.5 4.7 4.2 4.2 4.0 2.8 4.2 4.2 4.4 8.32019 3.6 3.8 3.6 3.5 3.3 3.6 3.5 3.7 3.5 3.42020 3.5 4.4 4.0 4.2 4.0 3.9 3.2 4.3 3.1 0.72021 3.4 3.8 3.6 3.6 3.3 3.8 3.0 3.6 2.8 -0.32022 3.3 3.6 4.1 4.0 3.5 3.8 2.8 3.8 2.7 -0.7Sector Rank 432/436 430/435 318/436 214/436 416/436 368/399 379/399 425/436 394/399 N/AEconomy Rank 1721/1729 1550/1568 1365/1729 1125/1729 1672/1729 488/524 502/524 1698/1729 518/524 N/A
Annual Change
Key Ratios
Industry Data
SOURCE: WWW.IBISWORLD.COM
Provided to: University of Nevada, Reno (2126926196) | 01 September 2017

WWW.IBISWORLD.COM Guns & Ammunition Manufacturing in the US June 2017 39
Apr 2015 - Mar 2016 by company revenueApr 2012 - Apr 2013 - Apr 2014 - Apr 2015 - Small Medium LargeMar 2013 Mar 2014 Mar 2015 Mar 2016 (<$10m) ($10-50m) (>$50m)
Liquidity Ratios
Current Ratio 1.9 2.0 1.9 2.1 2.3 1.9 2.1Quick Ratio 1.0 1.1 1.0 1.1 1.3 1.0 0.9Sales / Receivables (Trade Receivables Turnover) 8.8 9.1 9.0 8.9 9.7 8.5 7.8
Days’ Receivables 41.5 40.1 40.6 41.0 37.6 42.9 46.8Cost of Sales / Inventory (Inventory Turnover) 7.0 6.7 6.5 6.6 7.8 6.0 5.0
Days’ Inventory 52.1 54.5 56.2 55.3 46.8 60.8 73.0Cost of Sales / Payables (Payables Turnover) 14.1 14.3 13.7 15.1 16.1 14.2 14.6
Days’ Payables 25.9 25.5 26.6 24.2 22.7 25.7 25.0Sales / Working Capital 8.1 7.6 8.0 7.0 7.1 7.3 5.4
Coverage Ratios
Earnings Before Interest & Taxes (EBIT) / Interest 7.0 8.3 5.6 5.4 4.7 6.1 7.3
Net Profit + Dep., Depletion, Amort. / Current Maturities LT Debt 4.0 3.6 3.1 2.2 2.4 2.0 2.4
Leverage Ratios
Fixed Assets / Net Worth 0.7 0.6 0.7 0.6 0.7 0.6 0.6Debt / Net Worth 1.5 1.4 1.6 1.2 1.2 1.2 1.1Tangible Net Worth 31.5 33.7 31.1 35.2 31.1 41.1 34.5
Operating Ratios
Profit before Taxes / Net Worth, % 24.8 25.0 21.3 16.8 16.8 19.4 13.4Profit before Taxes / Total Assets, % 9.3 10.0 7.8 7.4 7.4 7.6 6.5Sales / Net Fixed Assets 10.5 10.4 9.8 8.5 9.4 8.3 7.8Sales / Total Assets (Asset Turnover) 2.1 2.1 2.0 1.9 2.2 1.8 1.6
Cash Flow & Debt Service Ratios (% of sales)
Cash from Trading 30.4 30.5 29.8 31.7 37.4 27.3 24.1Cash after Operations 6.8 7.6 6.4 7.6 7.9 7.2 8.1Net Cash after Operations 6.6 7.3 6.5 7.6 8.4 7.1 7.6Cash after Debt Amortization 2.2 2.6 2.0 2.5 3.0 2.0 2.8Debt Service P&I Coverage 2.5 3.2 2.6 2.7 2.6 2.7 3.5Interest Coverage (Operating Cash) 7.3 8.0 7.5 8.6 8.0 8.7 10.4
Assets, %
Cash & Equivalents 11.9 13.1 11.8 12.3 13.8 11.4 8.4Trade Receivables (net) 26.2 24.9 24.1 23.6 23.7 23.6 23.4Inventory 23.9 24.5 25.0 23.5 21.5 25.7 25.6All Other Current Assets 3.2 2.4 2.4 2.8 2.3 3.1 3.8Total Current Assets 65.2 64.9 63.4 62.2 61.3 63.8 61.2Fixed Assets (net) 24.6 24.4 25.3 26.6 27.6 26.3 23.0Intangibles (net) 4.8 5.4 5.7 5.4 4.3 5.3 10.9All Other Non-Current Assets 5.4 5.3 5.6 5.8 6.8 4.6 5.0Total Assets 100.0 100.0 100.0 100.0 100.0 100.0 100.0Total Assets ($m) 11,440.6 12,126.8 13,183.3 11,626.7 935.6 3,923.1 6,768.0
Liabilities, %
Notes Payable-Short Term 10.5 9.3 9.9 9.5 10.1 9.0 8.2Current Maturities L/T/D 3.3 3.3 3.6 3.8 4.3 3.4 2.5Trade Payables 14.0 13.3 13.9 11.2 10.5 12.3 10.6Income Taxes Payable 0.2 0.2 0.2 0.2 0.2 0.3 0.3All Other Current Liabilities 10.8 10.2 9.4 9.6 8.9 9.9 11.6Total Current Liabilities 38.8 36.3 36.9 34.3 34.0 34.9 33.2Long Term Debt 17.4 16.2 18.8 18.2 22.7 13.0 14.4Deferred Taxes 0.6 0.6 0.5 0.6 0.5 0.5 1.1All Other Non-Current Liabilities 6.8 7.8 6.9 6.4 7.4 5.2 5.9Net Worth 36.3 39.1 36.8 40.6 35.4 46.4 45.4Total Liabilities & Net Worth ($m) 11,440.6 12,126.8 13,183.3 11,626.7 935.6 3,923.1 6,768.0
Maximum Number of Statements Used 725 720 759 759 390 284 85
Industry Financial Ratios
Source: RMA Annual Statement Studies, rmahq.org. RMA data for all industries is derived directly from more than 260,000 statements of member financial institutions’ borrowers and prospects.Note: For a full description of the ratios refer to the Key Statistics chapter online.
Provided to: University of Nevada, Reno (2126926196) | 01 September 2017

WWW.IBISWORLD.COM Guns & Ammunition Manufacturing in the US June 2017 40
Jargon & Glossary
BARRIERS TO ENTRY High barriers to entry mean that new companies struggle to enter an industry, while low barriers mean it is easy for new companies to enter an industry.
CAPITAL INTENSITY Compares the amount of money spent on capital (plant, machinery and equipment) with that spent on labor. IBISWorld uses the ratio of depreciation to wages as a proxy for capital intensity. High capital intensity is more than $0.333 of capital to $1 of labor; medium is $0.125 to $0.333 of capital to $1 of labor; low is less than $0.125 of capital for every $1 of labor.
CONSTANT PRICES The dollar figures in the Key Statistics table, including forecasts, are adjusted for inflation using the current year (i.e. year published) as the base year. This removes the impact of changes in the purchasing power of the dollar, leaving only the “real” growth or decline in industry metrics. The inflation adjustments in IBISWorld’s reports are made using the US Bureau of Economic Analysis’ implicit GDP price deflator.
DOMESTIC DEMAND Spending on industry goods and services within the United States, regardless of their country of origin. It is derived by adding imports to industry revenue, and then subtracting exports.
EMPLOYMENT The number of permanent, part-time, temporary and seasonal employees, working proprietors, partners, managers and executives within the industry.
ENTERPRISE A division that is separately managed and keeps management accounts. Each enterprise consists of one or more establishments that are under common ownership or control.
ESTABLISHMENT The smallest type of accounting unit within an enterprise, an establishment is a single physical location where business is conducted or where services or industrial operations are performed. Multiple establishments under common control make up an enterprise.
EXPORTS Total value of industry goods and services sold by US companies to customers abroad.
IMPORTS Total value of industry goods and services brought in from foreign countries to be sold in the United States.
INDUSTRY CONCENTRATION An indicator of the dominance of the top four players in an industry. Concentration is considered high if the top players account for more than 70% of industry revenue. Medium is 40% to 70% of industry revenue. Low is less than 40%.
INDUSTRY REVENUE The total sales of industry goods and services (exclusive of excise and sales tax); subsidies on production; all other operating income from outside the firm (such as commission income, repair and service income, and rent, leasing and hiring income); and capital work done by rental or lease. Receipts from interest royalties, dividends and the sale of fixed tangible assets are excluded.
INDUSTRY VALUE ADDED (IVA) The market value of goods and services produced by the industry minus the cost of goods and services used in production. IVA is also described as the industry’s contribution to GDP, or profit plus wages and depreciation.
INTERNATIONAL TRADE The level of international trade is determined by ratios of exports to revenue and imports to domestic demand. For exports/revenue: low is less than 5%, medium is 5% to 20%, and high is more than 20%. Imports/domestic demand: low is less than 5%, medium is 5% to 35%, and high is more than 35%.
LIFE CYCLE All industries go through periods of growth, maturity and decline. IBISWorld determines an industry’s life cycle by considering its growth rate (measured by IVA) compared with GDP; the growth rate of the number of establishments; the amount of change the industry’s products are undergoing; the rate of technological change; and the level of customer acceptance of industry products and services.
NONEMPLOYING ESTABLISHMENT Businesses with no paid employment or payroll, also known as nonemployers. These are mostly set up by self-employed individuals.
PROFIT IBISWorld uses earnings before interest and tax (EBIT) as an indicator of a company’s profitability. It is calculated as revenue minus expenses, excluding interest and tax.
Industry Jargon
IBISWorld Glossary
AMMUNITION Primers that are fired from guns, explosive military items like grenades and bombs and any materials that are thrown in fight.
ORDNANCE Ammunition, explosives and similar warfare devices.
TAMPION Wooden plug, or a metal, canvas, rubber or plastic cover for the muzzle of a gun.
Provided to: University of Nevada, Reno (2126926196) | 01 September 2017

WWW.IBISWORLD.COM Guns & Ammunition Manufacturing in the US June 2017 41
Jargon & Glossary
VOLATILITY The level of volatility is determined by averaging the absolute change in revenue in each of the past five years. Volatility levels: very high is more than ±20%; high volatility is ±10% to ±20%; moderate volatility is ±3% to ±10%; and low volatility is less than ±3%.
WAGES The gross total wages and salaries of all employees in the industry. The cost of benefits is also included in this figure.
IBISWorld Glossary continued
Provided to: University of Nevada, Reno (2126926196) | 01 September 2017

Disclaimer
This product has been supplied by IBISWorld Inc. (‘IBISWorld’) solely for use by its authorized licenses strictly in accordance with their license agreements with IBISWorld. IBISWorld makes no representation to any other person with regard to the completeness or accuracy of the data or information contained herein, and it accepts no responsibility and disclaims all liability (save for liability which cannot be lawfully disclaimed) for loss or damage whatsoever suffered or incurred by any other person resulting from the use
of, or reliance upon, the data or information contained herein. Copyright in this publication is owned by IBISWorld Inc. The publication is sold on the basis that the purchaser agrees not to copy the material contained within it for other than the purchasers own purposes. In the event that the purchaser uses or quotes from the material in this publication – in papers, reports, or opinions prepared for any other person – it is agreed that it will be sourced to: IBISWorld Inc.
At IBISWorld we know that industry intelligence is more than assembling factsIt is combining data with analysis to answer the questions that successful businesses askIdentify high growth, emerging & shrinking marketsArm yourself with the latest industry intelligenceAssess competitive threats from existing & new entrantsBenchmark your performance against the competitionMake speedy market-ready, profit-maximizing decisions
Who is IBISWorld?We are strategists, analysts, researchers, and marketers. We provide answers to information-hungry, time-poor businesses. Our goal is to provide real world answers that matter to your business in our 700 US industry reports. When tough strategic, budget, sales and marketing decisions need to be made, our suite of Industry and Risk intelligence products give you deeply-researched answers quickly.
IBISWorld MembershipIBISWorld offers tailored membership packages to meet your needs.
Copyright 2017 IBISWorld Inc
www.ibisworld.com | 1-800-330-3772 | [email protected]