gwas qc -theory and steps
TRANSCRIPT

GWAS QC -theory and stepsH3ABioNet Genome Wide Association Studies
Lecture SeriesShaun AronAugust 2018

GWAS Data Generation
Slide�17Teo�2008�Curr Opin Lipidol 19:133Ͳ43�•�Ziegler�et�al.�2008�Biom�J�50:8Ͳ28 Slide�18
Converts signal intensities into genotypes
Three major steps1. Normalization of signal intensities
2. Summarization of signal intensities
3. Calling�of genotypes
Slide�19
Algorithm Institution Reference
Birdseed Affymetrix Korn�et�al. 2008�Nat�Genet�40:1253–1260
BRLMM� Affymetrix Cawley et�al.�2006
CHIAMO WTCCC Wellcome Trust�Case�Control�Consortium�2007 Nature 447:661–78
CRLMM Johns�Hopkins�University Carvalho�et�al.�2007 Biostatistics 8:485–99
GEL University�of Chicago Nicolae et�al.�2006 Bioinformatics 22:1942Ͳ7
JAPL Wellcome�Trust,�Cambridge
Plagnol et al.�2007 PLoS Genetics�3:e74
SNiPerͲHD Texas�A&M�University Hua et�al.�2007�Bioinformatics 23:57Ͳ63
Schillert�&�Ziegler�2010�ISBNͲ13:�978Ͳ3Ͳ00Ͳ031608Ͳ1,�Art.�0056 Slide�20
Framingham Heart�Study�data provided for GAW16
Affymetrix 500k�Array�Set2446�genotyped subjects from 322�nuclear families (total�n�=�6848)
BRLMM Chiamo JAPL
Vens et�al.�2009�BMC�Proc,�3�Suppl 7:S59

GWAS Data Analysis
Slide�17Teo�2008�Curr Opin Lipidol 19:133Ͳ43�•�Ziegler�et�al.�2008�Biom�J�50:8Ͳ28 Slide�18
Converts signal intensities into genotypes
Three major steps1. Normalization of signal intensities
2. Summarization of signal intensities
3. Calling�of genotypes
Slide�19
Algorithm Institution Reference
Birdseed Affymetrix Korn�et�al. 2008�Nat�Genet�40:1253–1260
BRLMM� Affymetrix Cawley et�al.�2006
CHIAMO WTCCC Wellcome Trust�Case�Control�Consortium�2007 Nature 447:661–78
CRLMM Johns�Hopkins�University Carvalho�et�al.�2007 Biostatistics 8:485–99
GEL University�of Chicago Nicolae et�al.�2006 Bioinformatics 22:1942Ͳ7
JAPL Wellcome�Trust,�Cambridge
Plagnol et al.�2007 PLoS Genetics�3:e74
SNiPerͲHD Texas�A&M�University Hua et�al.�2007�Bioinformatics 23:57Ͳ63
Algorithm Institution Reference
Birdseed Affymetrix Korn�et�al. 2008�Nat�Genet�40:1253–1260
BRLMM� Affymetrix Cawley et�al.�2006
CHIAMO WTCCC Wellcome Trust�Case�Control�Consortium�2007 Nature 447:661–78
CRLMM Johns�Hopkins�University Carvalho�et�al.�2007 Biostatistics 8:485–99
GEL University�of Chicago Nicolae et�al.�2006 Bioinformatics 22:1942Ͳ7
JAPL Wellcome�Trust,�Cambridge
Plagnol et al.�2007 PLoS Genetics�3:e74
SNiPerͲHD Texas�A&M�University Hua et�al.�2007�Bioinformatics 23:57Ͳ63
Schillert�&�Ziegler�2010�ISBNͲ13:�978Ͳ3Ͳ00Ͳ031608Ͳ1,�Art.�0056 Slide�20
Framingham Heart�Study�data provided for GAW16
Affymetrix 500k�Array�Set2446�genotyped subjects from 322�nuclear families (total�n�=�6848)
BRLMM Chiamo JAPL
Vens et�al.�2009�BMC�Proc,�3�Suppl 7:S59

Plink format
• FAM file – one row per individual• BIM file – one row per SNP• BED file – one row per individual – genotype
calls for each individual for all SNPs – binary format
• FAM and BIM file are human readable while BED file in not

FAM File
BIM FileChr SNP ID
Genetic Distance (morgans) BP Position
SNP Alleles
IIDFID
MATID
PHENOPATID SEX
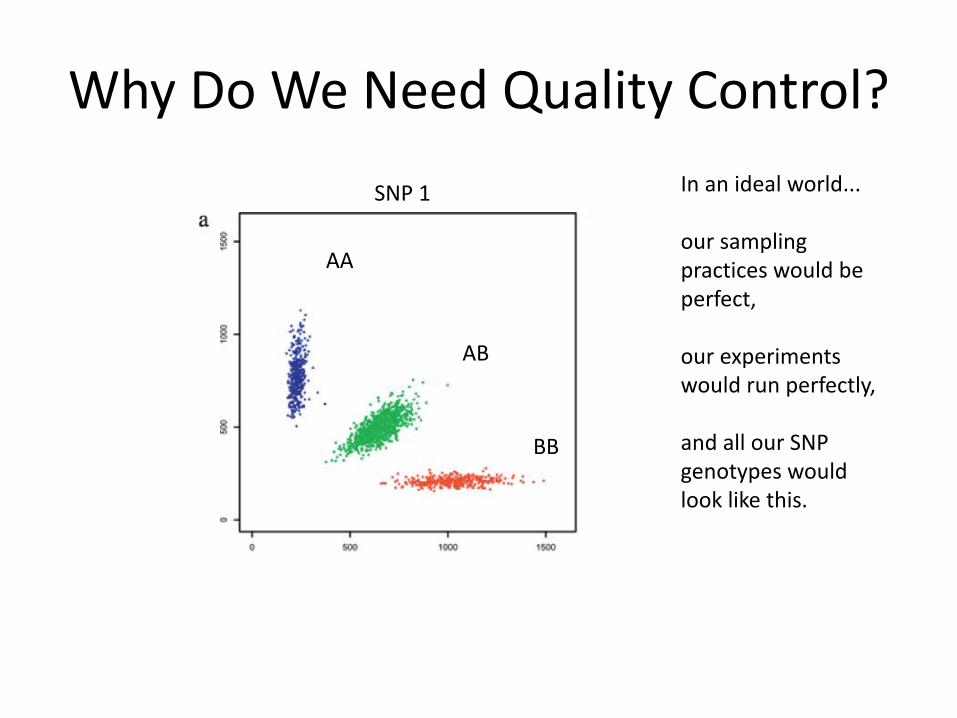
Why Do We Need Quality Control?
AA
AB
BB
In an ideal world...
our sampling practices would be perfect,
our experiments would run perfectly,
and all our SNP genotypes would look like this.
SNP 1

Why Do We Need Quality Control• Large scale experiments generate
true results with a certain error rate
• Errors might originate at various steps in in the process:
ü Sample selection related issuesü Cryptic relatednessü Population structure
ü Sample handling related issuesü Labeling/Plating Error
ü Genotyping array related issuesü Genotyping error
ü Batch effect related issuesü Difference in results due to
difference in sample processing
• Not practical to visually assess the genotype plot for every SNP
• Use some biologically relevant metrics as a proxy for quality
• Steps– QC by SNP– QC by sample

Why Do We Need Quality Control
AA
AB
BB
????
??
AAAB
BBBB?
ABAA
BB
We don’t live in an ideal world…

Slide�25Samani et�al.�2007�N�Engl�J�Med 357:443Ͳ53
German�MI�family study IAffymetrix 500K�Array�SetSNPs�on�chips:�493,840
Slide�26
German�MI�family study IAffymetrix 500K�Array�SetSNPs�on�chips:�493,840SNPs�passing QC:�270,701
Samani et�al.�2007�N�Engl�J�Med 357:443Ͳ53
Slide�27Hong�et�al.�2008�BMC�Bioinformatics 9�Suppl 9:S17
NSP1�chip STY1�chip
Figures with NSP1�and STY1�quality from Hong�et�al.
Slide�28
sQC:�“Travemünde criteria”QC�on�the�subject�levelQC�on�the�SNP�levelQC�for�XͲchromosomal�SNPs�only
Cluster�plot�reading
Ziegler�2009�Genet�Epidemiol 33:S45ͲS50
German MI family study Affymetrix 500K Array SetSNPs on chips: 493,840
Samani et al. 2007 N Engl J Med 357:443-53
SNPs passing QC: 270,701

QC RoadmapSNP QCSample QC
Discordant sex informationHigh MissingnessExcess or deficiency of heterozygosityDuplicate or relatedDivergent ancestryBatch Effects
Low minor allele frequencyMissingnessDifferential missingnessHardy-Weinberg outliers
• For the sake of simplicity I have split the QC into Sample QC and SNP QC• The order explained here is therefore not always the best way to do they QC• The H3ABioNet pipeline has been developed using the best generalized order
Software
• Programs required for QC– PLINK 1.9 (Purcell, 2007)– Scripts for processing result files– R (Statistical Software) for plotting results– The complete process has been built into a
pipeline using NextFlow
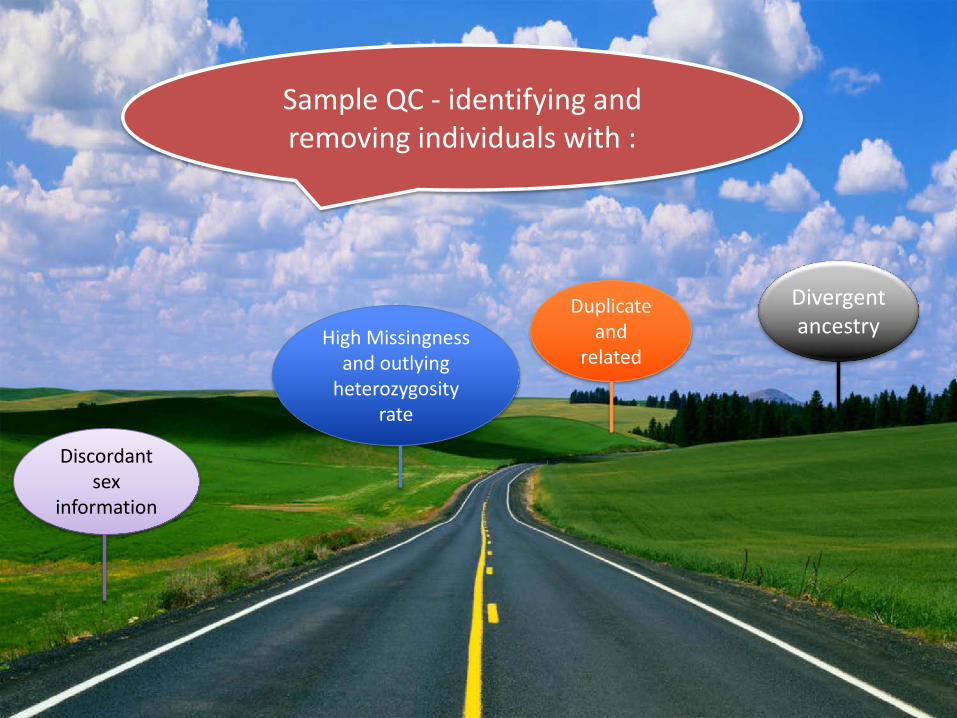
Discordant sex
information
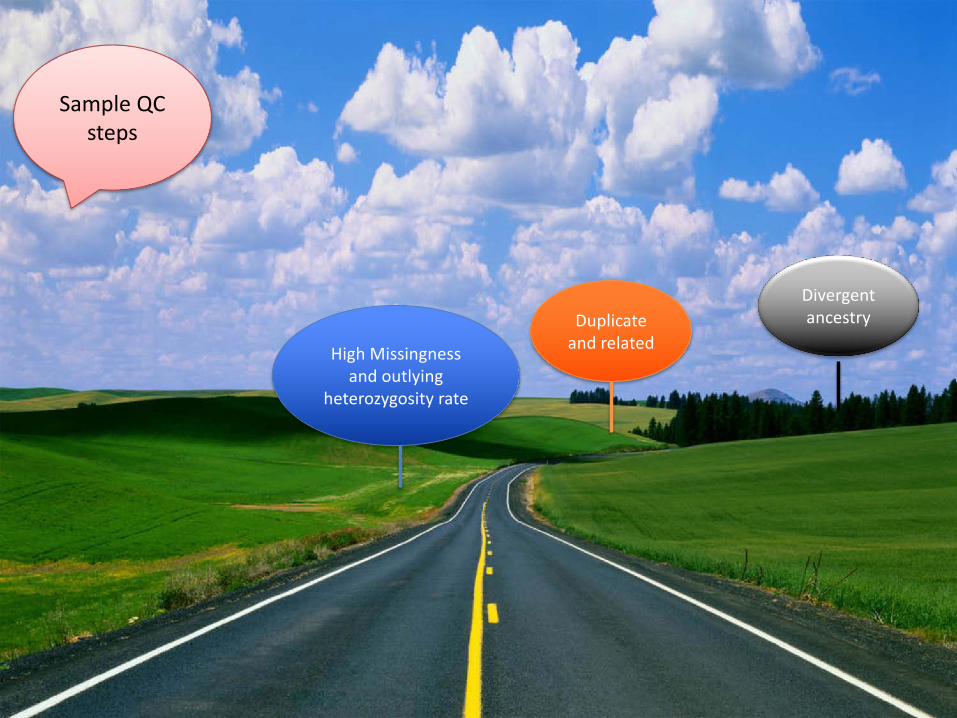
High Missingness and outlying
heterozygosity rate
Duplicate and
related
Divergent ancestry
Sample QC - identifying and removing individuals with :

Discordant Sex Check• Males have a single X chromosome and
therefore can be estimated to behomozygous for all the X chromosomeSNPs (other than those in the pseudoautosomal region(PAR)).
• Therefore, X chromosome homozygosityestimate for males (XHE) is 1
• Plink assigns sex based on XHE estimate (For inbreeding coefficient) :
• Male (1) : XHE >0.80
• Female (2) : XHE <0.20
• No sex (0) : 0.20 <XHE <0.80
• Comparisons of predicted and observedsex can be used to identify miscoded sexor sample mix-ups, etc.
All Female Samples
X Chromosome Homozygozity Estimate
Freq
uenc
y
−0.1 0.0 0.1 0.2 0.3 0.4 0.5
020
4060
8010
012
014
0
All Male Samples
X Chromosome Homozygozity Estimate
Freq
uenc
y
0.988 0.990 0.992 0.994 0.996 0.998 1.000
020
040
060
0

Identify individuals with discordant
sex information
plink --bfile example --check-sex -–out sexstat
FID IID PEDSEX SNPSEX STATUS FP554 P554 2 2 OK -0.02654P555 P555 1 0 PROBLEM 0.5685P557 P557 2 2 OK 0.1264P558 P558 2 2 OK -0.0007684
Creates a file named sexstat.sexcheck
Select individuals with Status=“PROBLEM” in the file
sexstat.sexcheck
Try to identify the problem. If the problem cannot be resolved
write the IDs of the individuals with discordant sex information
to a file “fail_sex_check.txt”
grep “PROBLEM” sexstat.sexcheck > fail_sex_check.txt

Nextflow Parameters
• sex_info_available = true• f_low_male = 0.8• f_high_female = 0.2
High Missingness and outlying
heterozygosity rate
Duplicate and related
Divergent ancestry
Sample QC steps
Missingness
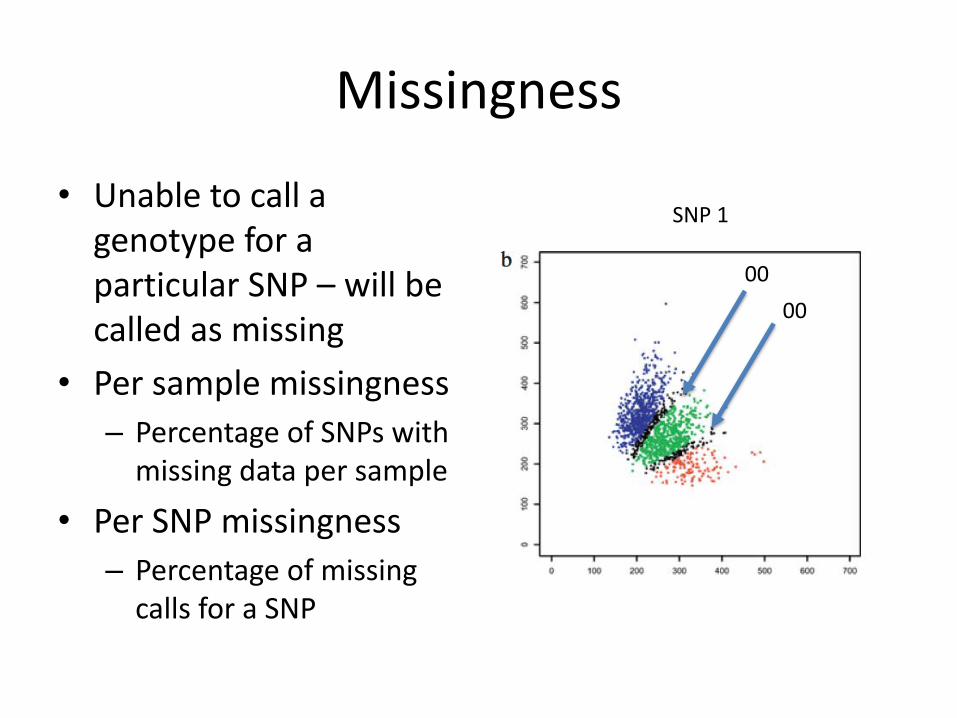
• Unable to call a genotype for a particular SNP – will be called as missing
• Per sample missingness– Percentage of SNPs with
missing data per sample• Per SNP missingness– Percentage of missing
calls for a SNP
0000
SNP 1

Heterozygosity Rate• Per sample (individual) rate• Number of (total non-missing genotypes(N) –
homozygous(0)) genotypes divided by total non-missing genotypes(N)
• Excess heterozygosity - Possible sample contamination
• Less than expected heterozygosity - Possibly inbreeding
• Threshold is usually to remove any individual with +-3 standard deviations from the mean heterozygosity rate of all samples.
Genotyping Call Rate by Heterozygosity
Genotyping call rate and heterozygosityrate are generally plotted together.Cutoffs are selected so as to identifyoutlier individuals based on both thestatistics
Genotyping call rate• Per sample (individual) rate• Number of non-missing genotypes divided by
the total number of genotyped markers.• Low genotyping call rate indicate problem with
sample DNA like low concentration.• Thresholds used generally vary between 3% and
7%
Missingness and Heterozygosity Rate

Missingness per Individual and per SNP
plink --bfile example –missing --out example_miss
Before frequency and genotyping pruning, there are 98604 SNPs646 founders and 0 non-founders found34704 heterozygous haploid genotypes; set to missingWriting list of heterozygous haploid genotypes to [ example_miss.hh ]3452 SNPs with no founder genotypes observedWarning, MAF set to 0 for these SNPs (see --nonfounders)Writing list of these SNPs to [ example_miss.nof ]Writing individual missingness information to [ example_miss.imiss ] Writing locus missingness information to [ example_miss.lmiss ]
FID IID MISS_PHENO N_MISS N_GENO F_MISSP554 P554 N 4096 97722 0.04191P557 P557 N 4011 97722 0.04105P558 P558 N 4327 97722 0.04428P562 P562 N 4099 97722 0.04195
HR SNP N_MISS N_GENO F_MISS1 vh_1_1108138 9 646 0.013931 vh_1_1110294 4 646 0.0061921 rs7515488 1 646 0.0015481 rs6603785 9 646 0.01393
Missing phenotype (Y/NN)
Missingness per individual
Missingness per SNP (Come back to later)

Heterozygosity rate per Individualplink --bfile example --het --out example_het
Before frequency and genotyping pruning, there are 98604 SNPs646 founders and 0 non-founders found
Detected that binary PED file is v1.00 SNP-major modeBefore frequency and genotyping pruning, there are 98604 SNPs646 founders and 0 non-founders found34704 heterozygous haploid genotypes; set to missingWriting list of heterozygous haploid genotypes to [ example_het.hh ]3452 SNPs with no founder genotypes observedWarning, MAF set to 0 for these SNPs (see --nonfounders)Writing individual heterozygosity information to [ example_het.het ]
FID IID O(HOM) E(HOM) N(NM) FP554 P554 67663 6.725e+04 86305 0.02173P557 P557 66873 6.731e+04 86388 -0.02301P558 P558 67155 6.707e+04 86091 0.004538P562 P562 68367 6.724e+04 86306 0.05891
Observed number of homozygous genotypes
Expected number of homozygous
genotypes
Inbreeding coefficient estimate

Based on the plot you can decide on reasonable thresholds at which to
exclude individuals based on elevated missing or extreme
heterozygosity.
We decided to exclude all individuals with a genotype
failure rate ≥ 0.06 and heterozygosity rate ± 3
standard deviations from the mean heterozygosity rate of
all samples

Nextflow Parameters
• cut_mind = 0.02• cut_het_high = 0.343• cut_het_low = 0.15

Duplicate and related
Divergent ancestry
Sample QC steps
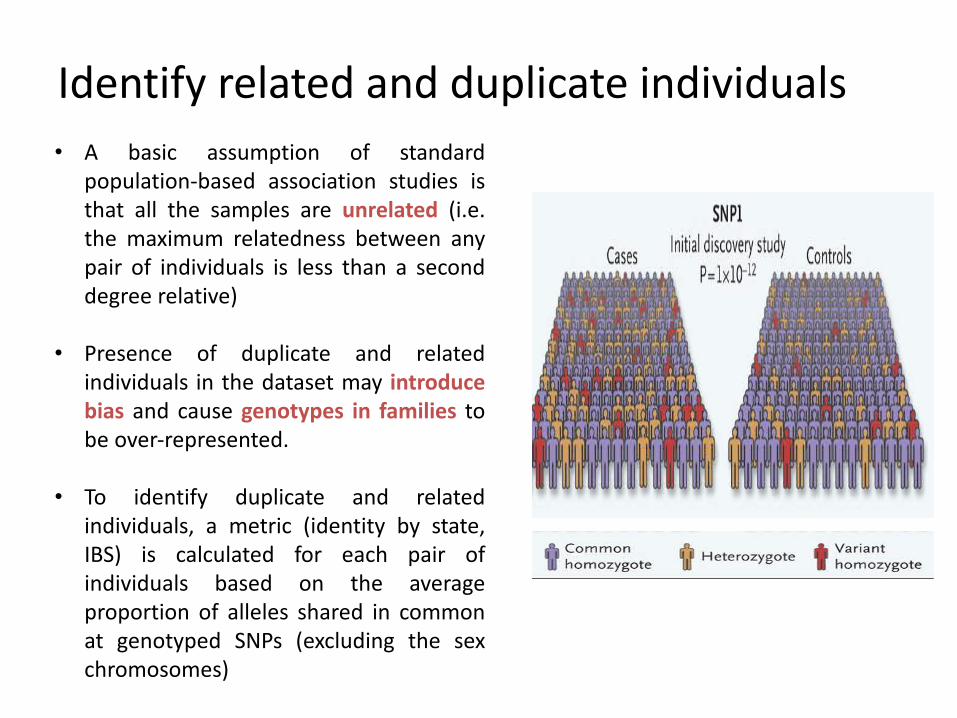
Identify related and duplicate individuals• A basic assumption of standard
population-based association studies isthat all the samples are unrelated (i.e.the maximum relatedness between anypair of individuals is less than a seconddegree relative)
• Presence of duplicate and relatedindividuals in the dataset may introducebias and cause genotypes in families tobe over-represented.
• To identify duplicate and relatedindividuals, a metric (identity by state,IBS) is calculated for each pair ofindividuals based on the averageproportion of alleles shared in commonat genotyped SNPs (excluding the sexchromosomes)
Ziegler�&�Van�Steen� GenomeͲWide�Association�Studies� 25���
�
What�is�the�flow�of�a�genomeͲwide�association�study?�
�
Manolio�2010�N�Engl�J�Med
Ziegler�&�Van�Steen� GenomeͲWide�Association�Studies� 25���
�
What�is�the�flow�of�a�genomeͲwide�association�study?�
�
Manolio�2010�N�Engl�J�Med
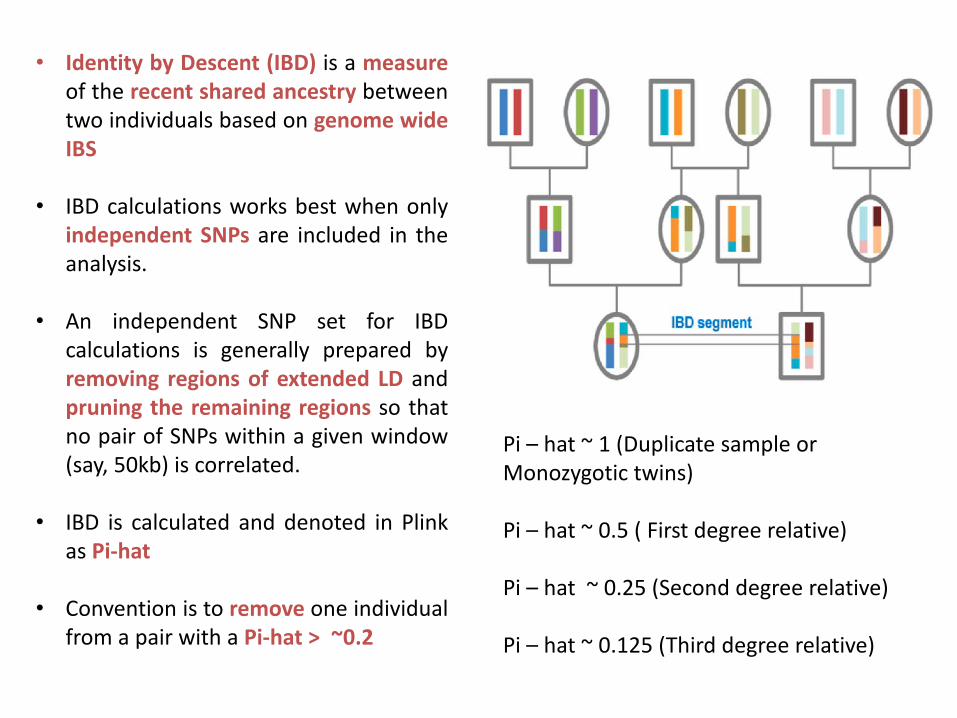
• Identity by Descent (IBD) is a measureof the recent shared ancestry betweentwo individuals based on genome wideIBS
• IBD calculations works best when onlyindependent SNPs are included in theanalysis.
• An independent SNP set for IBDcalculations is generally prepared byremoving regions of extended LD andpruning the remaining regions so thatno pair of SNPs within a given window(say, 50kb) is correlated.
• IBD is calculated and denoted in Plinkas Pi-hat
• Convention is to remove one individualfrom a pair with a Pi-hat > ~0.2
Pi – hat ~ 1 (Duplicate sample or Monozygotic twins)
Pi – hat ~ 0.5 ( First degree relative)
Pi – hat ~ 0.25 (Second degree relative)
Pi – hat ~ 0.125 (Third degree relative)

Identification of duplicated or related individuals
IDENTIFY INDEPENDENT SET OF SNPS WITH NO LDplink --bfile example --exclude high-LD-regions.txt --range --indep-pairwise 50 5 0.2 -–out example
CALCULATE PIHAT FOR ALL PAIRS OF INDIVIDUALS BASED ON SNP SETONLY OUTPUT PAIRS WHERE THE PIHAT > 0.2plink –bfile example –-extract example.prune.in –-genome –min 0.2 -–out example
FILTERING RELATED INDIVIDUALS USING A SCRIPT TO RANDOMLY REMOVE ONE OF EACH PAIR WHERE PIHAT > 0.2perl run-IBD-QC.pl example.genome
creates the file
example.prune.in,
containing the list
of SNPs to be kept
in the analysis.
creates a file
example.genome
containing pairwise
IBS for all pairs of
individuals
• Identify all pairs of individuals with
an IBD > 0.185
• Looks at the individual call rates
stored in example_miss.imiss and
output the ids of the individual with
the lowest call-rate to
‘fail_IBD_example.txt’ for subsequent
removal

Nextflow Parameters
• pi-hat = 0.11• super_pi_hat = 0.7

Population structure
• Population substructure or stratification occurs when samples have different genetic ancestries
• Can lead to spurious associations due to differences in ancestry rather than true associations
• Imperative to check for population structure within samples
• Can control for structure if identified, in downstream analysis
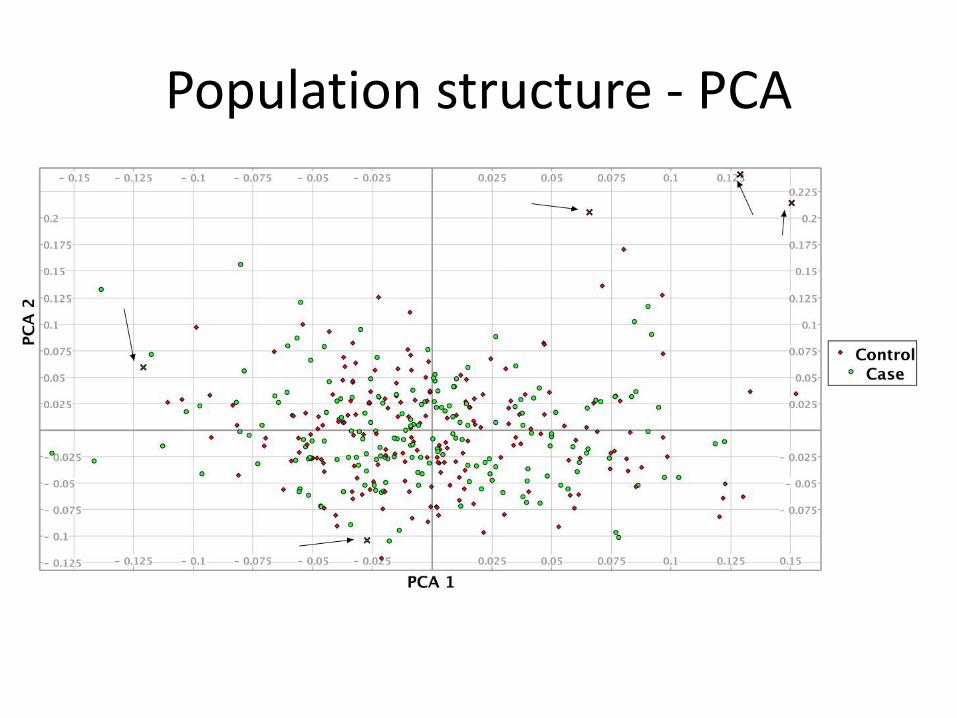
Population structure - PCA

Nextflow Parameters
• case_control = sample.phe• case_control_col = PHE• batch = sample.phe• batch_col = batch_no

Discordant sex information
High Missingness and outlying
heterozygosity rate
Duplicate and related
Divergent ancestry
fail_ancestry_example.txt
fail_IBD_example.txt
fail_miss_het_example.txt
fail_sexcheck_example.txt
JOIN FILEScat fail_* | sort -k1 | uniq > fail_example_inds.txtREMOVE FROM DATAplink --bfile example --remove fail_example_inds.txt --make-bed --out clean_inds_example
Sample QC completed
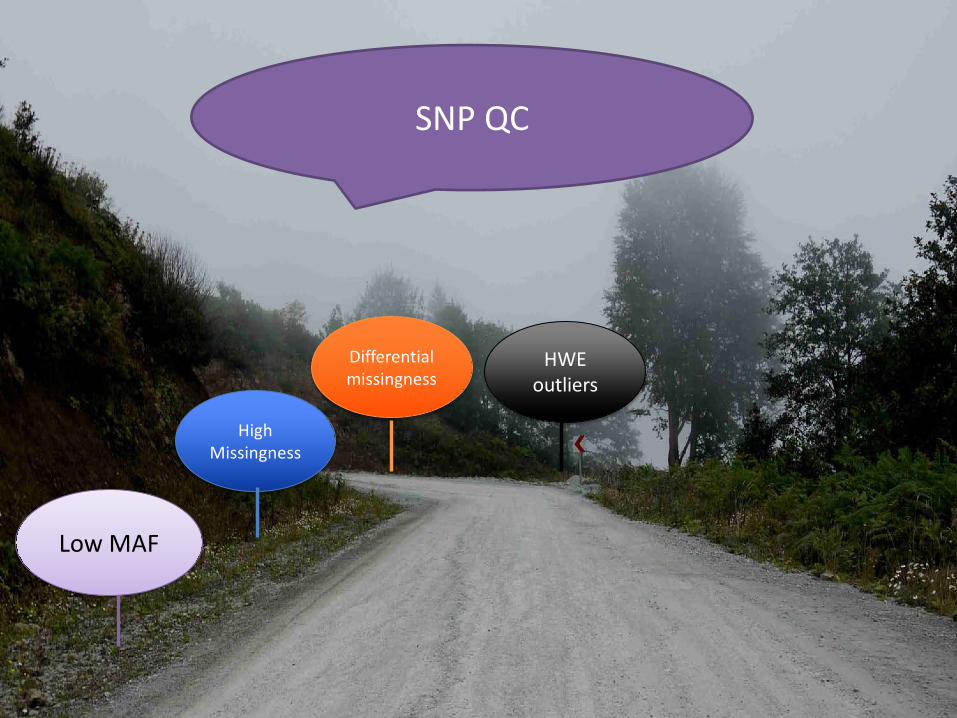
Low MAF
High Missingness
Differential missingness
HWE outliers
SNP QC

Ziegler�&�Van�Steen� GenomeͲWide�Association�Studies� 74���
�
Why�is�sample�size�important�for�genotype�calling?�
SNP�with�low�MAF�
�
• Genotype calling algorithms perform poorly for SNPs with low MAF and low samples sizes.
• Power for detecting associations with SNPs with low MAF is low unless the sample size is very large
• Commonly used exclusion threshold are SNPs with a MAF 0.01 to 0.05 (dependent on sample size)
Low minor allele frequency SNPs

Identify low minor allele frequency SNPs
CALCULATE MINOR ALLELE FREQUENCY DISTRIBUTION FOR ALL SNPS
plink --bfile clean-inds-example --freq --out clean_inds_example_freq
Generates the file “clean_inds_example_freq.frq” containing minor allele frequency of each SNP
GENERATE PLOT OF MAF DISTRIBUTION
PLOT_MAF.R
Choose standard MAF threshold (MAF > 0.01 OR MAF > 0.5) or base on distribution

Nextflow Parameters
• cut_maf = 0.01

High Missingness
Differential missingness
HWE outliers
SNP/Marker QC steps
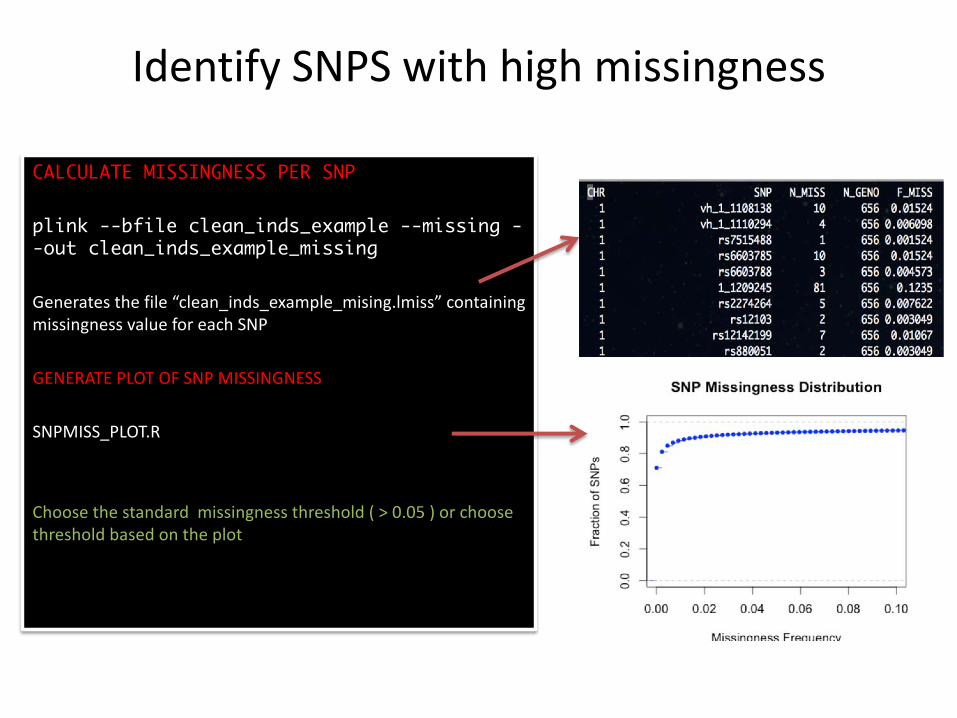
Identify SNPS with high missingness
CALCULATE MISSINGNESS PER SNP
plink --bfile clean_inds_example --missing --out clean_inds_example_missing
Generates the file “clean_inds_example_mising.lmiss” containing missingness value for each SNP
GENERATE PLOT OF SNP MISSINGNESS
SNPMISS_PLOT.R
Choose the standard missingness threshold ( > 0.05 ) or choose threshold based on the plot

Nextflow Parameters
• cut_geno = 0.01
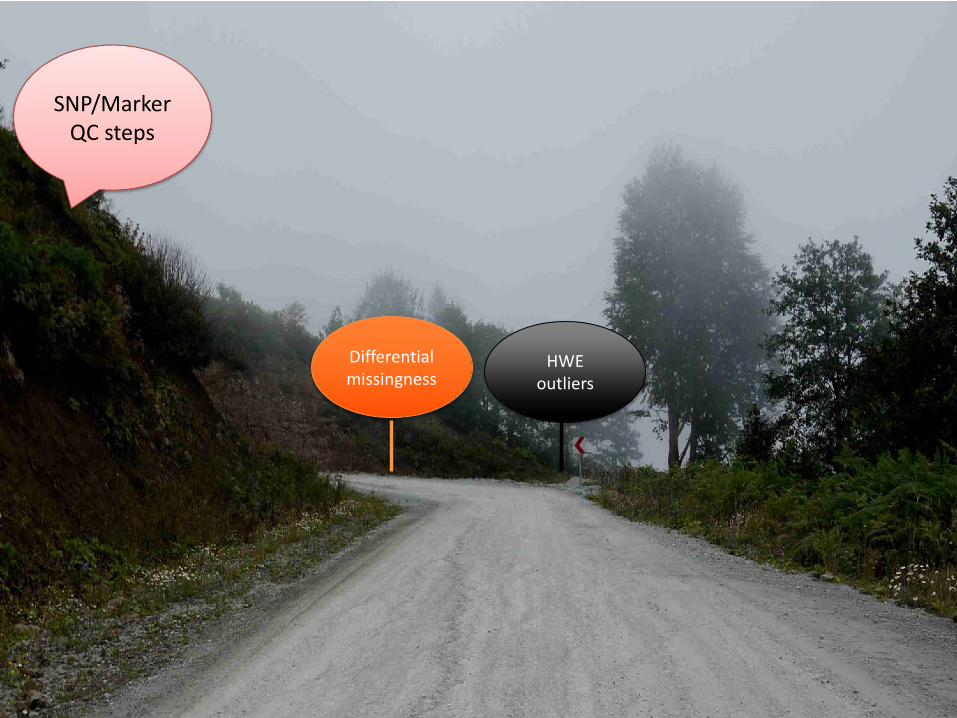
Differential missingness
HWE outliers
SNP/Marker QC steps
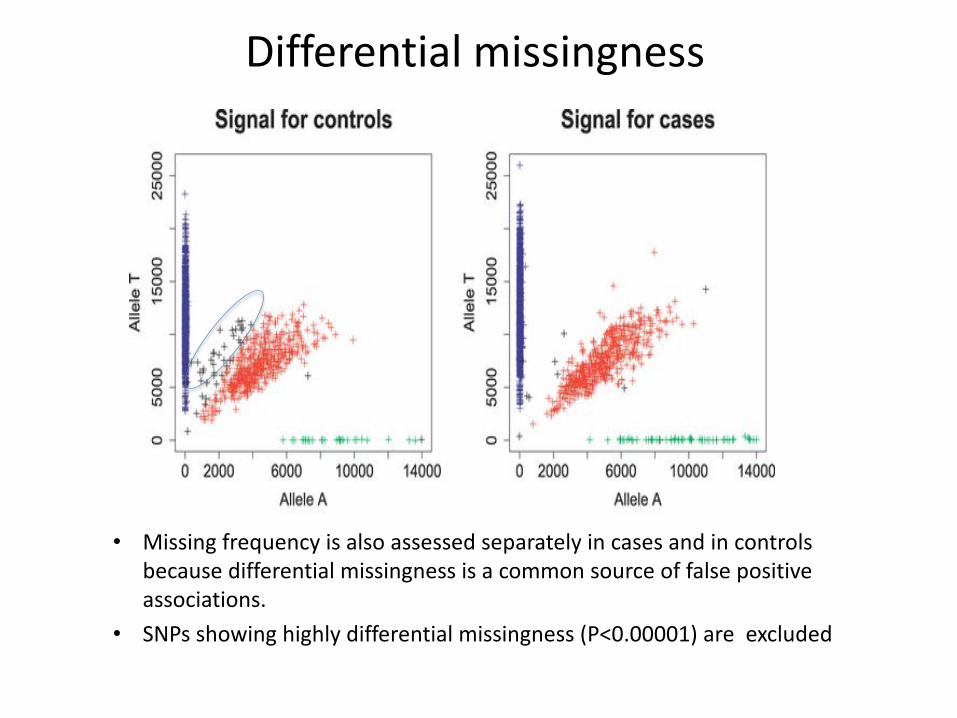
• Missing frequency is also assessed separately in cases and in controls because differential missingness is a common source of false positive associations.
• SNPs showing highly differential missingness (P<0.00001) are excluded
Differential missingness

Identify SNPS with high differential missingness between cases and controls
CALCULATE DIFFERENTIAL MISSINGNESS
plink --bfile clean_inds_example --test-missing --out clean_inds_example_test_missing
Generates the file “example_test_missing.missing” containing differential missingness statistics for each SNP
GENERATE PLOT OF P-VALUE DISTRIBUTION
DIFFMISS_PLOT.R
Choose standard differential missingness p-value threshold (0.00001) or choose on the basis of the plot
Nextflow Parameters
• cut_diff_miss = 0.05

HWE outliers
SNP/Marker QC steps
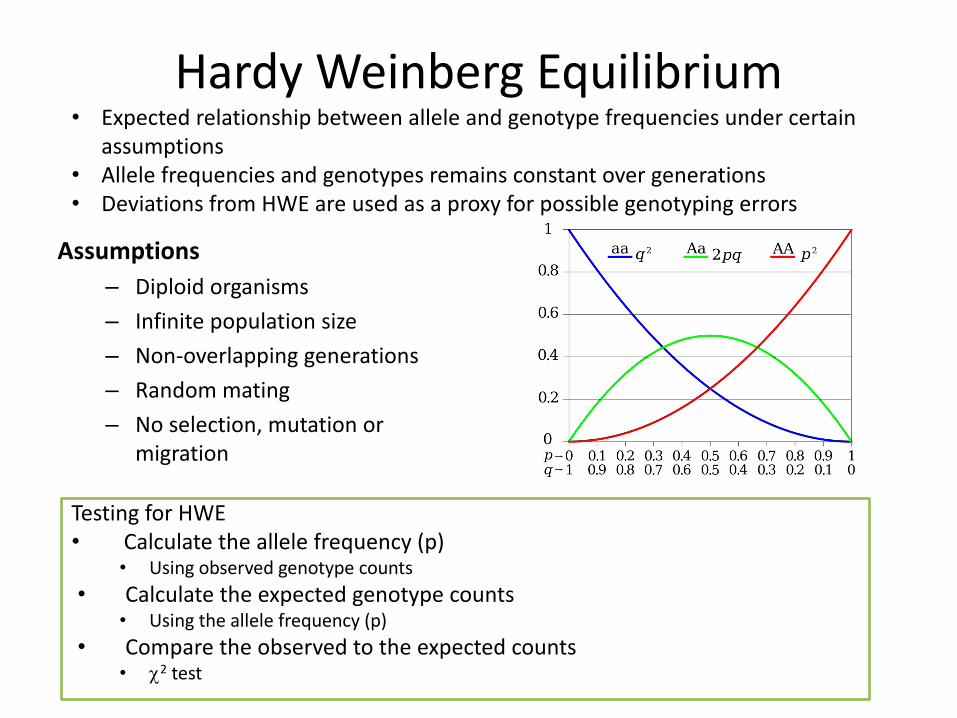
Hardy Weinberg Equilibrium
Assumptions– Diploid organisms
– Infinite population size
– Non-overlapping generations
– Random mating
– No selection, mutation or migration
Testing for HWE• Calculate the allele frequency (p)
• Using observed genotype counts
• Calculate the expected genotype counts• Using the allele frequency (p)
• Compare the observed to the expected counts• c2 test
• Expected relationship between allele and genotype frequencies under certain assumptions
• Allele frequencies and genotypes remains constant over generations• Deviations from HWE are used as a proxy for possible genotyping errors

Reasons for HW Deviations
• Genotyping Error• Subdivided Population
• Excess homozygotes= “Allele dropout in old samples”
• Any violations of the HW assumptions
• SNPs are excluded if substantially more orfewer samples heterozygous at a SNP thanexpected (excess heterozygosity orheterozygote deficiency)
• Threshold for significance 10-3 to 10-6
• Can only remove SNPs in controls whichdeviate from HWE or use less stringent HWEthreshold in SNPs in cases over controls
GENEVA alcohol-dependence project: Quality control report

Identify SNPS which show extreme HWE deviations
GET DISTRIBUTION OF P-VALUES FOR ALL SNPS
plink --bfile clean_inds_example --hardy --out clean_inds_example_hwe
Generates the file “clean_inds_example_hwe.hwe” containing Hardy Weinberg statistics for each SNP separately in cases, controls and all. samples
SELECT UNAFFECTED
head -1 clean_inds_example_hwe.hwe > example_clean_inds_example_hweu.hwe | grep"UNAFF" clean_inds_example_hwe.hwe >> example_clean_inds_example_hweu.hwe
GENERATE PLOT USING R SCRIPT
HWE_PLOT.R
(based only on controls)
Choose the standard HWE P-value threshold (0.00001) or select one on the basis of the plot

Nextflow Parameters
• cut_hwe = 0.000001

Low MAF
High Missingness
Differential missingness
HWE outliers
SNP/Marker QC final plink --bfile clean-inds-example
–-maf 0.01 --geno 0.05 --exclude fail_diffmiss_example.txt--hwe 0.00001 --make-bed --out clean-example
QCed data ready for assoc !!
plink --noweb -–bflie clean-example --chr X--make-bed --out xsnpsplink --noweb --bfile clean-example --exclude x_snps --make-bed --out qced_example
`in most cases you would need
additionally to remove the X and Y
chromosomes


Acknowledgments
• Ananyo Choudhury• H3ABioNet funded by NHGRI grant number
U41HG006941