gwi infographic - tablet users

1
21% Tablet Users USAGE OVER TIME Y-ON-Y GROWTH IN USER NUMBERS USAGE BY AGE USAGE BY AUDIENCE OPERATING SYSTEMS BY REGION AND COUNTRY DEVICE SHARING COMMERCE SECOND - SCREENING CONTENT SOCIAL TABLET SECOND- SCREENERS MOST LIKELY TO USE... Philippines Indonesia India Latin America 35-44s Bottom Quartile Singapore Australia Sweden North America 25-34s Top Quartile LOWER Income Quartile 2011 2012 2013 2014 MIDDLE Income Quartiles TOP Income Quartile MILLENNIALS 32% GEN X 36% 26% 36% 51% BOOMERS 25% 51% 59% PARENTS 38% BUSINESS TRAVELERS TECH INFLUENCERS ATTITUDES & INTERESTS 20% 20% HALF 2/3 95% MORE likely to buy brands they see advertised and try new products MORE interested in gadgets, beauty products and fashion say they like to keep up with the latest fashions say they tend to buy premium versions of products describe them- selves as brand conscious use the internet to research products 3 in 5 HAVE 2nd SCREENED VIA ANY DEVICE WHILE WATCHING TELEVISION 3 in 5 using their tablet 82% Have bought a product online in the last month via any device. 3in4 Have reviewed a product or brand in last month 50% Use search engines or consumer reviews when researching products A QUARTER Have posted online opinions about fashion, travel or technology in the last month MORE likely to second screen in order to interact with a TV show’s online content of tablet second-screeners are chatting to friends. 1 in 2 are searching for products to buy 50% MORE likely to talk about cars, nights out or financial products online 1in2 Have bought something via their tablet in last month 90% Find out more: www.globalwebindex.net /// @globalwebindex /// +globalwebindex 46% 29% 27% 25% 13% MOST Likely to follow: FRIENDS: 78% FAVORITE BRANDS: 56% ACTORS: 44% MORE LIKELY TO USE ALL OF THE TOP 10 SOCIAL NETWORKS A THIRD HAVE “LIKED” A BRAND IN THE LAST MONTH MORE 30 % LIKELY TO FOLLOW BRANDS THEY ARE THINKING ABOUT BUYING FROM ACTIVE USAGE OF SOCIAL PLATFORMS 33% 75% MORE LIKELY THAN OTHERS TO HAVE UPLOADED A VIDEO HAVE PAID FOR SOME FORM OF DIGITAL CONTENT - 15% HIGHER THAN OTHERS A THIRD have streamed live TV via their tablet in the last month TWO THIRDS have watched a video clip on their tablet A QUARTER have watched a branded video in the last month 1 in 2 HAVE USED THEIR TABLET TO WATCH TV ON DEMAND IN LAST MONTH 2011 2012 2013 2014 10% 17% 23% 25% 60% 50% 35% 32% 33% 33% 32% North America Asia Pacific Middle East & Africa Latin America Europe TOP 10 MARKETS Ireland Singapore China Mexico UK Turkey Russia USA Hong Kong Spain 38% 42% 36% 41% 36% 41% 36% 40% 35% 39% of users SHARE their device with other people share their tablet with 3 OR MORE others 55% 13% TWO THIRDS OR MORE SHARE THEIR TABLET IN: ARGENTINA VIETNAM MEXICO FRANCE PHILIPPINES 55-64s LEAST likely to share their tablet. Parents are the MOST likely USING ANDROID USING IOS 54% 37% 2012 2011 2013 2014 187% 97% 14% Tablet users are defined as those who say they have accessed the internet via a tablet within the last month. Unless stated otherwise, all figures are taken from our Q2 2014 wave of online research among 41,853 adults aged 16-64 in 32 countries. 8% 9% 12% 17% Q1 Q2 Q4 Q2 Q4 Q1 Q2 Q3 Q4 Q1 Q2 50% 50% 50% 50% 50% 50% 50% 50% 50% 50% 50% 22% 22% 16 to 24 25 to 34 35 to 44 45 to 54 55 to 64 29 % 38 % 37 % 29 % 24 % 11 % 13 % 8 % 6 % 5 % 2014 2011 31% 29% 30% 30% 33% 33% 33%

Upload: globalwebindex

Post on 20-Aug-2015

1.234 views

Category:

Technology


0 download

TRANSCRIPT

21%

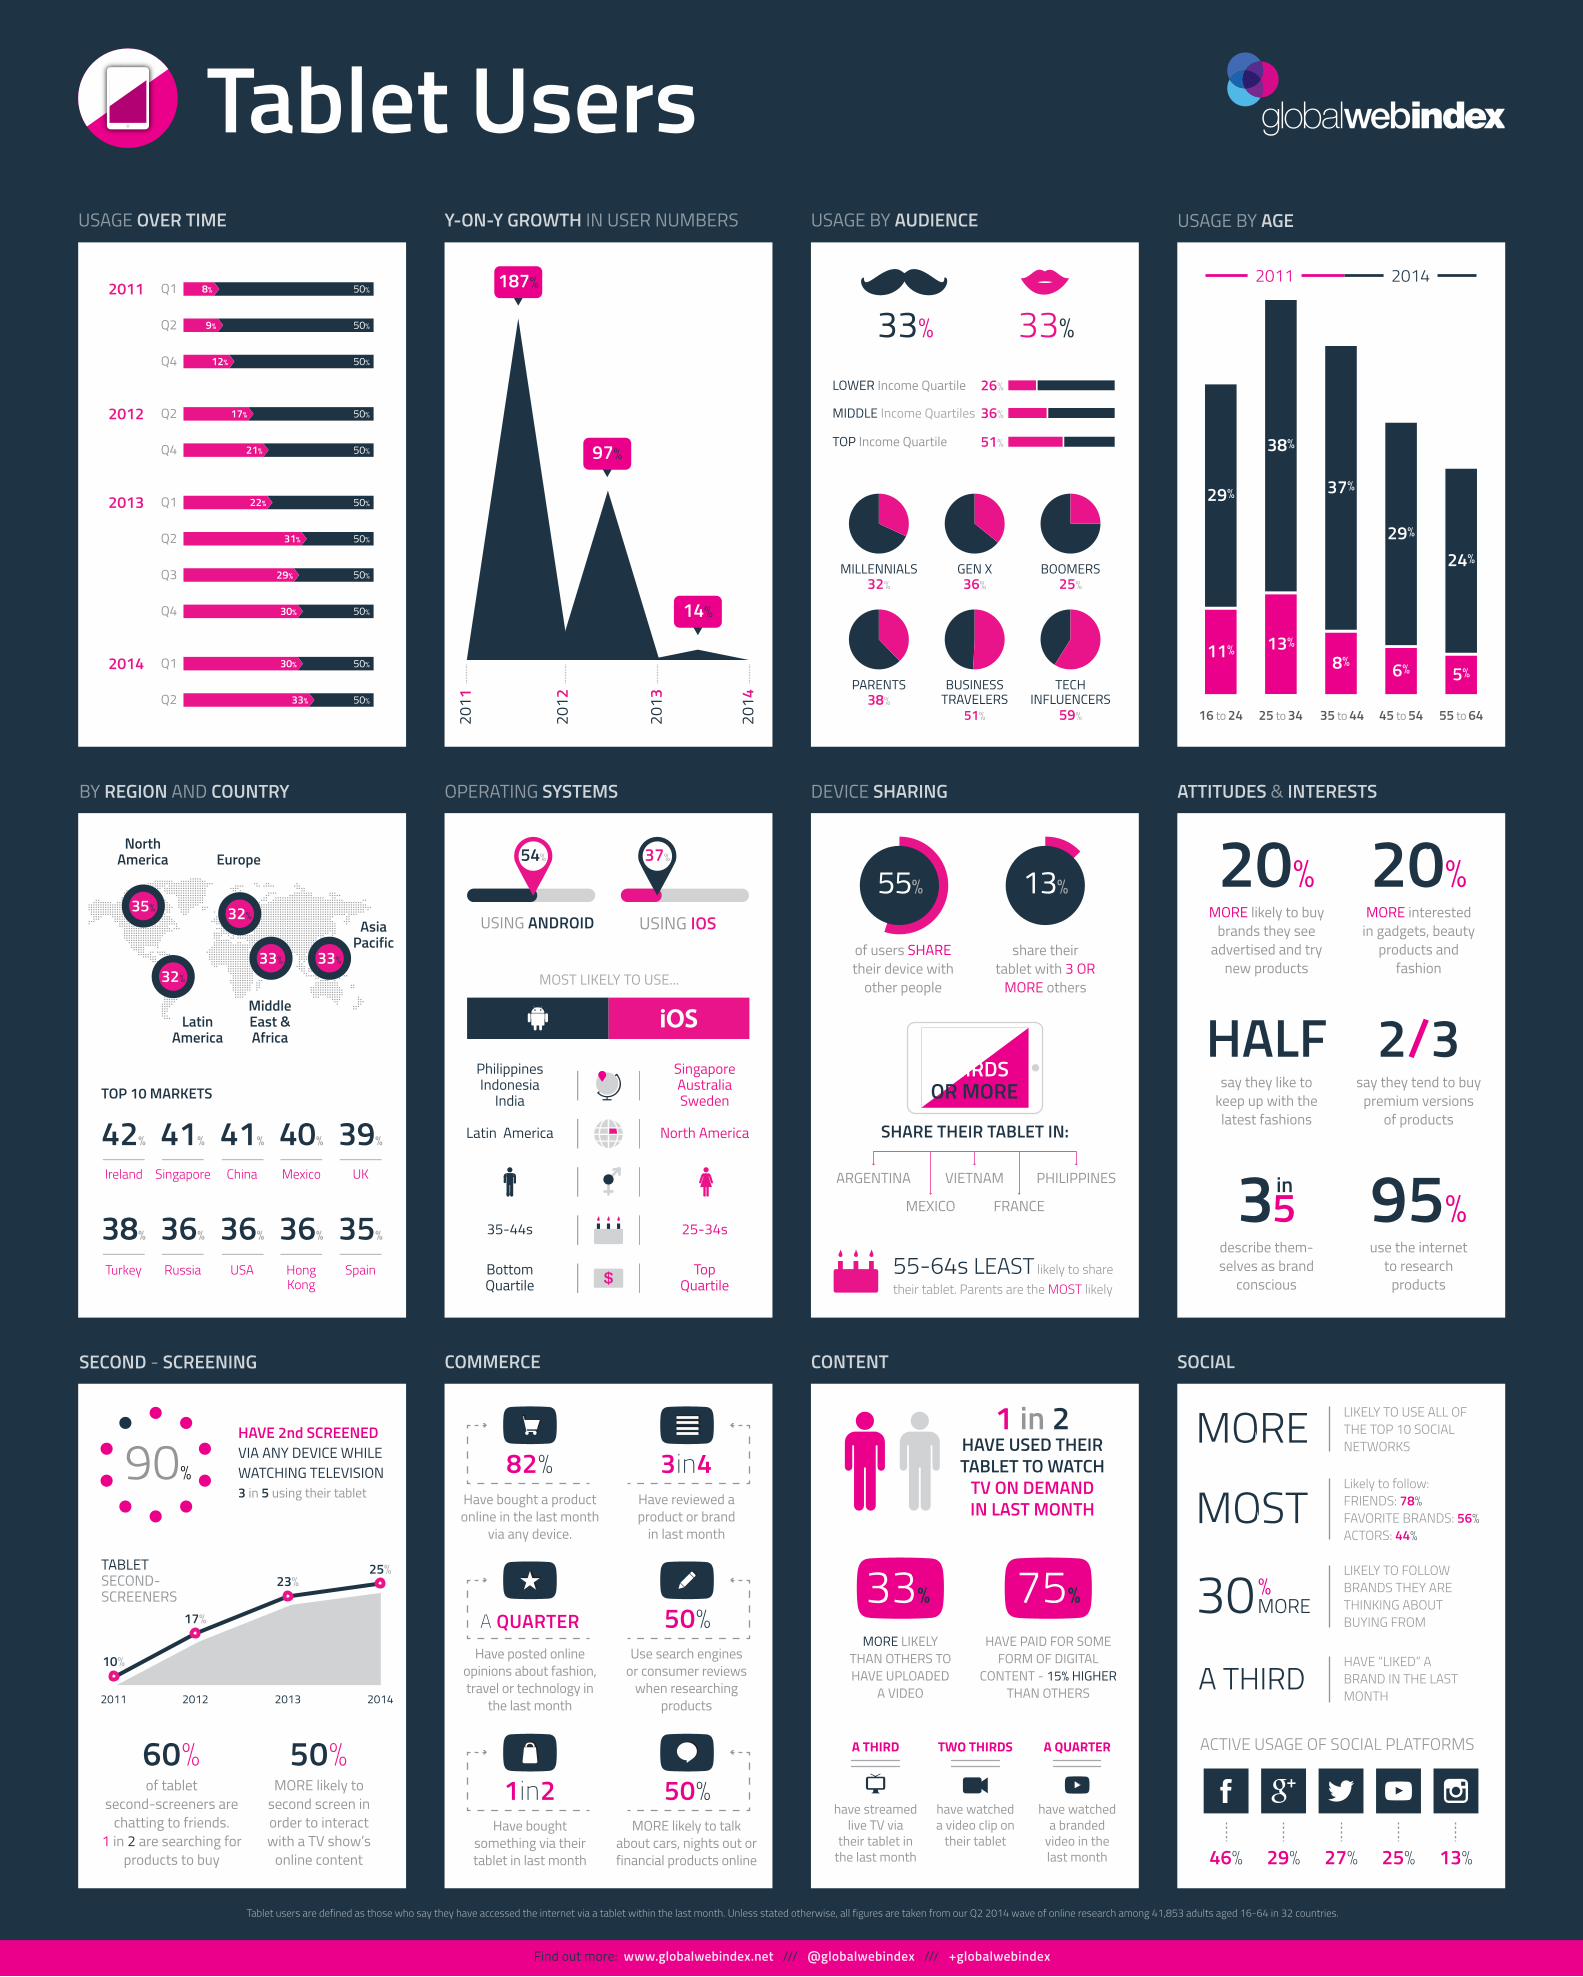
Tablet UsersUSAGE OVER TIME Y-ON-Y GROWTH IN USER NUMBERS USAGE BY AGEUSAGE BY AUDIENCE

OPERATING SYSTEMSBY REGION AND COUNTRY DEVICE SHARING

COMMERCESECOND - SCREENING CONTENT SOCIAL

TABLETSECOND-SCREENERS

MOST LIKELY TO USE...

PhilippinesIndonesia

India

Latin America

35-44s

BottomQuartile

SingaporeAustraliaSweden

North America

25-34s

TopQuartile

LOWER Income Quartile

2011

2012

2013

2014

MIDDLE Income Quartiles

TOP Income Quartile

MILLENNIALS32%

GEN X36%

26%

36%

51%

BOOMERS25%

51% 59%

PARENTS38%

BUSINESSTRAVELERS

TECHINFLUENCERS

ATTITUDES & INTERESTS

20% 20%

HALF 2/3

95%

MORE likely to buy brands they see

advertised and try new products

MORE interested in gadgets, beauty

products and fashion

say they like to keep up with the latest fashions

say they tend to buy premium versions

of products

describe them-selves as brand

conscious

use the internet to research

products

3in5

HAVE 2nd SCREENED VIA ANY DEVICE WHILE WATCHING TELEVISION3 in 5 using their tablet

82%Have bought a product online in the last month

via any device.

3in4Have reviewed a product or brand

in last month

50%Use search engines

or consumer reviews when researching

products

A QUARTERHave posted online

opinions about fashion, travel or technology in

the last month

MORE likely to second screen in order to interact with a TV show’s

online content

of tablet second-screeners are

chatting to friends.1 in 2 are searching for

products to buy

50%MORE likely to talk

about cars, nights out or financial products online

1in2Have bought

something via their tablet in last month

90%

Find out more: www.globalwebindex.net /// @globalwebindex /// +globalwebindex

46% 29% 27% 25% 13%

MOSTLikely to follow:FRIENDS: 78%FAVORITE BRANDS: 56%ACTORS: 44%

MORE LIKELY TO USE ALL OF THE TOP 10 SOCIAL NETWORKS

A THIRDHAVE “LIKED” A BRAND IN THE LAST MONTH

MORE30%LIKELY TO FOLLOW BRANDS THEY ARE THINKING ABOUT BUYING FROM

ACTIVE USAGE OF SOCIAL PLATFORMS

33% 75%

MORE LIKELY THAN OTHERS TO HAVE UPLOADED

A VIDEO

HAVE PAID FOR SOME FORM OF DIGITAL

CONTENT - 15% HIGHER THAN OTHERS

A THIRD

have streamed live TV via

their tablet in the last month

TWO THIRDS

have watched a video clip on

their tablet

A QUARTER

have watcheda branded

video in the last month

1 in 2HAVE USED THEIR TABLET TO WATCH

TV ON DEMANDIN LAST MONTH

2011 2012 2013 2014

10%

17%

23%25%

60% 50%

35%

32%

33%33%

32%

NorthAmerica

AsiaPacific

MiddleEast &Africa

LatinAmerica

Europe

TOP 10 MARKETS

Ireland Singapore China Mexico UK

Turkey Russia USA Hong Kong

Spain

38%

42%

36%

41%

36%

41%

36%

40%

35%

39%

of users SHARE their device with

other people

share their tablet with 3 OR

MORE others

55% 13%

TWOTHIRDS

OR MORE

SHARE THEIR TABLET IN:

ARGENTINA VIETNAM

MEXICO FRANCE

PHILIPPINES

55-64s LEAST likely to share their tablet. Parents are the MOST likely

USING ANDROID USING IOS

54% 37%

2012

2011

2013

2014

187%

97%

14%

Tablet users are defined as those who say they have accessed the internet via a tablet within the last month. Unless stated otherwise, all figures are taken from our Q2 2014 wave of online research among 41,853 adults aged 16-64 in 32 countries.

8%

9%

12%

17%

Q1

Q2

Q4

Q2

Q4

Q1

Q2

Q3

Q4

Q1

Q2

50%

50%

50%

50%

50%

50%

50%

50%

50%

50%

50%

22%22%

16 to 24 25 to 34 35 to 44 45 to 54 55 to 64

29%

38%

37%

29%

24%

11% 13%8% 6% 5%

20142011

31%

29%

30%

30%

33%

33%33%