gwi social - thewebmate
TRANSCRIPT
1
GWI SOCIALGLOBALWEBINDEX’S QUARTERLY REPORT ON THE LATEST TRENDS IN SOCIAL NETWORKING
Q1 2015
2
INDEX
INTRODUCTION
KEY TRENDS AND IMPLICATIONS
CHANGING BEHAVIORS
TOP SOCIAL NETWORKS
FASTEST GROWING NETWORKS
APPS
AGE TRENDS
FUTURE OUTLOOK
PAGE
03
05
06
13
23
29
33
36
3
INTRODUCTIONGWI Social is where GlobalWebIndex presents the very latest figures for social networking behaviors and engagement levels across 33 global markets. Drawing on our Q1 2015 wave of research among 47,622 online adults, we highlight a range of demographic, region and market specific trends and offer insights on:
• The most popular social networks and apps, including rates of growth during the last year• Time spent on networking, as well as how many platforms the average person is using• The growing importance of mobiles and messaging apps• Trends among younger groups, and teens in particular
By analyzing such recent and robust data – which is representative of 90% of the global internet audience – we are able to cut through the headlines and hype to provide a unique understanding of what’s actually happening within the social media landscape.
CUSTOM REPORTS AND INFOGRAPHICS
Need a market-specific look at this subject? Or want to explore these behaviors and trends for a particular audience?
GWI can customize any of our reports or infographics to reflect your target groups or priority markets. This option allows existing data to be re-cut by any of the audiences, countries, behaviors or attitudes tracked in the GlobalWebIndex survey – with final outputs featuring tailored commentary and professionally designed visuals. For more information, get in touch with the Trends team – [email protected].
PRO USER?
Create custom audiences in our Audience Builder and explore their demographics and digital behaviors to help you target the customers you want. From Celeb Fans to Early Tech Adopters, Snapchatters to Teens, use our powerful PRO platform to create bespoke audiences based on shared interests, demographics, attitudes or behaviors. To start, click on ‘My Audiences’ in PRO.
Alternatively, choose from our extensive list of Default Audiences, covering the most important demographics and marketing personas, as well as all of the audiences covered in past reports.
RELATED CONTENT
For further detail on some of the subjects and networks covered in this report, please download the following:
• GWI Profiles – showcasing key trends and numbers for some of the world’s largest social networks, apps, digital brands and media providers – including Facebook and Twitter
• Twitter Users – Profiling the demographics, attitudes and digital behaviors of Twitter’s Active Users
• Social Networking Motivations – profiling the top reasons for using social media across demographics and between countries
• Market Reports – in-depth explorations of social and digital trends in each of GWI’s countries
• Social Media Engagement – going beyond the simple MAU metric to analyze how people are accessing social platforms, how frequently active users are logging in, how much time is spent per day on social networks and exactly what activities are taking place
• GWI Trends – tackling the stories of the moment, including the size of Instagram’s audience, the importance of Twitter’s logged-out visitors and the spread of Multi-Networking

4
GWI’s USAGE DEFINITIONS
SAMPLE SIZES AND UNIVERSE FIGURES
CHINA
NOTES ON METHODOLOGY
Each year, GWI interviews 200,000 internet users across 33 markets – making it the largest on-going study into the digital consumer instigated to date. Research is conducted in quarterly waves, each of which has a global sample size of 45,000 – 50,000 internet users. Typically, we interview between 3,000 and 8,000 people per year per market, with larger sample sizes in key countries such as the UK and the US (30,000 each). Data is collected in the last six weeks of every quarter, ensuring it is as up-to-date as possible. In this particular report, we draw primarily on our Q1 2015 wave of research among 47,622 adults.
Respondents complete an online questionnaire that uses stratified sampling techniques to ensure that they are representative of the internet population aged 16 to 64 in each country (with correct proportions in terms of gender, age and educational attainment).
This data is also used to calculate our universe estimates – figures which are designed to provide highly informed approximations as to the number of users (in millions) that any percentage represents.
We measure three forms of engagement with social platforms, defined as follows:
• Account Ownership/Membership – those who say they have an account on a social network
• Visitation – those who say they have visited the network in question in the last month (via any device)
• Active Usage – those who have an account and say they have used or contributed to the network in the last month (via any device)
These definitions are consistent across all of the platforms we track and thus allow accurate comparisons between networks. In contrast, self-published figures from social networks tend to use a wide and competing range of factors, but would typically utilize ‘Visitation’ as a definition of ‘Active Usage’. To see an example of this and explore GWI’s numbers in more detail, please download the Understanding Facebook’s User Numbers trend from the Insight Store.
In addition to using local networks, it’s clear that large
numbers of internet users in China are connecting to
major global platforms such as Facebook via VPNs,
Proxy Servers and other tools – something we address
in the charts dedicated to Chinese social networking and
which we explore further in our Market Report on China’s
internet population.
However, due to the sheer scale of the Chinese market,
its high number of local social networks and the official
restrictions it places on platforms such as Facebook and
Twitter, China is excluded from most of the global charts featured in this report which track specific/named platforms (see the base of each one for confirmation).
EMEABelgium • France • Germany • Ireland • Italy • Netherlands • Poland • Russia • Saudi Arabia • South Africa • Spain • Sweden • Turkey • UAE • UK
AMERICASArgentina • Brazil •
Canada • Mexico • USA
APACAustralia • China • Hong Kong • India • Indonesia • Japan • Malaysia • Philippines • Singapore • South Korea • Taiwan • Thailand • Vietnam
5
• 1 in every 4 minutes spent on the internet is on a social network, with the typical online adult now devoting 1.69 hours to networking each day.
• A quarter of internet users in the US and UK are interested in using the Apple Watch, but this jumps much higher among social networkers – hitting 41% for Twitter users, 43% for Snapchatters, 44% for Instagrammers, 48% for WhatsAppers and an impressive 75% for WeChatters.
• Facebook still has the most members (82%) and active users (42%), but is the only major network to have seen a drop in active usage during the last year (-9%). And, on a monthly basis, more people are visiting YouTube (81%) than Facebook (73%). That said, over 50% of Facebook’s active users are engaging with the site more than once a day – far higher than the equivalent figure on any other network. What’s more, 26% of US/UK internet users are interested in Facebook At Work, with the figure peaking at 49% among LinkedIn users.
• Ello has failed to make an impact; just 5% of people are actively using it.
• Pinterest (+97%), Tumblr (+95%) and Instagram (+47%) were the biggest climbers in the social networking space last year, while LINE (+57%), Facebook Messenger (+53%) and Snapchat (+45%) were the fastest growing apps.
• Teens are 3.5x more likely than average to be on Snapchat, while 16-24s over-index the most for using social networks to ensure they don’t miss out on anything (being 50% ahead on this metric).
• 44% of adults are now networking via mobiles, with 25-34s leading the way on 52%.
• Multi-networking is prolific; on average, people now have accounts on 5.39 social networks and are actively using 2.75 of them. The impact of this on the Facebook audience is clear to see: whereas the average Facebooker was actively using 2.56 social networks back in 2012, they are now active on 4.15.
• There’s huge cross-over between the top networks. Some 93% of Twitter’s active users have a Facebook account, for example, as do 90% on YouTube.
• Clicking the “like” button is the top behavior on Facebook; about three quarters of active users did this last month, giving Atlas a rich source of information about an individual’s preferences. What’s more, although active usage has been slipping, visitation remains high and stable (about 3 in 4 online adults visit it each month). And, for ads to be targeted accurately, people don’t need to be actively interacting with the site, they just need to be visiting.
• Globally, 150 million internet users are turning to VPNs in order to access restricted social networks; by far the biggest audience for this behavior is to be found in China (75 million). That helps to explain why banned social networks such as Facebook and Twitter nevertheless have important user bases in this country (with close to a fifth using both of them). Even so, Sina Weibo remains by far the top Chinese network (55% actively using), with WeChat the dominant messaging app (62%).
KEY TRENDS AND IMPLICATIONS1
6
CHANGING BEHAVIORSEvolutions in the socialnetworking space2
KEY HEADLINES
• Multi-networking is widespread: the average digital consumer is now a member of 5.39 networks and is actively using 2.75 of them.
• 1 in every 4 of the minutes we spend online is being devoted to social networking. Typically, people now spend 1.69 hours per day on this activity – with the figure rising higher among younger demographics and in fast-growth markets.
• Over a third of mobile networkers are interested in using the Apple Watch, suggesting that social behaviors could be some of the first to migrate to smartwatches if and when this market moves beyond the niche to enter the mainstream. Instagram (44%), WhatsApp (48%) and WeChat (75%) users are some of the most interested in this new device.
OVER 2 IN 5 ARE NETWORKING VIA MOBILES – BUT SMARTWATCHES ARE COMING
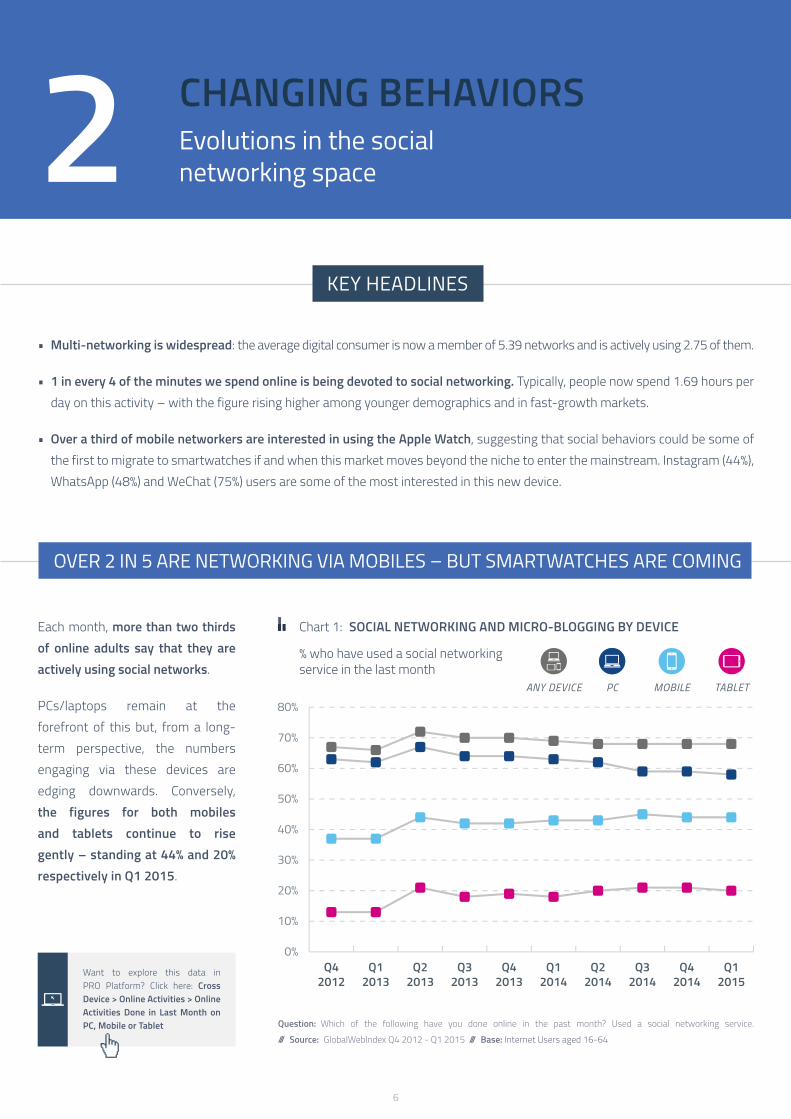
Chart 1: SOCIAL NETWORKING AND MICRO-BLOGGING BY DEVICE
% who have used a social networking service in the last month
Each month, more than two thirds of online adults say that they are actively using social networks.
PCs/laptops remain at the forefront of this but, from a long-term perspective, the numbers engaging via these devices are edging downwards. Conversely, the figures for both mobiles and tablets continue to rise gently – standing at 44% and 20% respectively in Q1 2015.
Question: Which of the following have you done online in the past month? Used a social networking service.
/// Source: GlobalWebIndex Q4 2012 - Q1 2015 /// Base: Internet Users aged 16-64
Want to explore this data in PRO Platform? Click here: Cross Device > Online Activities > Online Activities Done in Last Month on PC, Mobile or Tablet
7
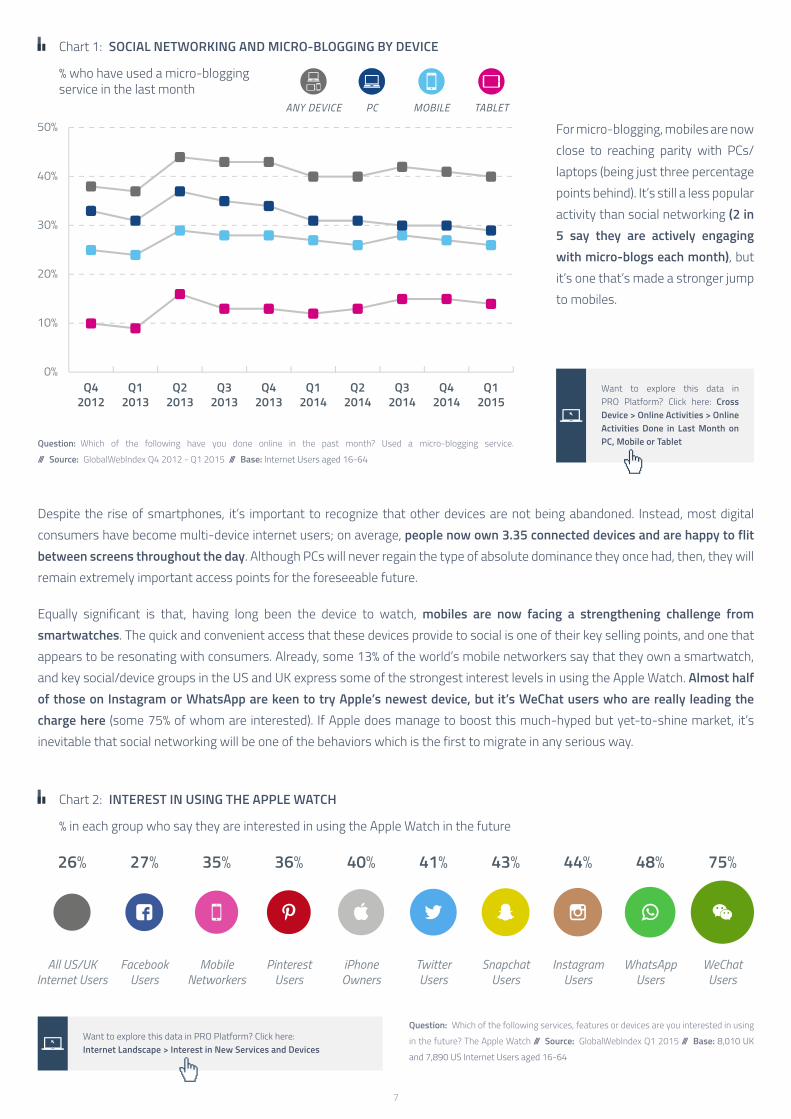
Chart 1: SOCIAL NETWORKING AND MICRO-BLOGGING BY DEVICE
% who have used a micro-blogging service in the last month
Question: Which of the following have you done online in the past month? Used a micro-blogging service.
/// Source: GlobalWebIndex Q4 2012 - Q1 2015 /// Base: Internet Users aged 16-64
Want to explore this data in PRO Platform? Click here: Cross Device > Online Activities > Online Activities Done in Last Month on PC, Mobile or Tablet
For micro-blogging, mobiles are now close to reaching parity with PCs/laptops (being just three percentage points behind). It’s still a less popular activity than social networking (2 in 5 say they are actively engaging with micro-blogs each month), but it’s one that’s made a stronger jump to mobiles.
Despite the rise of smartphones, it’s important to recognize that other devices are not being abandoned. Instead, most digital consumers have become multi-device internet users; on average, people now own 3.35 connected devices and are happy to flit between screens throughout the day. Although PCs will never regain the type of absolute dominance they once had, then, they will remain extremely important access points for the foreseeable future.
Equally significant is that, having long been the device to watch, mobiles are now facing a strengthening challenge from smartwatches. The quick and convenient access that these devices provide to social is one of their key selling points, and one that appears to be resonating with consumers. Already, some 13% of the world’s mobile networkers say that they own a smartwatch, and key social/device groups in the US and UK express some of the strongest interest levels in using the Apple Watch. Almost half of those on Instagram or WhatsApp are keen to try Apple’s newest device, but it’s WeChat users who are really leading the charge here (some 75% of whom are interested). If Apple does manage to boost this much-hyped but yet-to-shine market, it’s inevitable that social networking will be one of the behaviors which is the first to migrate in any serious way.
Chart 2: INTEREST IN USING THE APPLE WATCH
% in each group who say they are interested in using the Apple Watch in the future
Question: Which of the following services, features or devices are you interested in using
in the future? The Apple Watch /// Source: GlobalWebIndex Q1 2015 /// Base: 8,010 UK
and 7,890 US Internet Users aged 16-64
Want to explore this data in PRO Platform? Click here: Internet Landscape > Interest in New Services and Devices
8
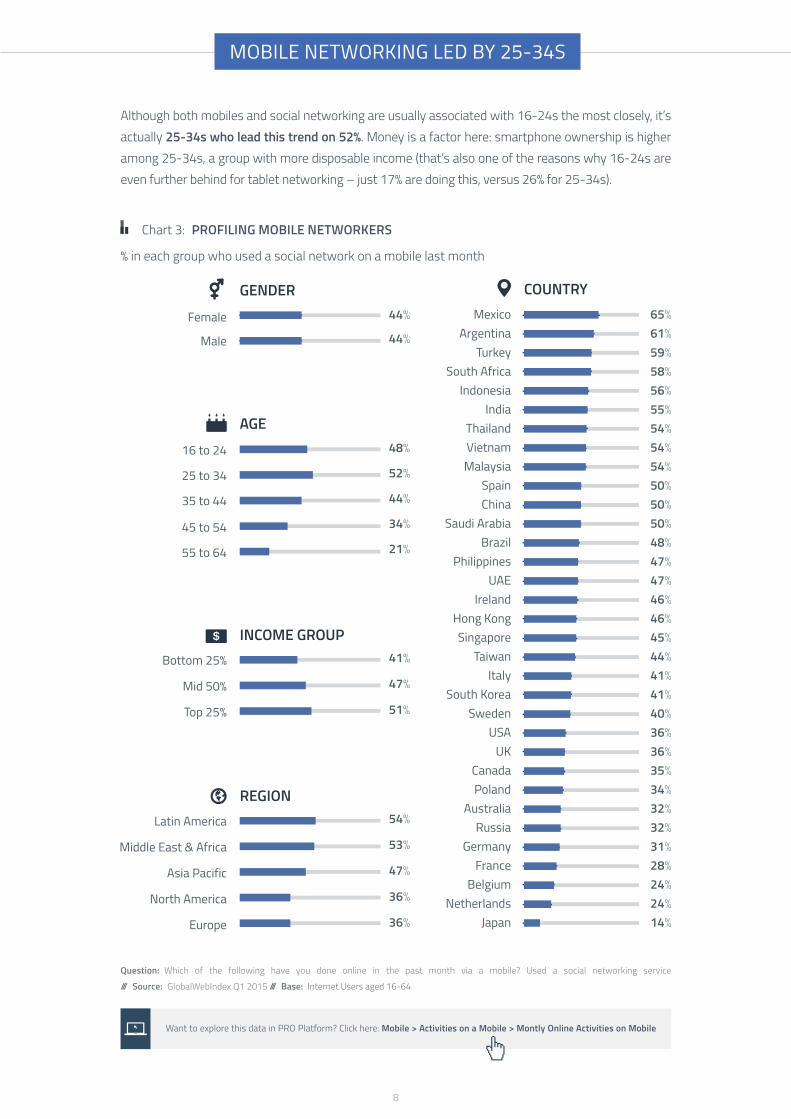
MOBILE NETWORKING LED BY 25-34S
Chart 3: PROFILING MOBILE NETWORKERS
% in each group who used a social network on a mobile last month
Although both mobiles and social networking are usually associated with 16-24s the most closely, it’s actually 25-34s who lead this trend on 52%. Money is a factor here: smartphone ownership is higher among 25-34s, a group with more disposable income (that’s also one of the reasons why 16-24s are even further behind for tablet networking – just 17% are doing this, versus 26% for 25-34s).
Question: Which of the following have you done online in the past month via a mobile? Used a social networking service
/// Source: GlobalWebIndex Q1 2015 /// Base: Internet Users aged 16-64
Want to explore this data in PRO Platform? Click here: Mobile > Activities on a Mobile > Montly Online Activities on Mobile
9
But there are others issues to note too, not least that – being the original adopters on sites like Facebook – it is 25-34s who remain the most loyal to older platforms. The very youngest digital consumers are some of the biggest users of chat apps, having moved slightly away from the “traditional” networks.
Across the other demographic measures, there’s absolutely no difference by gender. In contrast, mobile networking rises directly in line with income, being another area where the likelihood of each group owning a smartphone has a clear impact on the results.
By region, Europe and North America are noticeably behind the others (only just over a third in both of these continents are engaging with mobile networking). The demographics of online populations in these regions is highly relevant here, though. With most fast-growth countries still having relatively low internet penetration rates, their online populations tend to be skewed towards young, urban and affluent demographics (all of these being factors which boost the propensity of engaging with mobile networking). In countries like India and
Indonesia, for example, internet penetration is still below 20%, meaning that Millennials account for the large majority of adults who are online. In contrast, internet penetration is much higher in the US, Canada and in most European markets; that means older groups are much better represented in these markets. But as we saw above, these older groups are some of the least likely to be networking on mobiles; in turn, this impacts the corresponding national and regional averages.
Equally important is the more comprehensive role that mobiles have played in the development of the web within fast-growth regions; PCs and laptops have always been less fundamental to the infrastructure of the internet in regions like APAC, LatAm and MENA.
All of this has an obvious influence on the mobile networking rates by country: there’s a fairly neat divide between fast-growth markets in the top half and mature nations in the lower section. Mexico is the most active mobile networking market of all; nearly two thirds of its internet users are doing this. At the other end of the spectrum, Japan, Australia and several European markets are much less engaged.
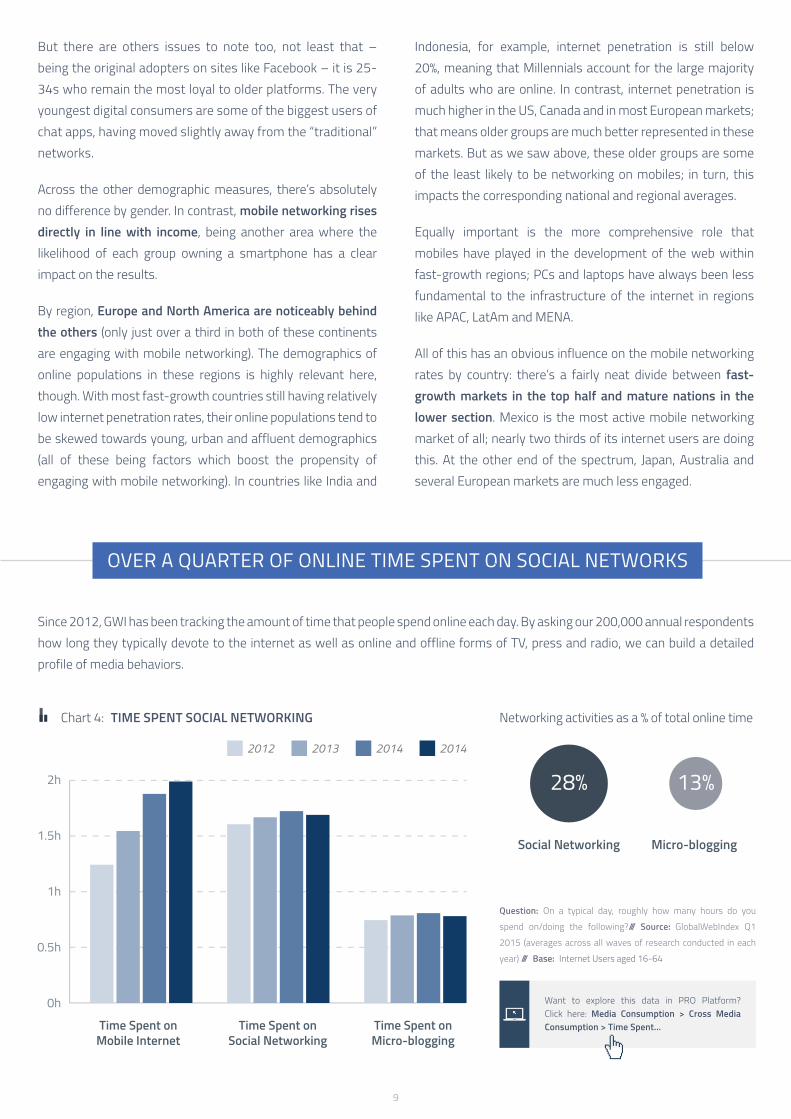
OVER A QUARTER OF ONLINE TIME SPENT ON SOCIAL NETWORKS
Since 2012, GWI has been tracking the amount of time that people spend online each day. By asking our 200,000 annual respondents how long they typically devote to the internet as well as online and offline forms of TV, press and radio, we can build a detailed profile of media behaviors.
Chart 4: TIME SPENT SOCIAL NETWORKING Networking activities as a % of total online time
Question: On a typical day, roughly how many hours do you
spend on/doing the following?/// Source: GlobalWebIndex Q1
2015 (averages across all waves of research conducted in each
year) /// Base: Internet Users aged 16-64
Want to explore this data in PRO Platform? Click here: Media Consumption > Cross Media Consumption > Time Spent…
10
Year-on-year trends in this area show some pretty striking developments. Firstly, despite ongoing claims that the social networking “bubble” has burst, the daily time that digital consumers are devoting to networks remains pretty stable. In fact, there’s little difference between the 1.61 hours recorded in 2012 versus the 1.69 hours in 2015. Very clearly, then, social networking is every bit as important today as it was four years ago. In fact, it now accounts for more than a quarter (28%) of the time we spend on the internet each day. Put another way, 1 in every 4 of the minutes that we’re spending online is devoted to social networking.
Question: On a typical day, roughly how many hours do you spend on/doing the
following? Social networking /// Source: GlobalWebIndex Q1 2015 /// Base: Internet
Users aged 16-64
Want to explore this data in PRO Platform? Click here: Social Media > Social Media Time Spent > Time Spent in Social Networking
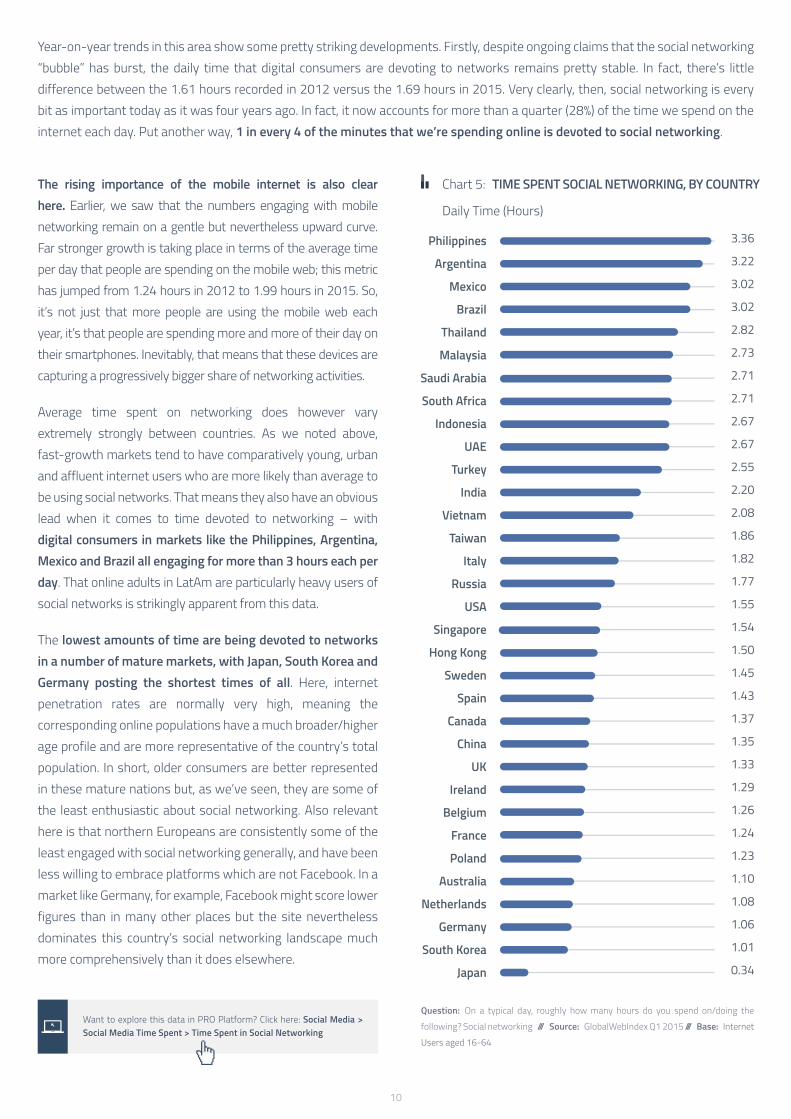
Chart 5: TIME SPENT SOCIAL NETWORKING, BY COUNTRY
Daily Time (Hours)
The rising importance of the mobile internet is also clear here. Earlier, we saw that the numbers engaging with mobile networking remain on a gentle but nevertheless upward curve. Far stronger growth is taking place in terms of the average time per day that people are spending on the mobile web; this metric has jumped from 1.24 hours in 2012 to 1.99 hours in 2015. So, it’s not just that more people are using the mobile web each year, it’s that people are spending more and more of their day on their smartphones. Inevitably, that means that these devices are capturing a progressively bigger share of networking activities.
Average time spent on networking does however vary extremely strongly between countries. As we noted above, fast-growth markets tend to have comparatively young, urban and affluent internet users who are more likely than average to be using social networks. That means they also have an obvious lead when it comes to time devoted to networking – with digital consumers in markets like the Philippines, Argentina, Mexico and Brazil all engaging for more than 3 hours each per day. That online adults in LatAm are particularly heavy users of social networks is strikingly apparent from this data.
The lowest amounts of time are being devoted to networks in a number of mature markets, with Japan, South Korea and Germany posting the shortest times of all. Here, internet penetration rates are normally very high, meaning the corresponding online populations have a much broader/higher age profile and are more representative of the country’s total population. In short, older consumers are better represented in these mature nations but, as we’ve seen, they are some of the least enthusiastic about social networking. Also relevant here is that northern Europeans are consistently some of the least engaged with social networking generally, and have been less willing to embrace platforms which are not Facebook. In a market like Germany, for example, Facebook might score lower figures than in many other places but the site nevertheless dominates this country’s social networking landscape much more comprehensively than it does elsewhere.
11
AVERAGE ADULT IS A MEMBER OF 5+ SOCIAL NETWORKS
GWI tracks engagement with about 50 named social platforms, from the truly global players to those which are localized to certain markets or regions. Our respondents see a list relevant to their own country and are then asked to select those on which they have an account, as well as those which they consider themselves to have actively used or contributed to within the last month.
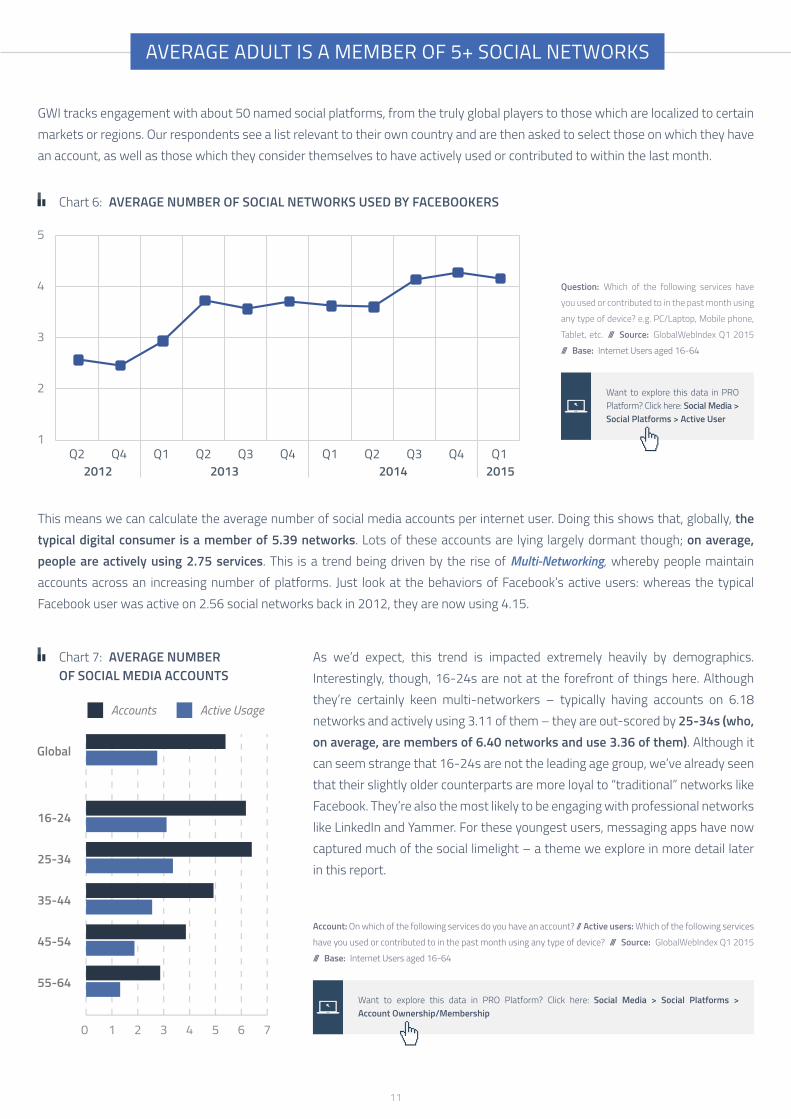
Chart 6: AVERAGE NUMBER OF SOCIAL NETWORKS USED BY FACEBOOKERS
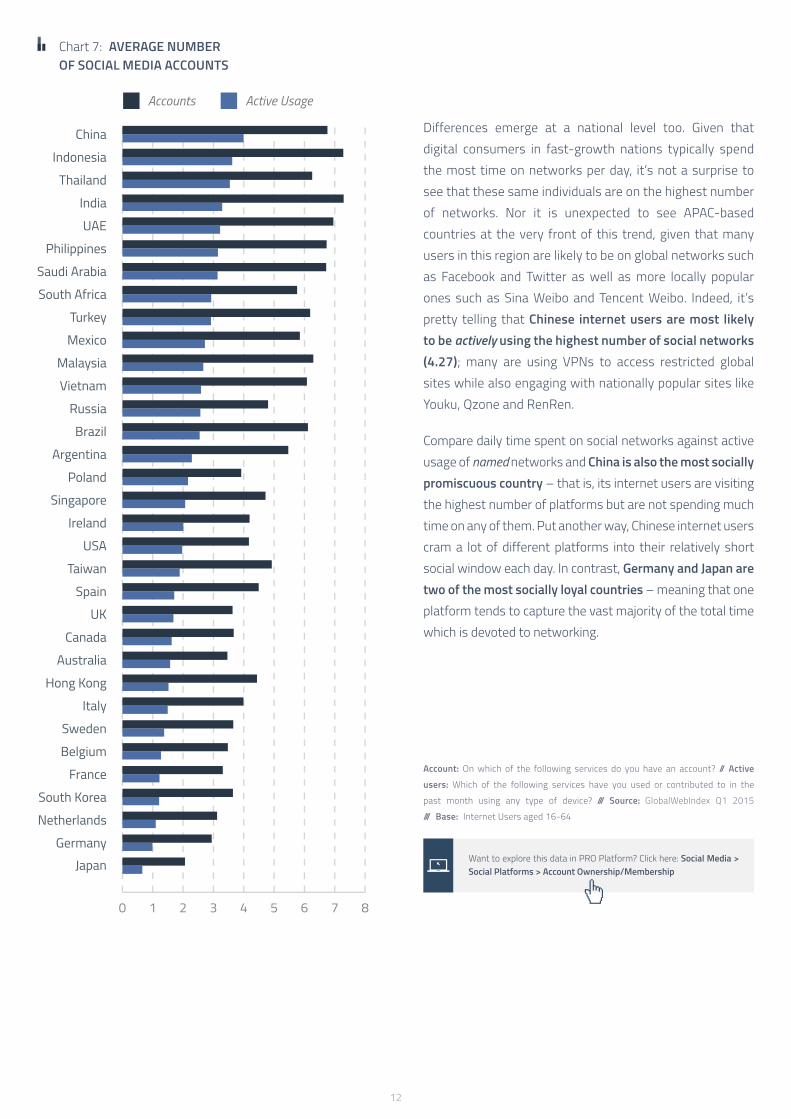
Chart 7: AVERAGE NUMBER OF SOCIAL MEDIA ACCOUNTS
This means we can calculate the average number of social media accounts per internet user. Doing this shows that, globally, the typical digital consumer is a member of 5.39 networks. Lots of these accounts are lying largely dormant though; on average, people are actively using 2.75 services. This is a trend being driven by the rise of Multi-Networking, whereby people maintain accounts across an increasing number of platforms. Just look at the behaviors of Facebook’s active users: whereas the typical Facebook user was active on 2.56 social networks back in 2012, they are now using 4.15.
Question: Which of the following services have
you used or contributed to in the past month using
any type of device? e.g. PC/Laptop, Mobile phone,
Tablet, etc. /// Source: GlobalWebIndex Q1 2015
/// Base: Internet Users aged 16-64
Want to explore this data in PRO Platform? Click here: Social Media > Social Platforms > Active User
As we’d expect, this trend is impacted extremely heavily by demographics. Interestingly, though, 16-24s are not at the forefront of things here. Although they’re certainly keen multi-networkers – typically having accounts on 6.18 networks and actively using 3.11 of them – they are out-scored by 25-34s (who, on average, are members of 6.40 networks and use 3.36 of them). Although it can seem strange that 16-24s are not the leading age group, we’ve already seen that their slightly older counterparts are more loyal to “traditional” networks like Facebook. They’re also the most likely to be engaging with professional networks like LinkedIn and Yammer. For these youngest users, messaging apps have now captured much of the social limelight – a theme we explore in more detail later in this report.
Account: On which of the following services do you have an account? // Active users: Which of the following services
have you used or contributed to in the past month using any type of device? /// Source: GlobalWebIndex Q1 2015
/// Base: Internet Users aged 16-64
Want to explore this data in PRO Platform? Click here: Social Media > Social Platforms > Account Ownership/Membership
12
Chart 7: AVERAGE NUMBER OF SOCIAL MEDIA ACCOUNTS
Account: On which of the following services do you have an account? // Active
users: Which of the following services have you used or contributed to in the
past month using any type of device? /// Source: GlobalWebIndex Q1 2015
/// Base: Internet Users aged 16-64
Want to explore this data in PRO Platform? Click here: Social Media > Social Platforms > Account Ownership/Membership
Differences emerge at a national level too. Given that digital consumers in fast-growth nations typically spend the most time on networks per day, it’s not a surprise to see that these same individuals are on the highest number of networks. Nor it is unexpected to see APAC-based countries at the very front of this trend, given that many users in this region are likely to be on global networks such as Facebook and Twitter as well as more locally popular ones such as Sina Weibo and Tencent Weibo. Indeed, it’s pretty telling that Chinese internet users are most likely to be actively using the highest number of social networks (4.27); many are using VPNs to access restricted global sites while also engaging with nationally popular sites like Youku, Qzone and RenRen.
Compare daily time spent on social networks against active usage of named networks and China is also the most socially promiscuous country – that is, its internet users are visiting the highest number of platforms but are not spending much time on any of them. Put another way, Chinese internet users cram a lot of different platforms into their relatively short social window each day. In contrast, Germany and Japan are two of the most socially loyal countries – meaning that one platform tends to capture the vast majority of the total time which is devoted to networking.

13
TOP SOCIAL NETWORKSTracking members, active users and visitors across the world’s biggest networks3
KEY HEADLINES
• Facebook is still in pole position for members (82%) and active users (42%) but is overtaken by YouTube when it comes to visitors (with Facebook scoring 73%, to YouTube’s 81%). This trend is consistent across all regions, and is symptomatic of YouTube attracting a large logged-out or even unregistered audience.
• Facebook regains top spot when we look at frequency of usage; over half of its active users are engaging multiple times a day, compared to just 15% on Pinterest or 18% on Tumblr.
• Ello has failed to gain traction among the social audience; just 9% are members and a meagre 5% are active users.
• Sina Weibo and Qzone are top in China, but this is one of the markets where people are most likely to turn to VPNs in order to access restricted networks. Over 150 million people are doing this globally.
SETTING THE SCENE: DEFINING AN ACTIVE USER
Across all of the named social platforms tracked by GWI, user engagement is monitored in two main ways:
• Account Membership. People who say they have an account on the platform in question
• Active Usage. People who say that, within the last month, they have actively contributed to or used the platform in question.
We measure both of these aspects in order to differentiate a social network’s total potential audience – e.g. its overall membership base – from its current active audience (those who are actually engaging with it on a regular basis). This allows us to see how many of a social network’s members can be legitimately counted as “active users” – by far the most important measure of engagement in a digital landscape where social networking behaviors have proliferated.
Critically, GWI applies the same definitions across all of the platforms that we track. This enables us to assess their relative popularity in a fair and like-for-like way, whereas the networks themselves tend to have rather more complex,
competing and sometimes slightly elusive definitions which do not permit accurate comparisons between platforms. In short, in their own self-published figures, an active user as defined by Facebook is unlikely to be the same as an active user as defined by Twitter or YouTube.
What’s more, some networks will categorize someone as an active user if they are logged in via their app, if they have clicked an associated button on a third-party website or if they have simply visited the network’s main site without actually doing anything. That means an individual can potentially be classified as active without really engaging with the site – especially where passive web analytics are being deployed. Spam, “bot” and other false accounts can also be a real issue.
GWI’s data has the benefit of representing the user’s perspective; an individual is counted as an active user only if they consider themselves to be one. We believe our figures thus represent the most accurate and robust snapshot of active usage and offer one of the only ways to make true comparisons across networks.
14
FACEBOOK IS STILL THE CLEAR NUMBER ONE
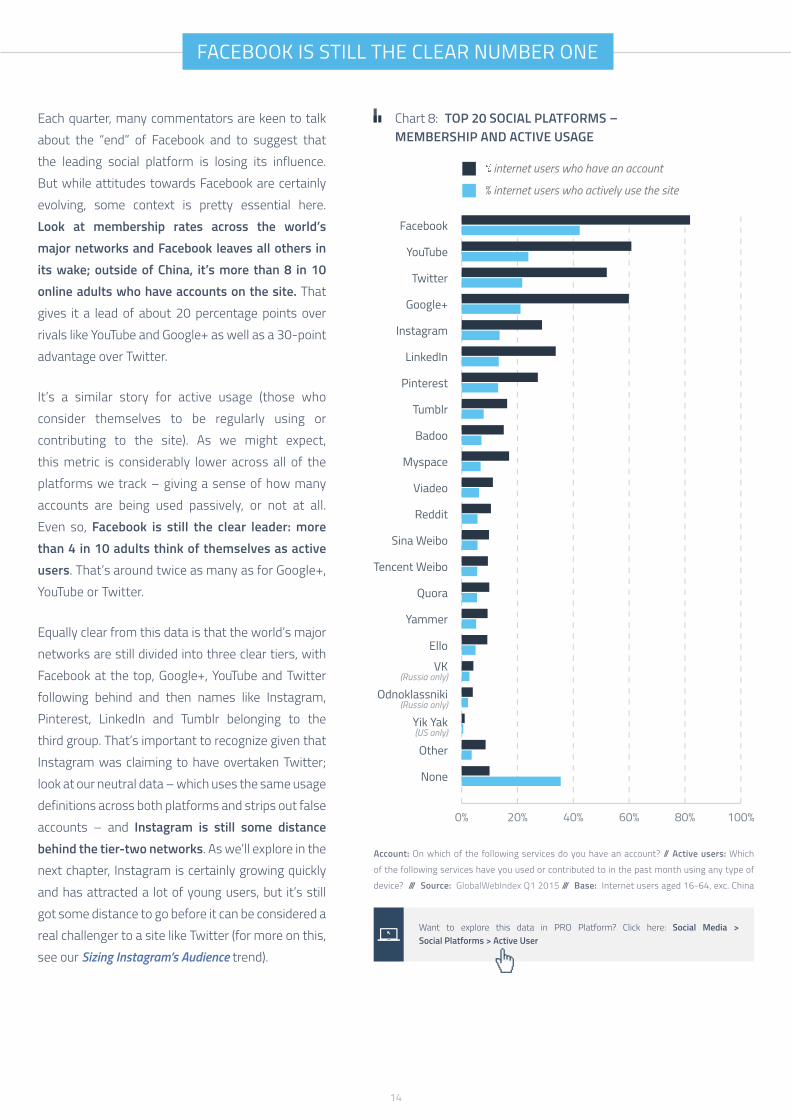
Chart 8: TOP 20 SOCIAL PLATFORMS – MEMBERSHIP AND ACTIVE USAGE
Each quarter, many commentators are keen to talk about the “end” of Facebook and to suggest that the leading social platform is losing its influence. But while attitudes towards Facebook are certainly evolving, some context is pretty essential here. Look at membership rates across the world’s major networks and Facebook leaves all others in its wake; outside of China, it’s more than 8 in 10 online adults who have accounts on the site. That gives it a lead of about 20 percentage points over rivals like YouTube and Google+ as well as a 30-point advantage over Twitter.
It’s a similar story for active usage (those who consider themselves to be regularly using or contributing to the site). As we might expect, this metric is considerably lower across all of the platforms we track – giving a sense of how many accounts are being used passively, or not at all. Even so, Facebook is still the clear leader: more than 4 in 10 adults think of themselves as active users. That’s around twice as many as for Google+, YouTube or Twitter.
Equally clear from this data is that the world’s major networks are still divided into three clear tiers, with Facebook at the top, Google+, YouTube and Twitter following behind and then names like Instagram, Pinterest, LinkedIn and Tumblr belonging to the third group. That’s important to recognize given that Instagram was claiming to have overtaken Twitter; look at our neutral data – which uses the same usage definitions across both platforms and strips out false accounts – and Instagram is still some distance behind the tier-two networks. As we’ll explore in the next chapter, Instagram is certainly growing quickly and has attracted a lot of young users, but it’s still got some distance to go before it can be considered a real challenger to a site like Twitter (for more on this, see our Sizing Instagram’s Audience trend).
Account: On which of the following services do you have an account? // Active users: Which
of the following services have you used or contributed to in the past month using any type of
device? /// Source: GlobalWebIndex Q1 2015 /// Base: Internet users aged 16-64, exc. China
Want to explore this data in PRO Platform? Click here: Social Media > Social Platforms > Active User
15
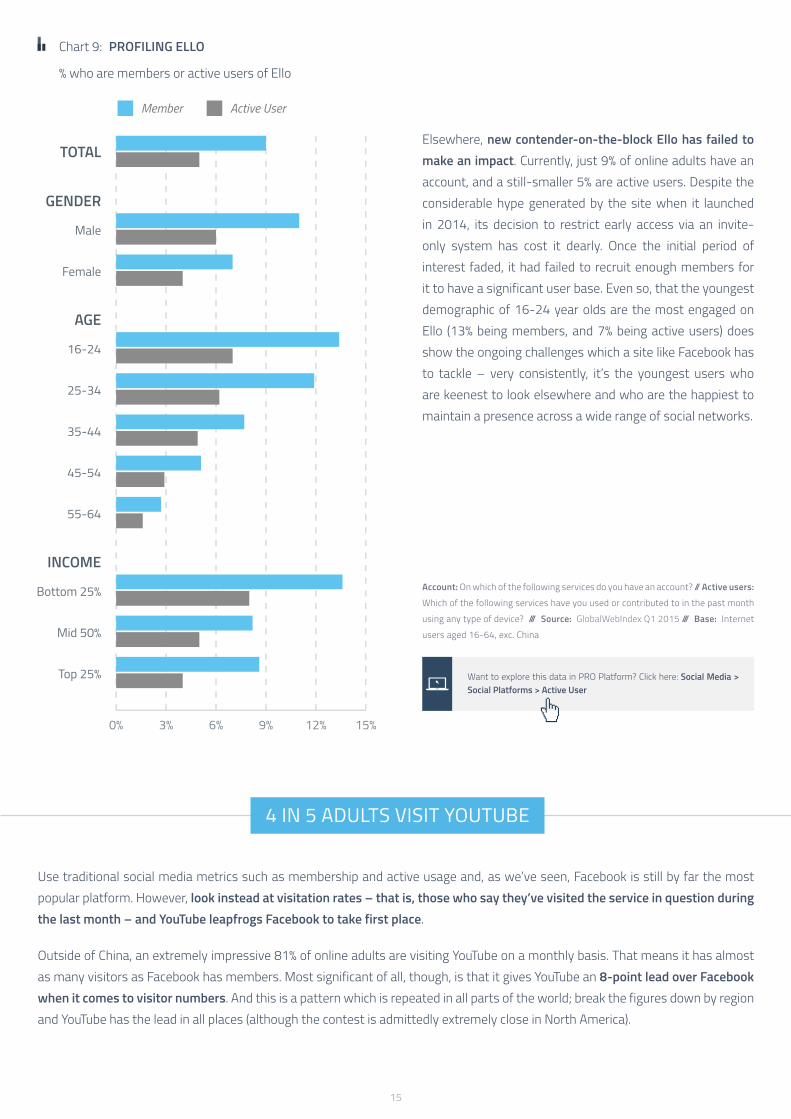
Elsewhere, new contender-on-the-block Ello has failed to make an impact. Currently, just 9% of online adults have an account, and a still-smaller 5% are active users. Despite the considerable hype generated by the site when it launched in 2014, its decision to restrict early access via an invite-only system has cost it dearly. Once the initial period of interest faded, it had failed to recruit enough members for it to have a significant user base. Even so, that the youngest demographic of 16-24 year olds are the most engaged on Ello (13% being members, and 7% being active users) does show the ongoing challenges which a site like Facebook has to tackle – very consistently, it’s the youngest users who are keenest to look elsewhere and who are the happiest to maintain a presence across a wide range of social networks.
Chart 9: PROFILING ELLO
% who are members or active users of Ello
4 IN 5 ADULTS VISIT YOUTUBE
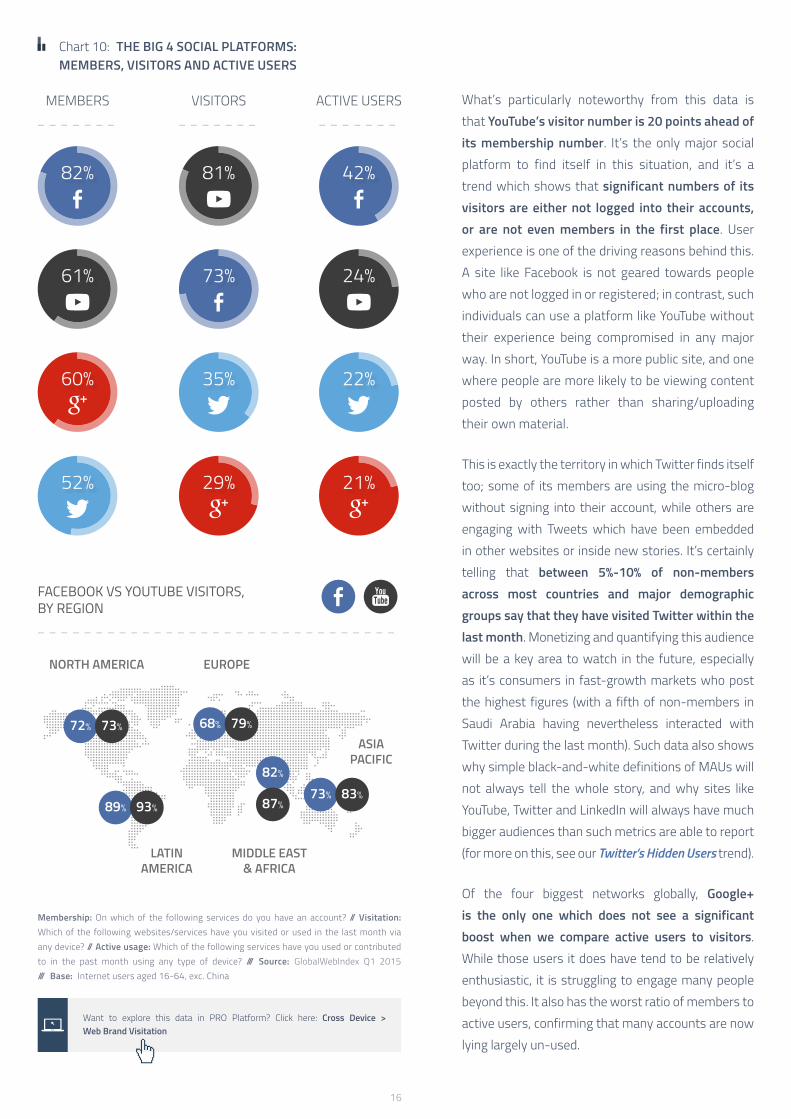
Use traditional social media metrics such as membership and active usage and, as we’ve seen, Facebook is still by far the most popular platform. However, look instead at visitation rates – that is, those who say they’ve visited the service in question during the last month – and YouTube leapfrogs Facebook to take first place.
Outside of China, an extremely impressive 81% of online adults are visiting YouTube on a monthly basis. That means it has almost as many visitors as Facebook has members. Most significant of all, though, is that it gives YouTube an 8-point lead over Facebook when it comes to visitor numbers. And this is a pattern which is repeated in all parts of the world; break the figures down by region and YouTube has the lead in all places (although the contest is admittedly extremely close in North America).
Account: On which of the following services do you have an account? // Active users:
Which of the following services have you used or contributed to in the past month
using any type of device? /// Source: GlobalWebIndex Q1 2015 /// Base: Internet
users aged 16-64, exc. China
Want to explore this data in PRO Platform? Click here: Social Media > Social Platforms > Active User
16
What’s particularly noteworthy from this data is that YouTube’s visitor number is 20 points ahead of its membership number. It’s the only major social platform to find itself in this situation, and it’s a trend which shows that significant numbers of its visitors are either not logged into their accounts, or are not even members in the first place. User experience is one of the driving reasons behind this. A site like Facebook is not geared towards people who are not logged in or registered; in contrast, such individuals can use a platform like YouTube without their experience being compromised in any major way. In short, YouTube is a more public site, and one where people are more likely to be viewing content posted by others rather than sharing/uploading their own material.
This is exactly the territory in which Twitter finds itself too; some of its members are using the micro-blog without signing into their account, while others are engaging with Tweets which have been embedded in other websites or inside new stories. It’s certainly telling that between 5%-10% of non-members across most countries and major demographic groups say that they have visited Twitter within the last month. Monetizing and quantifying this audience will be a key area to watch in the future, especially as it’s consumers in fast-growth markets who post the highest figures (with a fifth of non-members in Saudi Arabia having nevertheless interacted with Twitter during the last month). Such data also shows why simple black-and-white definitions of MAUs will not always tell the whole story, and why sites like YouTube, Twitter and LinkedIn will always have much bigger audiences than such metrics are able to report (for more on this, see our Twitter’s Hidden Users trend).
Of the four biggest networks globally, Google+ is the only one which does not see a significant boost when we compare active users to visitors. While those users it does have tend to be relatively enthusiastic, it is struggling to engage many people beyond this. It also has the worst ratio of members to active users, confirming that many accounts are now lying largely un-used.
Chart 10: THE BIG 4 SOCIAL PLATFORMS: MEMBERS, VISITORS AND ACTIVE USERS
Membership: On which of the following services do you have an account? // Visitation: Which of the following websites/services have you visited or used in the last month via any device? // Active usage: Which of the following services have you used or contributed to in the past month using any type of device? /// Source: GlobalWebIndex Q1 2015 /// Base: Internet users aged 16-64, exc. China
Want to explore this data in PRO Platform? Click here: Cross Device > Web Brand Visitation

17
YOUTUBE IS AHEAD OF FACEBOOK IN 30 OF 33 COUNTRIES
Although membership and active user metrics both have their own clear merits, it is arguably visitor numbers which offer the fairest way of comparing engagement across the top social networks. Look at this in each of the countries we survey and YouTube has the lead in 30 of our 33 markets (the exceptions being the Netherlands, Indonesia and South Africa).
Chart 11: VISITORS TO THE TOP SOCIAL PLATFORMS BY COUNTRY
% who have visited the following social platforms in the last month
Question: Which of the following sites/applications have you visited in the past month via your PC/Laptop, Mobile or Tablet? /// Source: GlobalWebIndex Q1 2015 /// Base: Internet users aged 16-64
Want to explore this data in PRO Platform? Click here: Cross Device > Web Brand Visitation
Although the figures for YouTube and Facebook are pretty close in each country, the lead for YouTube is particularly pronounced in Japan (40 points) and Russia (32 points) – two places which have always been a challenge for Facebook. Japan is in fact the only market where Twitter is also ahead of Facebook.
18
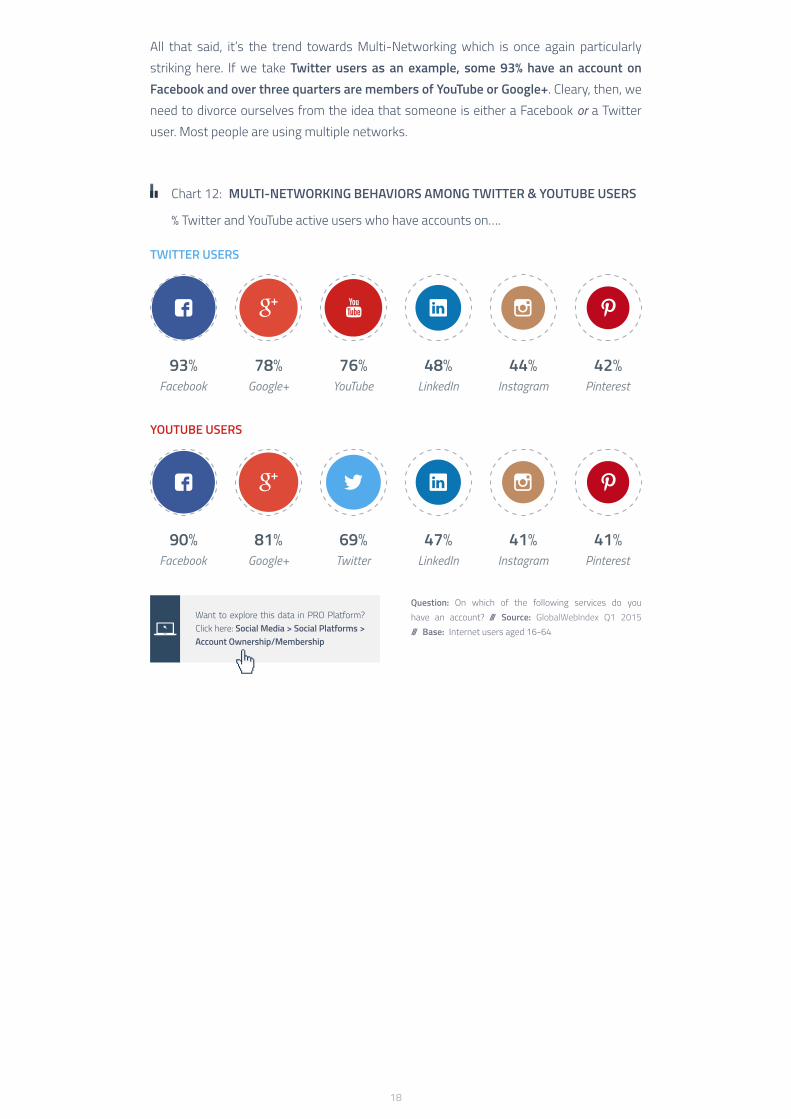
Chart 12: MULTI-NETWORKING BEHAVIORS AMONG TWITTER & YOUTUBE USERS
% Twitter and YouTube active users who have accounts on….
TWITTER USERS
YOUTUBE USERS
Question: On which of the following services do you have an account? /// Source: GlobalWebIndex Q1 2015 /// Base: Internet users aged 16-64
Want to explore this data in PRO Platform? Click here: Social Media > Social Platforms > Account Ownership/Membership
All that said, it’s the trend towards Multi-Networking which is once again particularly striking here. If we take Twitter users as an example, some 93% have an account on Facebook and over three quarters are members of YouTube or Google+. Cleary, then, we need to divorce ourselves from the idea that someone is either a Facebook or a Twitter user. Most people are using multiple networks.

19
Chart 13: FREQUENCY OF VISITS ON THE TOP GLOBAL SOCIAL PLATFORMS
Question: Thinking about the social platforms that you use or contribute to each month, can you please tell us how often you typically use each one? /// Source: GlobalWebIndex Q1 2015 /// Base: Active users of each network aged 16-64, exc. China
Want to explore this data in PRO Platform? Click here: Social Media > Social Platform Usage Frequency
HALF OF FACEBOOK’S ACTIVE USERS VISIT MULTIPLE TIMES A DAY
Although the battle between YouTube and Facebook might be pretty close in terms of visitors, one area where Facebook has a clear lead is in relation to usage frequency among active users. As our chart shows, a sizable 54% of Facebook’s active users are engaging with the site more than once a day – putting it almost 25 percentage points ahead of second-placed YouTube.
That more than half of Facebook’s active audience is connecting so frequently is a testament to how ingrained it has become within daily lives, but also of the ongoing migration of social networking behaviors to mobile platforms; the nature of smartphone internet usage means that many users are checking in multiple times a day, albeit for relatively short periods. There’s also a strong age effect at work here: the younger a Facebook user is, the more likely they are to be using the service more than once a day.
Overall, perhaps the most impressive metric is that just 8% of Facebook’s active users select the “less often than once a week” option. Compare that to sites like Pinterest and Tumblr, where over 4 in 10 say this, and the difference in engagement is clear.
20
SINA WEIBO AND QZONE LEAD IN CHINA
As noted in the introduction, China has been excluded from charts which track named/specific platforms; this is due to the rather unique nature of the social networking landscape in the country and hence the ease with which it can skew the figures for global trends (China accounts for about a third of all internet users across the 33 markets surveyed by GWI, and hence global averages can be impacted heavily if a trend is not pronounced in this particular market).
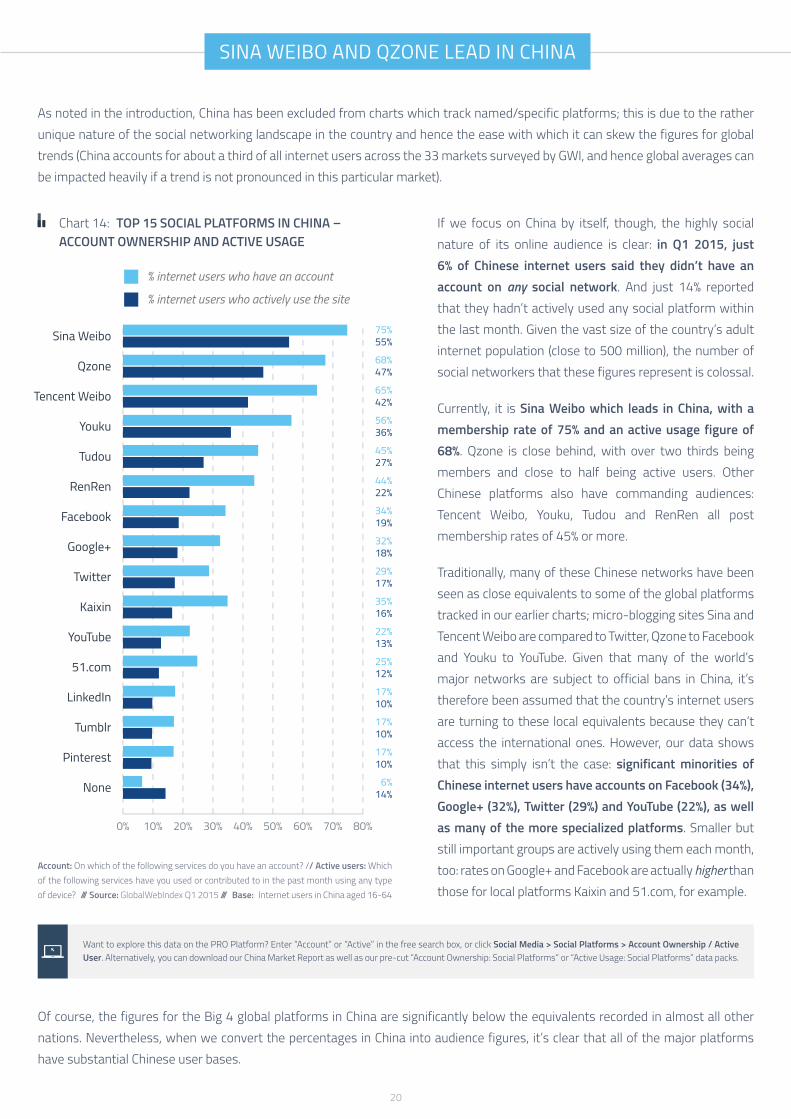
Chart 14: TOP 15 SOCIAL PLATFORMS IN CHINA – ACCOUNT OWNERSHIP AND ACTIVE USAGE
If we focus on China by itself, though, the highly social nature of its online audience is clear: in Q1 2015, just 6% of Chinese internet users said they didn’t have an account on any social network. And just 14% reported that they hadn’t actively used any social platform within the last month. Given the vast size of the country’s adult internet population (close to 500 million), the number of social networkers that these figures represent is colossal.
Currently, it is Sina Weibo which leads in China, with a membership rate of 75% and an active usage figure of 68%. Qzone is close behind, with over two thirds being members and close to half being active users. Other Chinese platforms also have commanding audiences: Tencent Weibo, Youku, Tudou and RenRen all post membership rates of 45% or more.
Traditionally, many of these Chinese networks have been seen as close equivalents to some of the global platforms tracked in our earlier charts; micro-blogging sites Sina and Tencent Weibo are compared to Twitter, Qzone to Facebook and Youku to YouTube. Given that many of the world’s major networks are subject to official bans in China, it’s therefore been assumed that the country’s internet users are turning to these local equivalents because they can’t access the international ones. However, our data shows that this simply isn’t the case: significant minorities of Chinese internet users have accounts on Facebook (34%), Google+ (32%), Twitter (29%) and YouTube (22%), as well as many of the more specialized platforms. Smaller but still important groups are actively using them each month, too: rates on Google+ and Facebook are actually higher than those for local platforms Kaixin and 51.com, for example.
Account: On which of the following services do you have an account? // Active users: Which of the following services have you used or contributed to in the past month using any type of device? /// Source: GlobalWebIndex Q1 2015 /// Base: Internet users in China aged 16-64
Want to explore this data on the PRO Platform? Enter “Account” or “Active” in the free search box, or click Social Media > Social Platforms > Account Ownership / Active User. Alternatively, you can download our China Market Report as well as our pre-cut “Account Ownership: Social Platforms” or “Active Usage: Social Platforms” data packs.
Of course, the figures for the Big 4 global platforms in China are significantly below the equivalents recorded in almost all other nations. Nevertheless, when we convert the percentages in China into audience figures, it’s clear that all of the major platforms have substantial Chinese user bases.
21
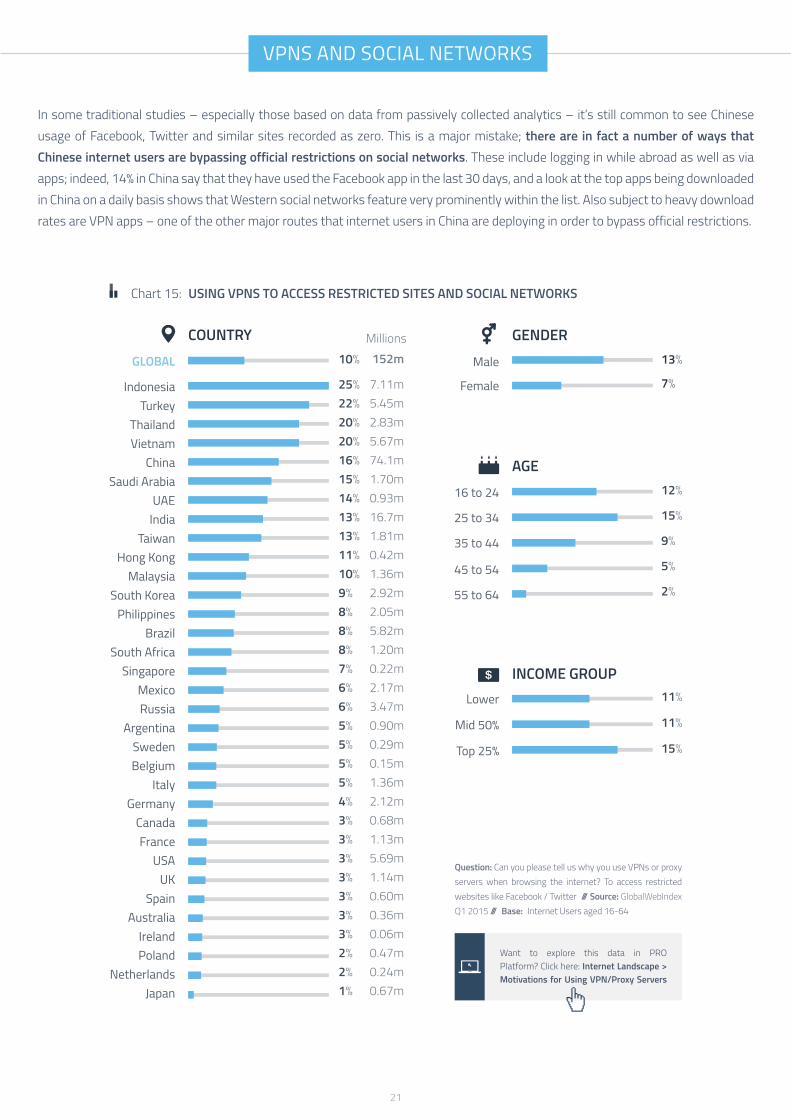
VPNS AND SOCIAL NETWORKS
In some traditional studies – especially those based on data from passively collected analytics – it’s still common to see Chinese usage of Facebook, Twitter and similar sites recorded as zero. This is a major mistake; there are in fact a number of ways that Chinese internet users are bypassing official restrictions on social networks. These include logging in while abroad as well as via apps; indeed, 14% in China say that they have used the Facebook app in the last 30 days, and a look at the top apps being downloaded in China on a daily basis shows that Western social networks feature very prominently within the list. Also subject to heavy download rates are VPN apps – one of the other major routes that internet users in China are deploying in order to bypass official restrictions.
Chart 15: USING VPNS TO ACCESS RESTRICTED SITES AND SOCIAL NETWORKS
Question: Can you please tell us why you use VPNs or proxy servers when browsing the internet? To access restricted websites like Facebook / Twitter /// Source: GlobalWebIndex Q1 2015 /// Base: Internet Users aged 16-64
Want to explore this data in PRO Platform? Click here: Internet Landscape > Motivations for Using VPN/Proxy Servers
22
For anyone unfamiliar with VPNs, they allow people to bypass traditional connections and tracking methods to use the internet via a remotely located server; essentially, it’s as if people are entering the internet discretely via a side door rather than through the main entrance. That means VPNs can provide access to any social network which is subject to geo-restrictions (whether in place to protect content or because usage has been prohibited by authorities).
At present, VPNs are still viewed as pretty niche tools used mainly by savviest or geekiest of internet users. Worldwide, though, it’s over a quarter of online adults who say they’ve used one to connect to the web. Hardly that niche, then – especially when we recognize that this percentage translates to more than 375 million VPN users.
Significantly, VPN usage is much higher in fast-growth rather than mature markets. What’s more, using them to access social networks is a major motivation, with a notable peak in APAC; as our chart shows, it’s Indonesia, Turkey, Thailand and Vietnam which lead the way (20%+ each), followed closely by China (16%).
Look at the corresponding audience sizes and the importance of these tools in China is plain to see: some 75 million online adults in the country have used one to access restricted websites or social platforms. Compare that to places like the UK and USA, where the equivalent figure is just 3%, and the disparity is pretty striking (with most of the 1 million UK and 5.5 million US users looking to access sites/networks which are restricted in their place of work).
Globally, this behavior is most common among men and 16-34s but – interestingly – it’s relatively equal across the income quartiles (albeit with a slight peak among the top 25%).
Not only does this trend underline the potential limitations of using passively collected, geo-located data – which can over-estimate the size of social audiences in markets such as the USA, Netherlands, South Korea and Sweden, where VPN and Proxy servers tend to be located – it also emphasizes the growing futility of attempting to prevent national audiences from accessing certain sites. It’s certainly not a coincidence that a market like Turkey features prominently, a place where the Government has been attempting to block access to platforms like Twitter.
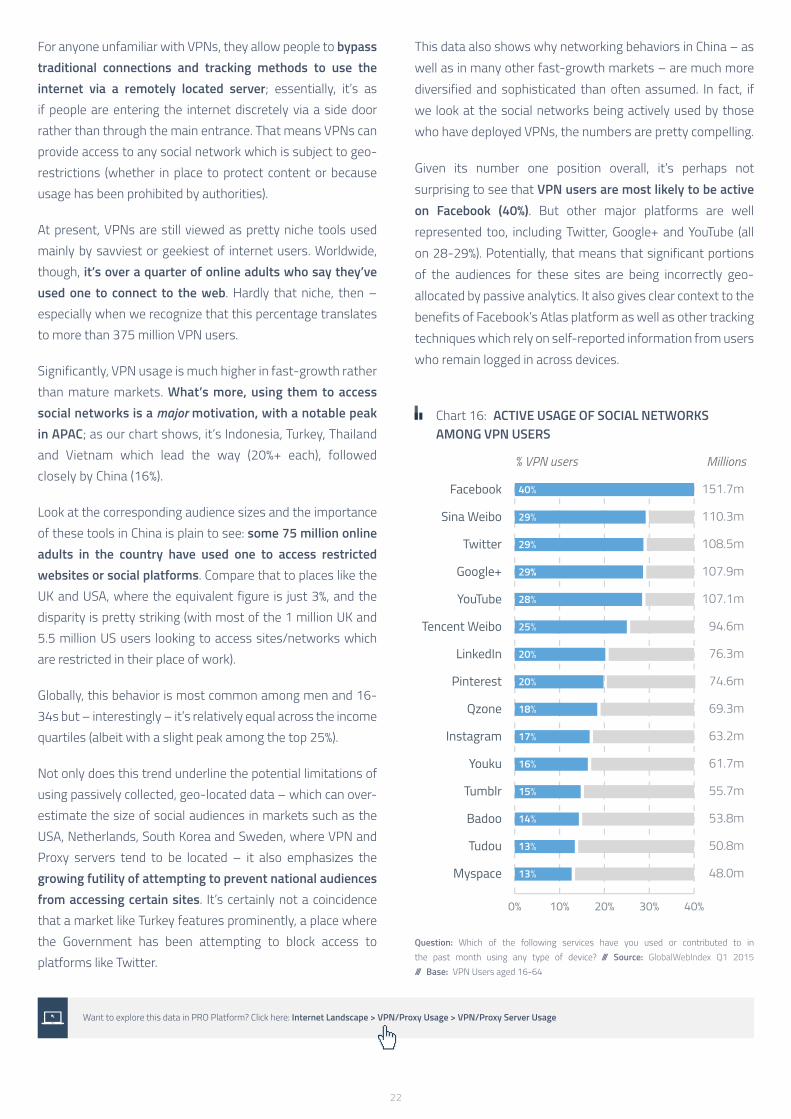
This data also shows why networking behaviors in China – as well as in many other fast-growth markets – are much more diversified and sophisticated than often assumed. In fact, if we look at the social networks being actively used by those who have deployed VPNs, the numbers are pretty compelling.
Given its number one position overall, it’s perhaps not surprising to see that VPN users are most likely to be active on Facebook (40%). But other major platforms are well represented too, including Twitter, Google+ and YouTube (all on 28-29%). Potentially, that means that significant portions of the audiences for these sites are being incorrectly geo-allocated by passive analytics. It also gives clear context to the benefits of Facebook’s Atlas platform as well as other tracking techniques which rely on self-reported information from users who remain logged in across devices.
Chart 16: ACTIVE USAGE OF SOCIAL NETWORKS AMONG VPN USERS
Question: Which of the following services have you used or contributed to in the past month using any type of device? /// Source: GlobalWebIndex Q1 2015 /// Base: VPN Users aged 16-64
Want to explore this data in PRO Platform? Click here: Internet Landscape > VPN/Proxy Usage > VPN/Proxy Server Usage

23
FASTEST GROWING NETWORKSMeasuring performance over the last year4
KEY HEADLINES
• Pinterest (+97%), Tumblr (+95%) and Instagram (+46%) are the fastest growing platforms in the last year. But with LinkedIn also up by 39%, we have obvious context for why the Facebook at Work service has been developed (with about a quarter in the US and UK expressing an interest in using it).
• Facebook is the only major network which is losing active users, with a 9% drop since the start of 2014. However, its visitor number is holding steady at around 75%, indicating that its reach is not diminishing even if people are not using it as actively as they once were.
• For teens, YouTube is seen as the “coolest” network, followed by Instagram and then Facebook.
• Clicking the “like” button is the top behavior on Facebook. With three quarters of active users having done this within the last month, Atlas-served ads can become ever more accurate.
PINTEREST AND TUMBLR ARE FASTEST GROWING PLATFORMS
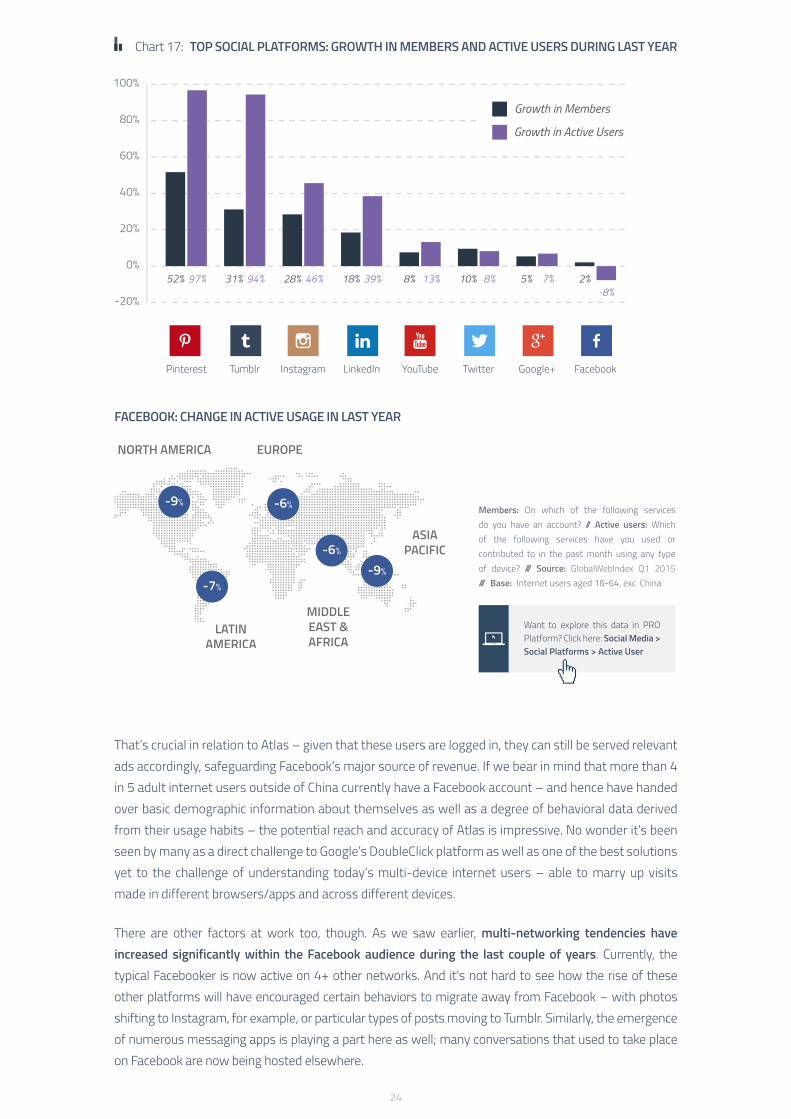
Across the eight biggest social platforms, there are some pretty clear patterns when it comes to growth in active users during the last year. Facebook is the only one to have seen a decline in the numbers who think of themselves as active users, with a 9% drop. Meanwhile, the chasing pack of YouTube, Twitter and Google+ have all experienced steady rises of between 7-13%. But it’s the smaller and more specialized platforms which are growing at the quickest rates, with Pinterest (+97%) and Tumblr (+94%) recording by far the biggest and most impressive increases.
Of course, some context is crucial here. It’s easier for the smaller networks to record sizable percentage increases as they start from lower starting points. Even so, there’s no escaping the fact that Facebook recorded a decline, and one which is consistent in all parts of the world. It might still have the most members and active users, and it might be a strong second behind YouTube when it comes to visitation, but it’s the only social network that fewer and fewer people are using actively.
There are multiple reasons for this. Firstly, comparing visitors versus active users on Facebook is pretty revealing. Taking the last eight quarters as an example shows that visitation rates have been holding largely steady, whereas active usage has been trending downwards. Clearly, people aren’t necessarily leaving Facebook then, they’re just becoming less likely to interact with it in active ways – and hence, are less and less likely to think of themselves as active users, even if they’re still visiting the site.
24
Chart 17: TOP SOCIAL PLATFORMS: GROWTH IN MEMBERS AND ACTIVE USERS DURING LAST YEAR
FACEBOOK: CHANGE IN ACTIVE USAGE IN LAST YEAR
Members: On which of the following services do you have an account? // Active users: Which of the following services have you used or contributed to in the past month using any type of device? /// Source: GlobalWebIndex Q1 2015 /// Base: Internet users aged 16-64, exc. China
Want to explore this data in PRO Platform? Click here: Social Media > Social Platforms > Active User
That’s crucial in relation to Atlas – given that these users are logged in, they can still be served relevant ads accordingly, safeguarding Facebook’s major source of revenue. If we bear in mind that more than 4 in 5 adult internet users outside of China currently have a Facebook account – and hence have handed over basic demographic information about themselves as well as a degree of behavioral data derived from their usage habits – the potential reach and accuracy of Atlas is impressive. No wonder it’s been seen by many as a direct challenge to Google’s DoubleClick platform as well as one of the best solutions yet to the challenge of understanding today’s multi-device internet users – able to marry up visits made in different browsers/apps and across different devices.
There are other factors at work too, though. As we saw earlier, multi-networking tendencies have increased significantly within the Facebook audience during the last couple of years. Currently, the typical Facebooker is now active on 4+ other networks. And it’s not hard to see how the rise of these other platforms will have encouraged certain behaviors to migrate away from Facebook – with photos shifting to Instagram, for example, or particular types of posts moving to Tumblr. Similarly, the emergence of numerous messaging apps is playing a part here as well; many conversations that used to take place on Facebook are now being hosted elsewhere.
25
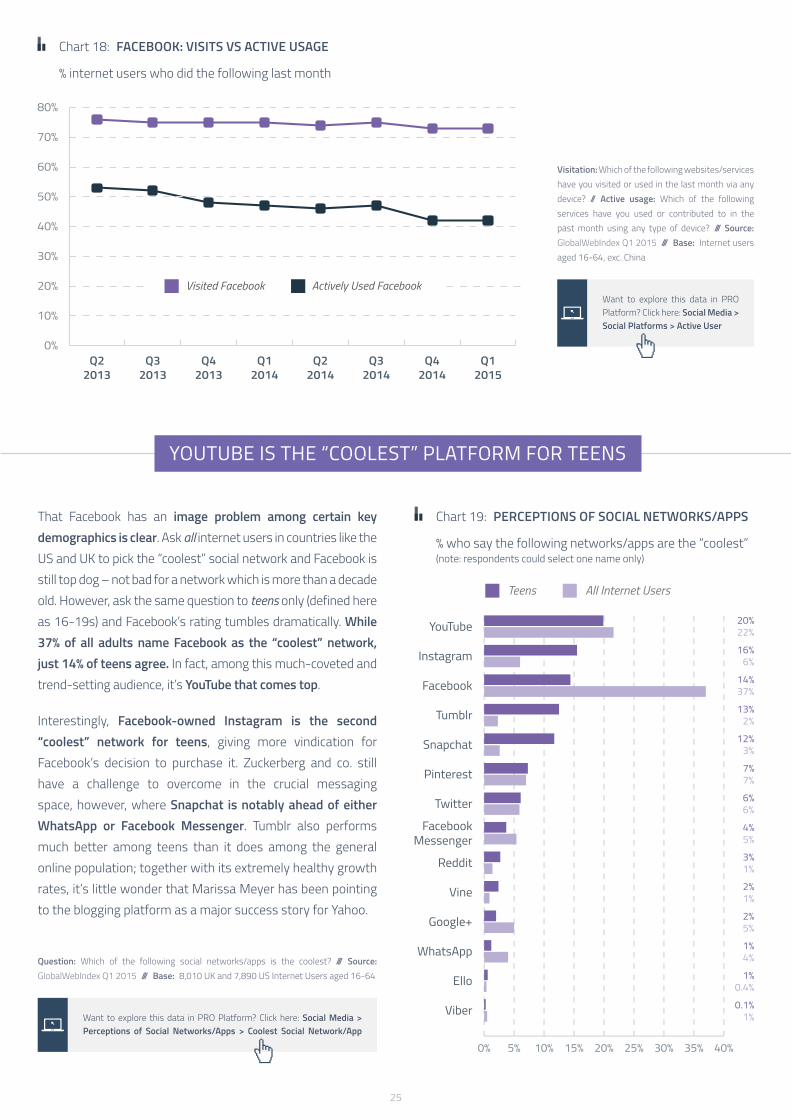
Chart 18: FACEBOOK: VISITS VS ACTIVE USAGE
% internet users who did the following last month
Visitation: Which of the following websites/services have you visited or used in the last month via any device? // Active usage: Which of the following services have you used or contributed to in the past month using any type of device? /// Source: GlobalWebIndex Q1 2015 /// Base: Internet users aged 16-64, exc. China
Want to explore this data in PRO Platform? Click here: Social Media > Social Platforms > Active User
YOUTUBE IS THE “COOLEST” PLATFORM FOR TEENS
Chart 19: PERCEPTIONS OF SOCIAL NETWORKS/APPS
% who say the following networks/apps are the “coolest” (note: respondents could select one name only)
That Facebook has an image problem among certain key demographics is clear. Ask all internet users in countries like the US and UK to pick the “coolest” social network and Facebook is still top dog – not bad for a network which is more than a decade old. However, ask the same question to teens only (defined here as 16-19s) and Facebook’s rating tumbles dramatically. While 37% of all adults name Facebook as the “coolest” network, just 14% of teens agree. In fact, among this much-coveted and trend-setting audience, it’s YouTube that comes top.
Interestingly, Facebook-owned Instagram is the second “coolest” network for teens, giving more vindication for Facebook’s decision to purchase it. Zuckerberg and co. still have a challenge to overcome in the crucial messaging space, however, where Snapchat is notably ahead of either WhatsApp or Facebook Messenger. Tumblr also performs much better among teens than it does among the general online population; together with its extremely healthy growth rates, it’s little wonder that Marissa Meyer has been pointing to the blogging platform as a major success story for Yahoo.
Question: Which of the following social networks/apps is the coolest? /// Source: GlobalWebIndex Q1 2015 /// Base: 8,010 UK and 7,890 US Internet Users aged 16-64
Want to explore this data in PRO Platform? Click here: Social Media > Perceptions of Social Networks/Apps > Coolest Social Network/App
26
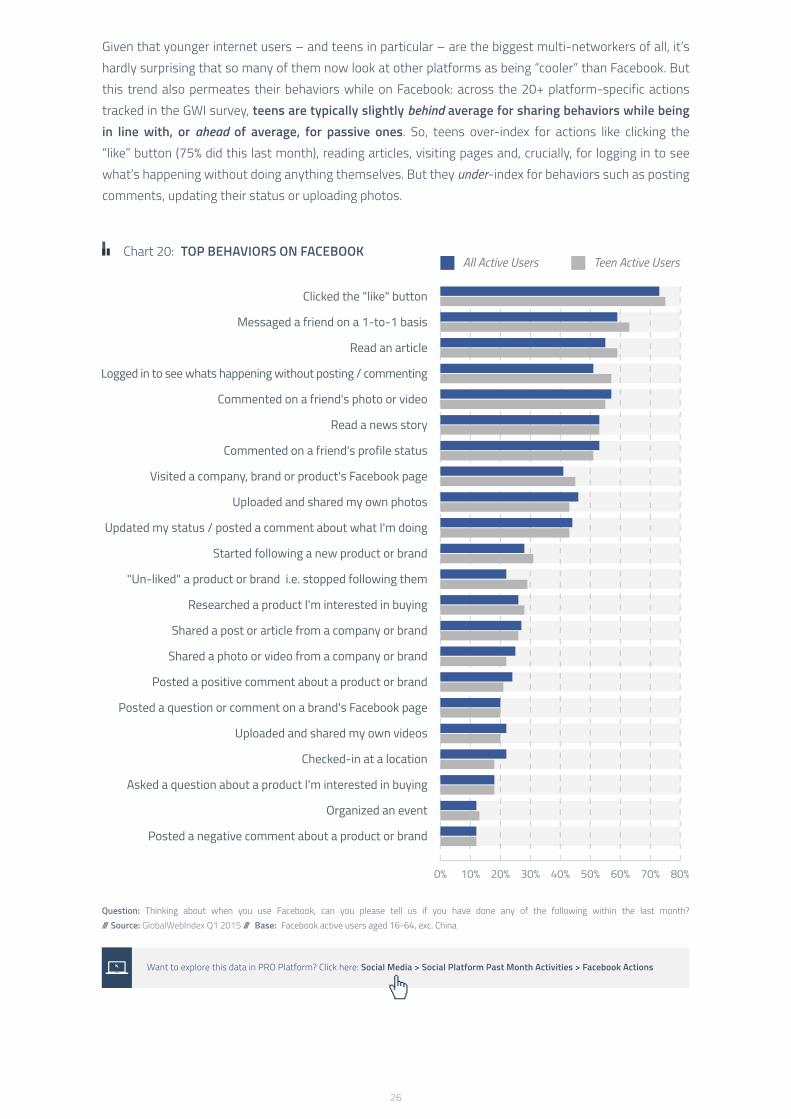
Given that younger internet users – and teens in particular – are the biggest multi-networkers of all, it’s hardly surprising that so many of them now look at other platforms as being “cooler” than Facebook. But this trend also permeates their behaviors while on Facebook: across the 20+ platform-specific actions tracked in the GWI survey, teens are typically slightly behind average for sharing behaviors while being in line with, or ahead of average, for passive ones. So, teens over-index for actions like clicking the “like” button (75% did this last month), reading articles, visiting pages and, crucially, for logging in to see what’s happening without doing anything themselves. But they under-index for behaviors such as posting comments, updating their status or uploading photos.
Chart 20: TOP BEHAVIORS ON FACEBOOK
Question: Thinking about when you use Facebook, can you please tell us if you have done any of the following within the last month? /// Source: GlobalWebIndex Q1 2015 /// Base: Facebook active users aged 16-64, exc. China
Want to explore this data in PRO Platform? Click here: Social Media > Social Platform Past Month Activities > Facebook Actions

27
Certainly, differences between teens and older users are hardly sizable. And there’s still much good news here for Facebook: that three quarters of teens are “liking” things – thus helping Facebook to refine its targeted advertising – is particularly noteworthy. But it does nevertheless illustrate how behaviors are evolving, with photos and active contributions migrating elsewhere. A comparison with Twitter is also pretty interesting here: on the micro-blogging platforms, teens tend to be more active right across the board – over-indexing vs all users across 19 of the 23 behaviors monitored.
Chart 20: TOP BEHAVIORS ON TWITTER
Question: Thinking about when you use Twitter, can you please tell us if you have done any of the following within the last month? /// Source: GlobalWebIndex Q1 2015 /// Base: Twitter active users aged 16-64, exc. China
Want to explore this data in PRO Platform? Click here: Social Media > Social Platform Past Month Activities > Twitter Actions
Elsewhere, it’s worth noting that teens are ahead for liking/following as well as un-liking and un-following – confirming that this audience is the most fickle and subject to fluctuation. Teens thus remain one of the most demanding segments to keep engaged, a challenge that Facebook now needs to face more than most.

28
PROSPECTS FOR FACEBOOK AT WORK
Chart 21: PROSPECTS FOR FACEBOOK AT WORK
% in the US/UK who are interested in using Facebook at Work in the future
Question: Which of the following services, features or devices are you interested in using in the future? Facebook At Work (a version of Facebook designed for business people) /// Source: GlobalWebIndex Q1 2015 /// Base: 8,010 UK and 7,890 US Internet Users aged 16-64
Want to explore this data in PRO Platform? Click here: Internet Landscape > Interest in New Services and Devices
One of Facebook’s major focuses in recent quarters has been to re-engage existing users who may have started using other platforms. That’s one of the key reasons behind the development of Facebook At Work (with the healthy growth figures being posted by LinkedIn no doubt acting as a catalyst).
The prospects for the service look promising; overall, about a quarter of internet users in the UK and USA express interest in using it. This rises a little higher among Facebook active users, to 29%, and climbs still further to 31% among Facebook visitors. Tellingly, though, the highest percentage of all is recorded among LinkedIn users, at 49%. Clearly, Facebook will be hoping to attract some of this platform’s users to its own business offering.
Within a social landscape where multi-networking is very much the norm, this sort of new offer is a clear sign of things to come from Facebook. As is stands, Messenger is being transformed into a platform in its own right, WhatsApp is being positioned as a messaging and VOIP service, Instagram is the destination for photos and now Facebook At Work is available for professionals. As networking becomes more specialized, Facebook’s own portfolio of services is developing accordingly.
29
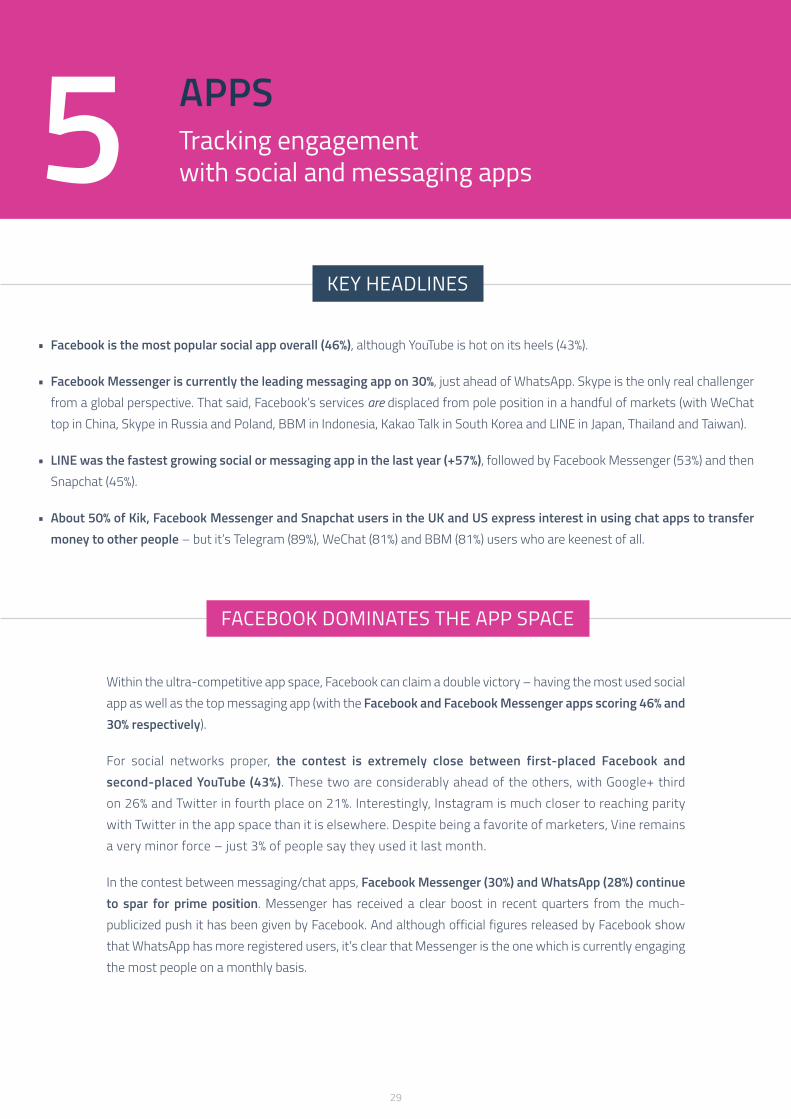
APPSTracking engagement with social and messaging apps5
KEY HEADLINES
• Facebook is the most popular social app overall (46%), although YouTube is hot on its heels (43%).
• Facebook Messenger is currently the leading messaging app on 30%, just ahead of WhatsApp. Skype is the only real challenger from a global perspective. That said, Facebook’s services are displaced from pole position in a handful of markets (with WeChat top in China, Skype in Russia and Poland, BBM in Indonesia, Kakao Talk in South Korea and LINE in Japan, Thailand and Taiwan).
• LINE was the fastest growing social or messaging app in the last year (+57%), followed by Facebook Messenger (53%) and then Snapchat (45%).
• About 50% of Kik, Facebook Messenger and Snapchat users in the UK and US express interest in using chat apps to transfer money to other people – but it’s Telegram (89%), WeChat (81%) and BBM (81%) users who are keenest of all.
FACEBOOK DOMINATES THE APP SPACE
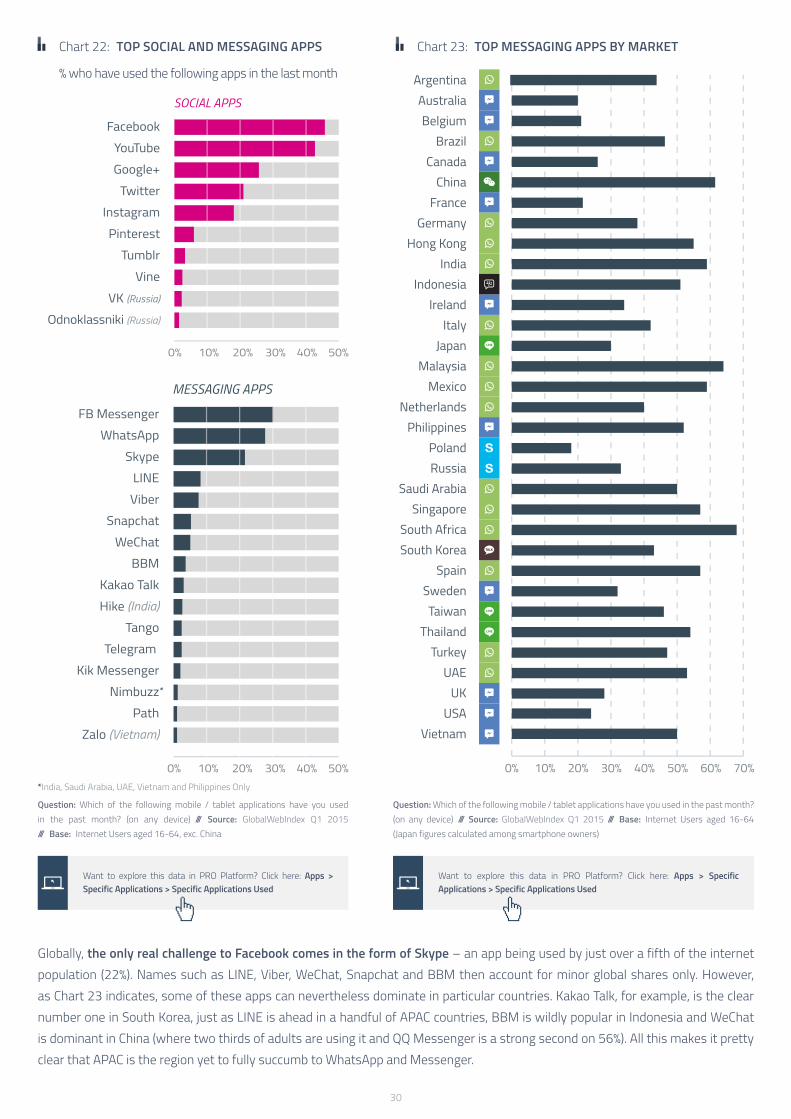
Within the ultra-competitive app space, Facebook can claim a double victory – having the most used social app as well as the top messaging app (with the Facebook and Facebook Messenger apps scoring 46% and 30% respectively).
For social networks proper, the contest is extremely close between first-placed Facebook and second-placed YouTube (43%). These two are considerably ahead of the others, with Google+ third on 26% and Twitter in fourth place on 21%. Interestingly, Instagram is much closer to reaching parity with Twitter in the app space than it is elsewhere. Despite being a favorite of marketers, Vine remains a very minor force – just 3% of people say they used it last month.
In the contest between messaging/chat apps, Facebook Messenger (30%) and WhatsApp (28%) continue to spar for prime position. Messenger has received a clear boost in recent quarters from the much-publicized push it has been given by Facebook. And although official figures released by Facebook show that WhatsApp has more registered users, it’s clear that Messenger is the one which is currently engaging the most people on a monthly basis.
30
Chart 22: TOP SOCIAL AND MESSAGING APPS
% who have used the following apps in the last month
Chart 23: TOP MESSAGING APPS BY MARKET
SOCIAL APPS
Question: Which of the following mobile / tablet applications have you used in the past month? (on any device) /// Source: GlobalWebIndex Q1 2015 /// Base: Internet Users aged 16-64, exc. China
*India, Saudi Arabia, UAE, Vietnam and Philippines Only
Question: Which of the following mobile / tablet applications have you used in the past month? (on any device) /// Source: GlobalWebIndex Q1 2015 /// Base: Internet Users aged 16-64 (Japan figures calculated among smartphone owners)
MESSAGING APPS
Want to explore this data in PRO Platform? Click here: Apps > Specific Applications > Specific Applications Used
Want to explore this data in PRO Platform? Click here: Apps > Specific Applications > Specific Applications Used
Globally, the only real challenge to Facebook comes in the form of Skype – an app being used by just over a fifth of the internet population (22%). Names such as LINE, Viber, WeChat, Snapchat and BBM then account for minor global shares only. However, as Chart 23 indicates, some of these apps can nevertheless dominate in particular countries. Kakao Talk, for example, is the clear number one in South Korea, just as LINE is ahead in a handful of APAC countries, BBM is wildly popular in Indonesia and WeChat is dominant in China (where two thirds of adults are using it and QQ Messenger is a strong second on 56%). All this makes it pretty clear that APAC is the region yet to fully succumb to WhatsApp and Messenger.
*

31
LINE IS THE FASTEST GROWING APP
Chart 24: FASTEST GROWING SOCIAL / MESSAGING APPS
Over the last year, it is LINE which has seen the fastest growth in terms of monthly active users; this service has risen by 57%, in part because of the wide range of functions/services it now offers. As noted above, Facebook Messenger has also recorded strong increases as users have been pushed over from the main Facebook app.
Question: Which of the following mobile / tablet applications have you used in the past month? /// Source: GlobalWebIndex Q1 2015 /// Base: Internet Users aged 16-64, exc. China
Want to explore this data in PRO Platform? Click here: Apps > Specific Applications > Specific Applications Used
Despite having a relatively small global footprint, Snapchat remains a key app to watch. It might have lost its title as the fastest-growing app of all – which it has held for the last few quarters – but it’s still seen a rise of 45% in the last year. And, as we’ll explore in the next chapter, it’s still the messaging app with a particularly strong appeal among teens.
32
FROM MESSAGING APPS TO PLATFORMS
Over the last year, numerous mobile messaging apps have been transitioning from simple communication tools to platforms on which users can do a lot more than simply talk to one another. From money payment features, content tools and VOIP facilities on names like Snapchat, Messenger and WhatsApp to in-app browsing on Kik and the comprehensive range of activities available to users of APAC-based apps, it’s clear that chat apps are seeking to become full-fledged social platforms in their own right.
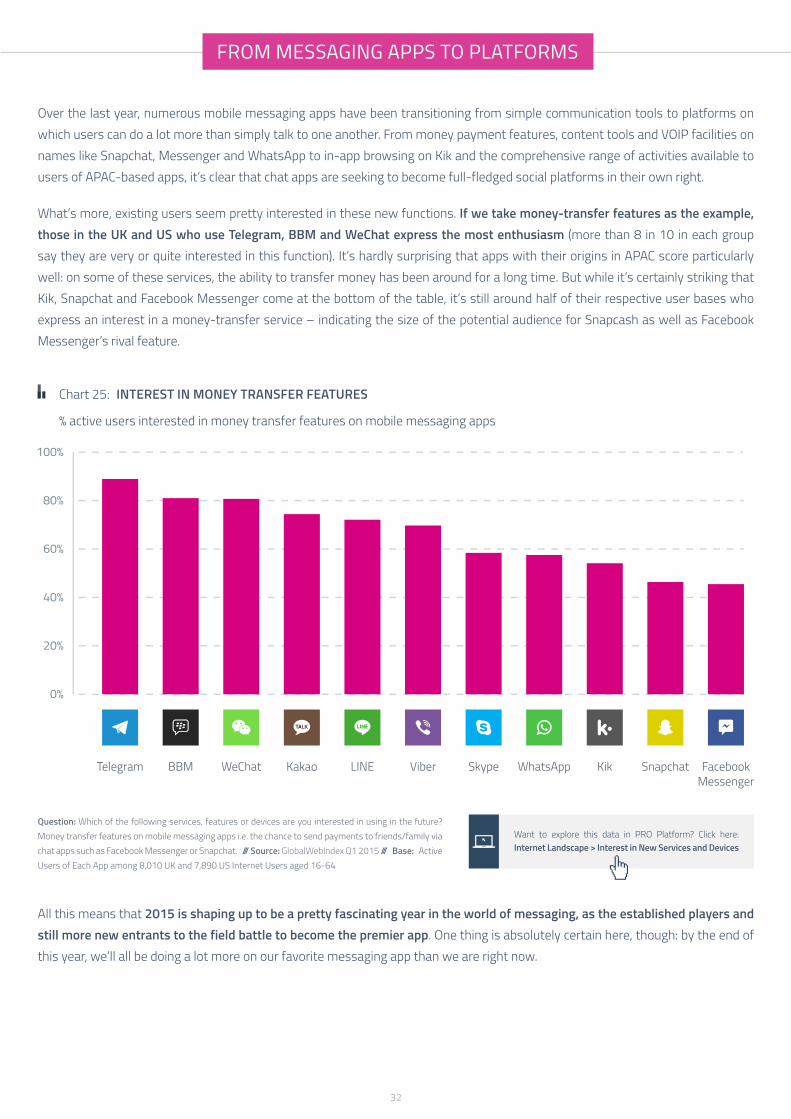
What’s more, existing users seem pretty interested in these new functions. If we take money-transfer features as the example, those in the UK and US who use Telegram, BBM and WeChat express the most enthusiasm (more than 8 in 10 in each group say they are very or quite interested in this function). It’s hardly surprising that apps with their origins in APAC score particularly well: on some of these services, the ability to transfer money has been around for a long time. But while it’s certainly striking that Kik, Snapchat and Facebook Messenger come at the bottom of the table, it’s still around half of their respective user bases who express an interest in a money-transfer service – indicating the size of the potential audience for Snapcash as well as Facebook Messenger’s rival feature.
Chart 25: INTEREST IN MONEY TRANSFER FEATURES
% active users interested in money transfer features on mobile messaging apps
Question: Which of the following services, features or devices are you interested in using in the future? Money transfer features on mobile messaging apps i.e. the chance to send payments to friends/family via chat apps such as Facebook Messenger or Snapchat. /// Source: GlobalWebIndex Q1 2015 /// Base: Active Users of Each App among 8,010 UK and 7,890 US Internet Users aged 16-64
Want to explore this data in PRO Platform? Click here: Internet Landscape > Interest in New Services and Devices
All this means that 2015 is shaping up to be a pretty fascinating year in the world of messaging, as the established players and still more new entrants to the field battle to become the premier app. One thing is absolutely certain here, though: by the end of this year, we’ll all be doing a lot more on our favorite messaging app than we are right now.
33
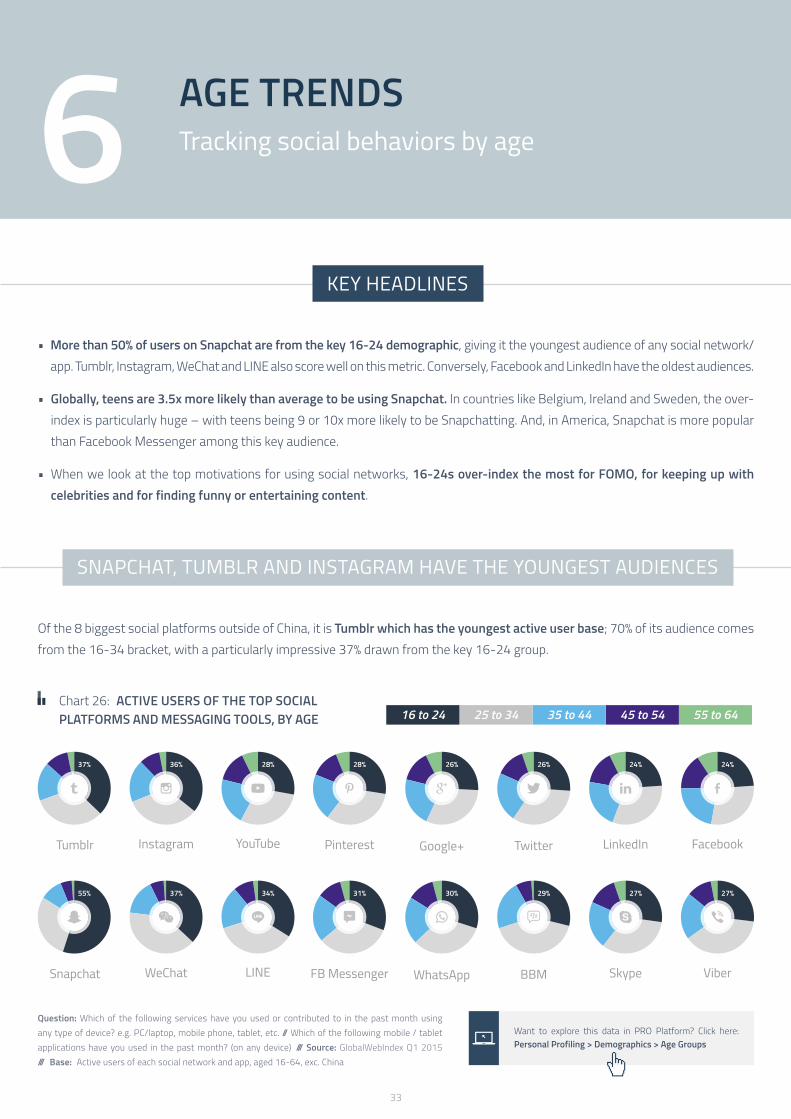
AGE TRENDSTracking social behaviors by age6
KEY HEADLINES
• More than 50% of users on Snapchat are from the key 16-24 demographic, giving it the youngest audience of any social network/app. Tumblr, Instagram, WeChat and LINE also score well on this metric. Conversely, Facebook and LinkedIn have the oldest audiences.
• Globally, teens are 3.5x more likely than average to be using Snapchat. In countries like Belgium, Ireland and Sweden, the over-index is particularly huge – with teens being 9 or 10x more likely to be Snapchatting. And, in America, Snapchat is more popular than Facebook Messenger among this key audience.
• When we look at the top motivations for using social networks, 16-24s over-index the most for FOMO, for keeping up with celebrities and for finding funny or entertaining content.
SNAPCHAT, TUMBLR AND INSTAGRAM HAVE THE YOUNGEST AUDIENCES
Of the 8 biggest social platforms outside of China, it is Tumblr which has the youngest active user base; 70% of its audience comes from the 16-34 bracket, with a particularly impressive 37% drawn from the key 16-24 group.
Chart 26: ACTIVE USERS OF THE TOP SOCIAL PLATFORMS AND MESSAGING TOOLS, BY AGE
Question: Which of the following services have you used or contributed to in the past month using any type of device? e.g. PC/laptop, mobile phone, tablet, etc. // Which of the following mobile / tablet applications have you used in the past month? (on any device) /// Source: GlobalWebIndex Q1 2015 /// Base: Active users of each social network and app, aged 16-64, exc. China
Want to explore this data in PRO Platform? Click here: Personal Profiling > Demographics > Age Groups

34
Instagram follows very closely behind to claim the next youngest audience; 36% of its active users are 16-24 and a further 33% are 25-34. This gives some context for why it’s seen as one of the “coolest” networks among the teen audience – it’s these individuals who are most likely to be using it (often in preference to Facebook).
At the other end of the spectrum, Facebook and LinkedIn have the oldest audiences; just 24% of active users on each platform come from the 16-24 age group.
In part, Facebook’s older user base is a natural consequence of it being the most popular network globally – and the one that older users are therefore most likely to have joined too. Clearly, the audience on a platform like Tumblr might be much younger, but it’s also much smaller. Additionally, Facebook can point to the
young user base of Instagram. Even so, that YouTube has a higher share of 16-24s than Facebook is a sign of how behaviors have been evolving in recent years. It’s also a reflection of Facebook’s ageing user base; original adopters – now within the 25-34 age bracket – are still active on the site, but today’s youngest generation are not quite as enthusiastic as their predecessors.
In terms of mobile messaging tools, Snapchat has the youngest audience; a massive 84% of its users are under 35 (by way of comparison, the equivalent figures on WhatsApp and Facebook Messenger are 63% and 64%).
WeChat and Line can also boast that more than a third of their users are from the key 16-24 demographic, whereas a service like Skype has a much older audience – a result, in part, of it being popular as a family communication tool.
TEENS OVER-INDEX HUGELY FOR SNAPCHAT
Further evidence for Snapchat’s immense popularity among the teen demographic comes from Chart 27; across all of the social and messaging apps tracked by GWI, it is for Snapchat where we see 16-19s over-indexing the most strongly. Teens are in fact about 3.5x as likely to be using Snapchat as the average internet user.
China excluded, it’s still only 18% of teens globally who are engaging with Snapchat. However, this relatively modest worldwide figures masks some much higher percentages from particular markets, especially in the North America and Europe regions.
Chart 27: TEEN USAGE OF SOCIAL AND MESSAGING APPS
Question: Which of the following mobile / tablet applications have you used in the past month? (on any device) /// Source: GlobalWebIndex Q1 2015 (Snapchat by Market figures are Q4 2014-Q1 2015) /// Base: Internet Users aged 16-64, exc. China
Want to explore this data in PRO Platform? Click here: Apps > Specific Applications > Specific Applications Used
35
If we look at teens on a market-by-market basis, more than 40% are now Snapchatting in Ireland, Sweden, Canada, Belgium and the UK. In Ireland, teens are in fact 10x more likely than the average person to be on Snapchat. What’s more, Snapchat is more popular than either Facebook Messenger or WhatsApp among American teens. It’s also at parity in markets like Sweden, Ireland and Canada. Little wonder, then, why it’s such a thorn in Facebook’s side.
Teens are also noticeably ahead on services such as Kik Messenger (2.82 over-index), Vine (2.70 over-index), Tumblr (2.64) and Instagram (1.61). The latter yet again demonstrates just how vital Facebook’s acquisitions have been; while 16-19s are slightly more likely than average to be using Facebook’s main or Messenger apps, their strong adoption of Facebook-owned Instagram means that this key group is still active within the wider Facebook eco-system.
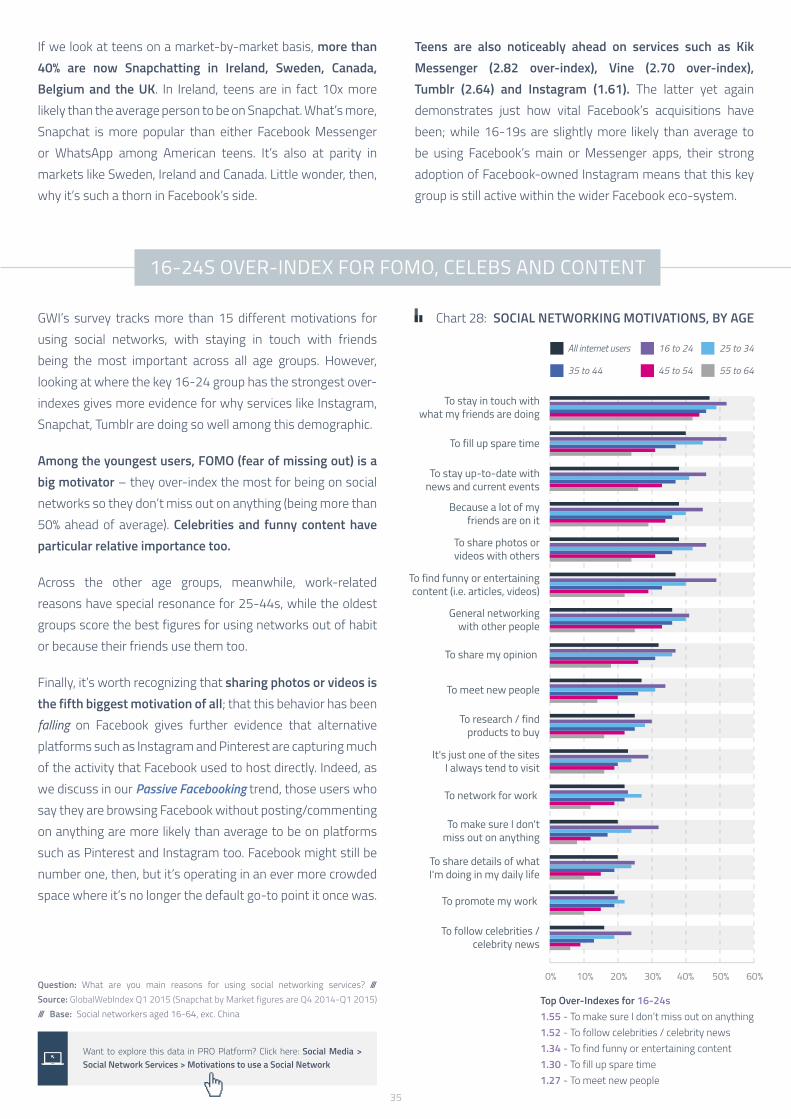
16-24S OVER-INDEX FOR FOMO, CELEBS AND CONTENT
GWI’s survey tracks more than 15 different motivations for using social networks, with staying in touch with friends being the most important across all age groups. However, looking at where the key 16-24 group has the strongest over-indexes gives more evidence for why services like Instagram, Snapchat, Tumblr are doing so well among this demographic.
Among the youngest users, FOMO (fear of missing out) is a big motivator – they over-index the most for being on social networks so they don’t miss out on anything (being more than 50% ahead of average). Celebrities and funny content have particular relative importance too.
Across the other age groups, meanwhile, work-related reasons have special resonance for 25-44s, while the oldest groups score the best figures for using networks out of habit or because their friends use them too.
Finally, it’s worth recognizing that sharing photos or videos is the fifth biggest motivation of all; that this behavior has been falling on Facebook gives further evidence that alternative platforms such as Instagram and Pinterest are capturing much of the activity that Facebook used to host directly. Indeed, as we discuss in our Passive Facebooking trend, those users who say they are browsing Facebook without posting/commenting on anything are more likely than average to be on platforms such as Pinterest and Instagram too. Facebook might still be number one, then, but it’s operating in an ever more crowded space where it’s no longer the default go-to point it once was.
Chart 28: SOCIAL NETWORKING MOTIVATIONS, BY AGE
Question: What are you main reasons for using social networking services? /// Source: GlobalWebIndex Q1 2015 (Snapchat by Market figures are Q4 2014-Q1 2015) /// Base: Social networkers aged 16-64, exc. China
Want to explore this data in PRO Platform? Click here: Social Media > Social Network Services > Motivations to use a Social Network
Top Over-Indexes for 16-24s 1.55 - To make sure I don’t miss out on anything1.52 - To follow celebrities / celebrity news1.34 - To find funny or entertaining content1.30 - To fill up spare time1.27 - To meet new people
36
FUTUREOUTLOOK7
• Specialization and monetization are the two themes to watch in 2015, especially for messaging apps. To date, most names in this space have been concentrating on grabbing as many users as possible; now, a greater focus will be placed on monetizing these audiences – one of the key reasons why so many chat apps have been evolving beyond simple communication channels to become comprehensive, stand-alone platforms in their own right. From content to VOIP, money transfers to in-app purchases, it’s patently clear that we’ll soon be doing a lot more on messaging tools than we have done in the past.
• As this happens, it’s inevitable that services will become a little more specialized, as has long been the case with the “traditional” social networks. Put another way, just as Instagram is the site for photos and Tumblr the go-to point for blogging, it’s highly likely that certain messaging apps will become closely associated with particular activities too. Levels of branded activity on these apps are also bound to increase. But what’s particularly interesting here is that digital consumers are less loyal to messaging apps than they are to social networks proper. In short, it’s easier to lure people away from one chat app to another than it is to get them to switch social networks (one of the reasons why names like Ello and Google+ have struggled). So, demonstrate that there are clear benefits to switching apps and the battle is half won. That this will be a key year in deciding which messaging apps emerge as the ultimate “winners” in this area of the social landscape is pretty clear.
• Despite finding ways to post quarter-on-quarter rises in its own self-published figures, the reality for Facebook is that its future growth levels will be modest at best. Increasingly, it is having to rely on fast-growth markets – where internet populations continue to expand rapidly each year – to add new members in any meaningful quantities; elsewhere, it has reached saturation point and is now employing an extremely broad definition of active usage. It knows that it can’t keep growing exponentially and hence will need to look for new ideas, and new audience types, to maintain momentum and to keep investors/headline writers happy. Enter services like Facebook At Work as well as its Timehop-imitating feature which shows posts from a user’s past and encourages them to repost them. In both cases, this is a way to increase engagement among existing audiences. We can expect to see more of this during 2015.
• For services like Twitter, YouTube and LinkedIn, “visitor” metrics are likely to become every bit as important as the traditional “active user” measure – allowing them to demonstrate that they have much bigger audiences than any simple MAU metric could reveal. The challenge of monetizing “hidden” users who are either logged out or not registered as members will also receive much more attention.
• Almost certainly, the year ahead will see yet more headlines which proclaim the “death of Facebook” or the “end of social networking”. But while behaviors will certainly continue to evolve and diversify, it’s simply not the case that traditional networking as we know it will suddenly disappear. Nor will Facebook suddenly be deposed; it’s too ingrained within online behaviors, and within the infrastructure of the internet, to lose its relevance overnight.

37
Copyright © Trendstream Limited 2015
All rights, including copyright, in the content of GlobalWebIndex (GWI) webpages and publications (including, but not limited to, GWI reports and blog posts) are owned and controlled by Trendstream Limited. In accessing such content, you agree that you may only use the content for your own personal non-commercial use and that you will not use the content for any other purpose whatsoever without an appropriate licence from, or the prior written permission of, Trendstream Limited. Trendstream Limited uses its reasonable endeavours to ensure the accuracy of all data in GWI webpages and publications at the time of publication. However, in accessing the content of GWI webpages and publications, you agree that you are responsible for your use of such data and Trendstream Limited shall have no liability to you for any loss, damage, cost or expense whether direct, indirect consequential or otherwise, incurred by, or arising by reason of, your use of the data and whether caused by reason of any error, omission or misrepresentation in the data or otherwise.
www.globalwebindex.net
Jason ManderHead of Trends
E [email protected] @thejasonmander
T +44 20 7731 1614 /// A GlobalWebIndex, Bedford House, 69-79 Fulham High Street, London, SW6 3JW, UK