gypsum industries limited ipc licence no. 519-02 · gypsum industries limited ipc licence no....
TRANSCRIPT

Gypsum Industries Limited
IPC Licence No. 519-02
Annual Environmental Report
Reporting Period Jan - Dec 2008

CONTENTS
1.0 INTRODUCTION
2.0 EMISSIONS TO ATMOSPHERE
3.0 EMISSIONS TO WATER
4.0 EMISSIONS TO SURFACE WATER
5.0 AMBIENT SURFACE WATER MONITORING
6.0 SUMMARY OF BLAST, VIBRATION AND AOP MONITORING
7.0 WASTE MANAGEMENT REPORT
8.0 RESOURCE MANAGEMENT CONSUMPTION
9.0 COMPLAINTS AND INCIDENT SUMMARY
10.0 OBJECTIVES AND TARGETS
11.0 ENVIRONMENTAL MANAGAMENT PROGRAMME
12.0 POLLUTION EMISSION REGISTER
13.0 NOISE MONITORING REPORT
14.0 GROUND WATER MONITORING SUMMARY
15.0 AMBIENT AIR MONITORING SUMMARY
16.0 BUND INTEGRITY TESTING REPORT
17.0 CRAMP AND ELRA REVIEW
APPENDICES
(I) ENVIRONMENTAL POLICY
(II) MACROINVERTEBRATE BIOASSESSMENT (PROCESS SITE)
(III) MACROINVERTEBRATE BIOASSESSMENT (MINE SITE)
(IV) 2008 GROUND WATER RESULTS
(V) PROPOSED GUIDELINE VALUES FOR GROUNDWATER
(VI) 2008 GROUND WATER RESULTS AND INTERPRETATION
(VII) SUMMARY TABLES PRTR
(VIII) DRAWING OF LANDFILL SITE

1.0 INTRODUCTION

GYPSUM INDUSTRIES LIMITED
AER
JANUARY 2008-DECEMBER 2008
1.0 Introduction
This Annual Environmental Report of Gypsum Industries Limited (GIL) covers the period
from January 2008- December 2008.
Founded in 1936 and now employing 235 people, Gypsum Industries Limited is situated
close to the town of Kingscourt, Co Cavan, one hundred kilometres from Dublin. In addition
to the process site, the 118 acre site contains storage silos, warehouses, workshops, a
landfill and water lagoon system.
Irish Gypsum is situated close to the town of Carrickmacross, Co Monaghan, ninety
kilometres from Dublin. In addition to the mining and quarry operation, the 206 acre site
contains the Crushing plant, homogeniser, Lorry loading facility, office buildings, workshops,
and lagoon systems.
Gypsum Industries Limited (GIL) manufactures plaster and plaster boards for the
construction industry. Gypsum is mined underground and quarried opencast. The site is
located 4.5km southwest of Carrickmacross.
Gypsum is a non metallic mineral, which is found in rock form. It is composed of Calcium
Sulphate di-hydrate. After mining Gypsum is crushed and transported by road to the
processing facility where it is calcined and then converted to cement, gypsum plaster boards
or builders plaster.
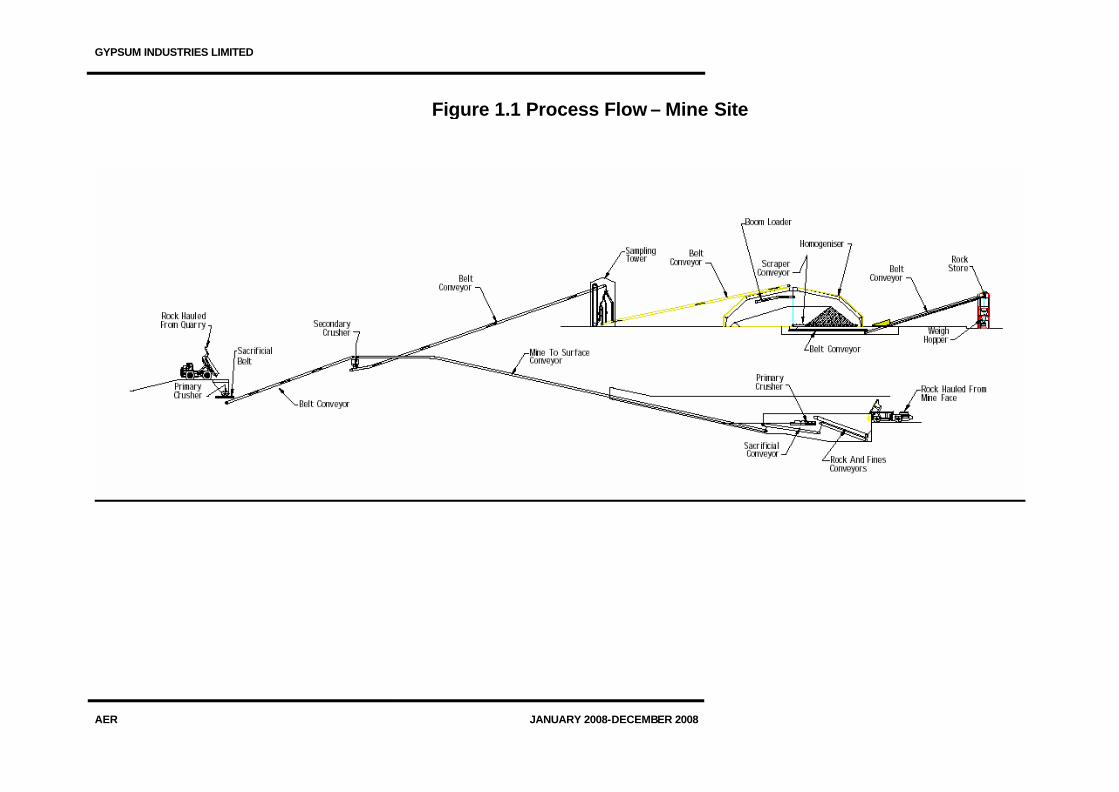
1.1 Production Process
The process of making Gypsum plaster and plaster board products is shown schematically
overleaf and can be summarised as follows:
1. Raw material is mined, crushed, homogenised and tested before delivery to the process
site or direct to customers
2. The crushed rock is transported by road to the process site.
3. The rock is fed into Raymond mills where the particle size is further decreased.
4. This material is fed into Kettles which calcine (drive off some of the chemically bound
water) the Gypsum material to make Stucco
5. Stucco is then fed to the board plant or plaster mill where the ingredients are added to
make the various products.

GYPSUM INDUSTRIES LIMITED
AER
JANUARY 2008-DECEMBER 2008
Kettle
Extruder
DryerGrindingStacker
Process Flowchart
Knife
Mixer
Ray
mon
d M
ill
Crusher
Rock Intake
Tub
e M
ill
Aggregate/Ingredients
Mixing Bagging
Ingredients
Figure 1.0 Process Flow – Process Site
GYPSUM INDUSTRIES LIMITED
AER
JANUARY 2008-DECEMBER 2008
Figure 1.1 Process Flow – Mine Site

GYPSUM INDUSTRIES LIMITED
AER
JANUARY 2008-DECEMBER 2008
1.2 Environmental Issues
As an organisation involved in the mining and manufacturing process there is a strong
awareness of environmental issues. Since GIL was established, the company has
demonstrated their commitment to good business and environmental standards and practice.
This commitment has been shown through registration to the following standards and
achievement of awards:
1990 Registered to ISO 9002:1990
2002 Obtained Integrated Pollution Control Licence.
2003 Registered to ISO 9001:2000
2004 Registered to ISO 14001 2004
In line with legislative requirements GIL applied for and was issued with an Integrated
Pollution Prevention and Control Licence (IPPC) by the Environment Protection Agency in
July 2002. Procedures are in place to achieve compliance with ISO 14001 and the IPPC
Licence.
1.3 Environmental Policy
A copy of the environmental policy is attached as Appendix (i)

2.0 EMISSIONS TO ATMOSPHERE

GYPSUM INDUSTRIES LIMITED
AER
JANUARY 2008-DECEMBER 2008
1.0 Summary of Process Emissions to Atmosphere:
There are eight IPPC licensed process air emission points. A brief description of
each is presented below.
Electrostatic Precipitator (AE-1)
The electrostatic precipitator was replaced by a bag filtration system in order to
comply with the limits specified in our IPPC licence.
A combination of four Raymond Mills (R1-R4) and three kettles (K3-K5) exhaust
through this bag filtration system. These units all operate on natural gas
Cyclones at the top of the kettles and Raymond’s collect the majority of the stucco
carried by the air flowing through the kettles and Raymond mills. The remaining
exhaust gases from the kettle and Raymond mills circuits, which contain excess hot
air, products of combustion and particulate matter are passed through the bag
filtration system. Kettles also exhaust steam.
The particulate matter is removed from the gas stream and the remaining emissions
are discharged to atmosphere via the AE-1 stack.
The concentration of particulates in monitored continuously using a PCME SC 600
opacity monitor which is located in the kettle control room.
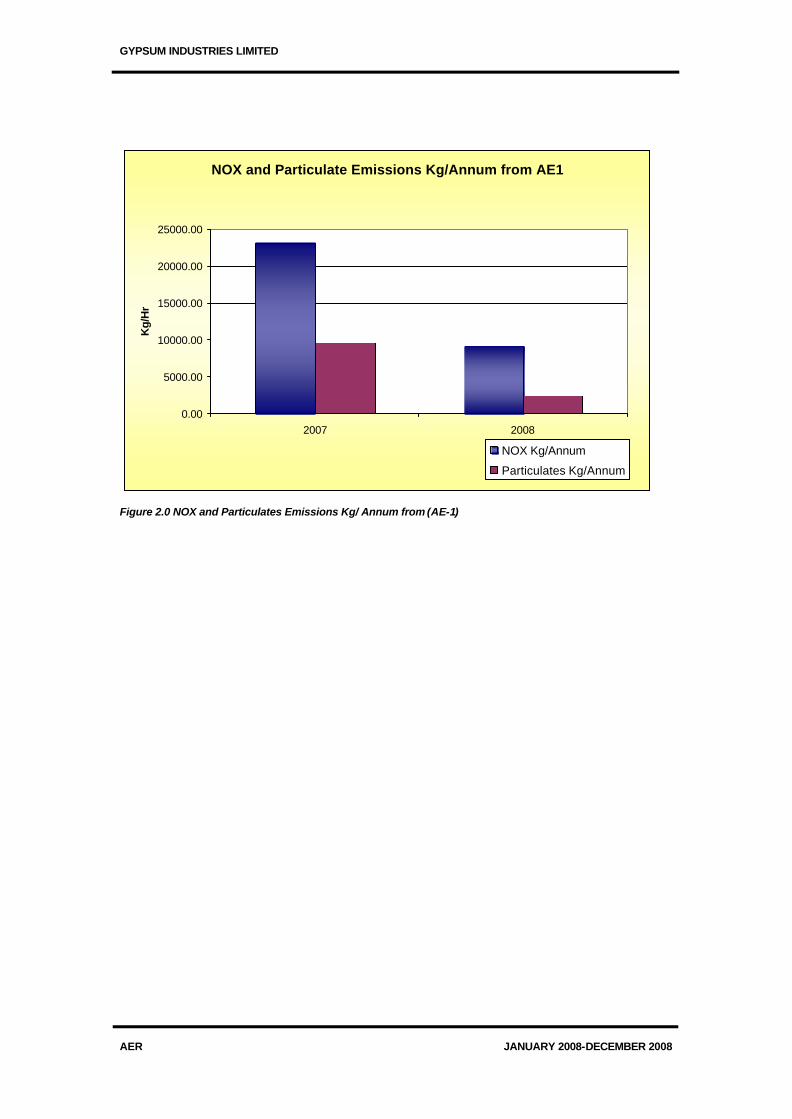
The NOX air emissions from AE1 have decreased this year. Air emissions are
measured on AE1 quarterly. The average mass emission rate was 1.85 kgs/ hr,
(based on measurements of 1.8, 4.7, 0.3 and 0.6 kg/hr respectively). The average
emission limit value was 23.45 mg/m3, (based on measurements of 41, 47, 1.8 and
4.1 mg/m3 respectively). This is within the limit of 130 mg/m3.
The Particulate air emissions from AE1 have decreased this year. The average mass
emission rate was 0.49 kgs/ hr, (based on measurements of 0.82, 1.10, 0.0012 and
0.049 kg/hr respectively). The average emission limit value was 11.58 mg/m3,
(based on measurements of 11.5, 13.96, 18 and 2.86 mg/m3 respectively). This is
within the limit of 50 mg/m3.
GYPSUM INDUSTRIES LIMITED
AER
JANUARY 2008-DECEMBER 2008
NOX and Particulate Emissions Kg/Annum from AE1
0.00
5000.00
10000.00
15000.00
20000.00
25000.00
2007 2008
Kg/
Hr
NOX Kg/Annum
Particulates Kg/Annum
Figure 2.0 NOX and Particulates Emissions Kg/ Annum from (AE-1)

GYPSUM INDUSTRIES LIMITED
AER
JANUARY 2008-DECEMBER 2008
Board Plant Drier exhaust (BE-1)
In the board plant, plaster boards are dried in a 10 deck flat bed dryer which is fired on
Natural gas. Wet board is passed through five small pre zone burners and three main zones
in the dryer. The zones differ in temperature and humidity and drive water vapour off the
product. The exhaust gases from pre-zone and zones 1 and 2 are run through a heat
exchanger for energy efficiency purposes. They are used to pre heat supply air for
combustion and process air.
The exhaust gases for the board plant drier are hot air, steam and the products of
combustion.
NOX Emissions Kg/Annum from Board Plant Dryer Exhaust (BE1)
0.00
2000.00
4000.00
6000.00
8000.00
10000.00
12000.00
14000.00
16000.00
18000.00
2007 2008
Kg
/Hr
Figure 2.0 NOX Emissions Kg/ Annum from Board Plant Dryer Exhaust (BE-1)
The NOX air emissions from BE1 have decreased this year. Air emissions are measured on
BE1 quarterly. The average mass emission rate was 2.5 kgs/ hr, (based on measurements of
1.94, 1.35, 3.68 and 3.03 kg/hr respectively). The average emission limit value was 37.08
mg/m3, (based on measurements of 23, 50, 42 and 33.3 mg/m3 respectively). This is within
the limit of 130 mg/m3.

GYPSUM INDUSTRIES LIMITED
AER
JANUARY 2008-DECEMBER 2008
Air Emissions (Kg Annum) - NOX
0
1000
2000
3000
4000
5000
6000
7000
8000
9000
BE-4 BE-5 BE-6
2007
2008
Figure 2.1 NOX Emissions Kg/ Annum from Kettles 3, 4 and 5t (BE-4, BE-5, BE-6)
The NOX emissions to air from BE4 have increased this year. The mass emission rate was
1.7 kgs/ hr. The emission limit value was 163 mg/m3. This is within the limit of 200 mg/m3.
The NOX air emissions from BE5 have increased this year. The mass emission rate was 0.1
kgs/ hr. The emission limit value was 154 mg/m3. This is within the limit of 200 mg/m3.
The NOX air emissions from BE6 have decreased this year. The emission limit value was
286 mg/m3. This was outside the limit of 200 mg/m3. Flow during the monitoring event was
very low at 665 Nm3/hr. The mass emission rate was 0.04 kgs/ hr.
Kettle No 6 Exhausts (AE-8)
Kettle 6 is a conical kettle utilising direct fired heating. Kettle No 6 works in conjunction with
Raymond mill 5 to calcine the material to supply stucco to the board plant.
Kettle No 6 is connected to an independent cyclone and bag filtration system. The exhaust
gases from Kettle 6 include steam, the products of combustion and particulates.
The exhaust from this stack was previously connected into the AE-1 exhaust. A technical
amendment was granted in June 2008, allowing GIL to divert the exhaust from kettle 6
directly through AE-8. NOX and particulates are monitored annually by external consultants.
There were 63,984 Kgs of NOX emitted from AE-8 in 2008. The mass emission rate was
12.9 kgs/ hr. The emission limit value was 94.8 mg/m3. This is within the limit of 130 mg/m3.

GYPSUM INDUSTRIES LIMITED
AER
JANUARY 2008-DECEMBER 2008
Perlite and Vermiculite expanders (AE 10)
Raw perlite and vermiculite is fed into rotary expanders. These expanders are heated using
natural gas. The heat causes the perlite/ vermiculite to expand. The expanded material is
passed through a cyclone and then to storage bins.
The exhaust gases from the cyclones are then passed through a single bag filtration system.
Exhaust gases include the products of combustion and particulates.
GIL applied for and received a technical amendment during 2008 for this emission point.
Technical amendment C. The technical amendment was granted in late November 2008.
This is a new emission point. Air emissions were measured once in 2008, but will be
monitored bi-annually in future.
The Particulate mass emission rate was 0.1913 kgs/ hr. The emission limit value was 14
mg/m3. This is within the limit of 20 mg/m3. The NOX mass emission rate was 0.13 kgs/hr.
The emission limit value was 6 mg/m3. This is within the limit of 50 mg/m3.
Kettle Exhausts (BE 4, BE 5, BE 6)
Kettles calcine the graded material from the Raymond mills. Kettle 3, 4 and 5 are multi-tubed
kettles. There are two burners on each kettle. The Submerged (Top) burner utilises direct
heat into the product, while the bottom burner uses indirect heat to heat the product.
The Submerged (Top) burner exhausts pass through cyclones and then onto the bag
filtration system on AE-1.
The exhaust from the bottom burners contains the products of combustion and particulates.
These exhaust gases are used to preheat the Raymonds through a computerised PLC
system. Each Kettle has an individual exhaust. Kettle 3 - BE 4, Kettle 4 – BE5, and Kettle 5
– BE-6. The monitoring frequency is annually.

GYPSUM INDUSTRIES LIMITED
AER
JANUARY 2008-DECEMBER 2008
There were 2733 Kgs of particulates emitted from AE-8 in 2008. The mass emission rate
was 0.551 kgs/ hr. The emission limit value was 3.08 mg/m3. This is within the limit of 50
mg/m3.
Raymond Mill No 5 Exhausts (AE-9)
Raymond Mill 5 grinds crushed rock down to 150 um to supply Kettle No 6. Surface drying is
also completed in Raymond Mill 5.
Raymond Mill 5 is connected to an independent cyclone and bag filtration system. The
exhaust gases contain the products of combustion and particulates.
NOX and particulates are monitored annually by external consultants.
There were 5923 Kgs of NOX emitted from AE-9 in 2008. The mass emission rate was 1.2
kgs/ hr. The emission limit value was 7.5 mg/m3. This is within the limit of 130 mg/m3.
There were 1135 Kgs of particulates emitted from AE-9 in 2008. The mass emission rate
was 0.23 kgs/ hr. The emission limit value was 9.24 mg/m3. This is within the limit of 50
mg/m3.
3.0 EMISSIONS TO WATER
GYPSUM INDUSTRIES LIMITED
AER
JANUARY 2008-DECEMBER 2008
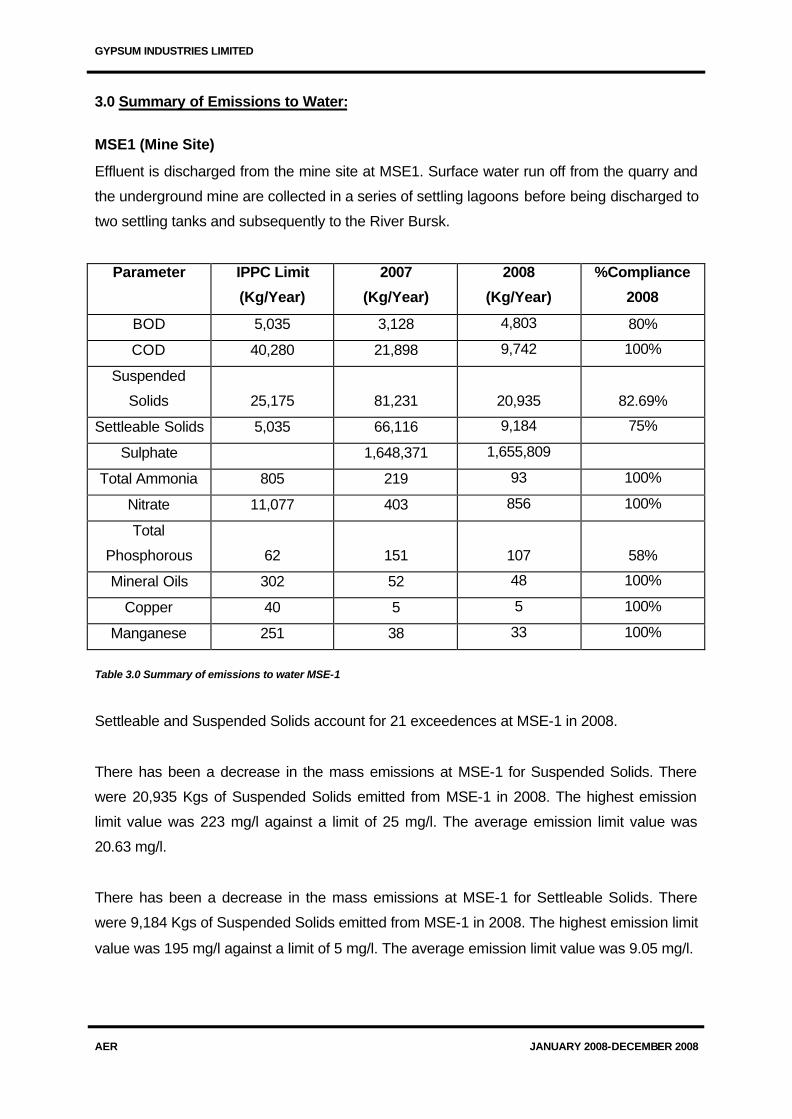
3.0 Summary of Emissions to Water:
MSE1 (Mine Site)
Effluent is discharged from the mine site at MSE1. Surface water run off from the quarry and
the underground mine are collected in a series of settling lagoons before being discharged to
two settling tanks and subsequently to the River Bursk.
Parameter
IPPC Limit
(Kg/Year)
2007
(Kg/Year)
2008
(Kg/Year)
%Compliance
2008
BOD 5,035 3,128 4,803 80%
COD 40,280 21,898 9,742 100%
Suspended
Solids 25,175
81,231
20,935
82.69%
Settleable Solids 5,035 66,116 9,184 75%
Sulphate 1,648,371 1,655,809
Total Ammonia 805 219 93 100%
Nitrate 11,077 403 856 100%
Total
Phosphorous 62
151
107
58%
Mineral Oils 302 52 48 100%
Copper 40 5 5 100%
Manganese 251 38 33 100%
Table 3.0 Summary of emissions to water MSE-1
Settleable and Suspended Solids account for 21 exceedences at MSE-1 in 2008.
There has been a decrease in the mass emissions at MSE-1 for Suspended Solids. There
were 20,935 Kgs of Suspended Solids emitted from MSE-1 in 2008. The highest emission
limit value was 223 mg/l against a limit of 25 mg/l. The average emission limit value was
20.63 mg/l.
There has been a decrease in the mass emissions at MSE-1 for Settleable Solids. There
were 9,184 Kgs of Suspended Solids emitted from MSE-1 in 2008. The highest emission limit
value was 195 mg/l against a limit of 5 mg/l. The average emission limit value was 9.05 mg/l.

GYPSUM INDUSTRIES LIMITED
AER
JANUARY 2008-DECEMBER 2008
Extensive Work has commenced to achieve compliance for MSE-1 monitoring. A lagoon
cleaning programme has commenced. Two settling lagoons were cleaned in 2008. Work on
the third started but had to be abandoned due to adverse weather conditions.
In addition to this bench and field trials have been completed to identify a suitable settling
agent for the lagoon effluent. The installation of a settling system has been included in the
2009 Environmental Objectives and Targets.
There has been an increase in the mass emissions at MSE-1 for BOD. There were 4,803
Kgs of BOD emitted from MSE-1 in 2008. The highest emission limit value was 11 mg/l
against a limit of 5 mg/l. The average emission limit value was 4.73 mg/l, which is in fact
below the emission limit value.
There has been a decrease in the mass emissions at MSE-1 for Total Phosphorous. There
were 107 Kgs of Total Phosphorous emitted from MSE-1 in 2008. The highest emission limit
value was 0.3 mg/l against a limit of 0.062 mg/l. The average emission limit value was 0.11
mg/l.
These incidents were investigated and no obvious cause was identified. The delay between
sample collection and obtaining the results from our laboratory mitigates against identifying
the cause. In future we plan to take more careful cogniscence of conditions prevailing at the
time of sampling in an effort to establish the cause.

GYPSUM INDUSTRIES LIMITED
AER
JANUARY 2008-DECEMBER 2008
Water Emissions 2007-2008 MSE-1
-
10,000
20,000
30,000
40,000
50,000
60,000
70,000
80,000
90,000
BOD COD SuspendedSolids
SettleableSolids
Chlorides
2007 Mass emissions:
2008 Mass emissions:
Water Emissions 2007-2008 MSE-1
-
100
200
300
400
500
600
700
800
900
TotalAmmonia
Nitrate TotalPhosphorous
Mineral Oils Copper Manganese
2007 Mass emissions:
2008 Mass emissions:
Figure 3.0 Water Emissions at MSE-1. 2007 V’S 2008 Figure 3.1 Water Emissions at MSE-1. 2007 V’S 2008
There has been a decrease in the mass emissions at MSE-1 for COD, Suspended Solids, Settleable Solids and Chlorides. There has been a
slight increase in BOD mass emissions at MSE-1. There were 4,803 Kgs of BOD emitted from MSE-1 in 2008. The highest emission limit value
was 11 mg/l against a limit of 5 mg/l. The average emission limit value was 4.73 mg/l.
There has been a decrease in the mass emissions at MSE-1 for Ammonia, Total Phosphorous, Mineral Oils and Manganese. The mass
emission of Copper at MSE-1 has remained steady. . There has been an increase in Nitrate mass emissions at MSE-1, however all analysis
results for Nitrate at MSE-1 were compliant.

GYPSUM INDUSTRIES LIMITED
AER
JANUARY 2008-DECEMBER 2008
CP1 (Mine Site)
CP1 is situated 70m downstream of MSE1 on the River Bursk.
Parameter
IPPC Limit
(mg/l)
2007
Average
(mg/l)
2008
Average
(mg/l)
%Compliance
2008
Conductivity (uS/cm) 1000 723.7 478.7 98%
Sulphate (mg/l) 200 180.5 113.2 89%
Temperature (oC) 11.8 10.4
Nitrate (mg/l N) 1.2 1.2
Suspended Solids (mg/l) 48.3 19.0
BOD (mg/l) 3.0 3.0
Total Phosphorous (mg/l) 0.5 0.48
Table 3.1 Water Monitoring Results at CP1
Water Monitoring Results CP-1 2007-2008
0.0
100.0
200.0
300.0
400.0
500.0
600.0
700.0
800.0
Sulphate (mg/l) Conductivity (uS/cm)
2007
2008
Figure 3.2 Water Monitoring Results at CP1
There has been a decrease in the average ELV at CP1-1 for Sulphate.
There has been a decrease in the average ELV at CP1-1 for Conductivity.

GYPSUM INDUSTRIES LIMITED
AER
JANUARY 2008-DECEMBER 2008
Water Monitoring Results CP-1 2007-2008
0.0
10.0
20.0
30.0
40.0
50.0
60.0
Temperature(oC)
Nitrate (mg/l N) SuspendedSolids (mg/l)
BOD (mg/l) TotalPhosphorous
(mg/l)
2007
2008
Figure 3.3 Water Monitoring Results at CP1
The improvements noted at MSE-1 for suspended solids are mirrored at CP-1. While Nitrate
load increased at MSE-1, monitoring results for Nitrate remained steady at CP-1. While BOD
load increased slightly at MSE-1, monitoring results remained steady for BOD at CP-1. Total
phosphorous levels at CP-1 remained relatively unchanged.

GYPSUM INDUSTRIES LIMITED
AER
JANUARY 2008-DECEMBER 2008
Water Monitoring Results - 2008 CP1
0.0
200.0
400.0
600.0
800.0
1000.0
1200.0
Sulphate (mg/l) Conductivity (uS/cm)
Average CP1
Max CP1
Figure 3.4 2008 Water Monitoring Results at CP1
The highest conductivity emission value measured 1067mg/l against a limit of 1000 mg/l.
This accounted for the only exceedence at CP1 for conductivity in 2008. Monitoring is
conducted weekly.
The highest Sulphate emission value measured 435mg/l against a limit of 200 mg/l. There
were 6 exceedences at CP1 for Sulphate in 2008. Monitoring is conducted weekly.
Water Monitoring Results - 2008 CP1
0.0
20.0
40.0
60.0
80.0
100.0
120.0
140.0
Tempe
rature
(oC)
Nitrate (
mg/l N)
Suspe
nded
Solids
(mg/l)
BOD (m
g/l)
Total
Phosp
horou
s (mg/l)
Average CP1
Max CP1
Figure 3.5 2008 Water Monitoring Results at CP1
GYPSUM INDUSTRIES LIMITED
AER
JANUARY 2008-DECEMBER 2008
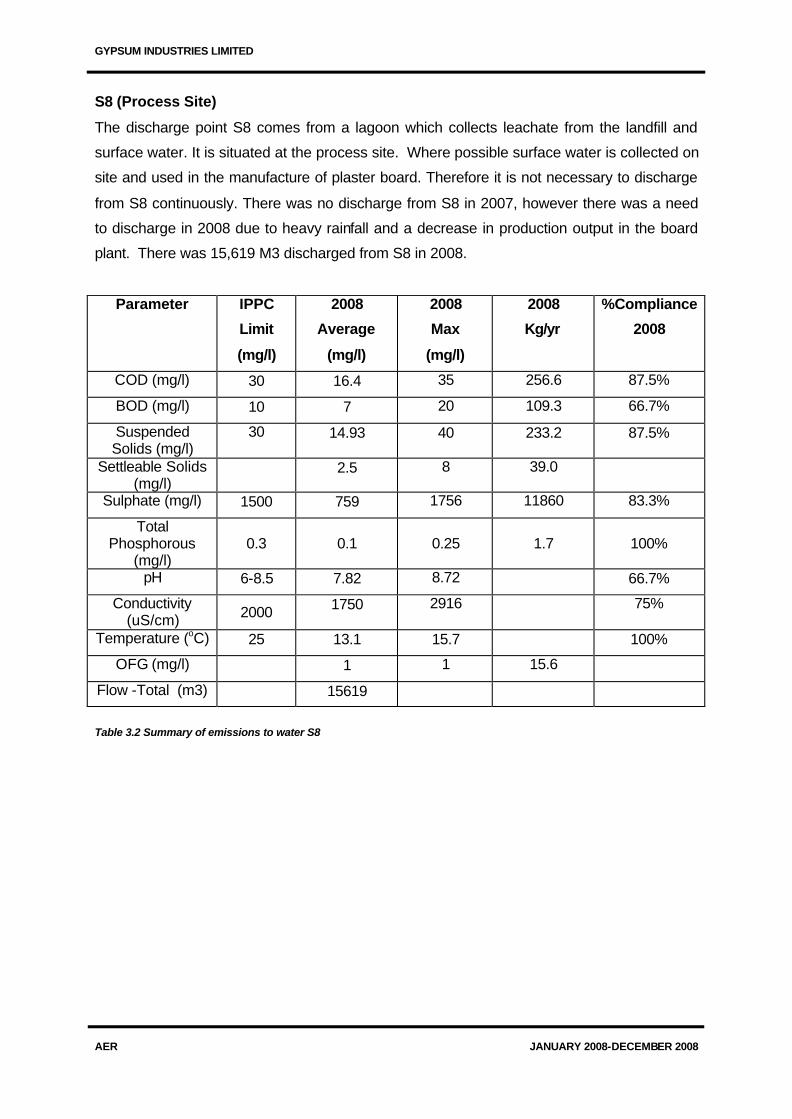
S8 (Process Site)
The discharge point S8 comes from a lagoon which collects leachate from the landfill and
surface water. It is situated at the process site. Where possible surface water is collected on
site and used in the manufacture of plaster board. Therefore it is not necessary to discharge
from S8 continuously. There was no discharge from S8 in 2007, however there was a need
to discharge in 2008 due to heavy rainfall and a decrease in production output in the board
plant. There was 15,619 M3 discharged from S8 in 2008.
Parameter
IPPC
Limit
(mg/l)
2008
Average
(mg/l)
2008
Max
(mg/l)
2008
Kg/yr
%Compliance
2008
COD (mg/l) 30 16.4 35 256.6 87.5%
BOD (mg/l) 10 7 20 109.3 66.7%
Suspended Solids (mg/l)
30 14.93 40 233.2 87.5%
Settleable Solids (mg/l) 2.5 8 39.0
Sulphate (mg/l) 1500 759 1756 11860 83.3%
Total Phosphorous
(mg/l) 0.3
0.1
0.25
1.7
100%
pH 6-8.5 7.82 8.72 66.7%
Conductivity (uS/cm) 2000 1750 2916 75%
Temperature (oC) 25 13.1 15.7 100%
OFG (mg/l) 1 1 15.6
Flow -Total (m3) 15619
Table 3.2 Summary of emissions to water S8

GYPSUM INDUSTRIES LIMITED
AER
JANUARY 2008-DECEMBER 2008
Water Monitoring Results 2008 -S8
0
500
1000
1500
2000
2500
3000
3500
Conductivity (uS/cm) Sulphates (mg/l)
Average
Max
Figure 3.6 2008 Water Monitoring Results at S8
The highest conductivity emission value measured at S8 was 2916mg/l against a limit of
2000 mg/l. There were 2 exceedences at S8 for conductivity in 2008.
The highest Sulphate emission value measured at S8 was 1756 mg/l against a limit of 1500
mg/l. There was 1 exceedence at S8 for Sulphate in 2008.

GYPSUM INDUSTRIES LIMITED
AER
JANUARY 2008-DECEMBER 2008
Water Monitoring Results 2008 -S8
0
5
10
15
20
25
30
35
40
45
pH Temp (oC) COD (mg/l) SuspendedSolids (mg/l)
SettleableSolids (mg/l)
TotalPhosphorous
(mg/l)
OFG (mg/l) BOD (mg/l)
Average Max
Figure 3.7 2008 Water Monitoring Results at S8
There were 256 Kgs of COD emitted from S8 in 2008. The highest emission value was 35
mg/l against a limit of 30 mg/l. The average emission value was 16.4 mg/l, which is below the
emission limit value.
There were 109.3 Kgs of BOD emitted from S8 in 2008. The highest emission value was 20
mg/l against a limit of 10 mg/l. The average emission value was 7.0 mg/l, which is below the
emission limit value.
There were 233.2 Kgs of Suspended Solids emitted from S8 in 2008. The highest emission
value was 40 mg/l against a limit of 30 mg/l. The average emission value was 14.93 mg/l,
which is below the emission limit value. The average settleable solids emission value was
2.5 mg/l, the highest emission limit value was 8mg/l. 39.0 Kgs of settleable solids were
discharged from S8 in 2008.
The average temperature of S8 discharge was 13.1oC, with a maximum of 15.7 oC. The
average pH was 7.82 while the highest pH recorded was 8.72, which is just marginally over
the limit of 8.5. There were 2 exceedences for pH at S8 in 2008.

GYPSUM INDUSTRIES LIMITED
AER
JANUARY 2008-DECEMBER 2008
There were 109.3 Kgs of BOD emitted from S8 in 2008. The highest emission value was 20
mg/l against a limit of 10 mg/l. The average emission value was 7.0 mg/l, which is below the
emission limit value.
There were 1.7 Kgs of Phosphorous emitted from S8 in 2008. The highest emission value
was 0.25 mg/l against a limit of 0.3 mg/l. The average emission value was 0.1 mg/l. There
was 15.6Kgs of Oils, Fats and Greases emitted from S8 in 2008. All results obtained were <1
mg/l.
GYPSUM INDUSTRIES LIMITED
AER
JANUARY 2008-DECEMBER 2008
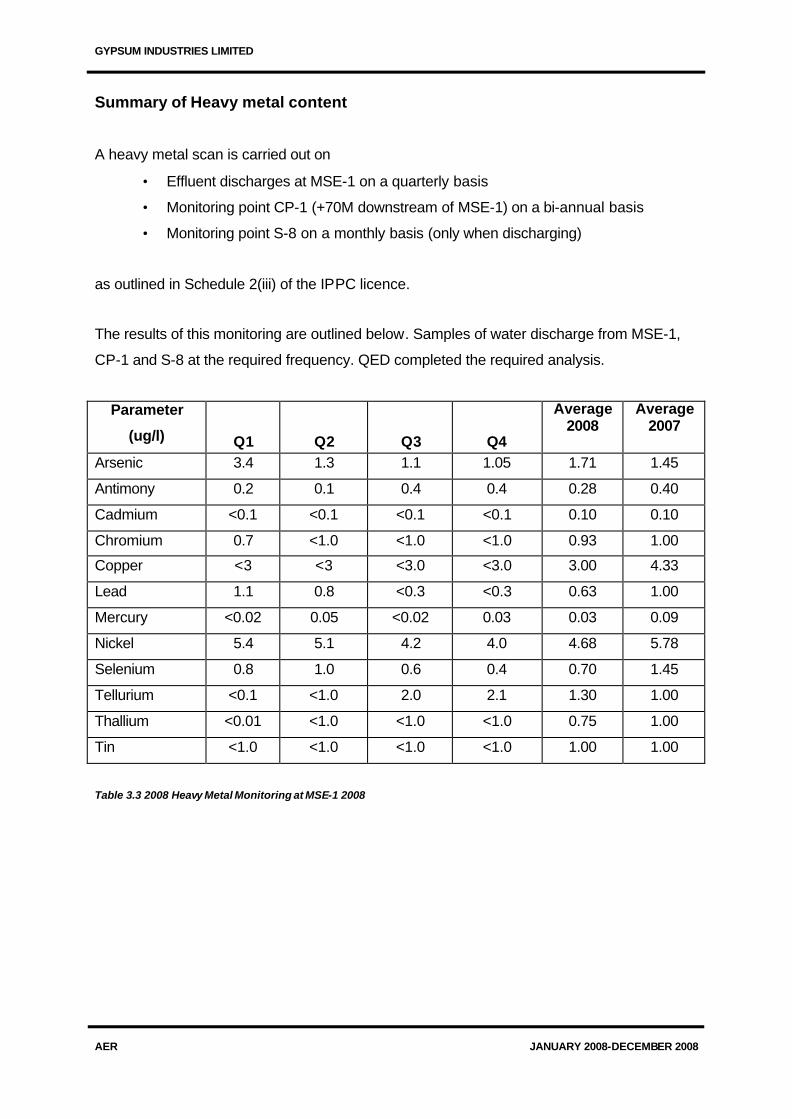
Summary of Heavy metal content
A heavy metal scan is carried out on
• Effluent discharges at MSE-1 on a quarterly basis
• Monitoring point CP-1 (+70M downstream of MSE-1) on a bi-annual basis
• Monitoring point S-8 on a monthly basis (only when discharging)
as outlined in Schedule 2(iii) of the IPPC licence.
The results of this monitoring are outlined below. Samples of water discharge from MSE-1,
CP-1 and S-8 at the required frequency. QED completed the required analysis.
Parameter
(ug/l) Q1 Q2 Q3 Q4
Average 2008
Average 2007
Arsenic 3.4 1.3 1.1 1.05 1.71 1.45
Antimony 0.2 0.1 0.4 0.4 0.28 0.40
Cadmium <0.1 <0.1 <0.1 <0.1 0.10 0.10
Chromium 0.7 <1.0 <1.0 <1.0 0.93 1.00
Copper <3 <3 <3.0 <3.0 3.00 4.33
Lead 1.1 0.8 <0.3 <0.3 0.63 1.00
Mercury <0.02 0.05 <0.02 0.03 0.03 0.09
Nickel 5.4 5.1 4.2 4.0 4.68 5.78
Selenium 0.8 1.0 0.6 0.4 0.70 1.45
Tellurium <0.1 <1.0 2.0 2.1 1.30 1.00
Thallium <0.01 <1.0 <1.0 <1.0 0.75 1.00
Tin <1.0 <1.0 <1.0 <1.0 1.00 1.00
Table 3.3 2008 Heavy Metal Monitoring at MSE-1 2008

GYPSUM INDUSTRIES LIMITED
AER
JANUARY 2008-DECEMBER 2008
Parameter
(ug/l) BA1 BA2
Average 2008
Average 2007
Arsenic 1.3 1.1 1.20 1.25
Antimony <0.1 0.1 0.10 0.20
Cadmium <0.1 <0.1 0.10 0.10
Chromium <1.0 <1.0 1.00 1.00
Copper <3 <3.0 3.00 5.75
Lead 0.8 <0.3 0.55 0.85
Mercury <0.02 <0.02 0.02 0.07
Nickel 2.9 1.8 2.35 3.15
Selenium <1.0 0.2 0.60 0.55
Tellurium <0.1 1.9 1.00 1.00
Thallium <0.1 <1.0 0.55 1.00
Tin <1.0 <1.0 1.00 1.00
Table 3.4 2008 Heavy Metal Monitoring at CP -1 2008

GYPSUM INDUSTRIES LIMITED
AER
JANUARY 2008-DECEMBER 2008
Parameter
(ug/l) April 2008
July 2008
Aug 2008
Sept 2008
Oct 2008
Dec 2008
Average
2008 Arsenic 2.4 3.5 2.4 1.4 1.3 <1 2.00 Antimony 0.5 0.1 0.4 0.2 0.7 <1 0.48 Cadmium <0.1 <0.1 <0.1 <0.1 <0.1 <0.4 0.15 Chromium <1.0 <1.0 <1.0 0.4 <1.0 3 1.23 Copper <3.0 <3.0 <3.0 <3.0 <3.0 5 3.33 Lead 3.5 <0.3 <0.3 <0.3 0.4 1 0.97 Mercury 0.08 <0.02 <0.02 <0.02 <0.02 <0.05 0.04 Nickel 2.7 3.9 3.0 2.8 2.5 6 3.48 Selenium 0.8 1.1 <0.2 0.4 0.9 <1.0 0.73 Tellurium <1.0 2 4.7 <1.0 <1.0 <1.0 1.78 Thallium <1.0 <1.0 <1.0 <1.0 <1.0 <1.0 1.00 Tin <1.0 <1.0 1.1 1.2 <1.0 <1.0 1.05 Table 3.5 2008 Heavy Metal Monitoring at S8 2008

GYPSUM INDUSTRIES LIMITED
AER
JANUARY 2008-DECEMBER 2008

4.0 EMISSIONS TO SURFACE WATER

GYPSUM INDUSTRIES LIMITED
AER
JANUARY 2008-DECEMBER 2008
4.0 Summary of Surface Water Monitoring
Surface water discharges are monitored as outlined in Schedule 4(i) of the IPPC licence. The
monitoring emission points are S3 at the process site and MSW-1 at the mine site.
Parameter
2007
Average
(mg/l)
2008
Average
(mg/l)
2008
Max
(mg/l)
COD (mg/l) 18.9 16.2 35.0
BOD (mg/l) 3.6 8.6 21.0
Suspended Solids (mg/l) 10.9 9.4 31.0
Settleable Solids (mg/l) 7.5 5.0 27.0
Sulphate (mg/l) 330.4 247.8 529.0
Total Phosphorous (mg/l) 0.2 0.1 0.3
Conductivity (uS/cm) 1233.2 740.9 1025
OFG (mg/l) 1.7 1.0 1.0
Table 4.0 2008 S-3 Monitoring Results
With the exception of BOD, all average emission values have decreased for monitoring
conducted at S3.
GYPSUM INDUSTRIES LIMITED
AER
JANUARY 2008-DECEMBER 2008
Parameter
2007
Average
(mg/l)
2008
Average
(mg/l)
2008
Max
(mg/l)
Temperature (°C) 11.8 8.55 8.46
pH 7.0 7.7 7
BOD (mg/l O2) 3.8 5 300.9
Calcium (mg/l) 195.0 219.175 1006
Sulphate (mg/l) 418.8 598.7 0.23
Total Phosphorus (mg/l) 0.76 0.0925 14
Total Nitrogen (mg/l) 3.25 4.75 1329
Conductivity (µS/cm) 1314.25 1017.75 14.2
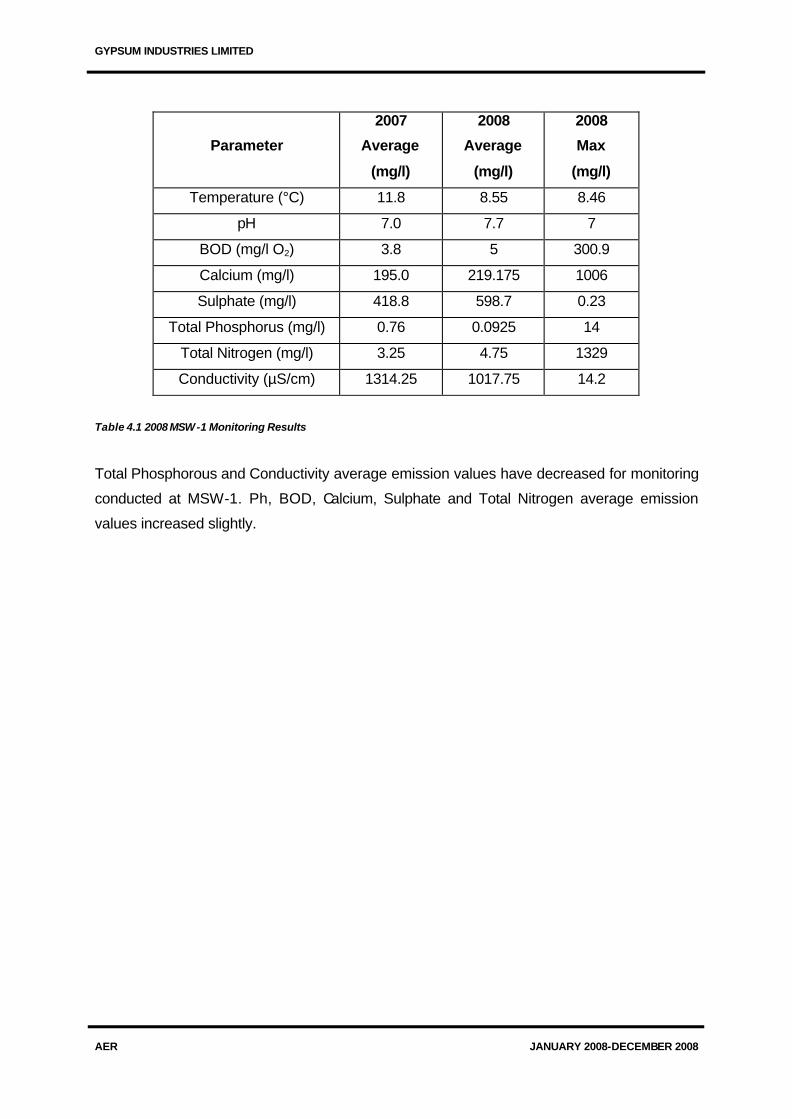
Table 4.1 2008 MSW-1 Monitoring Results
Total Phosphorous and Conductivity average emission values have decreased for monitoring
conducted at MSW-1. Ph, BOD, Calcium, Sulphate and Total Nitrogen average emission
values increased slightly.
GYPSUM INDUSTRIES LIMITED
AER
JANUARY 2008-DECEMBER 2008
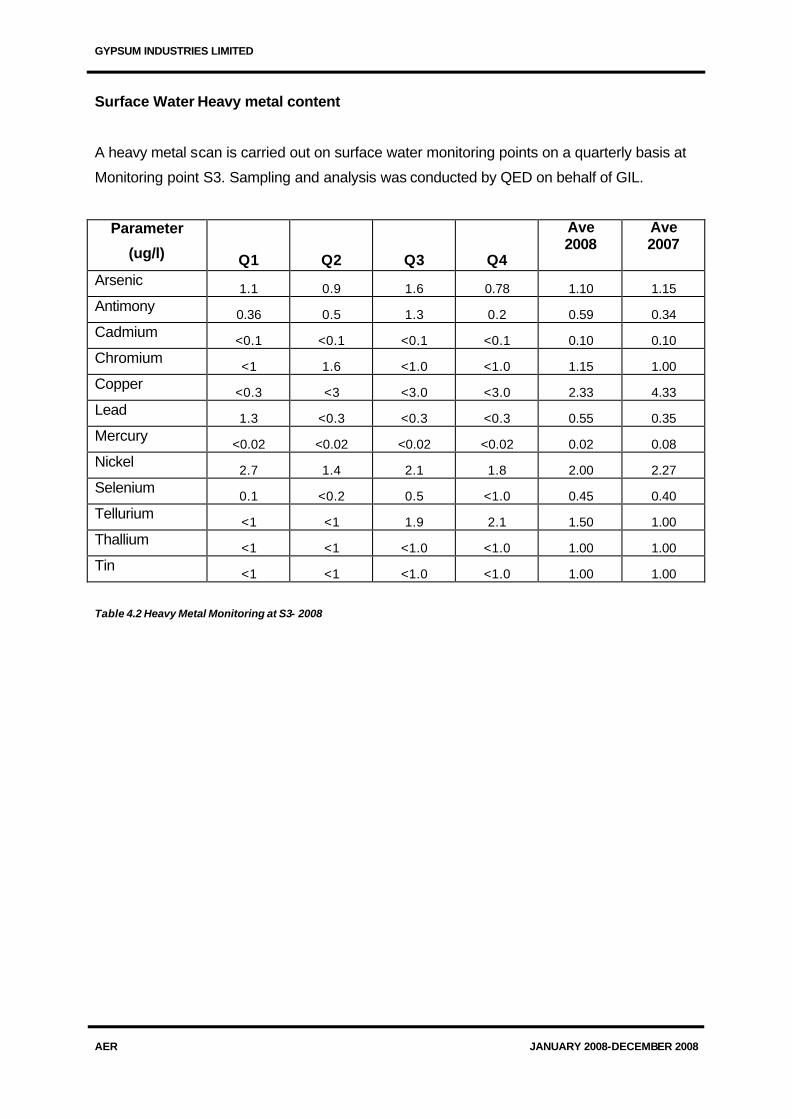
Surface Water Heavy metal content
A heavy metal scan is carried out on surface water monitoring points on a quarterly basis at
Monitoring point S3. Sampling and analysis was conducted by QED on behalf of GIL.
Parameter
(ug/l) Q1 Q2 Q3 Q4
Ave 2008
Ave 2007
Arsenic 1.1 0.9 1.6 0.78 1.10 1.15
Antimony 0.36 0.5 1.3 0.2 0.59 0.34
Cadmium <0.1 <0.1 <0.1 <0.1 0.10 0.10
Chromium <1 1.6 <1.0 <1.0 1.15 1.00
Copper <0.3 <3 <3.0 <3.0 2.33 4.33
Lead 1.3 <0.3 <0.3 <0.3 0.55 0.35
Mercury <0.02 <0.02 <0.02 <0.02 0.02 0.08
Nickel 2.7 1.4 2.1 1.8 2.00 2.27
Selenium 0.1 <0.2 0.5 <1.0 0.45 0.40
Tellurium <1 <1 1.9 2.1 1.50 1.00
Thallium <1 <1 <1.0 <1.0 1.00 1.00
Tin <1 <1 <1.0 <1.0 1.00 1.00
Table 4.2 Heavy Metal Monitoring at S3- 2008

GYPSUM INDUSTRIES LIMITED
AER
JANUARY 2008-DECEMBER 2008
5.0 AMBIENT SURFACE WATER MONITORING
GYPSUM INDUSTRIES LIMITED
AER
JANUARY 2008-DECEMBER 2008
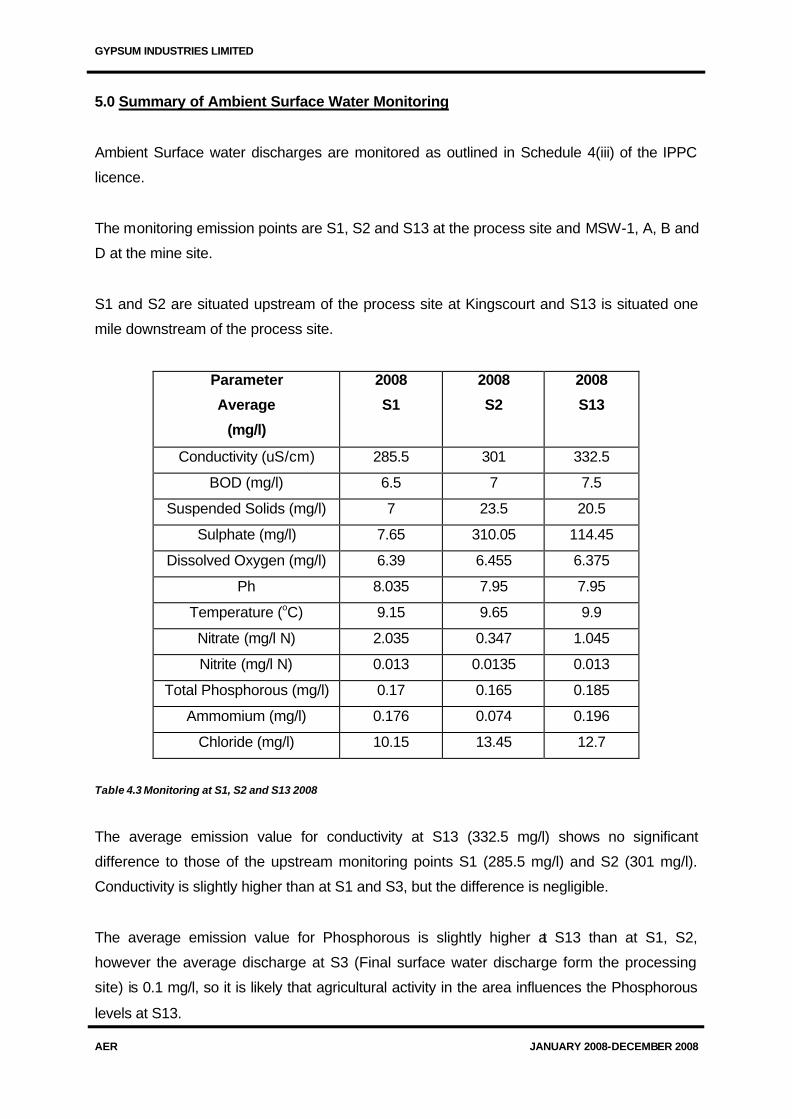
5.0 Summary of Ambient Surface Water Monitoring
Ambient Surface water discharges are monitored as outlined in Schedule 4(iii) of the IPPC
licence.
The monitoring emission points are S1, S2 and S13 at the process site and MSW-1, A, B and
D at the mine site.
S1 and S2 are situated upstream of the process site at Kingscourt and S13 is situated one
mile downstream of the process site.
Parameter
Average
(mg/l)
2008
S1
2008
S2
2008
S13
Conductivity (uS/cm) 285.5 301 332.5
BOD (mg/l) 6.5 7 7.5
Suspended Solids (mg/l) 7 23.5 20.5
Sulphate (mg/l) 7.65 310.05 114.45
Dissolved Oxygen (mg/l) 6.39 6.455 6.375
Ph 8.035 7.95 7.95
Temperature (oC) 9.15 9.65 9.9
Nitrate (mg/l N) 2.035 0.347 1.045
Nitrite (mg/l N) 0.013 0.0135 0.013
Total Phosphorous (mg/l) 0.17 0.165 0.185
Ammomium (mg/l) 0.176 0.074 0.196
Chloride (mg/l) 10.15 13.45 12.7
Table 4.3 Monitoring at S1, S2 and S13 2008
The average emission value for conductivity at S13 (332.5 mg/l) shows no significant
difference to those of the upstream monitoring points S1 (285.5 mg/l) and S2 (301 mg/l).
Conductivity is slightly higher than at S1 and S3, but the difference is negligible.
The average emission value for Phosphorous is slightly higher at S13 than at S1, S2,
however the average discharge at S3 (Final surface water discharge form the processing
site) is 0.1 mg/l, so it is likely that agricultural activity in the area influences the Phosphorous
levels at S13.

GYPSUM INDUSTRIES LIMITED
AER
JANUARY 2008-DECEMBER 2008
Ammonium and Chloride levels are relatively similar upstream and downstream of the
processing site.
Parameter
Average (mg/l)
2008
A
2008
B
2008
D
Conductivity (uS/cm) 297.27 324.18 356.91
BOD (mg/l) 2.50 2.50 2.50
Suspended Solids (mg/l) 3.45 4.36 6.18
Sulphate (mg/l) 24.81 21.41 81.55
Nitrate (mg/l N) 1.42 1.39 1.26
Total Phosphorous (mg/l) 0.16 0.19 0.15
Table 4.4 Monitoring at A, B and D 2008
Monitoring locations A and B are situated upstream of the mine site and D is situated 2
Kilometres downstream of the mine site.
Average conductivity, suspended solids and sulphate emission limit values are slightly
elevated downstream of the mine site.
BOD, Nitrate and Phosphate average emission values are lower than those recorded
upstream.

GYPSUM INDUSTRIES LIMITED
AER
JANUARY 2008-DECEMBER 2008
Ambient Surface Water Heavy metal content
A heavy metal scan is carried out on ambient surface water monitoring points on a bi-annual
basis. Samples from S1,S2 and S13 at the process site are collected bi-annually. Samples
form monitoring points A, B and D at the mine site are collected bi-annually. Sampling and
analysis was conducted by QED on behalf of GIL.
S1 S2 S13
Parameter
(ug/l) 2008 Average
2007 Average
2008 Average
2007 Average
2008 Average
2007 Average
Arsenic 0.72 0.75 0.36 0.45 0.49 0.65
Antimony 0.10 0.10 0.10 0.10 0.10 0.20
Cadmium 0.10 0.10 0.10 0.10 0.10 0.10
Chromium 1.00 1.00 1.00 1.00 1.00 1.00
Copper 3.00 5.70 3.30 5.90 3.00 6.15
Lead 0.38 0.30 0.30 0.35 0.57 0.35
Mercury 0.02 0.02 0.02 0.02 0.02 0.02
Nickel 0.90 1.55 0.93 1.90 1.79 2.85
Selenium 0.25 0.30 0.27 0.50 0.30 0.35
Tellurium 1.45 1.00 1.30 1.00 1.45 1.00
Thallium 1.00 1.00 1.00 1.00 1.00 1.00
Tin 1.00 1.00 1.00 1.00 1.00 1.00
Table 4.5 Monitoring at S1, S2 and S13 2007 V’s2008

GYPSUM INDUSTRIES LIMITED
AER
JANUARY 2008-DECEMBER 2008
A B D
Parameter
(ug/l) 2008 Average
2007 Average
2008 Average
2007 Average
2008 Average
2007 Average
Arsenic 1.15 0.95 1.05 0.90 0.90 1.00
Antimony 0.10 0.20 0.10 0.15 0.10 0.20
Cadmium 0.10 0.10 0.10 0.10 0.10 0.10
Chromium 1.00 1.00 1.00 1.00 1.00 1.00
Copper 3.10 7.15 3.00 5.65 3.00 5.95
Lead 0.45 0.30 0.30 0.30 0.30 0.30
Mercury 0.02 0.04 0.04 0.04 0.02 0.04
Nickel 1.35 2.00 1.90 3.35 2.05 2.90
Selenium 0.20 0.30 0.20 0.30 0.25 0.60
Tellurium 0.95 1.00 1.00 1.00 1.00 1.00
Thallium 0.55 1.00 0.55 1.00 0.55 1.00
Tin 1.00 1.00 1.00 1.00 1.00 1.00
Tabl e 4.6 Monitoring at A, B and D 2007 V’s 2008

GYPSUM INDUSTRIES LIMITED
AER
JANUARY 2008-DECEMBER 2008
Macro Invertebrate Bio-assessment
Process Site:
A macroinvertebrate bioassessment of the streams around the processing site, which are
part of the Lagan River catchment was conducted in August 2008.
The results of insitu physico-chemical determinations (dissolved oxygen and temperature)
indicated satisfactory water quality along the stretch of the river sampled.
The results of DO determinations ranged between 9.6 and 10.1 upstream and downstream of
the S3 discharge point. All measurements were within the accepted ranges set out by the
Freshwater Fish Directive (78/659/EEC) and the Salmonoid Waters Regulations.
Temperatures were typical for the time of year.
These favourable and consistent results upstream and downstream of the discharge point
indicate that there is no negative impact attributed to the GIL discharge.
Species identified were similar to those recorded during the biological assessment in 2006.
The standard of water quality at Site 1 has decreased since November 2006 from Q4 to Q3.
This indicates a slight decrease in the water quality upstream of Gypsum activities. The
standard of water quality at Site 2 has remained constant. The standard of water quality has
increased slightly at Site 3 going form Q3 in 2006 to Q3-4 in 2008.
The report in its entirety is attached in Appendix (ii). The report includes a description of the
sampling and monitoring locations.
GYPSUM INDUSTRIES LIMITED
AER
JANUARY 2008-DECEMBER 2008
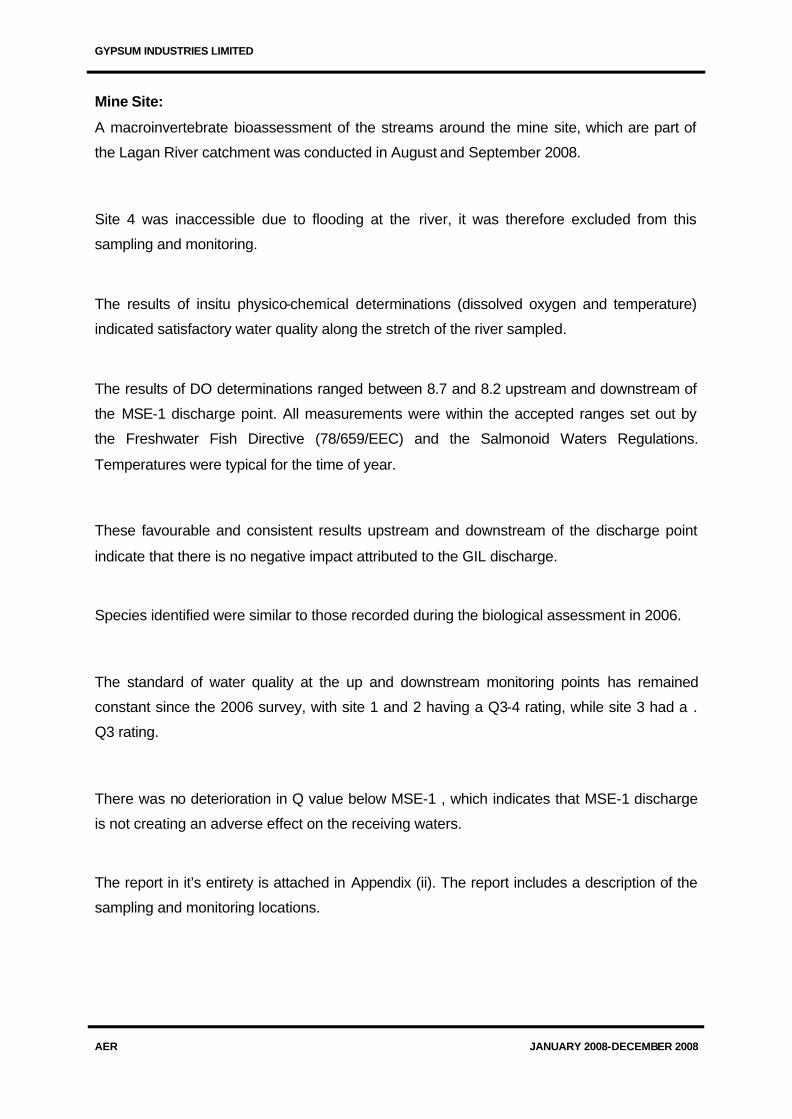
Mine Site:
A macroinvertebrate bioassessment of the streams around the mine site, which are part of
the Lagan River catchment was conducted in August and September 2008.
Site 4 was inaccessible due to flooding at the river, it was therefore excluded from this
sampling and monitoring.
The results of insitu physico-chemical determinations (dissolved oxygen and temperature)
indicated satisfactory water quality along the stretch of the river sampled.
The results of DO determinations ranged between 8.7 and 8.2 upstream and downstream of
the MSE-1 discharge point. All measurements were within the accepted ranges set out by
the Freshwater Fish Directive (78/659/EEC) and the Salmonoid Waters Regulations.
Temperatures were typical for the time of year.
These favourable and consistent results upstream and downstream of the discharge point
indicate that there is no negative impact attributed to the GIL discharge.
Species identified were similar to those recorded during the biological assessment in 2006.
The standard of water quality at the up and downstream monitoring points has remained
constant since the 2006 survey, with site 1 and 2 having a Q3-4 rating, while site 3 had a .
Q3 rating.
There was no deterioration in Q value below MSE-1 , which indicates that MSE-1 discharge
is not creating an adverse effect on the receiving waters.
The report in it’s entirety is attached in Appendix (ii). The report includes a description of the
sampling and monitoring locations.

6.0 SUMMARY OF BLAST, VIBRATION AND
AIR OVER PRESSURE MONITORING

GYPSUM INDUSTRIES LIMITED
AER
JANUARY 2008-DECEMBER 2008
6.0 Summary of Blast, Vibration and Air Over-Pressure monitoring:
Blast, vibration and air over pressure monitoring is conducted as per Condition 8 of the IPPC
licence.
Blast, vibration and air over pressure monitoring is conducted at monitoring locations MS-1,
MS-2 and MS-3 in addition to other noise sensitive locations as appropriate.
There were three exceedences reported under Condition 8 in 2008:
• January 17th a peak particle velocity reading of 7.9 mm/s was recorded at MS1.
• May 19th an air over pressure value of 129.0 dB was recorded at MS2
• October 22nd a peak particle velocity of 8.6 mm/s was recorded at L and 7.9 mm/s at V.
The quantity of explosives used in opencast quarry (Knocknacran) increased in 2008. There
was more mining of the underground facility in 2007 than in 2008.
ANFO (kg) Kemgel (kg) Total
2008 25,650 42,400 68,050
2007 21,900 16,925 38,825
Table 6.0 Quantity of explosives used in opencast quarry 2007 V’s 2008
However, there was a marked reduction in the overall quantity of explosives used in the
combined opencast and underground mining operation in 2008. See graph below.
Explosives Use 2007 v's 2008
0
50000
100000
150000
200000
250000
300000
350000
Opencast Quarry Underground Mine Total
Area
Kg
s 2007
2008
Figure 6.0 Quantity of explosives used at the mine site 2007 V’s 2008

GYPSUM INDUSTRIES LIMITED
AER
JANUARY 2008-DECEMBER 2008
Location: MS1 MS2 MS3
Parameter L
mm/s
T
mm/s
V
mm/s
AOP
dB
L
mm/s
T
mm/s
V
mm/s
AOP
dB
L
mm/s
T
mm/s
V
mm/s
AOP
dB
Highest: 8.6 6 7.9 125 3.4 3.8 1.8 129 Failed to Trigger on all occasions
Lowest: 0.4 0.4 0.4 107.0 0.4 0.4 0.1 106.0 Failed to Trigger on all occasions
Average 3.03 2.70 2.44 116.84 1.23 1.34 0.79 114.98 Failed to Trigger on all occasions
Range 0.4 - 8.6 0.4 - 6 0.4 -7.9 107 - 125 0.4 3.4 0.4 - 3.8 0.1 - 1.8 106 - 129 Failed to Trigger on all occasions
Table 6.1 Summary of vibration analysis at the mine site 2008
The above table summarises the blast history at MS-1, MS-2 and MS-3 in 2008.

7.0 WASTE MANAGEMENT REPORT
GYPSUM INDUSTRIES LIMITED
AER
JANUARY 2008-DECEMBER 2008
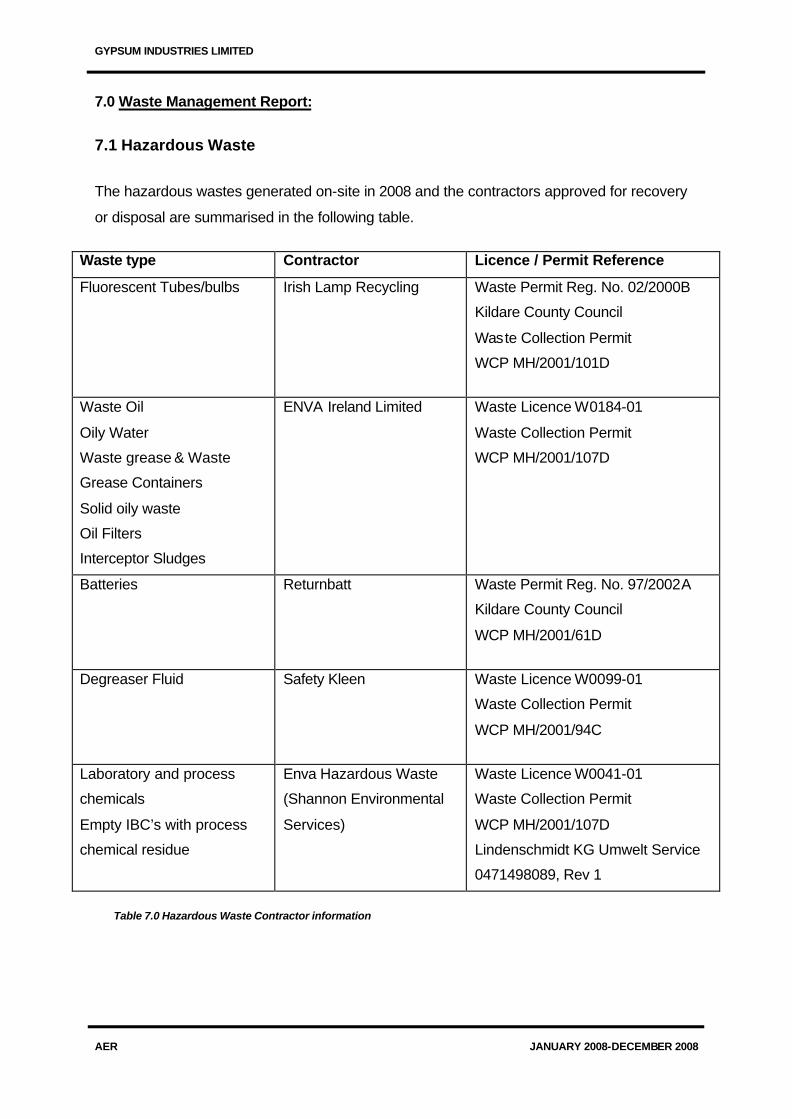
7.0 Waste Management Report:
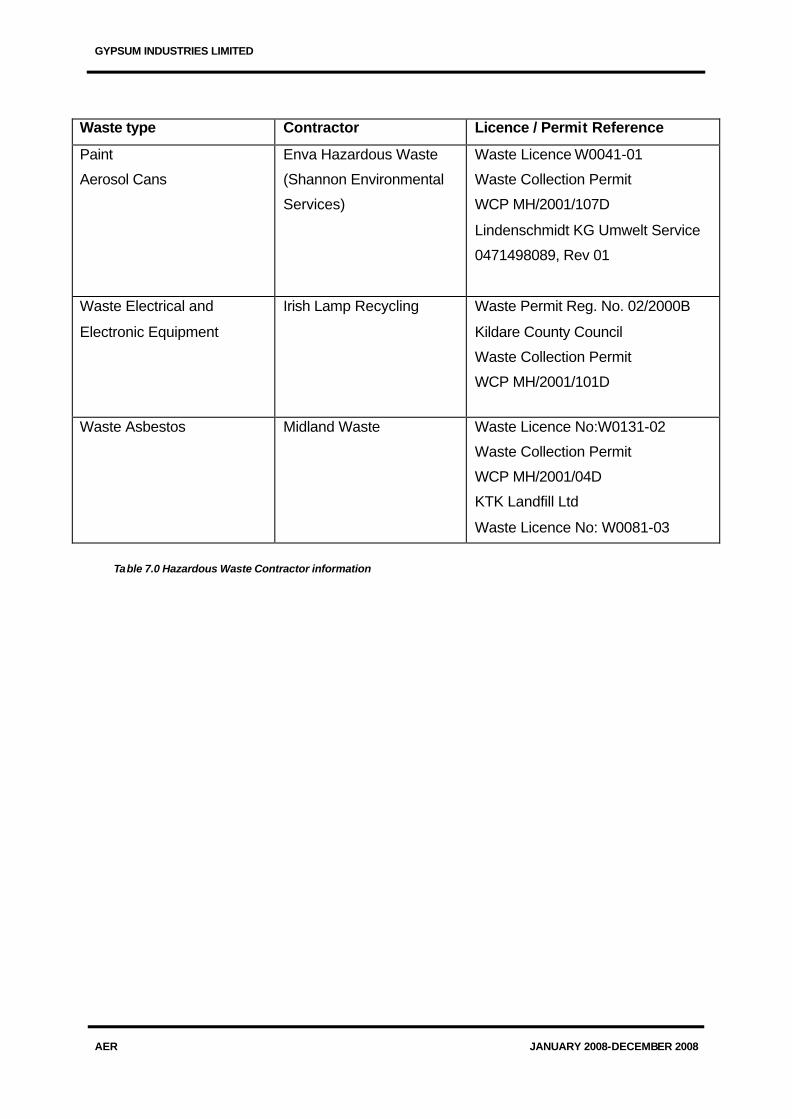
7.1 Hazardous Waste
The hazardous wastes generated on-site in 2008 and the contractors approved for recovery
or disposal are summarised in the following table.
Waste type Contractor Licence / Permit Reference
Fluorescent Tubes/bulbs Irish Lamp Recycling
Waste Permit Reg. No. 02/2000B
Kildare County Council
Waste Collection Permit
WCP MH/2001/101D
Waste Oil
Oily Water
Waste grease & Waste
Grease Containers
Solid oily waste
Oil Filters
Interceptor Sludges
ENVA Ireland Limited
Waste Licence W0184-01
Waste Collection Permit
WCP MH/2001/107D
Batteries Returnbatt Waste Permit Reg. No. 97/2002A
Kildare County Council
WCP MH/2001/61D
Degreaser Fluid Safety Kleen Waste Licence W0099-01
Waste Collection Permit
WCP MH/2001/94C
Laboratory and process
chemicals
Empty IBC’s with process
chemical residue
Enva Hazardous Waste
(Shannon Environmental
Services)
Waste Licence W0041-01
Waste Collection Permit
WCP MH/2001/107D
Lindenschmidt KG Umwelt Service
0471498089, Rev 1
Table 7.0 Hazardous Waste Contractor information
GYPSUM INDUSTRIES LIMITED
AER
JANUARY 2008-DECEMBER 2008
Waste type Contractor Licence / Permit Reference
Paint
Aerosol Cans
Enva Hazardous Waste
(Shannon Environmental
Services)
Waste Licence W0041-01
Waste Collection Permit
WCP MH/2001/107D
Lindenschmidt KG Umwelt Service
0471498089, Rev 01
Waste Electrical and
Electronic Equipment
Irish Lamp Recycling
Waste Permit Reg. No. 02/2000B
Kildare County Council
Waste Collection Permit
WCP MH/2001/101D
Waste Asbestos Midland Waste Waste Licence No:W0131-02
Waste Collection Permit
WCP MH/2001/04D
KTK Landfill Ltd
Waste Licence No: W0081-03
Table 7.0 Hazardous Waste Contractor information

GYPSUM INDUSTRIES LIMITED
AER
JANUARY 2008-DECEMBER 2008
7.2 Non-hazardous waste
The non-hazardous wastes generated on-site in 2008 and the contractors approved for
recovery or disposal are summarised in the following table.
Waste Type Contractor Licence /
Permit Reference
Dewatered Sludge Owen Duffy
Waste Collection Permit
WCP MH/2001/29C
Carrickmacross Waste Water
Discharge Authorisation:
D0062-01
General Site waste
Oxigen
Midland Waste Ltd
Waste Licence No: W0152-03
Waste Collection Permit:
WCP MH/2001/046E
Waste Licence No:W0131-02
Waste Collection Permit
WCP MH/2001/04D
Metal Charlie Byrne Waste Collection Permit:
WCP MH/2005/95C
Cardboard C.W.S
Midland Waste Ltd
Waste Collection Permit
WCP MH/2005/18B
Waste Licence No:W0131-02
Waste Collection Permit
WCP MH/2001/04D
Plastic Shabra Waste Collection Permit
WCP MH/2001/068D
Cooking oil Mitchell Taylor Oils
Waste Permit No 98045
Waste Collection Permit
WCP / MH/2004/08D
Timber Pallets Owen Duffy
Midland Waste
Waste Collection Permit
WCP MH/2001/29C
Waste Licence No:W0131-02
Waste Collection Permit
WCP MH/2001/04D
Table 7.1 Non Hazardous Waste Contractor information

GYPSUM INDUSTRIES LIMITED
AER
JANUARY 2008-DECEMBER 2008
7.3 Waste management indices
Gross WaMI = [Waste Produced (t)/ Raw Material Usage (t) ] x 100
Nett of Process WaMI = [Waste Produced (t) – Amount Recovered on Site (t) ] x 100
Raw Material (t)
Nett of Site WaMI =
[ Waste Produced (t) – Amount Recovered on Site (t) – Amount Recovered off Site
(t)] x100
Raw Material Usage (t)
Raw Material (Nett): 324165 tonnes
Waste Produced on Site: 31592 tonnes
Amount Recovered On-Site: 17804 tonnes
Amount Recovered Off-Site: 544 tonnes
Index 2008
Gross WaMI 9.74
Nett of Process WaMI 4.25
Nett of Site WaMI 4.08
Table 7.3 Summary of Waste Management Indices 2008
Waste Breakdown 2008
0.00
5000.00
10000.00
15000.00
20000.00
25000.00
30000.00
35000.00
Wasteproduced on
Site
WasteDisposed off
on site
WasteRecovered
on site
WasteRecovered
off site (NonHaz)
WasteRecovered
off site(Haz)
WasteDisposed off
Site (NonHaz)
WasteDisposed off
Site (Haz)
Figure 7.0 Waste Breakdown 2008

GYPSUM INDUSTRIES LIMITED
AER
JANUARY 2008-DECEMBER 2008
7.4 Landfill Status Report:
Gypsum Industries Limited operates a landfill site within the boundaries of the processing
site at Kingscourt, Co. Cavan. Waste plasterboard incorporating Gypsum and paper are
landfilled at the landfill site.
The landfill comprises of a 15.5 Acre site, which is situated to the East of the process site.
The landfill is un-lined. Leachate from the landfill is collected in drains and channelled to
settling lagoons, situated north of the landfill site.
Responsibility for the operational management of the landfill lies with Jim Tierney. Jim is a
civil engineer. He has also completed the Fás Waste Management course.
There was 12,185 Tonnes of material landfilled on site in 2008. This is a marked increase on
the 2007 figures, 4,131 Tonnes. The marked increase is accounted for because there was a
thorough clean up of the on site Gypsum recycling area completed in 2008. Stockpiles of
Gypsum material had accumulated in the recycling area. Environmental weathering had
made the material impossible to process.
Landfill gas monitoring:
Monitoring of landfill gas was conducted in December 2008. The following parameters were
monitored at three locations on site; Oxygen, Carbon Dioxide, Methane, Carbon Monoxide,
Hydrogen Sulphide and Atmospheric Pressure.
The monitoring concluded that the area around BH2 is the most active. Hydrogen Sulphide
was detected in BH2 and BH1 indicating that biological degradation of dissolved Sulphate in
the Gypsum board to Hydrogen Sulphide is not yet complete within these locations of the
landfill. No Carbon dioxide, Methane, Carbon monoxide or Hydrogen Sulphide was detected
in BH2 OD4 (Situated beyond the landfill) indicating that migration of landfill gases does not
occur in the direction of this landfill well.
Monitoring of BH3 within the landfill could not be completed during 2008. This monitoring
station has unfortunately been lost. Plans are underway to re-drill and install a new gas
monitoring well in the same location during 2009. This will be included in subsequent
monitoring.

GYPSUM INDUSTRIES LIMITED
AER
JANUARY 2008-DECEMBER 2008
Figure 7.1 Landfill Gas borehole location

GYPSUM INDUSTRIES LIMITED
AER
JANUARY 2008-DECEMBER 2008
7.5 Surface Water Monitoring at the landfill:
There are two surface water monitoring points situated either side of the landfill. S5 is
situated prior to the landfill and S9 is situated at the landfill exit.
S5 S9
Parameter
(mg/l) 2008 2008
Sulphates (mg/l) 153 155 No significant change
Sulphides (mg/l) <0.01 <0.01 No significant change
BOD (mg/l) <2 <2 No significant change
COD (mg/l) 16 17 No significant change
Conductivity (uS/cm) 570 627 Slight Increase
Suspended Solids (mg/l) <10 <10 No significant change
Settleable Solids (ml/l) <1 <1 No significant change
Total Ammonia (mg/l) <0.2 <0.2 No significant change
Total Phosphorous (mg/l) <0.05 0.09 Slight Increase
Chloride (mg/l) 32 31 No significant change
Manganese (mg/l) 0.09 0.40 Slight Increase
Copper(ug/l) 4 2 No significant change
Iron(ug/l) 58 40 Decrease
Calcium (mg/l) 85.47 89.24 No significant change
Aluminium (ug/l) 6 10 No significant change
Table 7.4 Summary of Surface water monitoring at the landfill2008
The above results show limited change in the quality of surface water passing through the
landfill. While Phosphorous, Manganese and conductivity have increased slightly, both are
within the limits outlined within the Surface water quality standards.
GYPSUM INDUSTRIES LIMITED
AER
JANUARY 2008-DECEMBER 2008
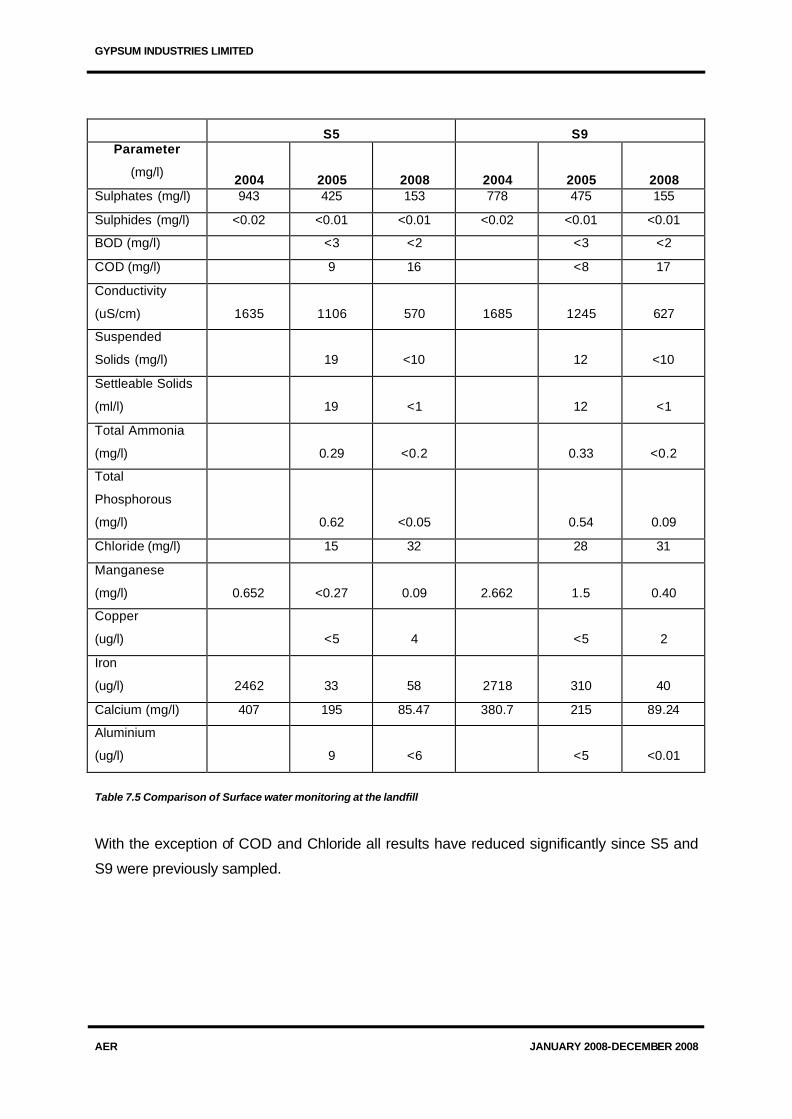
S5 S9
Parameter
(mg/l) 2004 2005 2008 2004 2005 2008
Sulphates (mg/l) 943 425 153 778 475 155
Sulphides (mg/l) <0.02 <0.01 <0.01 <0.02 <0.01 <0.01
BOD (mg/l) <3 <2 <3 <2
COD (mg/l) 9 16 <8 17
Conductivity
(uS/cm) 1635 1106 570 1685 1245 627
Suspended
Solids (mg/l) 19 <10 12 <10
Settleable Solids
(ml/l) 19 <1 12 <1
Total Ammonia
(mg/l) 0.29 <0.2 0.33 <0.2
Total
Phosphorous
(mg/l) 0.62 <0.05 0.54 0.09
Chloride (mg/l) 15 32 28 31
Manganese
(mg/l) 0.652 <0.27 0.09 2.662 1.5 0.40
Copper
(ug/l) <5 4 <5 2
Iron
(ug/l) 2462 33 58 2718 310 40
Calcium (mg/l) 407 195 85.47 380.7 215 89.24
Aluminium
(ug/l) 9 <6 <5 <0.01
Table 7.5 Comparison of Surface water monitoring at the landfill
With the exception of COD and Chloride all results have reduced significantly since S5 and
S9 were previously sampled.

GYPSUM INDUSTRIES LIMITED
AER
JANUARY 2008-DECEMBER 2008
7.6 Closure, Restoration and Aftercare Management Plan:
Landfilling of Gypsum material to our on site landfill will cease in July 2009. A number of
trials have been conducted on site in 2008 to allow us to fractionate our waste material
currently going to our on site landfill. We are close to equipment selection stage, and new
equipment will be installed prior to the July closure. The resultant product will be re-used on
site.
We have commissioned the services of RPS to prepare a Closure, Restoration and Aftercare
Management Plan for the landfill during 2009. Work on the CRAMP will commence in
February 2009 and the proposal will be forwarded to the agency on completion.
The landfill closure plan will include:
• General introduction
• Site evaluation
• Closure considerations
• Criteria for successful closure
• Closure plan costings
• Closure plan update and review
• Closure plan implementation details
• Restoration and Remediation proposals
• Aftercare management details and
• Site restoration and aftercare costs.
We expect to have a CRAMP proposal for the landfill available in June 2009.

GYPSUM INDUSTRIES LIMITED
AER
JANUARY 2008-DECEMBER 2008

8.0 RESOURCE CONSUMPTION SUMMARY

GYPSUM INDUSTRIES LIMITED
AER
JANUARY 2008-DECEMBER 2008
8.0 Resource Consumption Summary:
8.1 Water Consumption
Process water is supplied primarily from the nearby Milltown River.
The volume of river water consumption over the last two years is summarised below:
Year
Water Usage
M3/Year
Surface Water Re-use
M3/Year
2007 178,252 76,342
2008 126,667 48,711
Table 8.0 River water consumption 2007-2008:
There has been a marked decrease in water consumption, primarily due to the downturn in
market conditions. Efforts continue to re-use surface water on site where possible. Over
48,000 M3 of surface water were re-used in 2008.
A small proportion of water is also supplied from the Ballynaclose group water scheme. This
is used for domestic purposes only. This is estimated in the region of 15 m3/day.

GYPSUM INDUSTRIES LIMITED
AER
JANUARY 2008-DECEMBER 2008
8.2 Energy Consumption
There are four sources of energy used at GIL; Natural Gas, Diesel Oil and Electricity. Small
quantities of propane are used for catering. The following graph and table illustrates utilities
usage at the process site for the past two years.
Process Site Energy Usage in KWH/T
0
100
200
300
400
500
600
700
Electricity Natural Gas Diesel Oil Total
2007
2008
Figure 8.0 Process site energy usage KWH/T
Electricity
(KWH/T)
Gas
(KWH/T)
Diesel Oil
(KWH/T)
Total
(KWH/T)
2007 57.34 511.55 1.94 570.84
2008 58.47 527.44 0.87 586.79
Table 8.1 Process Site Energy Consumption2007-2008:
There were **35,058 Tonnes of CO2 produced from the production process at GIL in 2008,
this is reduced significantly from 2007 when 50,002 Tonnes of CO2 were produced. The
reduction is accounted for as a result in a downturn in market conditions.
(**This figure includes CO2 produced from Natural gas, Diesel and LPG)

GYPSUM INDUSTRIES LIMITED
AER
JANUARY 2008-DECEMBER 2008
Mine Site:
There are two sources of energy used at GIL Mine site; Diesel Oil and Electricity. The
following graph and table illustrates utilities usage at the process site for the past two years.
Mine Site Energy Usage in KWH/T
0
2
4
6
8
10
12
14
16
Oil KWH/T Electricity KWH/T Total KWH/T
2007
2008
Figure 8.1 Mine site energy usage KWH/T
Electricity
(KWH/T)
Diesel Oil
(KWH/T)
Total
(KWH/T)
2007 4.21 8.92 13.12
2008 5.46 7.92 13.38
Table 8.2 Mine Site Energy Consumption2007-2008:

GYPSUM INDUSTRIES LIMITED
AER
JANUARY 2008-DECEMBER 2008

9.0 COMPLAINTS AND INCIDENT SUMMARY

GYPSUM INDUSTRIES LIMITED
AER
JANUARY 2008-DECEMBER 2008
9.0 Complaints and Incident Summary:
9.1 Complaints Summary
There were two complaints received in 2008. Both were related to dirt on the road at the
mine site
Complaint No 1
Date of Complaint: 21/02/2008
Received from: Gerry Jones
Nature of complaint: Miscellaneous; Dust on road at the mine site.
Details: A complaint was received from a neighbour at the mine site on 21st
February 2008. Based on the nature of the complaint the problem
was identified as being related to the transport activities from the
mine site.
Controls in place: Truck was facilities continue to operate on all vehicles exiting the
mine site
All rock haulage trailers are covered prior to exiting the mine site
Dust monitoring procedures in place.
Dust monitoring results for February 2008 indicated dust levels of 170
mg/m2/day at the closest monitoring station.
Corrective Actions: Road sweeper employed to clear road exiting the mine site and along
roadway.
Table 9.0 Complaint No 1

GYPSUM INDUSTRIES LIMITED
AER
JANUARY 2008-DECEMBER 2008
Complaint No 2
Date of Complaint: 25/03/2008
Received from: Thomas McConnon
Nature of complaint: Miscellaneous; Dust on road at the mine site.
Details: A complaint was received from a neighbour at the mine site on 25th
March 2008. Based on the nature of the complaint the problem was
identified as being related to the transport activities from the mine
site.
During this time period, GIL was mining from the upper seam of the
quarry. The upper seam is red in colour. The dumping trucks carry
this material to the loading sheds. Cement lorries then collect this
material form the loading sheds and move to the weighbridge and
wheelwash, before exiting the mine site.
The upper crust material is more difficult to wash off that standard
clay.
Controls in place: As above. Dust monitoring results for March 2008 indicated dust
levels of 136 mg/m2/day at the closest monitoring station MS4a.
Corrective Actions: Review ground conditions during mining of upper crust; assess the
need to arrange road sweeper services during mining of upper crust.
Road sweeper employed to clear road exiting the mine site and along
roadway three times a week during this period. This has since been
reduced to twice weekly. We are currently developing our own
equipment to complete this task.
Other improvements have since been made to the wheel wash facility
at the mine site.
Table 9.1 Complaint No2
GYPSUM INDUSTRIES LIMITED
AER
JANUARY 2008-DECEMBER 2008
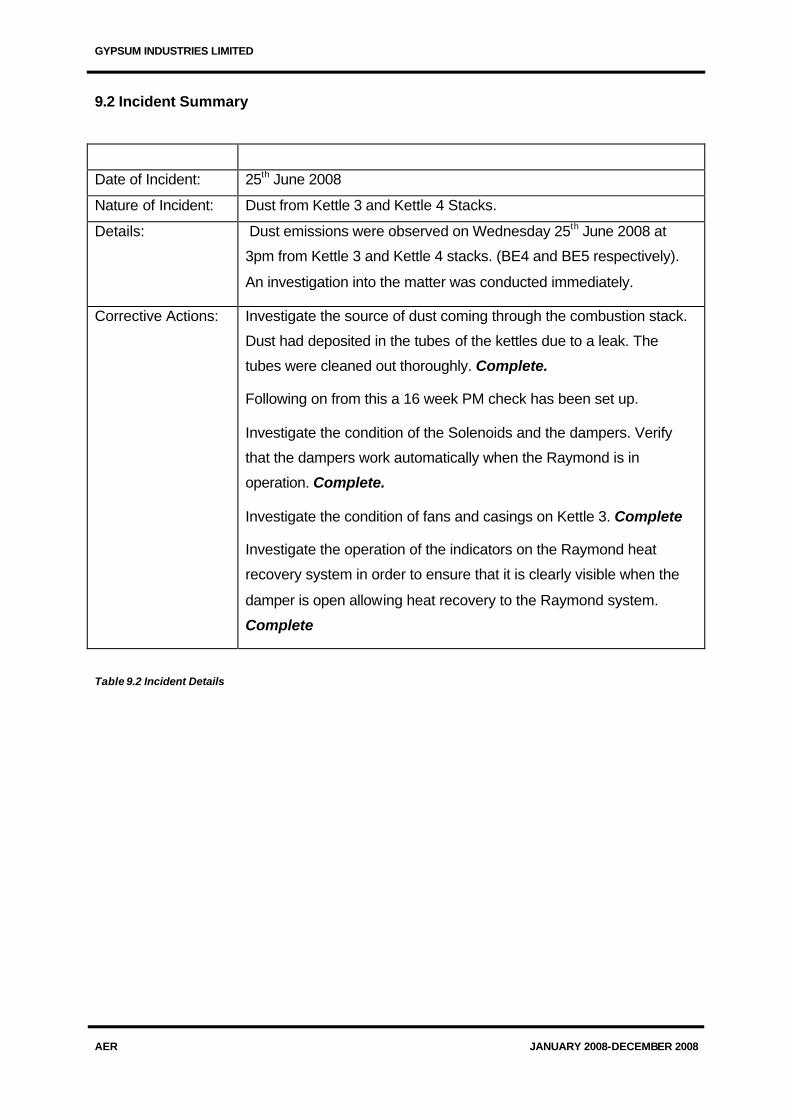
9.2 Incident Summary
Date of Incident: 25th June 2008
Nature of Incident: Dust from Kettle 3 and Kettle 4 Stacks.
Details: Dust emissions were observed on Wednesday 25th June 2008 at
3pm from Kettle 3 and Kettle 4 stacks. (BE4 and BE5 respectively).
An investigation into the matter was conducted immediately.
Corrective Actions: Investigate the source of dust coming through the combustion stack.
Dust had deposited in the tubes of the kettles due to a leak. The
tubes were cleaned out thoroughly. Complete.
Following on from this a 16 week PM check has been set up.
Investigate the condition of the Solenoids and the dampers. Verify
that the dampers work automatically when the Raymond is in
operation. Complete.
Investigate the condition of fans and casings on Kettle 3. Complete
Investigate the operation of the indicators on the Raymond heat
recovery system in order to ensure that it is clearly visible when the
damper is open allowing heat recovery to the Raymond system.
Complete
Table 9.2 Incident Details

GYPSUM INDUSTRIES LIMITED
AER
JANUARY 2008-DECEMBER 2008

10.0 OBJECTIVES AND TARGETS

GYPSUM INDUSTRIES LIMITED
AER
JANUARY 2008-DECEMBER 2008
10.0 Schedule of Environmental Objectives and Targets:
Objectives
Targets
1.1 Install and commission wheel wash at the process site by Mar 09
1.2 Review Agrigyp and Recycling Material handling and Storage
arrangements. Identify method of reducing fugitive emissions. Dec 09
1.3 Concrete the yard at the garage area. Implement routine drain cleaning
procedures. Develop traffic management programme. June 09
1.0 Reduce Process
/ Fugitive emissions
from the activity.
1.4 Implement effective PM’s on dust abatement equipment in the plaster mill.
Sept 09.
2.1 Carry out a review of Sulphate levels at three locations on the process site
over a 6 month period. Measure Sulphate levels at 3 locations on the process
site. June 09
2.2 Complete a study of water patterns on the site; quantify rainwater and
ingress of water from natural springs etc. in order to understand lagoon
capacities.
2.3 Implement effective lagoon cleaning procedures at the mine site Mar 09
2.0 Reduce the
impact of effluent
and surface water
discharges on the
river Bursk/Lagan
2.4 Install suitable treatment system at the mine site lagoons to reduce solids
at MSE-1. June 09.
3.1 Document a procedure for blasting at the mine site. Mar 09 3.0 Reduce
overpressure and
vibrations levels
experienced off site
3.2 Complete a noise assessment of the process and mine site, identify
opportunities for noise reduction projects. June 09.
4.1 Maximise efficiencies on Board Plant Drier
• Recirculation fans on Board Plant Drier
• Complete air pressure and deck balance check on drier.
4.2 Standardise water gauge.
4.3 Improve grinding and calcining efficiency:
• Reduce excess air on K6 from 140-120.
• Investigate the feasibility of using K6 exhaust gases to heat R5.
4.0 Reduce energy
consumption on site
4.4 Complete a pre-feasibility study examining the potential for CHP at the
process site. June 09
Table 10.0 Schedule of Objectives and Targets

GYPSUM INDUSTRIES LIMITED
AER
JANUARY 2008-DECEMBER 2008
Objectives
Targets
5.1 Complete a CRAMP for the landfill at the process site. May 2009
5.2 Devise a system for diverting paper from the landfill. Mar 09
5.3 Cover two bunded storage areas at the mine site. Dec 09
5.0 Waste
Management and
Prevention
5.4 Re-use timber pallets within the plaster mill and board plant. Dec 09
6.1 Commission new bunded storage area at the mine site. Mar 09
Decommission old bunded storage area. Dec 09
6.2 Develop a programme to correct the findings of the bund integrity report.
Commence work on Phase 1 of the programme. Dec 09
6.3 Develop a programme of action to correct the findings highlighted in the
underground pipeline assessment.
6.0 Minimise Risk
posed to ground
water
6.4 Implement the recommendations of the groundwater study completer by
Minerex with regard to the setting of trigger levels for ground water quality
parameters. June 09.
7.1 Implement effective incident investigation, corrective and preventive action
system. June 09
7.2 Improve signage on all IPPC monitoring points. Update all environmental
drawings for the mine and process site associated with the monitoring
schedules in the IPPC licence. Mar 09
7.3 Implement effective change control procedures
7.0 Improve the
effectiveness of the
ISO 14,001
environmental
management
system.
7.4 Implement packaging module on SAP for accurately determining REPAK
stats. June 09
Table 10.0 Schedule of Objectives and Targets

11.0 ENVIRONMENTAL MANAGEMENT
PROGRAMME

GYPSUM INDUSTRIES LIMITED
AER
JANUARY 2008-DECEMBER 2008
11.0 Environmental Management Programme
Project No: Target
1.0 Reduce Process / Fugitive emissions from the activity.
2.0 Reduce the impact of effluent and surface water discharges on the river
Bursk/Lagan
3.0 Reduce overpressure and vibrations levels experienced off site
4.0 Reduce energy consumption on site
5.0 Waste Management and Prevention
6.0 Minimise Risk posed to ground water
7.0 Improve the effectiveness of the ISO 14,001 environmental management
system.
Table 11.0 Environmental Management Programme.

GYPSUM INDUSTRIES LIMITED
AER
JANUARY 2008-DECEMBER 2008

Rev 02 02.02.2008
Environmental Management Programme 2008- Progress Report
Air Emissions Objectives Targets Status Time Frame
Carry out air emissions surveys as per the IPC licence and monitor
Where exceedances exist, establish a program for a reduction in emissions
Ensure compliance with ELVs for all emission points as defined in the IPC licence
On-going.. Compliance record improved. 72
exceedences in 2007, 62 in 2008. Programme in
place in EMP.
On-going
Diversion of emissions from RM5 & K6 back through the original stacks
Complete submission to EPA as required. Response regarding EPA questions and
requirements
Implement changes as required by Technical Amendment
Tech Amendment June 08
Work complete
Air monitoring results forwarded to epa
Complete
October 2008
Implement improved Truck Wash facilities at Processing Site
Complete Truck wash facilities as part of refurbishment process.
Near Completion
Mar 2009
Water Emissions Objectives Targets Status Time Frame
Improve Bunding control procedures. Complete programme to test all Bunds
Install new Barrell store at mine Move Diesel pump inside bund at mine
Fixed and portable bunds tested
Near complete Complete
May 2008
Mar 2009 June 2008
Monitoring of Emissions to water Daily / Weekly / Quarterly Monitoring ( Some on site monitoring now pH, conductivity and
Dissolved Oxygen)
Complete. and changed to Euro
Environmental
Complete
Reduction of Sulphate in mine water
Submit Report Implement recommendations of report
Report Submitted but proposal not accepted.
Review required.
Dec 09
Wastewater Treatment System 6.7
Complete Construction. Commissioning complete
Complete Mar 09
Rev 02 02.02.2008
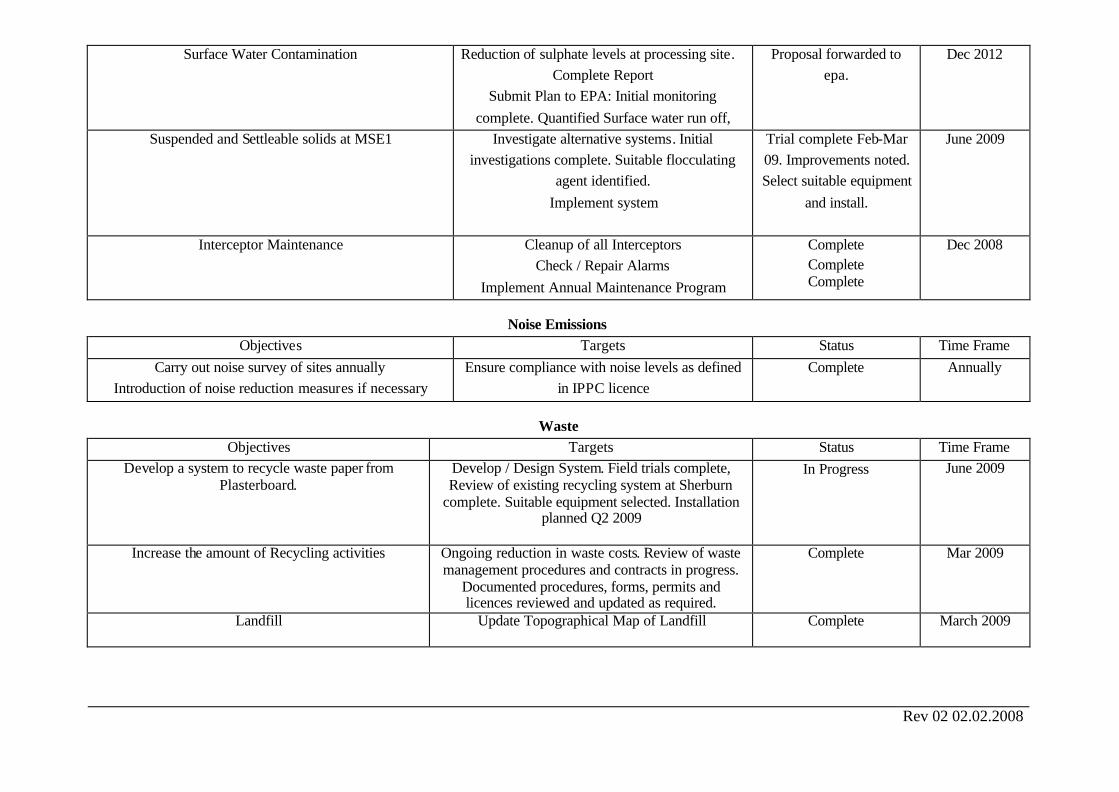
Surface Water Contamination Reduction of sulphate levels at processing site. Complete Report
Submit Plan to EPA: Initial monitoring complete. Quantified Surface water run off,
Proposal forwarded to epa.
Dec 2012
Suspended and Settleable solids at MSE1 Investigate alternative systems. Initial investigations complete. Suitable flocculating
agent identified. Implement system
Trial complete Feb-Mar 09. Improvements noted. Select suitable equipment
and install.
June 2009
Interceptor Maintenance Cleanup of all Interceptors Check / Repair Alarms
Implement Annual Maintenance Program
Complete Complete Complete
Dec 2008
Noise Emissions Objectives Targets Status Time Frame
Carry out noise survey of sites annually Introduction of noise reduction measures if necessary
Ensure compliance with noise levels as defined in IPPC licence
Complete Annually
Waste Objectives Targets Status Time Frame
Develop a system to recycle waste paper from Plasterboard.
Develop / Design System. Field trials complete, Review of existing recycling system at Sherburn
complete. Suitable equipment selected. Installation planned Q2 2009
In Progress
June 2009
Increase the amount of Recycling activities Ongoing reduction in waste costs. Review of waste management procedures and contracts in progress.
Documented procedures, forms, permits and licences reviewed and updated as required.
Complete Mar 2009
Landfill Update Topographical Map of Landfill Complete March 2009

Rev 02 02.02.2008
Energy/Material Usage Objectives Targets Status Time Frame
Energy Audit Re-routing RM5 and K6 through own stacks Complete October 2008 Energy Losses Energy savings project on Kettles 3, 4 & 5.
Reduce energy usage by 5%. Dampers on K4 and 5 have been adjusted after the recirculation fan in order to decrease the pressure drop on the bottom of the kettles. Plan to measure and adjust excess air ratio to bottom burners to reduce excess air
and improve efficiency.
On-going Dec 2008
General
Objectives Targets Status Time Frame Update site location maps Complete review and update of all site location
maps. Follow Up: Review and bring all environmental drawings within the scope of the documentation
system
Carried over to Objectives and Targets
2009
Mar 2009
Multi Agency Committee Letter of invitation to Participants Prepare presentation
1st Meeting
Complete
Mar 2008
Model Review Committee Letter of invitation sent to Mon Co. Co. 1st Meeting
Not Started. Awaiting completion of AER for Jan –Dec 08 in order to
present current information.
Aug 2009

12.0 POLLUTION EMISSION REGISTER
GYPSUM INDUSTRIES LIMITED
AER
JANUARY 2008-DECEMBER 2008
12.0 Pollution Emission Register: The following Pollutant materials were identified from the listed PRTR pollutants.
• Nitrous Oxides
• Carbon Dioxide
• Carbon Monoxide
Details of these emissions are given in section 2 and in the summary tables provided in
Appendix (vii)
During 2008 26096 kgs of NOX were released from the process site. This was a decrease on the 2007 figures of 29187 Kgs of NOX.
During 2008 35,058 Tonnes of CO2 were emitted from the process site. This is a decrease
on the 2007 figures of 50,002 Tonnes of CO2. These figures were taken from verified
AIER’s.
During 2008 4146 kgs of CO were emitted from the process site. This is a decrease on the
2007 figures of 26, 077 Kgs of CO.

GYPSUM INDUSTRIES LIMITED
AER
JANUARY 2008-DECEMBER 2008
13.0 NOISE MONITORING REPORT

GYPSUM INDUSTRIES LIMITED
AER
JANUARY 2008-DECEMBER 2008
13.0 Noise Monitoring Report:
The Annual Noise Survey Report was carried out in June 2008.
The daytime measurements were conducted during the late morning or early afternoon on
the 17th June while the night-time measurements were conducted the previous night 16th
June between 22.00 and 00.11 on the 17th June..
13.1 Site and Noise Source Description
The Gypsum Industries Limited site operates on a continuous basis. The majority of noise
sources from the site therefore are continuous and broadband. There are some intermittent
and impulsive noise sources from fans turning on / off automatically and from product
impacts through conveying pipes.
The Irish Gypsum Mine and Quarry site operate a day and evening shift cycle. The majority
of noise sources from the site therefore are continuous and broadband during these periods.
There are some intermittent and impulsive noise sources from pumps turning on / off
automatically and from product impacts through conveying lines.
13.2 Exclusion of Extraneous Noise Sources
Both sites are served by haulage trucks and other traffic, used to transport raw material and
other supplies to; and also transport finished product from the site. There is a roadway
adjacent to both sites that are utilised by visiting and local traffic. All efforts were made to
eliminate these noise sources when conducting noise measurements.
However, all monitoring points adjacent to the roadway N1, N2 and N5 at the process site
and MS1 and MS2 at the process site were affected by traffic passing on the roadways.

GYPSUM INDUSTRIES LIMITED
AER
JANUARY 2008-DECEMBER 2008
13.3 Methodology Used
Noise monitoring was carried out by Patricia Murtagh, BSc, MSc, Diploma in Acoustics and
Noise Control of Q.E.D Engineering Limited, following the EPA “Environmental Noise Survey
Guidance Document”.
Noise monitoring was carried out using the following noise meters;
• Noise levels were measured using a Castle GA123 Integrated Data logging Octave Band
Sound Level Meter, Serial No. 036015 and microphone Serial No. 27101. This meter was
last calibrated on 29/04/08. A GA607 Dual Level Calibrator, Serial No. 036023 was used
to calibrate the sound level meter and this was last calibrated on 20/02/08.
• Rion NA-27 Real Time 1/1, 1/3 Octave Band Logging SLM, Serial No. 00380685. This
meter was last calibrated on 14/05/08. A GA607 Dual Level Calibrator, Serial No. 036341
was used to calibrate the sound level meter and this was last calibrated on 12/05/08.

GYPSUM INDUSTRIES LIMITED
AER
JANUARY 2008-DECEMBER 2008
13.4 Results
Mine Site
Boundary Noise Measurements at Mining Operation
Table 13.0 Boundary Noise Results Mine Site

GYPSUM INDUSTRIES LIMITED
AER
JANUARY 2008-DECEMBER 2008
One Third Octave Boundary Noise Measurements at Mining Operation
Table 13.1 One Third Octave Boundary Noise Measurements Mine Site
GYPSUM INDUSTRIES LIMITED
AER
JANUARY 2008-DECEMBER 2008
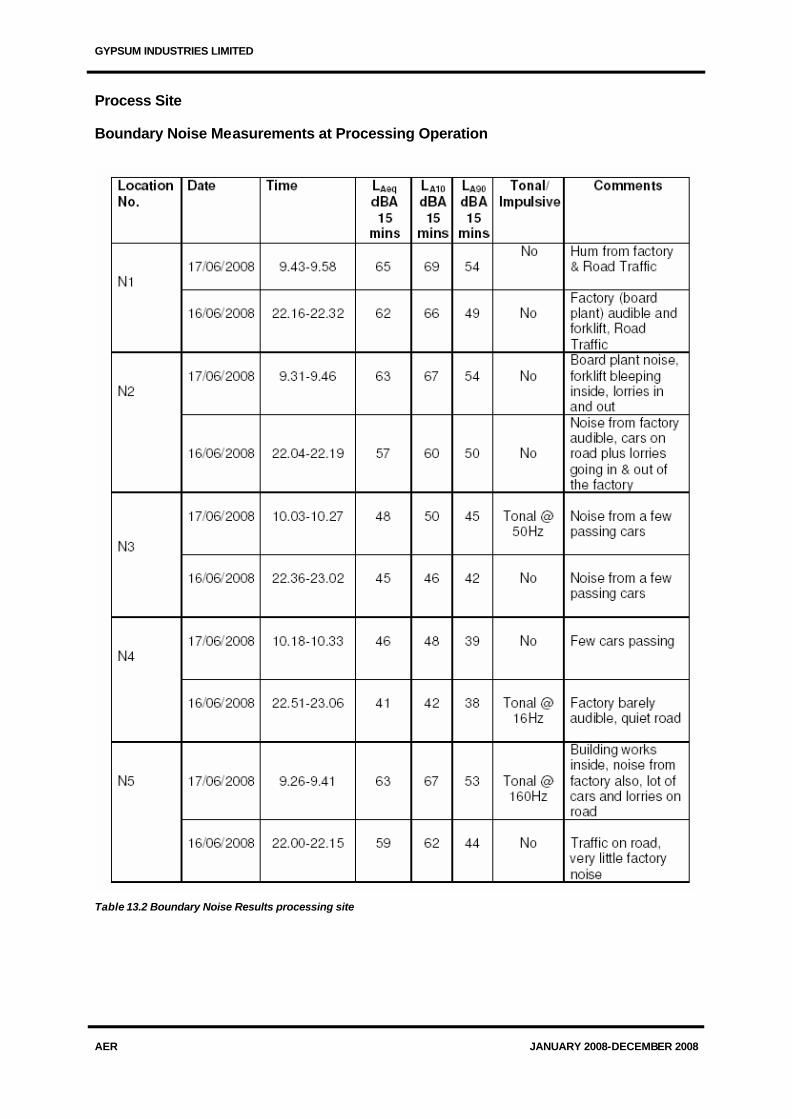
Process Site Boundary Noise Measurements at Processing Operation
Table 13.2 Boundary Noise Results processing site

GYPSUM INDUSTRIES LIMITED
AER
JANUARY 2008-DECEMBER 2008
One Third Octave Boundary Noise Measurements at Process Operation
Table 13.3 One Third Octave Boundary Noise Measurements Process Site

GYPSUM INDUSTRIES LIMITED
AER
JANUARY 2008-DECEMBER 2008
13.5 Interpretation of Results
Ambient Noise Measurements at the Mining Operation
Ambient noise measurements were taken at 3 boundary locations around the Mine site
during day and night time. Looking at each individual location and the results of the LA90 and
LA10, the following was found:
MS1
MS1 at the back of the mine had an LAeq reading of 53dBA during the day. The difference
of 8dBA between the LA10 reading of 55dBA and the LA90 reading of 47dBA indicates
Intermittent noise at this location, caused by road traffic and from a rock breaker on the site.
The noise at this location was impulsive, but due to the location of the rock breaker below
normal ground level in this area, it was not audible beyond the immediate site boundary at
MS1. The daytime LAeq reading at this location is within the IPPC daytime limit of 55dBA.
This location had an LAeq reading of 51dBA during the night. The difference of 22dBA
between the LA10 reading of 46dBA and the LA90 reading of 24dBA indicates a lot of
intermittent noise at this location, caused by cars coming from the football pitch nearby and
road traffic. No site noise was audible at this location and no impulsive noise audible. Tonal
noise at 16Hz was measured during the night time noise monitoring. Sound below the
frequency wave of 20Hz is termed infrasound and is below the normal threshold of hearing
so the source of this tone is unknown (e.g. could be from power lines) but as no factory noise
was audible it was not from site operations. Given the LA90 reading of 24dBA at this
location, it can be reasonably assumed that this is the typical background noise level at this
location, in the absence of road traffic. The night time LA90 reading at this location is well
within the IPPC night time limit of 45dBA.

GYPSUM INDUSTRIES LIMITED
AER
JANUARY 2008-DECEMBER 2008
MS2 MS2 at the side of the mine near the shop had an LAeq reading of 54dBA during the day.
The difference of 14dBA between the LA10 reading of 58dBA and the LA90 reading of
44dBA indicates a lot of intermittent noise at this location, caused by traffic passing on the
main road. The noise at this location was not impulsive and was tonal at 25Hz during the day
time noise monitoring. No mine noise was audible at this location so the tone is attributed to
traffic on the main road. The daytime LAeq reading at this location is below the IPPC daytime
limit of 55dBA.
This location had an LAeq reading of 55dBA during the night. The difference of 21dBA
between the LA10 reading of 55dBA and the LA90 reading of 34dBA indicates a lot of
intermittent noise at this location, caused by traffic passing on the main road. No site noise
was audible at this location. The noise at this location was not impulsive and was tonal at
16Hz. Sound below the frequency wave of 20Hz is termed infrasound and is below the
normal threshold of hearing so the source of this tone is unknown (e.g. could be from power
lines) but as no factory noise was audible it was not from site operations. Given the LA90
reading of 34dBA at this location, it can be reasonably assumed that this is the typical
background noise level at this location, in the absence of road traffic. The night time LA90
reading at this location is well within the IPPC night time limit of 45dBA.
MS3
MS3 had an LAeq reading of 39dBA during the day. The difference of 4dBA between the
LA10 reading of 41dBA and the LA90 reading of 37dBA indicates a small amount of
intermittent noise at this location, caused by traffic passing on the road. The noise at this
location was not impulsive and was tonal at 16Hz, 40Hz and 80Hz during the day. These
tones were sourced from road traffic noise. No houses are located in the vicinity of MS3,
although there are some a small distance away. The daytime LAeq reading at this location is
well within the IPPC daytime limit of 55dBA.
This location had an LAeq reading of 37dBA during the night. The difference of 3dBA
between the LA10 reading of 36dBA and the LA90 reading of 33dBA indicates a very small
amount of intermittent noise at this location. The noise at this location was not impulsive and
was tonal at 16Hz. Sound below the frequency wave of 20Hz is termed infrasound and is
below the normal threshold of hearing so the source of this tone is unknown (e.g. could be
from power lines) but as no factory noise was audible it was not from site operations. The
night time LAeq reading at this location is well within the IPPC daytime limit of 45dBA.

GYPSUM INDUSTRIES LIMITED
AER
JANUARY 2008-DECEMBER 2008
Ambient Noise Measurements at the Processing Operation
Ambient noise measurements were taken at 5 boundary locations around the processing
site. These noise measurements were taken both during the day and at night as the site
operates at both times. Looking at each individual location and the results of the LA90 and
LA10, the following was found:
N1
N1 close to the lorry car park had an LAeq reading of 65dBA during the day. The difference
of 15dBA between the LA10 reading of 69dBA and the LA90 reading of 54dBA indicates a lot
of intermittent noise at this location, caused by traffic on the main road. No impulsive or tonal
noise was evident at this location during the day. One house is located a small distance
across the road from N1. Given that the LA90 daytime reading of 54dBA at this location, it
can be reasonably assumed that this is the typical background noise level at this location, in
the absence of road traffic. The daytime LA90 reading at this location is within the IPPC
daytime limit of 55dBA.
This location had an LAeq reading of 62dBA during the night. The difference of 17dBA
between the LA10 reading of 66dBA and the LA90 reading of 49dBA indicates a lot of
intermittent noise at this location, caused by traffic on the main road and some noise from a
forklift operating on site. No impulsive or tonal noise was evident at this location during the
night. The background noise at this location (LA90) slightly exceeds the night time noise limit
of 45dBA.
N2 N2 close to the lorry entrance of the site had an LAeq reading of 63dBA during the day. The
difference of 13dBA between the LA10 reading of 67dBA and the LA90 reading of 54dBA
indicates a lot of intermittent noise at this location, caused by passing traffic on the main
road, lorries entering and leaving the site and a forklift inside the board plant. The noise at
this location was not impulsive or tonal during the daytime noise survey. Given that the LA90
daytime reading of 54dBA at this location, it can be reasonably assumed that this is the
typical background noise level at this location, in the absence of road traffic. The daytime
LA90 reading at this location is within the IPPC daytime limit of 55dBA.

GYPSUM INDUSTRIES LIMITED
AER
JANUARY 2008-DECEMBER 2008
This location had an LAeq reading of 57dBA during the night. The difference of 10dBA
between the LA10 reading of 60dBA and the LA90 reading of 50dBA indicates a lot of
intermittent noise at this location, caused by traffic entering and leaving the factory and
passing on the main road. The noise at this location was not impulsive or tonal during the
night time noise survey. The background noise at this location (LA90) slightly exceeds the
night time noise limit of 45dBA.
N3
N3 at the back of the site had an LAeq reading of 48dBA during the day. The difference of
5dBA between the LA10 reading of 50dBA and the LA90 reading of 45dBA indicates a low
level of intermittent noise at this location, caused by some passing traffic on the road. The
noise at this location was not impulsive and was tonal at 50Hz during the day time noise
survey. This tone was sourced from road traffic noise. The daytime LAeq reading at this
location is below the IPPC daytime limit of 55dBA.
This location had an LAeq reading of 45dBA during the night. The difference of 4dBA
between the LA10 reading of 46dBA and the LA90 reading of 42dBA indicates intermittent
noise at this location caused by some passing traffic. The noise at this location was not
impulsive or tonal during the night time survey. The night-time LAeq reading at this location is
below the IPPC daytime limit of 45dBA.
N4 N4 at the back of the site had an LAeq reading of 46dBA during the day. The difference of
9dBA between the LA10 reading of 48dBA and the LA90 reading of 39dBA indicates some
intermittent noise at this location caused by a passing traffic. The noise at this location was
not impulsive or tonal during the day time noise survey. The daytime LAeq reading at this
location is below the IPPC daytime limit of 55dBA.
This location had an LAeq reading of 41dBA during the night. The difference of 4dBA
between the LA10 reading of 42dBA and the LA90 reading of 38dBA indicates some
intermittent noise at this location. The noise at this location was not impulsive and was tonal
at 16Hz. Sound below the frequency wave of 20Hz is termed infrasound and is below the
normal threshold of hearing so the source of this tone is unknown (e.g. could be from power
lines) but as no factory noise was audible it was not from site operations. The night time
LAeq reading at this location is below the IPPC daytime limit of 45dBA.

GYPSUM INDUSTRIES LIMITED
AER
JANUARY 2008-DECEMBER 2008
N5
N5 close to the offices had an LAeq reading of 63dBA during the day. The difference of
14dBA between the LA10 reading of 67dBA and the LA90 reading of 53dBA indicates a lot of
intermittent noise at this location, caused by building works on site and traffic entering and
leaving the factory and passing on the main road. The noise from this location was not
impulsive and it was tonal at 160Hz. Given that the LA90 daytime reading of 53dBA at this
location, it can be reasonably assumed that this is the typical background noise level at this
location, in the absence of road traffic. The daytime LA90 reading at this location is within the
IPPC daytime limit of 55dBA.
This location had an LAeq reading of 59dBA during the night. The difference of 18dBA
between the LA10 reading of 62dBA and the LA90 reading of 44dBA indicates a lot of
intermittent noise at this location caused by road traffic. The noise from this location was not
impulsive or tonal during the night time survey. The LA90 night time reading of 44dBA is
within the IPPC limits.
13.6 Conclusion
Monitoring points adjacent to the roadway, particularly at locations MS1, N1, N2, N3, N4
and N5 are affected by road traffic.
However, in general, ambient noise levels around the mine site are low and not
problematic to neighbouring properties.
Ambient noise levels around the processing site are higher than at the mine and in
general boundary locations have noise levels within IPPC limits. However two locations;
N1 & N2 had noise levels slightly in excess of IPPC limits during the night. No houses
are located directly beside N1& N2, so the noise level at nearby noise sensitive locations
will be lower than at the boundary.

GYPSUM INDUSTRIES LIMITED
AER
JANUARY 2008-DECEMBER 2008

14.0 GROUND WATER MONITORING SUMMARY

GYPSUM INDUSTRIES LIMITED
AER
JANUARY 2008-DECEMBER 2008
14.0 Groundwater Monitoring Summary:
Ground water monitoring is scheduled to be carried out bi-annually, as outlined in Schedule
4(ii) of the IPPC licence. During 2008, both sets of monitoring were completed. The results
for the monitoring completed in 2008 are summarised in Appendix (iv).
Sampling and collection of groundwater was conducted by QED Engineering.
Minerex Environmental Limited were contracted to develop proposed guideline values for
groundwater chemistry at the process and mine site.
Minerex Report 1632-756 describes baseline groundwater chemistry at the process and
mine site. These baseline levels were used to develop a proposed guideline values. The
proposal is attached in Appendix (v)
Minerex Report 1632-863 summarises the 2008 monitoring results, interprets these results
and proposes mitigation measures. The report is attached in Appendix (vi)
Minerex Environmental Limited have been contracted to conduct all groundwater sample
collection, analysis and interpretation of results in 2009

GYPSUM INDUSTRIES LIMITED
AER
JANUARY 2008-DECEMBER 2008

15.0 AMBIENT AIR MONITORING SUMMARY
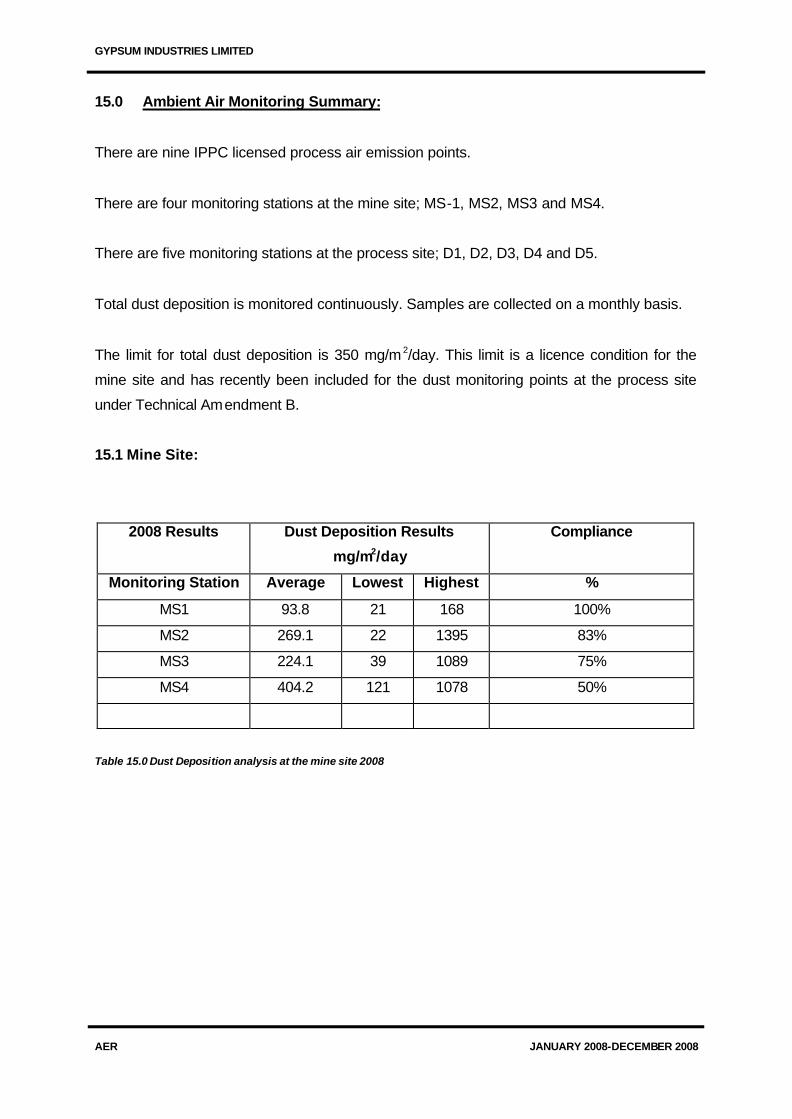
GYPSUM INDUSTRIES LIMITED
AER
JANUARY 2008-DECEMBER 2008
15.0 Ambient Air Monitoring Summary:
There are nine IPPC licensed process air emission points.
There are four monitoring stations at the mine site; MS-1, MS2, MS3 and MS4.
There are five monitoring stations at the process site; D1, D2, D3, D4 and D5.
Total dust deposition is monitored continuously. Samples are collected on a monthly basis.
The limit for total dust deposition is 350 mg/m 2/day. This limit is a licence condition for the
mine site and has recently been included for the dust monitoring points at the process site
under Technical Amendment B.
15.1 Mine Site:
2008 Results Dust Deposition Results
mg/m2/day
Compliance
Monitoring Station Average Lowest Highest %
MS1 93.8 21 168 100%
MS2 269.1 22 1395 83%
MS3 224.1 39 1089 75%
MS4 404.2 121 1078 50%
Table 15.0 Dust Deposition analysis at the mine site 2008

GYPSUM INDUSTRIES LIMITED
AER
JANUARY 2008-DECEMBER 2008
Dust Deposition Results
mg/m2/day Monitoring Station Average
2008
Average
2007
MS1 93.8 54.3
MS2 269.1 100.4
MS3 224.1 57.3
MS4 404.2 235.6
Table 15.1 Dust Deposition analysis at the mine site 2007 V’s 2008
There has been a marked increase in the average dust deposition results at the mine site.
The 2008 average figures were greatly influenced by some unusually high monitoring results
in Quarter 4 2008. On these occasions, samples were contaminated with leaves, twigs bugs
and algae. In addition to this, construction work on a site opposite our MS4 sampling station
commenced in Q4 2008. Additional monitoring between MS4 and the construction site
indicated that the offsite construction work did influence the high results obtained at MS4.
In order to blast in the quarry the upper layer of soil is stripped back. Stripping contracts were
undertaken during 2007 and 2008, stripping contractors were on site for five months in 2007
and 9 months in 2008.
There were two complaints received at the mine site with regard to dust levels on the road.
The first in February 2008 and the second in March 2008. There have been no complains
reported since.
A dust management project has been included in the environmental management
programme. While the dust deposition levels increased in 2008 at the mine site, good
housekeeping including truck coverage, improved wheel wash system, watering of ground at
the site during dry periods and road sweeping have had a positive impact.

GYPSUM INDUSTRIES LIMITED
AER
JANUARY 2008-DECEMBER 2008
15.2 Process Site:
2008 Results Dust Deposition Results
mg/m2/day
Compliance
Monitoring Station Average Lowest Highest %
D1 227.1 55 826 92
D2 94.2 32 182 100
D3 181.8 42 467 100
D4 168.3 49 413 92
D5 337.3 48 673 92
Table 15.2 Dust Deposition analysis at the process site 2008
Dust Deposition Results
mg/m2/day Monitoring Station Average
2008
Average
2007
D1 227.1 226.8
D2 94.2 273.3
D3 181.8 372.3
D4 168.3 263.4
D5 337.3 449.5
Table 15.3 Dust Deposition analysis at the process site 2007 V’s 2008
There was no change in dust levels at D1 from 2008 to 2007. Dust levels at D2, D3, D4 and
D5 decreased in 2008 compared to the monitoring results from 2007.

GYPSUM INDUSTRIES LIMITED
AER
JANUARY 2008-DECEMBER 2008

16.0 BUND INTEGRITY TESTING REPORT

GYPSUM INDUSTRIES LIMITED
AER
JANUARY 2008-DECEMBER 2008
16.0 Bund Integrity Testing Report
A Bund Integrity Assessment was undertaken in 2008. This assessment was conducted in
June 2008 by Brian Kavanagh from Thomas Garland and Partners, Consulting Civil and
Structural Engineers.
Both the mine and process site were inspected. The purpose of the inspection was to
ascertain if the bunds could be certified as being watertight.
The normal method of certifying bunds is to carry out a water retention test in accordance
with BS8007 (1987) and measure the loss of water over a 24-hour period. This method
naturally means that there is not capacity for the escape of the hydrocarbons during the
period of the test.
16.1 Process Site Inspection
There are four fixed bunds at the process site
Bund No Location/ Description
Construction
Bund
Capacity (L)
Tank
Volume (L)
Comment
FB 100 Lorry wash -Gas oil tank 68000 45000 Decommission
FB 101 Garage - Transport and
Waste oils
58000 71,000
(Total)
Work
Required
FB 102 Board Plant - Process
additives
43891 65,000
(Total)
OK
FB 103 Lubrication store 1942 10 * 205L
drums
OK
Table 16.0 Fixed Bund locations at the process site
FB 100
Accordingly from a visual inspection it is unlikely that this bund would pass a water retention
test to BS8007. Extensive work would be required to bring this whole bund up to compliance.
However this tank will be decommissioned during 2009.

GYPSUM INDUSTRIES LIMITED
AER
JANUARY 2008-DECEMBER 2008
FB 101
This is a very large concrete enclosure which contains several different tanks.
All tanks within this bunded area are double skinned with the exception of the Derv oil tank.
However as there is only one unbunded tank, consideration is being given to either:-
a) replacing the Derv Oil tank with a self bunded tank
or
b) creating a new bund for the 110% volume of this tank, within the main bunded area
FB 102
This is a large bunded area within the board plant containing two large tanks.
A careful inspection of the bund, paying particular attention to the junctions, revealed no
cracks.
There is every likelihood of this bund complying with the requirements.
FB 103
This bund is used to store 205 lt drums of lubricating oil.
The 10 No. drums are stored in a proprietary stacking system, which has a stated self bund
capacity of 66 gallons.
While it was not possible to fully inspect the concrete bund itself, a detailed inspection of the
blockwork walls outside the bund was completed. No signs of leakage were noted.

GYPSUM INDUSTRIES LIMITED
AER
JANUARY 2008-DECEMBER 2008
16.2 Mine Site
There are five fixed bunds at the mine site
Bund No Location/ Description Construction
Bund Capacity (L)
Tank Volume
Comment
FB 104 Main workshop - Transport Oil
31117 (10.4*3.4*0.88)
28,000 Work Required
FB 105 Main Workshop - Lubrication and waste oils
28971 (8.7*3.7*0.9)
9,900 (Total) OK
FB 106 Main Workshop - Lubrication oil store
Decommission 205 L drums Decommission
FB 107 East of workshop on access road to underground mine - Transport oil (self bunded unit)
OK
FB 108 Office - Heating Oil 2880 2700 OK Table 16.1 Fixed Bund locations at the mine site
FB 104
This is a large capacity steel tank beside the workshop at the mine site.
An inspection of the concrete bund revealed a number of timber spaces still cast within the
concrete
The timber spaces have been cut out and refilled with non shrink concrete.
We are currently sourcing a contractor to conduct pressure grouting of cracks identified.
FB 105
This concrete bund located beside the workshop at the mine site, houses 5 No. tanks of
varying capacity.
There are a number of very minor cracks which do show a small stain.
The leaks noted here are very minor and may pass the required test.

GYPSUM INDUSTRIES LIMITED
AER
JANUARY 2008-DECEMBER 2008
FB106
Adjacent to the mobile plant oil tanks there is a store for individual drums of lubricating oil.
This bund is constructed of un-rendered block and clearly failed.
Work on the replacement bund is nearing completion. All materials will be stored in the new
bund on completion. Thereafter FB 106 will be examined and a plan developed to remove
any waste / contaminated material from bund store.
FB107
There is a large self bunded diesel tank along with 2 No. water tanks and a fuel pump
located on the access road to the underground mine site.
As the diesel tank is self bunded there is no requirement for a concrete bund.
FB108
A small heating oil tank is located at the main offices to the mine. It is fully bunded with a
concrete bund.
There were no signs of any distress in the bund.
Follow Up:
The findings of the bund integrity report have been reviewed by the environmental manager
and facilities Engineer. Responsibility for the follow up on items raised has been assigned to
the facilities engineer.
Work has commenced on repairing the faults identified. This work has been broken down
into a three year programme and will include the provision of covers on the mine site bunds
to prevent ingress of rain water.

17.0 CRAMP AND ELRA REVIEW

GYPSUM INDUSTRIES LIMITED
AER
JANUARY 2008-DECEMBER 2008
17.0 CRAMP and ELRA review
Review of the our arrangements with regard to
1. Environmental Liability Risk Assessment ; ELRA,
2. Closure Restoration and Aftercare Management Plans; CRAMP and
3. Financial Provisions FP.
Risk Category:
G5: The extraction and processing (including size reduction, grading and heating) of
minerals within the meaning of the Minerals Development Acts 1940 to 1999, where an
activity involves—(a) a metalliferous operation, or (b) any other operation where either the
level of extracted or processed minerals is greater than 200,000 tonnes per annum or the
total operational yield is greater than 1,000,000 tonnes, and storage of related mineral waste.
ELRA
The ELRA was completed by Byrne and O’Cleirigh in July 2006. The report was forwarded to
the agency in Aug 2006. The method employed in carrying out the assessment was a risk
based approach, in accordance with the methodology for ELRA’s outlined in the then Draft
Guidance on Environmental Liabilities Risk Assessment and Residuals Management Plan.
CRAMP
The first RMP was completed and submitted to the agency in December 2003, it was revised
in July 2004. A full review of the CRAMP was completed in September 2007.
Financial Provisions:
Our environmental liabilities are covered under St Gobain's general environmental liabilities
insurance. This provides an indemnity limit of not less than €60 Million subject to a deductible
of €450K.
Our Closure, Restoration and Aftercare Management Plan CRAMP costs are estimated at
€2,082,716 for the mine site and € 2,975,000 for the process site.
The mine site closure costs are covered by three bonds which were put in place as
conditions to our planning permission at the mine site. The bonds total €2.2 Million.
The process site CRAMP costs are underwritten by Saint Gobain.

APPENDICES

ENVIRONMENTAL POLICY(I)
APPENDIX

INTEGRATED MANAGEMENT SYSTEMS
Subject HEALTH & SAFETY, ENVIRONMENTAL & QUALITY POLICY Owner: Kieran Miller Document No. 66 Kingscourt ü Author: Noel Molloy/Catherina McGuirk/Anita Thomas Rev. 2 Parkwest ü Date of Issue: August 20, 2008 Mining ü
Gypsum Industries Limited is the market leader in plasterboard and plaster manufacturing in Ireland. Our vision is to be the preferred choice for interior building systems that provide innovative design solutions. It is our policy
• To achieve and maintain the highest standards in Health & Safety and Environmental
responsibility, and in product Quality, throughout the company and in all our activities.
• To comply with all applicable national, international legislation and Saint-Gobain policies and
standards related to Health & Safety, Environmental and Quality matters.
• To identify hazards and eliminate or minimise risks so as to
o prevent injury or ill health to employees, contractors and visitors
o prevent and control adverse environmental impact
We are committed to
• Ensuring that Health and Safety at work is a core business value.
• The efficient use of resources, minimisation of waste and the prevention of pollution.
• Serving the needs of our customers by providing products and services that meet or exceed
requirements, are delivered on time and are priced to provide superior value.
We will routinely set and review achievement of specific objectives and targets for continuous improvement in the fields of Health & Safety, Environmental and Quality Management, and comply with the standards of independently verified management systems including ISO 14001 and ISO 9001.
We will use appropriate training, involvement, development and communication with all our employees and other relevant parties to actively promote
• awareness of Health & Safety,
• responsibility towards the Environment,
• understanding of product Quality.
We will devote sufficient resources to ensure that this policy is implemented throughout the company. We require and expect our employees and others on our sites to take responsibility for their compliance with this policy and its related procedures and practices.
Kieran Miller Managing Director August 20th, 2008

MACROINVERTEBRATE BIO-ASSESSMENT (PROCESS SITE)
(II)
APPENDIX

Biological Assessment of Water Quality
for
Gypsum Industries Ltd. Processing Operation
Kingscourt Co. Cavan
IPPC Licence No. P06519-02
By
Q.E.D. Engineering LtdM-TEK Building 2
Armagh RoadMonaghan
Tel: 00353 47 72060Fax: 00353 47 72061
September 2008

Biological Assessment of Lagan Streams, Gypsum Industries Ltd., Kingscourt, Co.Cavan
August 2008 1
1. Introduction
Q.E.D. Engineering Ltd. was commissioned by Gypsum Industries Ltd., to undertake
biological monitoring of the streams around the processing operation, which are part of the
Lagan River catchment. The work was undertaken by Simon O Connor, Joann McManus and
Brona Keating of Q.E.D. Engineering Ltd.
Three stream sites were examined during this survey; these sites have been surveyed in the
past (Enterprise Ireland, 2003, 2004 and Q.E.D. Engineering Ltd., 2006). Two sites are
located upstream of the processing plant and one downstream (Fig. 1).
2. Methodology
2.1 Physical and Chemical Sampling
The grid point reference (GPR) was taken at each site using a Garmin 72 GPS. Width and depth
were also taken and water flow was estimated. Dissolved oxygen (mg/l) was measured using a
Hanna HI 9146, Conductivity, pH and water temperatures were measured using a Hanna Combo
meter HI 98129.
2.2. Biological Sampling
All three sites were visited on August 6th and 7th 2008. A site description (general
description, flora and receiving environment) was taken for each site. All samples were
taken in riffle habitat. Macroinvertebrate sampling involved kick sampling, stone wash
and weed sampling. Macroinvertebrates were rinsed from the net into a deep white tray
and then placed in labelled containers. These samples were identified and counted in the
laboratory. Personal protective equipment (P.P.E.) was worn at all times during sampling.
2.3. Biotic Indices (Q values)
Macroinvertebrate analysis has been found to be suitable for routine water quality
monitoring purposes. The EPA scheme of Biotic Indices or Quality (Q) Values and its
relationship to water quality has divided macroinvertebrates into five arbitrary ‘Indicator
Groups’ as follows: Group A, the sensitive forms; Group B, the less sensitive forms;
Group C, the tolerant forms; Group D, the very tolerant forms and Group E, the most

Biological Assessment of Lagan Streams, Gypsum Industries Ltd., Kingscourt, Co.Cavan
August 2008 2
tolerant forms (Phosphorus Regulations, 1998; EPA, 2005). The Presence and abundance
of these groups as macroinvertebrate communities determine the Q value of the water body.

Biological Assessment of Lagan Streams, Gypsum Industries Ltd., Kingscourt, Co.Cavan
August 2008 3

Biological Assessment of Lagan Streams, Gypsum Industries Ltd., Kingscourt, Co.Cavan
August 2008 4
(Table 1). Intermediate values (Q1-2, 2-3, 3-4) denote transitional conditions between Q
ratings.
Table 1. Values for water quality and macroinvertebrate populations (EPA, 2005)
Q Value Water Quality Condition Community Diversity
Q5 Good Satisfactory High
Q4 Fair Satisfactory Reduced
Q3 Doubtful Unsatisfactory Much Reduced
Q2 Poor Unsatisfactory Low
Q1 Bad Unsatisfactory Very Low
3. Results
3.1 Physical and Chemical Results
All sites were within satisfactory levels of dissolved oxygen at this sampling date (Table
2). Water temperatures were typical for the time of year.
Table 2. Water temperature and oxygen levels, Gypsum Industries Ltd, August 2008
Parameter Site 1 Site 2 Site 3
GPS N7860 9214 N7911 9209 N7902 9251
Water temperature (oC) 14.8 14.6 14.9
Dissolved Oxygen (mg/l O2) 9.6 10.3 10.1
3.2 Site Descriptions and Q Indices
Site 1: Inflowing stream, west of Gypsum Industries Ltd.
This sampling site is located west of the facility and is taken upstream of the stone bridge
(Plate 1.). There is an inflow storm water pipe flowing into the stream at this bridge.
Another minor stream flowing northwards forms a confluence with these waters, before
flowing under the bridge towards Gypsum Industries Ltd. There appears to be a water
abstraction pump house near this sampling point. The stream here has both riffle and
glide habitats.

Biological Assessment of Lagan Streams, Gypsum Industries Ltd., Kingscourt, Co.Cavan
August 2008 5
Stream depth was approximately 10-15 centimetres, with a maximum width of 1 metre.
The substrate was comprised predominantly of gravel/stone/pebble and sand with some
scattered cobble. Flow was estimated at < 0.5 m sec-1. The banks here range from 30-60
cm high, with mixed hedgerow on the right bank, including some overhanging trees and
shrubs; Crataegus monogyna (hawthorn), and Ulex europaeus (gorse). The hedgerow is
generally unmanaged and heavily overgrown by Rubus fruiticosa (bramble), Hedera
helix (ivy) and ferns along the lower bank. The vegetation on the left side of the river
(facing downstream) is lower with stands of grasses especially Holcus lanatus (Yorkshire
fog), Juncus effesus (soft rush), Filipendula ulmaria (meadowsweet), Urtica dioica
(nettles), Geranium robertianum (herb robert), Heracleum mantegazzianum (giant
hogweed) and the creeping shrub Rubus fruiticosa (bramble), with Veronica beccabunga
(brooklime) being found instream. There was a considerable amount of allocthanous
material (leaves and branches) in the stream.
According to the biological assessment, a water quality rating of Q3 was allocated to this
site (Table 3). This would indicate water of an unsatisfactory condition (EPA, 2005).
This site was assessed as Q4 in 2006 and hence has deteriorated in terms of water quality.

Biological Assessment of Lagan Streams, Gypsum Industries Ltd., Kingscourt, Co.Cavan
August 2008 6
Table 3. Taxa at three sites sampled, August 2008
Taxa Site 1 Site 2 Site 3
Plecoptera 0 0 3
Ephemeroptera- Heptagenidae 0 0 0
Caenidae 0 0 0
Baetis rhodani 0 0 0
Trichoptera - Cased (Limnephilidae) 4 2 16
- Uncased (Philopotamidae) 1 0 0
Odonata 0 0 0
Coleoptera 5 0 0
Diptera – Tipulidae 0 3 0
Psychodidae 0 0 0
Chironomidae 0 9 0
Simulidae 0 0 0
Crustacea - Gammarus duebeni 108 209 325
Asellus aquaticus 8 0 64
Gastropoda - Lymnaea peregra 0 0 0
Hirudinea 0 0 0
Oligochaeta 0 0 0
Platyhelminthes 0 0 0
Water Quality Rating Q3 Q3 Q3-4
Site 2: Upstream and southeast of Gypsum Industries Ltd.
The physical characteristics of this upstream sampling station are very similar to Site 1
with both riffle and glide habitats at this location. The substrate however was dominated
by cobble (60%), much of which was coated with mud. The width of the stream was
again approx. 1 metre across with a depth 10-20 cms. The flow was very fast (0.6 m sec-1
estimate) and the water was visually very cloudy, with high suspended solids. There was
a considerable amount of allocthanous material (leaves and branches) in the stream.

Biological Assessment of Lagan Streams, Gypsum Industries Ltd., Kingscourt, Co.Cavan
August 2008 7
Plate 1. Site 2: Upstream of Gypsum Industries Ltd.
The left (west bank) reached up to 2 metres high in places, while the right bank was
lower (<1 m). Marginal vegetation included Juncus effusus (soft rush), Rumex acetosa
(common sorrel), ferns and grasses.
Upstream of this sampling site, the overhanging vegetation is extremely dense, creating a
tunneling effect and there is little or no light penetration. Some of the shrubs and trees
along the banks include Crataegus monogyna (hawthorn), Salix sp (Willow sp.),
Fraxinus excelsior (ash), Ilex aquifolium (holly) and Rubus fruiticosa (bramble).
The water quality biotic index Q3 was allocated to this site, indicating water that is
moderately polluted, of unsatisfactory condition and poor quality. Macroinvertebrate
sampling showed that sensitive forms were absent with the more tolerant fauna
dominating the community. Overall there was a low diversity in this sample. This site
was assessed as Q3 in 2006 and hence has remained the same in terms of water quality.
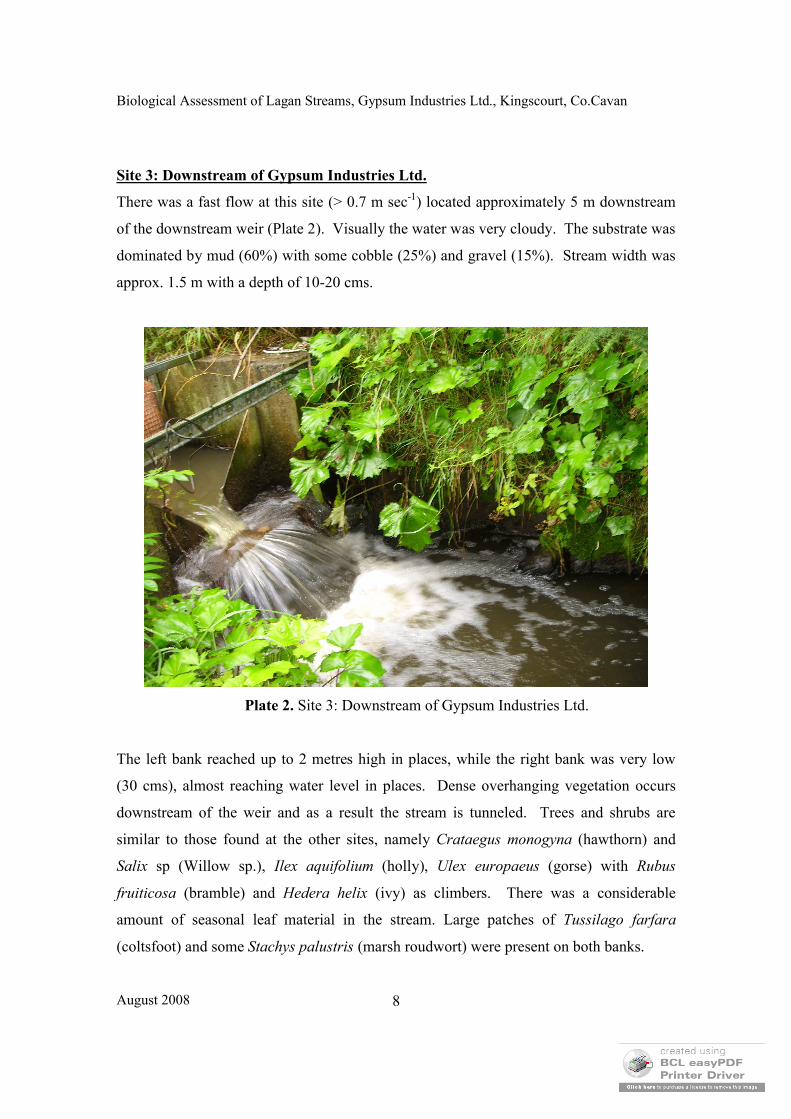
Biological Assessment of Lagan Streams, Gypsum Industries Ltd., Kingscourt, Co.Cavan
August 2008 8
Site 3: Downstream of Gypsum Industries Ltd.
There was a fast flow at this site (> 0.7 m sec-1) located approximately 5 m downstream
of the downstream weir (Plate 2). Visually the water was very cloudy. The substrate was
dominated by mud (60%) with some cobble (25%) and gravel (15%). Stream width was
approx. 1.5 m with a depth of 10-20 cms.
Plate 2. Site 3: Downstream of Gypsum Industries Ltd.
The left bank reached up to 2 metres high in places, while the right bank was very low
(30 cms), almost reaching water level in places. Dense overhanging vegetation occurs
downstream of the weir and as a result the stream is tunneled. Trees and shrubs are
similar to those found at the other sites, namely Crataegus monogyna (hawthorn) and
Salix sp (Willow sp.), Ilex aquifolium (holly), Ulex europaeus (gorse) with Rubus
fruiticosa (bramble) and Hedera helix (ivy) as climbers. There was a considerable
amount of seasonal leaf material in the stream. Large patches of Tussilago farfara
(coltsfoot) and some Stachys palustris (marsh roudwort) were present on both banks.

Biological Assessment of Lagan Streams, Gypsum Industries Ltd., Kingscourt, Co.Cavan
August 2008 9
A water quality rating of Q3-4 was allocated to this site, indicating an improvement in
water quality from the 2006 results (Q3), at this downstream site. This site can be
classified as slightly polluted. Gammarus duebeni, the freshwater shrimp dominating the
fauna and representing over 79% of the total invertebrates collected. However some
cased caddisflies (Order Trichoptera) were collected, representing more sensitive Group
B macroinvertebrates, and some Group A sensitive species were also recorded (Table 3).
5. Historical Data
The standard of the water quality at Site 1 decreased since November, 2006 (Table 4).
Site 1 has gone from being a Q4 to a Q3 quality over the past two years, i.e. ‘Fair’ quality
to ‘Doubtful’. The diversity of invertebrates in 2006 would have been greater, with more
numerous sensitive forms being found; the site currently however reveals a scarcity of
sensitive forms. Site 2 (Q3) achieved the same result as 2006 and at Site 3 (Q3-4) the
results were higher in terms of biological status, with a Q3 rating being assigned in 2006.
Table 4. Historical data
Year Site 1 Site 2 Site 3
2008 Q3 Q3 Q3-4
2006 Q4 Q3 Q3
2004 Q4-5 Q4-5 Q4
2003 Q4 No data No data
6. Conclusions
Only Site 1 has a lower Q Index result than in 2006 with Site 2 remaining the same and
Site 3 having a slightly higher Q Index result. This indicates a slight reduction in
biological quality of the Lagan upstream of Gypsum Industries. As reduction in
biological quality has occurred upstream, the reduction in water quality at Sites 1 and 2
cannot be directly attributed to Gypsum Industries. In terms of the water framework
directive 2000 however, all surface waters must achieve good quality by the year 2015.

Biological Assessment of Lagan Streams, Gypsum Industries Ltd., Kingscourt, Co.Cavan
August 2008 10
In the context of this survey, this should be reflected by future improvements in the
biological water quality (Q Index) of these streams.
7. References
Council Directive S.I. 2000/60/EC establishing a framework for community action in the
field of water policy.
Enterprise Ireland (2003), Biological Survey – 2004, Gypsum Industries Ltd.
Enterprise Ireland (2004), Biological Survey – 2004, Gypsum Industries Ltd.
Q.E.D. Engineering Ltd. (2006), Biological Assessment of Water Quality – for Gypsum
Industries Ltd. Processing Operation
EPA (2005). Water Quality in Ireland 2001-2003. EPA, Wexford.
Water Quality Standards for Phosphorus Regulations, 1998 (S.I. 258 of 1998).

MACROINVERTEBRATE BIO-ASSESSMENT (MINE SITE)
(III)
APPENDIX

Biological Assessment of Water Quality
for
Gypsum Industries Ltd. Mining OperationKingscourt RoadCarrickmacrossCo. Monaghan
IPPC Licence No. P0519-02
By
Q.E.D. Engineering LtdM-TEK Building 2
Armagh RoadMonaghan
Tel: 00353 47 72060Fax: 00353 47 72061
September 2008

Biological Assessment of Upper Lagan Catchment Gypsum Industries Ltd.
September 2008 1
1. Introduction
Q.E.D. Engineering Ltd was commissioned by Gypsum Industries Ltd., to undertake biological
monitoring of the Lagan River catchment, as surface water runoff from their mining operation
discharges into this river. The work was undertaken by Simon O Connor, Joann McManus and
Brona Keating of Q.E.D. Engineering Ltd.
A diagram of sampling locations along the Lagan River catchment is provided in Figure 1. This
catchment extends over an area of 350km2, rising in east Cavan and flowing in an easterly
direction entering the Irish Sea in Dundalk Bay. Midway along its length the Lagan is joined by
its principal tributary, the River Proules, at which point the river becomes known as the Glyde.
Over the past decade, four sites have been monitored in the upper Lagan catchment, to assess
biological water quality; two along the Bursk River, a tributary of the Lagan and two further
downstream of the Lagan River, Site 1 is located upstream of Gyspum Industries Ltd.’ waste
discharge pipe (Bursk River), while all other sites are located downstream of this (Fig 1).
Due to heavy flooding in August, Sites 3 and 4 were inaccessible and so samples could not be
taken at this time. Sampling from Sites 1 and 2 was carried out on the 6th and 7th of August 2008.
A sample was taken from Site 3 on 24th of September 2008 but Site 4 remained inaccessible at
this time.
2. Methodology
2.1 Physical and Chemical Sampling
The grid point reference (GPR) was taken at each site using a Garmin 72 GPS. Width and depth
were also taken and water flow was estimated. Dissolved oxygen (mg/l) was measured using a
Hanna HI 9146 meter. Conductivity, pH and water temperature were measured using a Hanna
Combo meter HI 98129.
2.2. Biological Monitoring
All four sites were visited on August 6th and 7th 2008 with Site’s 3 and 4 being flooded and
inacessible. However, a sample was taken from Site 3 on the 24th of September during lower
flow conditions. A site description (general description, flora and receiving environment) was
taken for each site. Macroinvertebrate sampling was regarded as relatively hazardous due to
high water levels and a soft, unstable river substrate. Water levels at Site 1 were greater than

Biological Assessment of Upper Lagan Catchment Gypsum Industries Ltd.
September 2008 2
one meter depth, which did not allow the sampler to actually enter the river system. A
representative invertebrate sample however, was successfully taken from the bank.
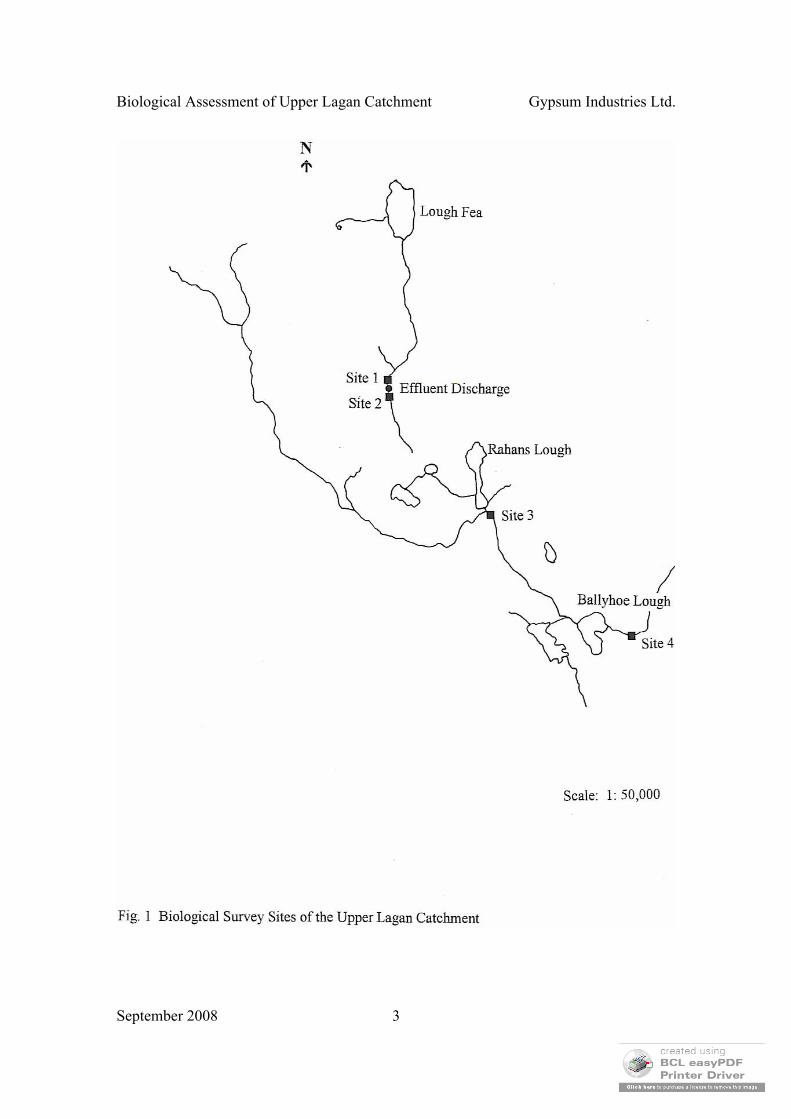
Biological Assessment of Upper Lagan Catchment Gypsum Industries Ltd.
September 2008 3

Biological Assessment of Upper Lagan Catchment Gypsum Industries Ltd.
September 2008 4
Personal protection equipment (P.P.E.) was worn at all times during sampling.
Due to high water levels, samples at Site 1 were taken in glide habitat, as no riffles were
exposed. The substrate in all cases was predominantly mud. Sites 1 and 2 were
comparable in terms of sampling methodology though it was possible to enter the river at
Site 2 to obtain a kick sample. Vegetation and substrate were comparable and both sites.
A kick sample was also taken at Site 3.
Macroinvertebrates were rinsed from the net into a deep white tray and then placed in
labeled containers. These samples were then identified and counted in the laboratory.
2.3 Biotic Indices (Q values)
Macroinvertebrate analysis has been found to be suitable for routine water quality
monitoring purposes. The EPA scheme of Biotic Indices or Quality (Q) Values and its
relationship to water quality has divided macroinvertebrates into five arbitrary “Indicator
Groups” as follows: Group A, the sensitive forms; Group B, the less sensitive forms;
Group C, the tolerant forms; Group D, the very tolerant forms and Group E, the most
tolerant forms (Phosphorus Regulations, 1998; EPA, 2005). The presence and abundance
of these groups as macroinvertebrate communities determine the Q value of the water
(Table 1). Intermediate values (Q1-2, 2-3, 3-4) denote transitional conditions between Q
ratings.
Table 1. Values for water quality and macroinvertebrate populations (EPA, 2005)
Q Value Water Quality Condition Community Diversity
Q5 Good Satisfactory High
Q4 Fair Satisfactory Reduced
Q3 Doubtful Unsatisfactory Much Reduced
Q2 Poor Unsatisfactory Low
Q1 Bad Unsatisfactory Very Low

Biological Assessment of Upper Lagan Catchment Gypsum Industries Ltd.
September 2008 5
Macroinvertebrate data from this study may not represent some taxa present on riffle
during low flow conditions. This aspect was taken into consideration in the assessment
of Q indices from the datasets generated.
3. Results
3.1 Physical and Chemical Results
All sites were within satisfactory levels of dissolved oxygen on the sampling date (Table
2). Water temperatures were typical for the time of year.
Table 2. Water temperature and oxygen levels, Upper Lagan sites
Parameter Site 1 Site 2 Site 3 Site 4
GPR N8204 9881 N8210 9858 N8346 9716 N8576 9538
Water temperature (0C) 14.2 14.5 13.6 14.1
Dissolved oxygen (mg/l) 8.7 8.3 8.2 8.5
3.2 Site Descriptions and Q Indices
Site 1: Upstream of effluent discharge
This sampling site is located on the Bursk River, upstream of a foot-bridge approximately
50m above the Gypsum Industries Ltd. effluent discharge pipe (Fig 1). Land in the
surrounding fields is used for dry stock cattle farming. River depth was approximately
1.4 metres with width ranging from 3–4 metres (Plate 1).
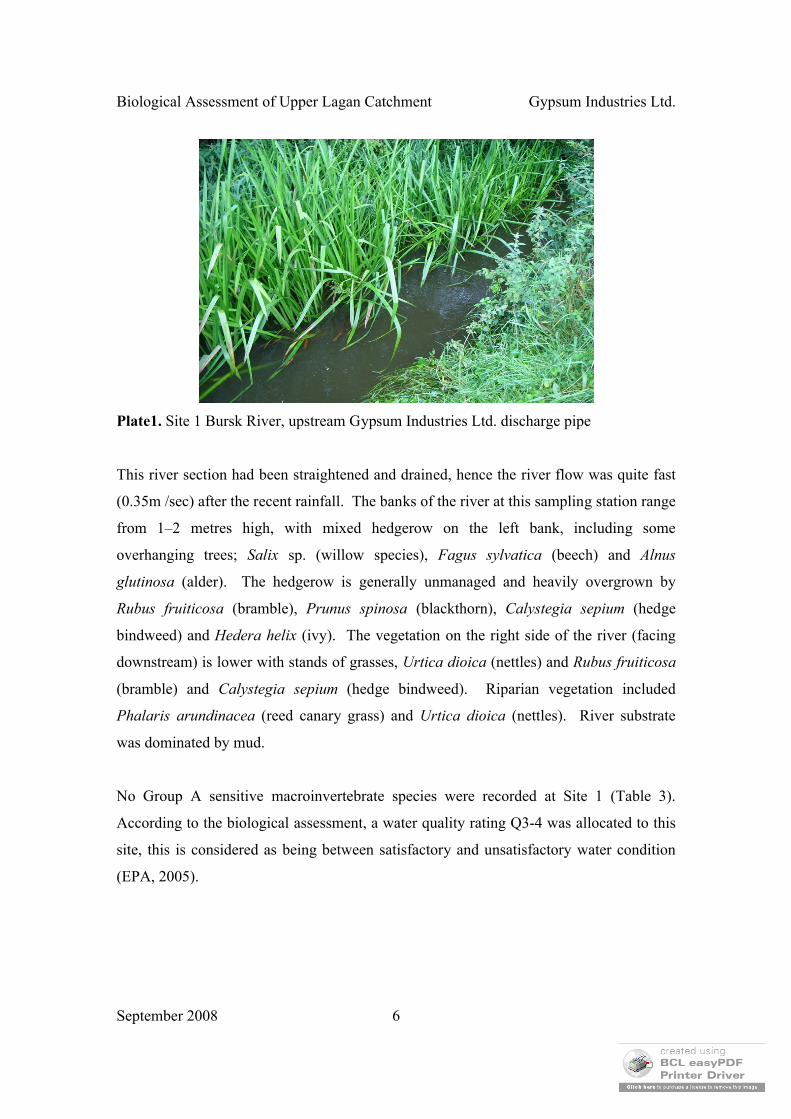
Biological Assessment of Upper Lagan Catchment Gypsum Industries Ltd.
September 2008 6
Plate1. Site 1 Bursk River, upstream Gypsum Industries Ltd. discharge pipe
This river section had been straightened and drained, hence the river flow was quite fast
(0.35m /sec) after the recent rainfall. The banks of the river at this sampling station range
from 1–2 metres high, with mixed hedgerow on the left bank, including some
overhanging trees; Salix sp. (willow species), Fagus sylvatica (beech) and Alnus
glutinosa (alder). The hedgerow is generally unmanaged and heavily overgrown by
Rubus fruiticosa (bramble), Prunus spinosa (blackthorn), Calystegia sepium (hedge
bindweed) and Hedera helix (ivy). The vegetation on the right side of the river (facing
downstream) is lower with stands of grasses, Urtica dioica (nettles) and Rubus fruiticosa
(bramble) and Calystegia sepium (hedge bindweed). Riparian vegetation included
Phalaris arundinacea (reed canary grass) and Urtica dioica (nettles). River substrate
was dominated by mud.
No Group A sensitive macroinvertebrate species were recorded at Site 1 (Table 3).
According to the biological assessment, a water quality rating Q3-4 was allocated to this
site, this is considered as being between satisfactory and unsatisfactory water condition
(EPA, 2005).

Biological Assessment of Upper Lagan Catchment Gypsum Industries Ltd.
September 2008 7
Table 3. Macroinvertebrate taxa and Q Indices, Upper Lagan
Taxa Site 1 Site 2 Site 3
Plecoptera (Group A) 0 0 0
Ephemeroptera- Heptageniidae (Group A) 0 0 0
Caenidae (Group C) 6 0 0
Baetis rhodani (Group C) 0 12 0
Trichoptera - Cased (Limnephilidae) (Group B) 5 32 0
- Uncased (Philopotamidae) (Group C) 2 0 0
Odonata (Group B) 0 0 3
Coleoptera (Group C) 3 7 3
Diptera – Tipulidae (Group C) 8 2 0
Psychodidae (Group E) 0 0 0
Chironomidae (Group C) 13 0 0
Simulidae (Group C) 0 0 0
Crustacea - Gammarus duebeni (Group C) 5 18 16
Asellus aquaticus (Group D) 0 0 51
Gastropoda - Lymnaea peregra (Group D) 0 0 4
Hirudinea (Group D) 0 0 0
Oligochaeta 0 0 12
Platyhelminthes (Group C) 0 0 5
Water Quality Index Q3-4 Q3-4 Q3
Site 2: 130 metres downstream of effluent discharge
The physical characteristics of this sampling station are very similar to Site 1, although it
was possible to obtain a kick sample. The left bank of the river (facing downstream)
graduated to grazed grassland with marginal flora including Filipendula ulmaria
(meadowsweet), Hedera helix (Ivy), Urtica dioica (nettles), grasses, Rubus fruiticosa
(bramble) and some higher vegetation in the form of Alnus glutinosa (alder).

Biological Assessment of Upper Lagan Catchment Gypsum Industries Ltd.
September 2008 8
Plate 2. Site 2, Bursk River, downstream of Gypsum Industries Ltd. discharge pipe
The right bank supported higher vegetation including trees and shrubs: Crataegus
monogyna (hawthorn), Salix sp (Willow sp.), Ulex europaeous (gorse), Rubus fruiticosa
(bramble) and Senecio jacobaea (ragwort). There was a considerable amount of seasonal
allochtanous material in the river.
No Group A sensitive macroinvertebrate species were recorded at Site 2. A water quality
Q Index of Q3-4 was also allocated to this site, indicating probable variable quality in this
stretch of the Bursk River.
Site 3: Downstream of Rahans Lough
This site is located approximately 100 metres downstream of Rahans Lough, alongside
open grassland. Physical characteristics were similar to the above sampling sites but the
substrate was comprised of both mud and sand. River width was 3-6 metres and approx.
0.6 metres deep. There was no overhanging vegetation along the embankments, except
for a few individual Salix (Willow) trees. Sparganium sp. (bur-reed) was present in-

Biological Assessment of Upper Lagan Catchment Gypsum Industries Ltd.
September 2008 9
stream with Phalaris arundinacea (reed canary-grass) along the banks. The flora on the
right bank was dominated by grasses (Gramineae) and Urtica dioica (nettles).
No group A species were recorded at Site 3. A water quality Q Index of Q3 was allocated
to this stretch of the Upper Lagan.
Site 4: Downstream of Ballyhoe Lough
The Upper Lagan directly downstream of Ballyhoe Bridge was approximately 20-25
metres across with a depth of 1.5 metres. This site however proved to be too difficult and
hazardous to sample. It is recommended that this sampling location be changed as there is
no point of access.
5. Historical Data
EPA Sampling
The EPA monitors the Proules River and Glyde River in this catchment. The Proules
River was classified as a seriously polluted river during the period 1995-1997. Sixty
percent of the Proules River channel was assessed as Class B water, 10% as Class C and
only 10% as Class A in 2001-2003 biological surveys carried out by the EPA (EPA,
2005). 37 km of the Glyde was assessed as Class A and 4km as Class B waters in the
same survey. Both Lough Fea and Ballyhoe Lough have been classified as mesotrophic
by the EPA (EPA, 2005).
Upper Lagan River Monitoring
There is no change in water quality at Site 1 since 2006. Water quality at this location
remains at Q3-4 the same as in 2006 (Table 4). Similarly, the site directly downstream of
the effluent discharge and Site 3 retain the same Q rating as 2006.
Table 4. Q Indices for Upper Lagan Sites 1996-2008
Year Site 1 Site 2 Site 3 Site 4
2008 3-4 3-4 3 -
2006 3-4 3-4 3 -

Biological Assessment of Upper Lagan Catchment Gypsum Industries Ltd.
September 2008 10
2003 2 3-2 - 3
2002 3 3 3 3
1999 3 3-2 - 3-2
1996 3-2 3 - 3-2
6. Conclusion
The upstream and downstream sites and the site downstream of Rahans Lough have
retained the same Q value since the 2006 survey. There was no deterioration in Q value
below the Gypsum Industries discharge pipe indicating that the discharge is not creating
impacts to biological water quality. It is concluded that the effluent discharge has no
deleterious effect on the quality of the receiving water.
7. References
EPA (2005). Water Quality in Ireland 2001-2003. EPA, Wexford.
Shannon Laboratory (1999) Biological Survey of the Upper Lagan Catchment
Shannon Laboratory (2003) Biological Survey of the Upper Lagan Catchment
Q.E.D. Engineering Ltd. (2006), Biological Assessment of Water Quality – for Gypsum
Industries Ltd. Mining Operation
Water Quality Standards for Phosphorus Regulations, 1998 (S.I. 258 of 1998).

2008 GROUND WATER RESULTS(IV)
APPENDIX

M1 M2 Warning Action Comments M1 M2 Warning Action CommentsDate: 21/04/2008 03/09/2008 22/04/2008 03/09/2008Alkalinity 260 410 214 466 Above Warning 220 207 214 466 Above WarningCalcium 223.4 254.2 212 529 Above Warning 53.8 76.9 212 529 Below WarningChloride 39.3 27.6 22 53 Above Warning 11.8 8.68 22 53 Below WarningMagnesium 32.1 43.9 50 100 Below Warning 15 20.1 50 100 Below WarningPotassium 1.3 2.3 4.3 9 Below Warning 1.8 2.4 4.3 9 Below WarningSodium 22.1 23.2 50 96 Below Warning 18.5 14.7 50 96 Below WarningSulphate 389 247 504 1775 Below Warning 17.1 18.9 504 1775 Below WarningConductivity 1389 1325 1299 2231 Above Warning 798 424 1299 2231 Below WarningpH 6.56 6.47 9 12.8 Below Warning No Result 7.89 9 12.8 Below Warning
M1 M2 Warning Action Comments M1 M2 Warning Action CommentsDate: 22/04/2008 04/09/2008 No Sample No SampleAlkalinity 280 273 214 466 Above Warning 214 466Calcium 171.2 140.3 212 529 Below Warning 212 529Chloride 14.6 13.4 22 53 Below Warning 22 53Magnesium 71.9 64.4 50 100 Above Warning 50 100Potassium 6.2 9 4.3 9 Above Warning 4.3 9Sodium 62.7 65.9 50 96 Above Warning 50 96Sulphate 438 552 504 1775 Above Warning 504 1775Conductivity 1643 1241 1299 2231 Above Warning 1299 2231pH 6.9 7.6 9 12.8 Below Warning 9 12.8
Overburden:MW2-P1 MW5-P2
BI ANNUAL GROUNDWATER MONITORING RESULTS
M102PA 95A1-S
Last Printed: 25/03/2009 Page:1 of 4 Document No: KCENV 13 Rev 1 Date of Issue: 09/03/2009

BI ANNUAL GROUNDWATER MONITORING RESULTS
M1 M2 Warning Action Comments M1 M2 Warning Action CommentsDate: 23/04/2008 04/09/2008 No Sample No SampleAlkalinity 316 392 188 1000 Above Warning 188 1000Calcium 109.7 159.8 301 574 Below Warning 301 574Chloride 10.3 12.1 21 54 Below Warning 21 54Magnesium <0.3 <0.3 35 85 Below Warning 35 85Potassium 12.9 17.4 12 116 Above Warning 12 116Sodium 15.1 25.4 83 625 Below Warning 83 625Sulphate 12.3 17.6 962 3459 Below Warning 962 3459Conductivity 2638 1758 1716 3478 Above Warning 1716 3478pH 10.6 12.78 8.5 13.3 Above Warning 8.5 13.3
M1 M2 Warning Action Comments M1 M2 Warning Action CommentsDate: 24/04/2008 04/09/2008 22/04/2008 03/09/2008Alkalinity 250 45 188 1000 Above Warning 154 131 188 1000 Below WarningCalcium 118.8 341 301 574 Above Warning 366.7 32.9 301 574 Above WarningChloride 21.1 15.2 21 54 Above Warning 17.8 36.1 21 54 Above WarningMagnesium 24.6 65.8 35 85 Above Warning 25.4 10.2 35 85 Below WarningPotassium 4.7 7.2 12 116 Below Warning 2.8 3.2 12 116 Below WarningSodium 55.7 81.3 83 625 Below Warning 16.5 73.8 83 625 Below WarningSulphate 259 1327 962 3459 Above Warning 94.3 57.5 962 3459 Below WarningConductivity 1939 1979 1716 3478 Above Warning 640 486 1716 3478 Below WarningpH 6.19 7.8 8.5 13.3 Below Warning 7.03 8.36 8.5 13.3 Below Warning
MW4-P1 MW5-P1
01JP-D MW1-P1Dolerite:
Last Printed: 25/03/2009 Page:2 of 4 Document No: KCENV 13 Rev 1 Date of Issue: 09/03/2009
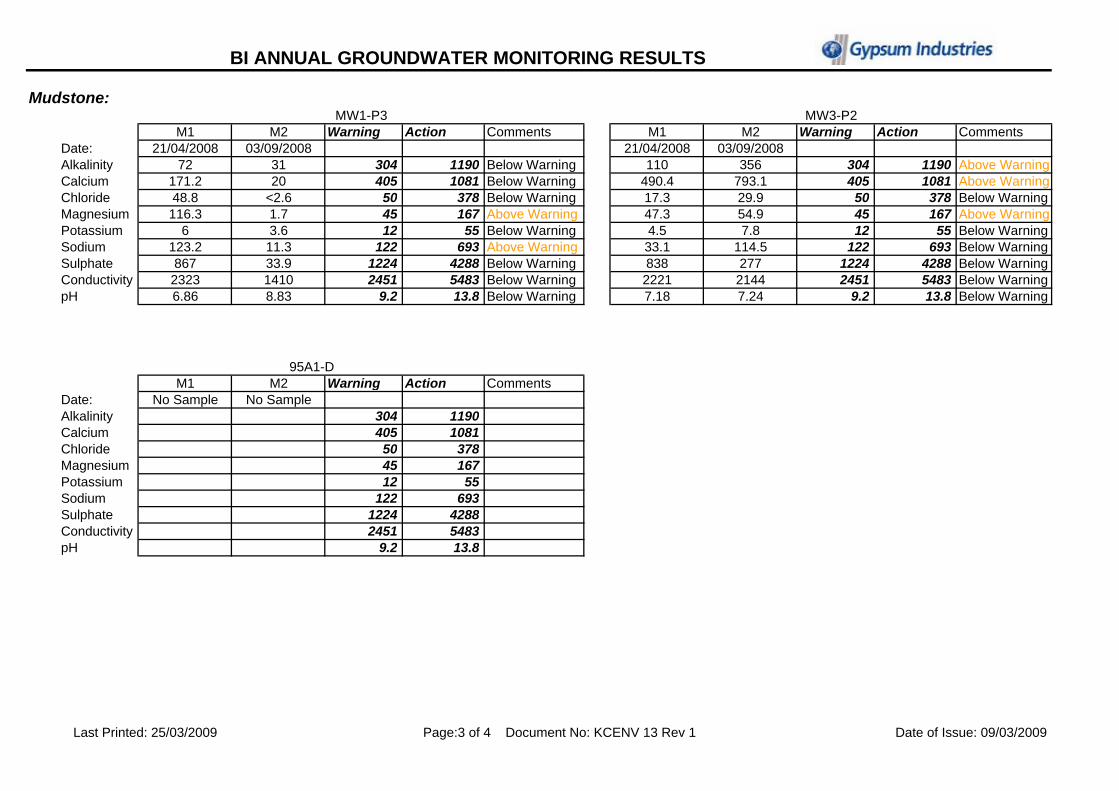
BI ANNUAL GROUNDWATER MONITORING RESULTS
M1 M2 Warning Action Comments M1 M2 Warning Action CommentsDate: 21/04/2008 03/09/2008 21/04/2008 03/09/2008Alkalinity 72 31 304 1190 Below Warning 110 356 304 1190 Above WarningCalcium 171.2 20 405 1081 Below Warning 490.4 793.1 405 1081 Above WarningChloride 48.8 <2.6 50 378 Below Warning 17.3 29.9 50 378 Below WarningMagnesium 116.3 1.7 45 167 Above Warning 47.3 54.9 45 167 Above WarningPotassium 6 3.6 12 55 Below Warning 4.5 7.8 12 55 Below WarningSodium 123.2 11.3 122 693 Above Warning 33.1 114.5 122 693 Below WarningSulphate 867 33.9 1224 4288 Below Warning 838 277 1224 4288 Below WarningConductivity 2323 1410 2451 5483 Below Warning 2221 2144 2451 5483 Below WarningpH 6.86 8.83 9.2 13.8 Below Warning 7.18 7.24 9.2 13.8 Below Warning
M1 M2 Warning Action CommentsDate: No Sample No SampleAlkalinity 304 1190Calcium 405 1081Chloride 50 378Magnesium 45 167Potassium 12 55Sodium 122 693Sulphate 1224 4288Conductivity 2451 5483pH 9.2 13.8
95A1-D
MW1-P3 MW3-P2Mudstone:
Last Printed: 25/03/2009 Page:3 of 4 Document No: KCENV 13 Rev 1 Date of Issue: 09/03/2009

BI ANNUAL GROUNDWATER MONITORING RESULTS
M1 M2 Warning Action Comments M1 M2 Warning Action CommentsDate: 21/04/2008 03/09/2008 No Sample No SampleAlkalinity 100 538 168 538 Above Warning 168 538Calcium 642.5 802.7 351 864 Above Warning 351 864Chloride 14.6 25.7 26 164 Below Warning 26 164Magnesium 64.6 80.7 57 284 Above Warning 57 284Potassium 69 12.1 9 69 Above Warning 9 69Sodium 56 168.1 57 168 Above Warning 57 168Sulphate 825 691 1018 2533 Below Warning 1018 2533Conductivity 3186 2587 1562 3186 Above Warning 1562 3186pH 6.22 7.7 7 8 Above Warning 7 8
Gypsum
M1 M2 Warning Action CommentsDate: 23/04/2008 04/09/2008Alkalinity 1820 1660 666 3000 Above WarningCalcium 861.3 1252 673 1252 Above WarningChloride 10.6 9.6 25 70 Below WarningMagnesium <0.3 <0.3 52 148 Below WarningPotassium 155.5 29.2 32 162 Above WarningSodium 147.9 72.6 122 296 Above WarningSulphate 6.17 <1.0 1164 3197 Below WarningConductivity 1997 >3999 3748 11638 Above WarningpH 12.03 13.23 9 13.8 Above Warning
01JP-S
MW6-P1Namurian / Westphalian:
MW3-P1
Last Printed: 25/03/2009 Page:4 of 4 Document No: KCENV 13 Rev 1 Date of Issue: 09/03/2009

M1 M2 Warning Action Comments M1 M2 Warning Action CommentsDate: No Sample No Sample No Sample 08/09/2008pH 7.5 11.7 11.7 7.5 11.7 Above WarningConductivity 1907 3000 1698 1907 3000 Below WarningCOD 39 156 13 39 156 Below WarningCalcium 337 599 309.6 337 599 Below WarningSulphate 1026 1586 486 1026 1586 Below WarningAmmonia 0.08 0.221 0.221 0.08 0.221 Above WarningChloride 23 78.1 78.1 23 78.1 Above WarningManganese 120 406.3 406.3 120 406.3 Above WarningBarium 108 314 107.5 108 314 Below Warning
M1 M2 Warning Action Comments M1 M2 Warning Action CommentsDate: 30/04/2008 08/09/2008 30/04/2008 08/09/2008pH 7.1 7.19 7.2 7.9 Below Warning 6.69 6.21 7.2 7.9 Below WarningConductivity 520 308 1165 2310 Below Warning 1639 1395 1165 2310 Above WarningCOD <8 <8 39 197 Below Warning 26 <8 39 197 Below WarningCalcium 66.9 43 214 447 Below Warning 161 290.6 214 447 Above WarningSulphate 85.6 656 596 2515 Above Warning 340 424 596 2515 Below WarningAmmonia 0.201 <0.007 1.9 5.5 Below Warning 3.06 2.27 1.9 5.5 Above WarningChloride 15.9 3.34 14.5 28.2 Above Warning 17.7 23.8 14.5 28.2 Above WarningManganese 80.6 78.2 3911 10110 Below Warning 4165 5702 3911 10110 Above WarningBarium 134.2 106.7 126 196 Above Warning 127.6 89.2 126 196 Above Warning
Gravels:BH9-03S BH3-03S
BI ANNUAL GROUNDWATER MONITORING RESULTS
Overburden:BH2-04S BH5-03S
Last Printed:25/03/2009Page 1 of 4
Document no: KCENV13 Rev 1 Issue Date 09/03/09

BI ANNUAL GROUNDWATER MONITORING RESULTS
M1 M2 Warning Action Comments M1 M2 Warning Action CommentsDate: 29/04/2008 08/09/2008 30/04/2008 09/09/2008pH 6.33 7.18 7.4 11.1 Below Warning 6.89 6.67 7.4 11.1 Below WarningConductivity 3249 1642 1740 3809 Above Warning 1786 1972 1740 3809 Above WarningCOD <8 <8 49 408 Below Warning <8 <8 49 408 Below WarningCalcium 140.2 378.3 416 745 Below Warning 691.5 465.2 416 745 Above WarningSulphate 363 590 1040 2891 Below Warning 1334 907 1040 2891 Above WarningAmmonia 0.046 0.112 0.19 2.25 Below Warning 0.132 0.123 0.19 2.25 Below WarningChloride 17.9 7.93 18.5 56 Below Warning 12.3 9.83 18.5 56 Below WarningManganese 39 559.3 559.3 1679 Above Warning 1679 152.2 559.3 1679 Above WarningBarium 23.4 17.3 40 174 Below Warning 59.6 23.7 40 174 Above Warning
M1 M2 Warning Action Comments M1 M2 Warning Action CommentsDate: 29/04/2008 09/09/2008 30/04/2008 09/09/2008pH 7.01 7.5 7.1 7.7 Above Warning 6.99 7.32 7.1 7.7 Above WarningConductivity 2545 2102 1506 2737 Above Warning 832 811 1506 2737 Below WarningCOD <8 <8 21 61 Below Warning <8 12 21 61 Below WarningCalcium 463.3 402.1 292 554 Above Warning 121.2 212.2 292 554 Below WarningSulphate 1308 908 841 2455 Above Warning 93.9 441 841 2455 Below WarningAmmonia 0.222 0.17 0.12 0.3 Above Warning 0.027 <0.007 0.12 0.3 Below WarningChloride 15 13.3 24 61 Below Warning 17.7 18.5 24 61 Below WarningManganese 100.8 178.2 360 1611 Below Warning 148 103.8 360 1611 Below WarningBarium 19.5 13.7 153 572 Below Warning 204.4 189.9 153 572 Above Warning
Gypsum:BH4-03D BH6-03D
Mudstone:BH1-04D BH2-4D
Last Printed:25/03/2009Page 2 of 4
Document no: KCENV13 Rev 1 Issue Date 09/03/09

BI ANNUAL GROUNDWATER MONITORING RESULTS
M1 M2 Warning Action CommentsDate: 30/04/2008 08/09/2008pH 6.79 7.58 7.3 8.8 Above WarningConductivity 590 369 1407 2971 Below WarningCOD <8 <8 61 476 Below WarningCalcium 51.5 50.3 295 775 Below WarningSulphate 12.9 15.4 1447 7002 Below WarningAmmonia 0.083 0.37 0.39 4.4 Below WarningChloride 13.3 11 13 17 Above WarningManganese 137.1 225.3 386 6950 Below WarningBarium 54.3 36.3 58 245 Below Warning
Dolerite:BH3-03D
Last Printed:25/03/2009Page 3 of 4
Document no: KCENV13 Rev 1 Issue Date 09/03/09
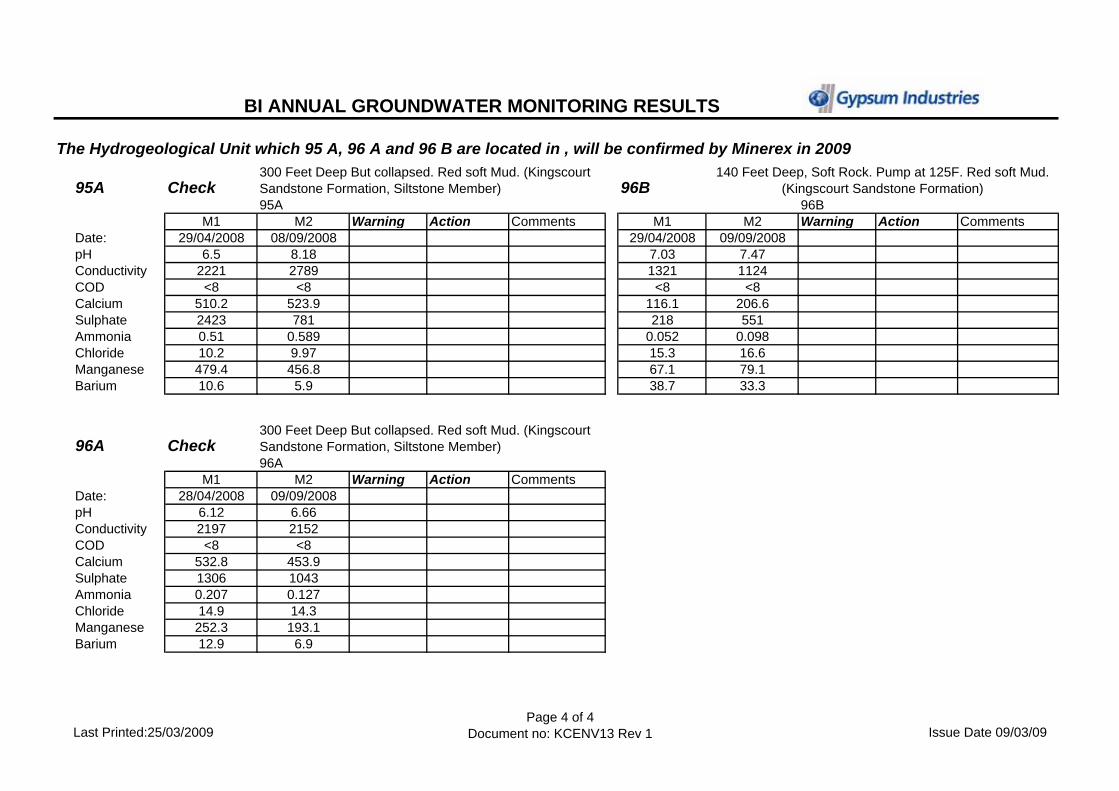
BI ANNUAL GROUNDWATER MONITORING RESULTS
95A Check 96B95A 96B
M1 M2 Warning Action Comments M1 M2 Warning Action CommentsDate: 29/04/2008 08/09/2008 29/04/2008 09/09/2008pH 6.5 8.18 7.03 7.47Conductivity 2221 2789 1321 1124COD <8 <8 <8 <8Calcium 510.2 523.9 116.1 206.6Sulphate 2423 781 218 551Ammonia 0.51 0.589 0.052 0.098Chloride 10.2 9.97 15.3 16.6Manganese 479.4 456.8 67.1 79.1Barium 10.6 5.9 38.7 33.3
96A Check 96A
M1 M2 Warning Action CommentsDate: 28/04/2008 09/09/2008pH 6.12 6.66Conductivity 2197 2152COD <8 <8Calcium 532.8 453.9Sulphate 1306 1043Ammonia 0.207 0.127Chloride 14.9 14.3Manganese 252.3 193.1Barium 12.9 6.9
300 Feet Deep But collapsed. Red soft Mud. (Kingscourt Sandstone Formation, Siltstone Member)
The Hydrogeological Unit which 95 A, 96 A and 96 B are located in , will be confirmed by Minerex in 2009300 Feet Deep But collapsed. Red soft Mud. (Kingscourt Sandstone Formation, Siltstone Member)
140 Feet Deep, Soft Rock. Pump at 125F. Red soft Mud. (Kingscourt Sandstone Formation)
Last Printed:25/03/2009Page 4 of 4
Document no: KCENV13 Rev 1 Issue Date 09/03/09

PROPOSED GUIDELINE VALUES FOR GROUNDWATER
(V)
APPENDIX
Report submitted by: Confidential Report To: Minerex Environmental Limited Dave Kent Taney Hall, Dundrum, Dublin 14, Ireland Irish Gypsum Limited Dublin 14, Ireland Kingscourt Tel.: +353-(0)1-2964435 Co. Cavan Fax.: +353-(0)1-2964436 Website: www.minerex.ie
Prepared by : Reviewed by :
Jenny Rush M.Sc. P.Dip. EurGeol Cecil Shine M.Sc. PGeo Project Manager Project Director
Irish Gypsum Limited IPPC Licence No. 688 Condition 9.3.5
Report on baseline groundwater chemistry at Irish Gypsum mine & processing sites
and proposal for the setting of guideline values
Minerex Brief F3 Minerex Doc. Ref.: 1632-756 (Final 11-03-09).doc Date: Wednesday, March 11, 2009

REPORT TO REPORT BYIrish Gypsum Limited Minerex Environmental Limited
IPPC Licence No. 688 Doc Ref : 1632-756 (Final 11-03-09).doc
Report on baseline groundwater chemistry at Irish Gypsum mine & processing sites Page 1 of 18
Contents
1. Introduction ________________________________________ 2 1.1 Background ___________________________________________________________2 1.2 Licence conditions ______________________________________________________2 1.3 Report purpose & content ________________________________________________2
2. Geology & hydrogeology _____________________________ 2 2.1 Mine site geology _______________________________________________________2 2.2 Processing site geology __________________________________________________2 2.3 Kingscourt Gypsum hydrogeology __________________________________________2
3. Monitoring locations, methodology & parameters ________ 2 3.1 Mine site monitoring locations _____________________________________________2 3.2 Processing site monitoring locations ________________________________________2 3.3 Sampling methodology __________________________________________________2 3.4 Limitations on interpretation_______________________________________________2 3.5 Gypsum saturation______________________________________________________2 3.6 Interim guideline values __________________________________________________2
4. Mine site chemistry__________________________________ 2 4.1 Results _______________________________________________________________2 4.2 Hydrochemical signatures ________________________________________________2 4.3 Comparison with groundwater chemistry research _____________________________2 4.4 Comparison with IGV’s __________________________________________________2
5. Processing site chemistry ____________________________ 2 5.1 Results _______________________________________________________________2 5.2 Hydrochemical signatures ________________________________________________2 5.3 Comparison with groundwater chemistry research _____________________________2 5.4 Comparison with IGV’s __________________________________________________2
6. Conclusions________________________________________ 2 6.1 Mitigation measures_____________________________________________________2
7. References_________________________________________ 2

REPORT TO REPORT BYIrish Gypsum Limited Minerex Environmental Limited
IPPC Licence No. 688 Doc Ref : 1632-756 (Final 11-03-09).doc
Report on baseline groundwater chemistry at Irish Gypsum mine & processing sites Page 2 of 18
Appendices Appendix Title Pages MEL Document Reference
Appendix A Piezometers & stratigraphy – mine site 1 x A4 1632-024.ppt Appendix B Geology map & boreholes – mine site 1 x A3 1632-008.cdr Appendix C Piezometers & stratigraphy – processing site 1 x A4 1632-024.ppt Appendix D Geology map & boreholes – processing site 1 x A3 1632-008.cdr Appendix E Groundwater chemistry – mine site 1 x A4 1632-010.xls Appendix F Groundwater chemistry – processing site 1 x A4 1632-010.xls
Disclaimer Minerex Environmental Limited (MEL) has prepared this report for the sole use of its client in accordance with the work authorised. No warranty, expressed or implied, is made as to the professional advice included in this report or any other services provided by MEL. This report may not be relied upon by any other party without the prior and express written permission from MEL. Interpretations contained in this report are derived from available information of the site conditions, the likely environmental responses and the experience of the company. MEL has prepared this report in line with best current practice and with all reasonable skill, care and diligence in consideration of the limits imposed by materials, equipment or methodologies used, and the resources devoted to it as agreed with the client. The interpretative basis of the conclusions contained in this report should be taken into account in any future use of this report. While MEL endeavours to take reasonable effort to assess data in hand at the time of writing and give the best advice possible, MEL will accept no responsibility for how the information within this report is interpreted and used. Where elements of this report are based upon information provided by others, it is assumed that all the relevant information has been supplied to MEL in full and is reliable, accurate and representative. MEL has not independently verified any information provided by others. MEL, its agents, directors, owners, employees, and contractors will not be held responsible for any loss (reputation, financial, technical or otherwise) occurring from the use of this report, howsoever caused.

REPORT TO REPORT BYIrish Gypsum Limited Minerex Environmental Limited
IPPC Licence No. 688 Doc Ref : 1632-756 (Final 11-03-09).doc
Report on baseline groundwater chemistry at Irish Gypsum mine & processing sites Page 3 of 18
1. Introduction
1.1 Background Irish Gypsum Limited (IGL) operate mining and processing facilities in the Kingscourt area of Co. Monaghan, which are subject to conditions of IPPC Licence No. 688/ P0519 (Ref. 1). Minerex Environmental Limited (MEL) have undertaken hydrogeological and environmental investigations at IGL since October 2003 for compliance with their IPPC Licence and additional Environmental Protection Agency (EPA) requirements.
IGL were requested by the EPA to submit a proposal to determine guideline values for groundwater quality in both the mine site and the processing sites to be “based on the Agency’s 2003 publication ‘Towards setting guideline values for the protection of groundwater in Ireland’, and/ or the natural groundwater chemistry found in the area of both the mine and processing site’ (Ref. 2), for use in evaluating the results of groundwater monitoring (Ref. 3).
1.2 Licence conditions In compliance with condition 9.3.8 of the IPPC licence, all of the groundwater monitoring points at each site are sampled and analysed on a biannual basis, the results of which are submitted to the EPA annually as part of the AER. In compliance with condition 9.3.5, a report on baseline groundwater hydraulics and hydrochemistry at the mine site was submitted in October 2005 (Ref. 4).
1.3 Report purpose & content The purpose of this report is to compare the available results of groundwater monitoring at each site with the EPA interim guideline values for groundwater and natural/ baseline groundwater chemistry in the area and to establish warning and action levels for each parameter within each hydrogeological unit. The report contains details of the groundwater monitoring point locations, the hydrogeological units monitored, the range of values and the average values for each unit to date. The report also suggests appropriate mitigation measures to be taken on reaching the warning and action levels proposed in conjunction with IGL.
2. Geology & hydrogeology
2.1 Mine site geology 2.1.1 According to subsoil mapping compiled by Teagasc, the area in which the mine site is located
is underlain by tills chiefly derived from Lower Palaeozoic rocks, while the area immediately surrounding the site consists of made ground and rock at the surface (Ref. 5). Based on the results of drilling at the mine site, as undertaken by IGl and MEL, the overburden ranges in thickness from 5m to 21m.
2.1.2 According to bedrock geology mapping compiled by the Geological Survey of Ireland, the mine site is underlain by the Kingscourt Gypsum Formation, which is described as mudstone with gypsum and anhydrite of Permian age and is part of the Kingscourt Outlier (Ref. 6). A typical sequence within the Kingscourt Gypsum Formation consists of a basal conglomerate member of some 0-18m in thickness, which is overlain by marl and mudstone which are collectively termed the lower mudstone, the thickness of which varies between 2-25m (Appendix A) (Ref. 6). Overlying the lower mudstone is the lower gypsum, which is separated from the upper

REPORT TO REPORT BYIrish Gypsum Limited Minerex Environmental Limited
IPPC Licence No. 688 Doc Ref : 1632-756 (Final 11-03-09).doc
Report on baseline groundwater chemistry at Irish Gypsum mine & processing sites Page 4 of 18
gypsum by the middle mudstone of between 6-12m in thickness. The upper gypsum is overlain by the upper mudstone, which is between 26-35m in thickness.
2.1.2 Dolerite sills occur in the Kingscourt Gypsum Formation, with the principal intrusion in the middle mudstone between the two gypsum members, with a maximum thickness of 60m (Ref. 7). A secondary intrusion is generally restricted to the lower mudstone with a maximum thickness of 8m.
2.1.3 The Kingscourt Gypsum formation is underlain by Carboniferous undifferentiated micaceous shale, siltstone and sandstone, and occasional thin coal beds of Westphalian and Namurian age, which do not outcrop in the mine site but to the south and north of the Kingscourt Outlier (Appendix B).
2.2 Processing site geology 2.3.1 Based on the results of drilling at the processing site, as undertaken by Bord Na Mona, the site
is underlain by glacial tills, between 3-13m in thickness, while the area surrounding the landfill is underlain by sands and gravels, between 4.5-11.5m in thickness (Ref. 8).
2.3.2 The processing site is underlain by the Kingscourt Gypsum Formation, which overlies the Westphalian rocks unconformably (Appendix D). The Kingscourt Gypsum is faulted against the Clontail Formation of Namurian age, which is described as shale, siltstone and thin sandstones; by the Kingscourt Fault which lines the main road to the front of the facility in a north-south orientation (Ref. 6).
2.3.3 Both the Namurian rocks and the Kingscourt Gypsum Formation are intruded by doleritic sills, which run across the facility in a southeast-northwest direction (Appendix D).
2.3 Kingscourt Gypsum hydrogeology Despite some evidence of karstification within the gypsum units, the gypsum deposits and the mudstones of the Kingscourt Gypsum Formation are essentially aquicludes, which restrict the flow of groundwater from one aquifer to another and are characterised by low permeabilities. The dolerites of the Kingscourt Gypsum Formation are essentially aquitards, which are characterised by low flow rates and by low permeabilities. The dolerites of the Kingscourt Gypsum Formation are interpreted to have been hydrothermally altered as they were being intruded, resulting in susceptibility to weathering and enhanced permeability relative to the mudstones and gypsum (Ref. 7).
3. Monitoring locations, methodology & parameters
3.1 Mine site monitoring locations A total of 26 groundwater monitoring points have been installed within 1.5km of the mining facilities at Knocknacran to determine the impact of dewatering operations on groundwater levels in the surrounding hydrogeological units (Appendix A). The locations of these monitoring points are shown in Appendix B. These are as follows:
Monitoring point ID Hydrogeological unit Aquifer type 01JP-S Upper gypsum Aquiclude 01JP-D Dolerite in middle mudstone Aquitard MW1-P3 Upper mudstone Aquiclude MW1-P1 Dolerite in middle mudstone Aquitard MW1-P2 Upper gypsum Aquiclude

REPORT TO REPORT BYIrish Gypsum Limited Minerex Environmental Limited
IPPC Licence No. 688 Doc Ref : 1632-756 (Final 11-03-09).doc
Report on baseline groundwater chemistry at Irish Gypsum mine & processing sites Page 5 of 18
MW2-P1 Overburden - MW3-P2 Middle mudstone Aquiclude MW3-P1 Namurian/ Westphalian Poor aquifer MW4-P1 Dolerite in lower mudstone Aquitard MW5-P2 Overburden - MW5-P1 Dolerite in middle mudstone Aquitard MW6-P1 Namurian/ Westphalian Locally important aquifer M102PA Overburden - 95A1-D Middle mudstone Aquiclude
3.2 Processing site monitoring locations A total of 19 groundwater monitoring points have been installed in the vicinity of the IGL processing facility at Lisnabow to determine the impact of site operations on groundwater chemistry in the surrounding hydrogeological units (Appendix B). All the monitoring points are currently monitored on a biannual basis. The locations of these monitoring points are shown in Appendix D. These are as follows:
Monitoring Point ID Hydrogeological unit Aquifer type BH2-04S Overburden - BH5-03S Overburden - BH1-04D Mudstone Aquiclude BH2-04D Mudstone Aquiclude BH9-03S Gravels Locally important aquifer BH3-03S Gravels Locally important aquifer BH9-03D Westphalian Poor aquifer BH3-03D Dolerite Aquitard BH4-03D Gypsum & mudstone Aquiclude BH6-03D Gypsum & mudstone Aquiclude 95A Dolerite Aquitard 96A Gypsum & mudstone? Aquiclude 96B Gypsum & mudstone? Aquiclude
3.3 Sampling methodology Groundwater monitoring has been carried out by QED Limited at both the mine site and the
processing site on a biannual basis since May 2005 in accordance with Schedule 4 (ii) of the IPPC Licence and by MEL at the mine site in November 2003 and February and May 2005. The sampling methodology was consistent between QED and MEL, where samples are obtained using a submersible Wasp pump and Waterra tubing following standards and protocols based on ISO 5667 standard methods and EPA guidelines, whereby every practical effort was made to purge each monitoring borehole of three borehole volumes prior to a sample being taken. The samples are dispatched to ELS Laboratory for analysis. The following table details the parameters for analysis at each site.
Mine site Processing sitepH pH Conductivity Conductivity Calcium COD Sulphate Calcium Ammonia Sulphate Nitrate Ammonia Chloride Chloride Sodium Manganese Potassium Barium

REPORT TO REPORT BYIrish Gypsum Limited Minerex Environmental Limited
IPPC Licence No. 688 Doc Ref : 1632-756 (Final 11-03-09).doc
Report on baseline groundwater chemistry at Irish Gypsum mine & processing sites Page 6 of 18
Magnesium Alkalinity
3.4 Limitations on interpretation In order to account for the wide range of values for each parameter within each hydrogeological unit, the following issues were looked at to ensure that seemingly anomalous data was in fact representative of the variation within the hydrogeological unit:
- The variation in results is not attributed to potential inconsistencies in using different laboratories between MEL and QED sampling events, as the results from each for similar times of year remain consistent;
- The variation in results is not attributed to potential inconsistencies in sampling methodology between MEL and QED sampling events, as the sampling methodology adheres to ISO standards and therefore should remain consistent;
- The variation in results is not attributed to potential insufficient purging of water from the boreholes after drilling, as sampling at the mine site dates from after drilling and while sampling at the processing site dates from immediately after drilling, the results remain consistent;
- The variation in results is not attributed to seasonal variations in antecedent rainfall, as there is no obvious seasonal trend in the results;
- It is unclear if the variation in the results can be attributed to anthropogenic activities, leaking annuli, human error, and variation in sample preservation or natural hydrochemical fluctuation.
3.5 Gypsum saturation Gypsum is soluble in fresh water and therefore water that comes in contact with gypsum tends to have naturally elevated sulphate and conductivity levels (Ref. 9). An assessment undertaken on the potential impacts of mine flooding on the long term stability at Drummond shows that a solution saturated with respect to gypsum would contain approximately 560mg/l of calcium and 1340mg/l of sulphate (Ref. 9). Assuming stable conditions, once these levels have been reached, in theory no more gypsum can dissolve in the saturated solution. However, sulphate levels of >1340mg/l, as apparent at the mine site, may indicate that other sulphate minerals have dissolved.
3.6 Interim guideline values The Water Framework Directive (WFD) (2000/60/EEC) establishes a strategic framework for managing the water environment and sets out a common approach to protecting and setting environmental objectives for all groundwater and surface waters within the European Community (Ref. 10). Specifically for groundwater, the WFD aims to maintain and / or attain ‘good chemical status’ in all groundwater bodies. However the exact requirements of the WFD are not yet fully determined. In the interim, Member States were required to establish appropriate criteria. Interim guideline values (IGV’s) for specific parameters were drawn up taking account of various legislative and guidance values but are chiefly derived from the drinking water standards.

REPORT TO REPORT BYIrish Gypsum Limited Minerex Environmental Limited
IPPC Licence No. 688 Doc Ref : 1632-756 (Final 11-03-09).doc
Report on baseline groundwater chemistry at Irish Gypsum mine & processing sites Page 7 of 18
4. Mine site chemistry
4.1 Results The results of groundwater monitoring conducted by QED at the mine site since May 2005 are presented in Appendix E, as well as the results of irregular monitoring conducted by MEL in November 2003 and February and May 2005.
4.2 Hydrochemical signatures
4.2.1 Overburden
The range of values for each parameter and the average value in the overburden are detailed in the table below and graphed in Appendix E. The range of values for each parameter is most likely due to variation in the parent material of the overburden.
Parameter Unit No. of sampling events
Range Average IGV
Alkalinity mg/l 6 24-466 214 No abnormal change Calcium mg/l 6 48-529 212 200 Chloride mg/l 5 9-53 22 30 Magnesium mg/l 5 5-100 50 50 Potassium mg/l 6 0.1-9 4 5 Sodium mg/l 6 15-96 50 150 Sulphate mg/l 5 17-1,775 504 200 Conductivity uS/cm 7 424-2,231 1,299 1,000 pH pH 7 5.7-8.9 7.0 ≥6.5, ≤9.5
4.2.2 Gypsum
The range of values for each parameter and the average value in the gypsum are detailed in the table below and graphed in Appendix E. The widest range of values for alkalinity and conductivity and the highest values for calcium and pH are recorded in the upper gypsum. As a result of mining and karstification in places, the upper gypsum is likely to have increased permeability relative to the surrounding units and therefore is likely to be more susceptible to hydrochemical fluctuation as a result of the recharging and throughput of groundwaters from the overlying units. The groundwater here is typical of recharging waters in limestones and sandstones, being dominated by calcium, which is reflected in high alkalinity and conductivity values. The high values of potassium may indicate agricultural contamination of recharging waters.
Parameter Unit No. of sampling events
Range Average IGV
Alkalinity mg/l 6 16-3,000 666 No abnormal change Calcium mg/l 6 285-1,252 673 200 Chloride mg/l 6 2-68 25 30 Magnesium mg/l 6 0.02-148 52 50 Potassium mg/l 6 0.6-162 32 5 Sodium mg/l 6 21-296 122 150 Sulphate mg/l 5 6-3,197 1,164 200 Conductivity uS/cm 7 1,719-11,638 3,748 1,000 pH pH 7 6-14 9 ≥6.5, ≤9.5

REPORT TO REPORT BYIrish Gypsum Limited Minerex Environmental Limited
IPPC Licence No. 688 Doc Ref : 1632-756 (Final 11-03-09).doc
Report on baseline groundwater chemistry at Irish Gypsum mine & processing sites Page 8 of 18
4.2.3 Dolerite
The range of values for each parameter and the average value in the dolerites are detailed in the table below and graphed in Appendix E. The widest ranges for sodium and sulphate and the highest values for sodium, sulphate and pH are in the dolerite. The dolerites are interpreted to have been hydrothermally altered during intrusion resulting in enhanced permeability relative to the other units when in their nature state. Groundwater moving through the dolerite is likely to have infiltrated through the overlying mudstone and gypsum units and into the dolerite and is likely to have reached saturation with respect to sulphate at depth. The groundwater here is typical of ion-exchanged waters, being dominated by sodium.
Parameter Unit No. of sampling events
Range Average IGV
Alkalinity mg/l 7 20-1,000 188 No abnormal change Calcium mg/l 7 33-574 301 200 Chloride mg/l 7 7-54 21 30 Magnesium mg/l 7 0.12-85 35 50 Potassium mg/l 7 0.1-116 12 5 Sodium mg/l 7 14-625 82 150 Sulphate mg/l 6 2.3-3,459 962 200 Conductivity uS/cm 8 382-3,478 1,716 1,000 pH pH 8 6.2-13.2 8.4 ≥6.5, ≤9.5
4.2.4 Mudstone
The range of values for each parameter and the average value in the mudstones are detailed in the table below and graphed in Appendix E.
Parameter Unit No. of sampling events
Range Average IGV
Alkalinity mg/l 6 10-1,190 304 No abnormal change Calcium mg/l 6 20-1,081 405 200 Chloride mg/l 6 2.7-378 50 30 Magnesium mg/l 6 0.04-167 45 50 Potassium mg/l 6 0.1-246 26 5 Sodium mg/l 6 11-693 122 150 Sulphate mg/l 5 25-4,288 1,224 200 Conductivity uS/cm 7 453-5,483 2,541 1,000 pH pH 7 6.1-13.8 9.2 ≥6.5, ≤9.5
4.2.5 Namurian & Westphalian
The results for calcium, chloride, conductivity, magnesium and sulphate range widely between MW3-P1 in the Westphalian and MW6-P1 in the Namurian, suggesting that these units are different in hydrochemistry.
Parameter Unit No. of sampling events
Range Average IGV
Alkalinity mg/l 6 62*-538 168 No abnormal change Calcium mg/l 6 60-864* 351 200 Chloride mg/l 6 7*-164* 26 30 Magnesium mg/l 6 19-284* 57 50 Potassium mg/l 6 0.7*-69* 9 5 Sodium mg/l 6 22*-168* 57 150 Sulphate mg/l 5 74-2,533* 1,018 200 Conductivity uS/cm 7 406-3,186* 1,562 1,000

REPORT TO REPORT BYIrish Gypsum Limited Minerex Environmental Limited
IPPC Licence No. 688 Doc Ref : 1632-756 (Final 11-03-09).doc
Report on baseline groundwater chemistry at Irish Gypsum mine & processing sites Page 9 of 18
pH pH 7 6.2*-8 7 ≥6.5, ≤9.5
* = value from MW3-P1 in Westphalian
The widest ranges and the highest values for chloride and magnesium are in the Westphalian. The groundwater in the Westphalian unit is likely to be relatively old and therefore have high chloride and magnesium values, among the most dominant elements in seawater.
4.3 Comparison with groundwater chemistry research A study was carried out by the Working Group on Groundwater as part of the Water Framework Directive to characterise the hydrochemistry of bedrock aquifers (Ref. 11). Amongst others, the study compiled hydrochemistry data for the Triassic sandstone aquifer; however, there was no data available for the Permian mudstones and gypsums. The following table details the range of values for alkalinity, hardness and electrical conductivity.
Parameter Unit Range Alkalinity mg/l 61-324 Hardness mg/l 61-364 Conductivity uS/cm 128-720
The ranges for alkalinity and electrical conductivity throughout the geological sequence at the mine site exceed the ranges of values for the Triassic sandstone aquifer, reflecting the strong hydrochemical influence of the gypsum horizons. Water hardness is not monitored at the mine site.
4.4 Comparison with IGV’s The range of results exceeds the IGV’s in most cases. This indicates that the ranges of values recorded here are atypical of groundwater across the country and reflect the unique geology and resultant hydrochemistry of the Kingscourt Outlier.
5. Processing site chemistry
5.1 Results The results of groundwater monitoring conducted by QED at the processing site since December 2004 are presented in Appendix F, as well as the results of once-off monitoring by MEL in December 2003 and by Bord Na Mona in August 2003.
5.2 Hydrochemical signatures
5.2.1 Overburden
The range of values for each parameter and the average value in the overburden are detailed in the table below and graphed in Appendix F. The widest range and highest results for chloride are recorded in the overburden. These results are lower than at the mine site suggesting more recently recharged water.

REPORT TO REPORT BYIrish Gypsum Limited Minerex Environmental Limited
IPPC Licence No. 688 Doc Ref : 1632-756 (Final 11-03-09).doc
Report on baseline groundwater chemistry at Irish Gypsum mine & processing sites Page 10 of 18
Parameter Unit No. of sampling
events Range Average IGV
pH pH 9 5.3-11.7 7.5 ≥6.5, ≤9.5 Conductivity uS/cm 9 845-3,000 1,907 1,000 COD mg/l 6 8-156* 39* - Calcium mg/l 9 62-599 337 200 Sulphate mg/l 9 175-1,586 1,026 200 Ammonia mg/l 8 <0.0067-0.221* 0.08* 0.15 Chloride mg/l 8 4.2-78 23 30 Manganese ug/l 8 14-406* 120* 50 Barium ug/l 8 41-314* 108* 100
* = results available for BH5-03S only
5.2.2 Gravels
The range of values for each parameter and the average value in the gravels are detailed in the table below and graphed in Appendix F. The widest ranges and the highest values for ammonia and manganese are recorded in the gravels. The results for ammonia here suggest contamination by agricultural fertilisers or wastewater treatment systems external to the site. The results for manganese are high and could be the result of anthropogenic activity, or equally could be attributed to naturally occurring manganese in the area. An adjacent site, which is sufficiently removed so as not to be affected by operations at the processing site, showed high levels of manganese occurring naturally. The results for sulphate suggest that groundwater in the gravels has been in contact with gypsiferous minerals, which occur naturally in the area.
Parameter Unit No. of sampling events
Range Average IGV
pH pH 9 6.5-7.9 7.2 ≥6.5, ≤9.5 Conductivity uS/cm 9 331-2,310 1,165 1,000 COD mg/l 6 <8-197 39 - Calcium mg/l 9 45-447 214 200 Sulphate mg/l 9 5.4-2,515 596 200 Ammonia mg/l 8 <0.011-5.5 1.9 0.15 Chloride mg/l 8 9.2-28.2 14.5 30 Manganese ug/l 8 2-10,110 3,911 50 Barium ug/l 8 63-196 126 100
5.2.3 Gypsum
The range of values for each parameter and the average value in the gypsum are detailed in the table below and graphed in Appendix F. The widest ranges and the highest values for calcium, conductivity and pH are recorded in the gypsum. However the range of values recorded in the gypsum at the processing site are smaller than the range of values recorded at the mine site. This is most likely as a result of mining and karstification, in places, at the mine site resulting in more throughflow and higher hydrochemical fluctuation. The groundwater here is typical of recharging waters in limestones and sandstones, being dominated by calcium, which is reflected in high conductivity values.
Parameter Unit No. of sampling events
Range Average IGV
pH pH 9 5.8-11.1 7.4 ≥6.5, ≤9.5 Conductivity uS/cm 9 372-3,809 1,740 1,000 COD mg/l 6 <8-408 49 - Calcium mg/l 9 70-745 416 200
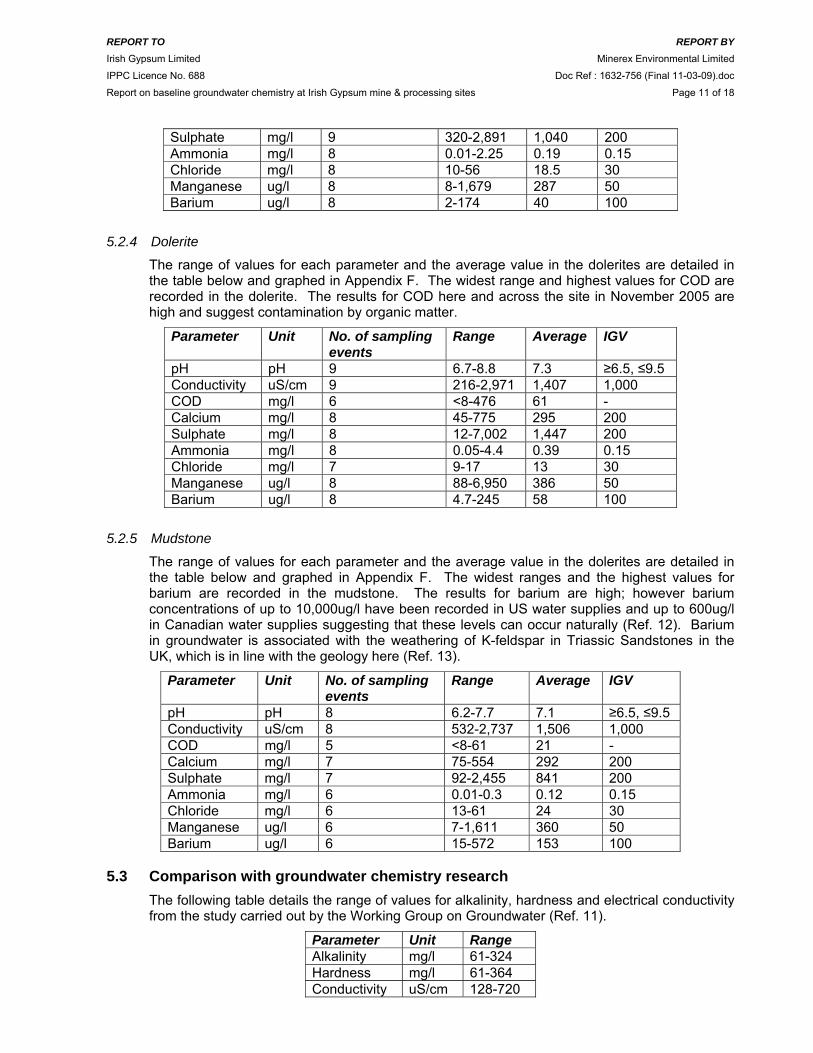
REPORT TO REPORT BYIrish Gypsum Limited Minerex Environmental Limited
IPPC Licence No. 688 Doc Ref : 1632-756 (Final 11-03-09).doc
Report on baseline groundwater chemistry at Irish Gypsum mine & processing sites Page 11 of 18
Sulphate mg/l 9 320-2,891 1,040 200 Ammonia mg/l 8 0.01-2.25 0.19 0.15 Chloride mg/l 8 10-56 18.5 30 Manganese ug/l 8 8-1,679 287 50 Barium ug/l 8 2-174 40 100
5.2.4 Dolerite
The range of values for each parameter and the average value in the dolerites are detailed in the table below and graphed in Appendix F. The widest range and highest values for COD are recorded in the dolerite. The results for COD here and across the site in November 2005 are high and suggest contamination by organic matter.
Parameter Unit No. of sampling events
Range Average IGV
pH pH 9 6.7-8.8 7.3 ≥6.5, ≤9.5 Conductivity uS/cm 9 216-2,971 1,407 1,000 COD mg/l 6 <8-476 61 - Calcium mg/l 8 45-775 295 200 Sulphate mg/l 8 12-7,002 1,447 200 Ammonia mg/l 8 0.05-4.4 0.39 0.15 Chloride mg/l 7 9-17 13 30 Manganese ug/l 8 88-6,950 386 50 Barium ug/l 8 4.7-245 58 100
5.2.5 Mudstone
The range of values for each parameter and the average value in the dolerites are detailed in the table below and graphed in Appendix F. The widest ranges and the highest values for barium are recorded in the mudstone. The results for barium are high; however barium concentrations of up to 10,000ug/l have been recorded in US water supplies and up to 600ug/l in Canadian water supplies suggesting that these levels can occur naturally (Ref. 12). Barium in groundwater is associated with the weathering of K-feldspar in Triassic Sandstones in the UK, which is in line with the geology here (Ref. 13).
Parameter Unit No. of sampling events
Range Average IGV
pH pH 8 6.2-7.7 7.1 ≥6.5, ≤9.5 Conductivity uS/cm 8 532-2,737 1,506 1,000 COD mg/l 5 <8-61 21 - Calcium mg/l 7 75-554 292 200 Sulphate mg/l 7 92-2,455 841 200 Ammonia mg/l 6 0.01-0.3 0.12 0.15 Chloride mg/l 6 13-61 24 30 Manganese ug/l 6 7-1,611 360 50 Barium ug/l 6 15-572 153 100
5.3 Comparison with groundwater chemistry research The following table details the range of values for alkalinity, hardness and electrical conductivity from the study carried out by the Working Group on Groundwater (Ref. 11).
Parameter Unit Range Alkalinity mg/l 61-324 Hardness mg/l 61-364 Conductivity uS/cm 128-720

REPORT TO REPORT BYIrish Gypsum Limited Minerex Environmental Limited
IPPC Licence No. 688 Doc Ref : 1632-756 (Final 11-03-09).doc
Report on baseline groundwater chemistry at Irish Gypsum mine & processing sites Page 12 of 18
The ranges for electrical conductivity throughout the geological sequence at the processing site exceed the ranges of values for Permo-Triassic bedrock aquifers, with the exception of the Westphalian shales. Water hardness and alkalinity are not monitored at this site.
5.4 Comparison with IGV’s The range of results exceeds the IGV’s in most cases, with the exception of the results for dolerite. This indicates that the ranges of values recorded here are atypical of groundwater across the country and reflect the unique geology and resultant hydrochemistry of the Kingscourt Outlier. The results for the dolerite suggest that groundwater here is hydrochemically isolated from the other units, unlike at the mine site.
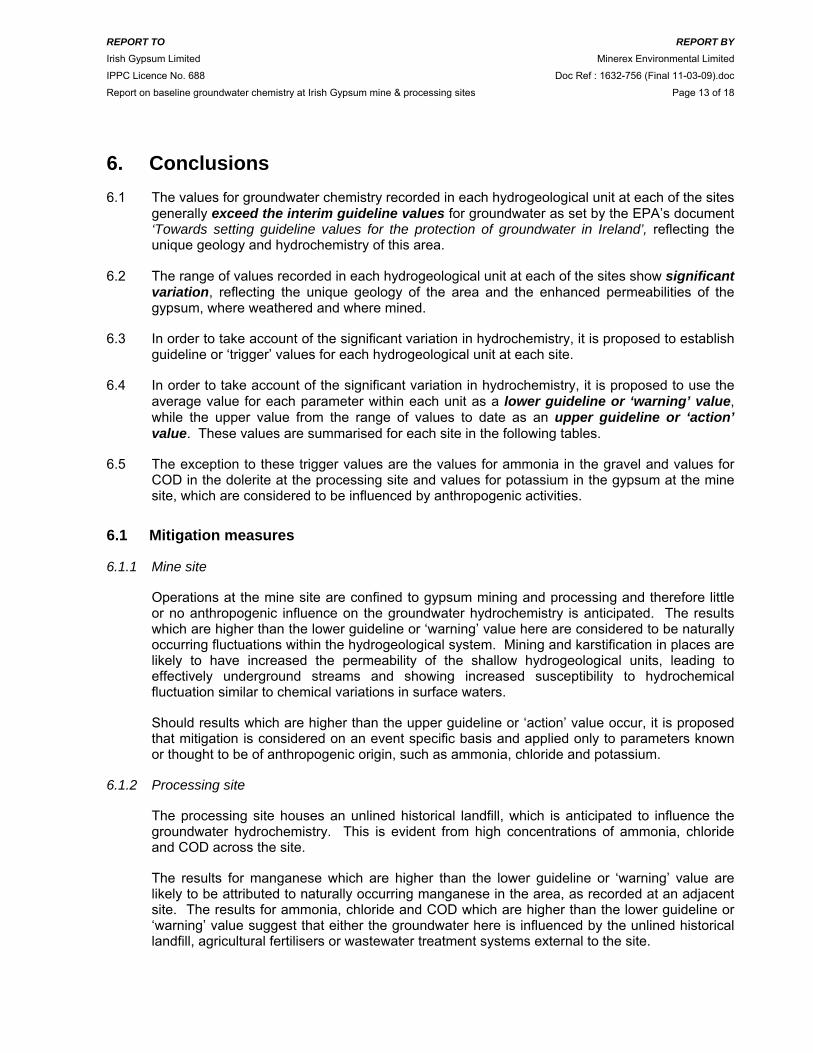
REPORT TO REPORT BYIrish Gypsum Limited Minerex Environmental Limited
IPPC Licence No. 688 Doc Ref : 1632-756 (Final 11-03-09).doc
Report on baseline groundwater chemistry at Irish Gypsum mine & processing sites Page 13 of 18
6. Conclusions 6.1 The values for groundwater chemistry recorded in each hydrogeological unit at each of the sites
generally exceed the interim guideline values for groundwater as set by the EPA’s document ‘Towards setting guideline values for the protection of groundwater in Ireland’, reflecting the unique geology and hydrochemistry of this area.
6.2 The range of values recorded in each hydrogeological unit at each of the sites show significant variation, reflecting the unique geology of the area and the enhanced permeabilities of the gypsum, where weathered and where mined.
6.3 In order to take account of the significant variation in hydrochemistry, it is proposed to establish guideline or ‘trigger’ values for each hydrogeological unit at each site.
6.4 In order to take account of the significant variation in hydrochemistry, it is proposed to use the average value for each parameter within each unit as a lower guideline or ‘warning’ value, while the upper value from the range of values to date as an upper guideline or ‘action’ value. These values are summarised for each site in the following tables.
6.5 The exception to these trigger values are the values for ammonia in the gravel and values for COD in the dolerite at the processing site and values for potassium in the gypsum at the mine site, which are considered to be influenced by anthropogenic activities.
6.1 Mitigation measures
6.1.1 Mine site
Operations at the mine site are confined to gypsum mining and processing and therefore little or no anthropogenic influence on the groundwater hydrochemistry is anticipated. The results which are higher than the lower guideline or ‘warning’ value here are considered to be naturally occurring fluctuations within the hydrogeological system. Mining and karstification in places are likely to have increased the permeability of the shallow hydrogeological units, leading to effectively underground streams and showing increased susceptibility to hydrochemical fluctuation similar to chemical variations in surface waters.
Should results which are higher than the upper guideline or ‘action’ value occur, it is proposed that mitigation is considered on an event specific basis and applied only to parameters known or thought to be of anthropogenic origin, such as ammonia, chloride and potassium.
6.1.2 Processing site
The processing site houses an unlined historical landfill, which is anticipated to influence the groundwater hydrochemistry. This is evident from high concentrations of ammonia, chloride and COD across the site.
The results for manganese which are higher than the lower guideline or ‘warning’ value are likely to be attributed to naturally occurring manganese in the area, as recorded at an adjacent site. The results for ammonia, chloride and COD which are higher than the lower guideline or ‘warning’ value suggest that either the groundwater here is influenced by the unlined historical landfill, agricultural fertilisers or wastewater treatment systems external to the site.

REPORT TO REPORT BYIrish Gypsum Limited Minerex Environmental Limited
IPPC Licence No. 688 Doc Ref : 1632-756 (Final 11-03-09).doc
Report on baseline groundwater chemistry at Irish Gypsum mine & processing sites Page 14 of 18
Should results which are higher than the upper guideline or ‘action’ value occur, it is proposed that mitigation is considered on an event specific basis and applied only to parameters known or thought to be of anthropogenic origin, such as ammonia, chloride and COD.

REPORT TO REPORT BYIrish Gypsum Limited Minerex Environmental Limited
IPPC Licence No. 688 Doc Ref : 1632-756 (Final 11-03-09).doc
Report on baseline groundwater chemistry at Irish Gypsum mine & processing sites Page 15 of 18
Mine Site Overburden Gypsum Dolerite Mudstone Namurian/ Westphalian
Comparison
MW2–P1 01JP-S 01JP-D MW1-P3 MW3-P1 MW5-P2 MW1-P1 MW3-P2 MW6-P1 M102PA MW4-P1 95A1-D
Monitoring points
MW5-P1
Interim guideline values for groundwater chemistry (EPA, 2004)
Parameter Lower Upper Lower Upper Lower Upper Lower Upper Lower Upper IGV Unit Alkalinity 214 466 666 3,000 188 1,000 304 1,190 168 538 No
abnormal change
mg/l
Calcium 212 529 673 1,252 301 574 405 1,081 351 864 200 mg/l Chloride 22 53 25 70 21 54 50 378 26 164 30 mg/l Magnesium 50 100 52 148 35 85 45 167 57 284 50 mg/l Potassium 4.3 9 32 162 12 116 12 55 9 69 5 mg/l Sodium 50 96 122 296 83 625 122 693 57 168 150 mg/l Sulphate 504 1,775 1,164 3,197 962 3,459 1,224 4,288 1,018 2,533 200 mg/l Conductivity 1,299 2,231 3,748 11,638 1,716 3,478 2,451 5,483 1,562 3,186 1,000 uS/cm pH 7.0 8.9 9 13.8 8.5 13.3 9.2 13.8 7 8 ≥6.5, ≤9.5 pH
Table 1 Summary of lower and upper trigger values for each hydrogeological unit at Mine Site
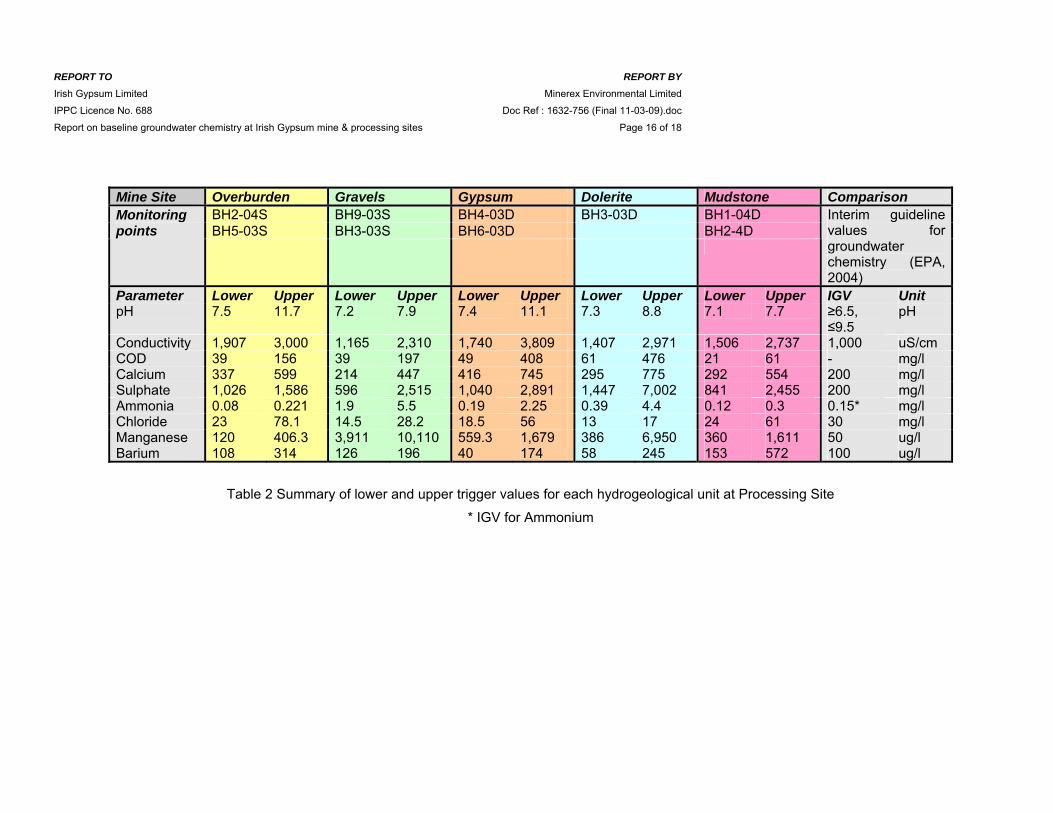
REPORT TO REPORT BYIrish Gypsum Limited Minerex Environmental Limited
IPPC Licence No. 688 Doc Ref : 1632-756 (Final 11-03-09).doc
Report on baseline groundwater chemistry at Irish Gypsum mine & processing sites Page 16 of 18
Mine Site Overburden Gravels Gypsum Dolerite Mudstone Comparison BH2-04S BH9-03S BH4-03D BH3-03D BH1-04D BH5-03S BH3-03S BH6-03D BH2-4D
Monitoring points
Interim guideline values for groundwater chemistry (EPA, 2004)
Parameter Lower Upper Lower Upper Lower Upper Lower Upper Lower Upper IGV Unit pH 7.5 11.7 7.2
7.9 7.4 11.1 7.3 8.8 7.1 7.7 ≥6.5,
≤9.5 pH
Conductivity 1,907 3,000 1,165 2,310 1,740 3,809 1,407 2,971 1,506 2,737 1,000 uS/cm COD 39 156 39 197 49 408 61 476 21 61 - mg/l Calcium 337 599 214 447 416 745 295 775 292 554 200 mg/l Sulphate 1,026 1,586 596 2,515 1,040 2,891 1,447 7,002 841 2,455 200 mg/l Ammonia 0.08 0.221 1.9 5.5 0.19 2.25 0.39 4.4 0.12 0.3 0.15* mg/l Chloride 23 78.1 14.5 28.2 18.5 56 13 17 24 61 30 mg/l Manganese 120 406.3 3,911 10,110 559.3 1,679 386 6,950 360 1,611 50 ug/l Barium 108 314 126 196 40 174 58 245 153 572 100 ug/l
Table 2 Summary of lower and upper trigger values for each hydrogeological unit at Processing Site
* IGV for Ammonium

REPORT TO REPORT BYIrish Gypsum Limited Minerex Environmental Limited
IPPC Licence No. 688 Doc Ref : 1632-756 (Final 11-03-09).doc
Report on baseline groundwater chemistry at Irish Gypsum mine & processing sites Page 17 of 18
7. References
No. Description Minerex Doc. Ref.
1. IPPC Licence No. 668/ P0519-02 (2005) Environmental Protection Agency.
1632-260
2 Environmental Protection Agency (2004) Towards setting guideline values for the protection of groundwater in Ireland.
F827
3 EPA correspondence referenced P0519-02/nc11NH & dated 28/08/07 1632-746 4. Minerex Environmental Limited (2005) Report on baseline groundwater
hydraulics and hydrochemistry 1632-319
5. www.gsi.ie Geological Survey of Ireland 6. McConnell, B., Philcox, M. & Geraghty, M. (2001) Geology of Meath,
Geological Survey of Ireland. M148
7. Gardiner, P.R.R. & McArdle, P. (1992) The geological setting of Permian gypsum and anhydrite deposits in the Kingscourt district, Counties Cavan, Meath & Monaghan. The Irish Minerals Industry.
1632-033
8. Bord na Mona (2003) A hydrogeological investigation of the Gypsum Industries Ltd. Facility at Kingscourt, Co. Cavan
1632-453
9. Irish Gypsum Limited (2002) An assessment of the impact of mine flooding on the long term stability of Drummond Mine – Appendix 13 in Irish Gypsum Limited (2004) Response to request for additional information
1632-668
10. www.wfdireland.ie Water Framework Directive, Ireland
11. Working Group on Groundwater (2004) The calcareous/ non-calcareous classification of bedrock aquifers in the Republic of Ireland
F980
12. http://www.inchem.org/documents/ehc/ehc/ehc107.htm#SectionNumber:3.1
13. www.bgs.ac.uk British Geological Survey website

REPORT TO REPORT BYIrish Gypsum Limited Minerex Environmental Limited
IPPC Licence No. 688 Doc Ref MEL1632-756 (Final 11-03-09).doc
Report on baseline groundwater chemistry at Irish Gypsum mine & processing sites
Appendix A

Geological positions of groundwater monitoring points at mine site
Geological periods
Kin
gsco
urt S
ands
tone
Fo
rmat
ion
Kin
gsco
urt G
ypsu
m
Form
atio
nW
estp
halia
n (U
ndiff
eren
tiate
d)
Siltstone member80-100m
Upper Mudstone Member26-35m
Upper Gypsum Member6 -10m thick
Lower Gypsum Member20 -35m thick
Middle Mudstone Member6 –12m thick
Lower Mudstone MemberGreenish-grey overlain by laminated dark grey mudstones. 2 –25m thick
Conglomerate Member0 –18m
Nam
uria
n
TRIA
SSIC
PER
MIA
NC
AR
BO
NIF
ERO
US
Members and
thickness ranges
Representative Graphical log & hydrogeologial
unitFormations
Sandstone member
MW1-P3 MW3-P201JP-S 95A1-D01HP M101PM103P
Note:B
lockage at 87.5m –
perhaps broken of here
Notes:-- Screen length not to scale- Depths are from ground level- Not to scale
M102Pa
Overburden
Upper M
udstone, Upr G
ypsum & M
iddle Mudstone
Overburden
Overburden
4.3
1.395A1-S
23.5
22.5 10
03A-P2MW2-P1
94
85
34.5
28.5
Upr M
udstone 80
89
Upper M
udstone & Dolerite &
Upr G
ypsum
34.2
43.2
Upper G
ypsum & S
ome M
iddle Mudstone
MW1-P2
56
50
Dolerite & U
pper Gypsum
MW1-P1
77.6
71.6
Dolerite
03A-P1MW3-P1
21.5
Dolerite 88.5
85.5M
iddle Mudstone
49.2
Middle M
udstone
01JP-D
78
69
Dolerite & som
e Middle m
udstone
120
114
168.5
159.5
183
Note:B
reakage and gravel pack blockage at 107m
Nam
urian Sandstones &
Shales
Overburden
Dolerite
Westphalian S
hale, Lower
Mudstone &
Basal S
hales
Sources of information:- Gardiner & McArdle (1992)- Geology of Monaghan-Carlingford, GSI, 1997- GSI 1:100,00 Geology Sheets 13 & 8/9- Minerex field observations and Gypsum Industries Limited core logs
Dolerite(Lower Sill)
(Max 8m thick)
Dolerite ?
Position
uncertain
Dolerite
Dolerite
MW4-P2MW4-P1
70.058.4
99.090.6
M101PA
183
A
B
C
D
F
E
G
K
HI
J
Undifferentiated grey to black shale and carbonaceous or pyritous, thin bedded siltstones and fine grained standstones and minor thin beds of coal up to 1.5m thick. About 83m thick
Greyish-red mudstones with carbonate nodules, silty mudstones and thin fine grained standstones with ripple marks and desiccation cracks
L
M
Dolerite(Main Sill)
(Up to 60m thick)
160?
?
Nam
urian Sandstones &
Shales
Nam
urian Sandstones &
Shales
MW5-P1
38
20.3
Doleriate
8.15
Overburden
MW5-P2MW6-P1
48.49
66.31
Nam
urian Sandstones &
Shales
MW7-P1
Dolerite
67.7
82.2
Minerex File Ref.: 1632-024.ppt
Appendix A

REPORT TO REPORT BYIrish Gypsum Limited Minerex Environmental Limited
IPPC Licence No. 688 Doc Ref MEL1632-756 (Final 11-03-09).doc
Report on baseline groundwater chemistry at Irish Gypsum mine & processing sites
Appendix B

Kin
gsc
ourt
Fa
ult
=W
este
rnBo
und
ary
Fa
ult
Co
rme
yFa
ult
ORDOVICIAN- SILURIANRA - CASTLERAHAN FORMATION
Dark grey quartzite and microconglomerate
CARBONIFEROUSDINANTIAN
MNV-MILVERTON GROUPMicrite, crinoidal grainstone / packstone
TRIASSIC
KS - KINGSCOURT SANDSTONE FORMATION
Red sandstone
TRIASSIC
KS - KINGSCOURT SANDSTONE FORMATION
Red sandstone
PERMIAN
KS - KINGSCOURT
GYPSUM FORMATION
Mudstone with gypsum & anhydrite
PERMIAN
KS - KINGSCOURT
GYPSUM FORMATION
Mudstone with gypsum & anhydrite
CARBONIFEROUS
NAMURIAN
CB, CR, CG FORMATIONS
Sandstone & shales
CARBONIFEROUS
NAMURIAN
CB, CR, CG FORMATIONS
Sandstone & shales
CARBONIFEROUSDINANTIAN
FNG - FINGAL GROUP (Undifferentialted)Dark limestone, shale & micrite
DINANTIANMNV-MILVERTON GROUP
Micrite, crinoidal grainstone / packstone
ORDOVICIAN-SILURIANTM-TAGHART MOUNTAIN FORMATION
Greywacke, massive sandstone & siltstone
WESTPHALIAN - WESUndifferentiated
Grey shale, thin siltstone and sandstone
WESTPHALIAN - WESUndifferentiated
Grey shale, thin siltstone and sandstone
Extent of Kingscourt Outlier
M101P
MW 6
MW 4
MW 7
Drumgoosat
dewatering well
M103P
MW 1
MW 5
95-A1
MW 3
M101Pa
M102P
MW 2
507P
N (National Grid)
TP 4
214,000
197,500
D2
S1
250mdownstream
90
74.80
FG 5
D3-SW 1
PWS 3
SG 1
Iron Pan 1
Peat 1
Soil 2
Ag drain
Road runoffSW 1
Yard runoffSW 1
Drawing Ref.: 1632-008 (GEOLOGY).cdr
STATUS - UPDATED - JR 03/01/08
Common legend
Irish Gypsum Limited
Kingscourt, County Cavan
- Basemap courtesy of Ordnance Survey of Ireland
NOTES
D2
D1-SW 1
Tel 01-2964435, Fax 01-2964436, Email: [email protected]
Drumgoosat Mine
(decommissioned)
Drummond Underground Mine
(under construction)
Approximate extent of
Knocknacran open pit
(in production)
Mw6
Mapped geological faults
N (National Grid)N (National Grid)
Groundwater monitoring point
Appendix B
Bedrock geology &
groundwater monitoring points
Kingscourt Outlier

REPORT TO REPORT BYIrish Gypsum Limited Minerex Environmental Limited
IPPC Licence No. 688 Doc Ref MEL1632-756 (Final 11-03-09).doc
Report on baseline groundwater chemistry at Irish Gypsum mine & processing sites
Appendix C
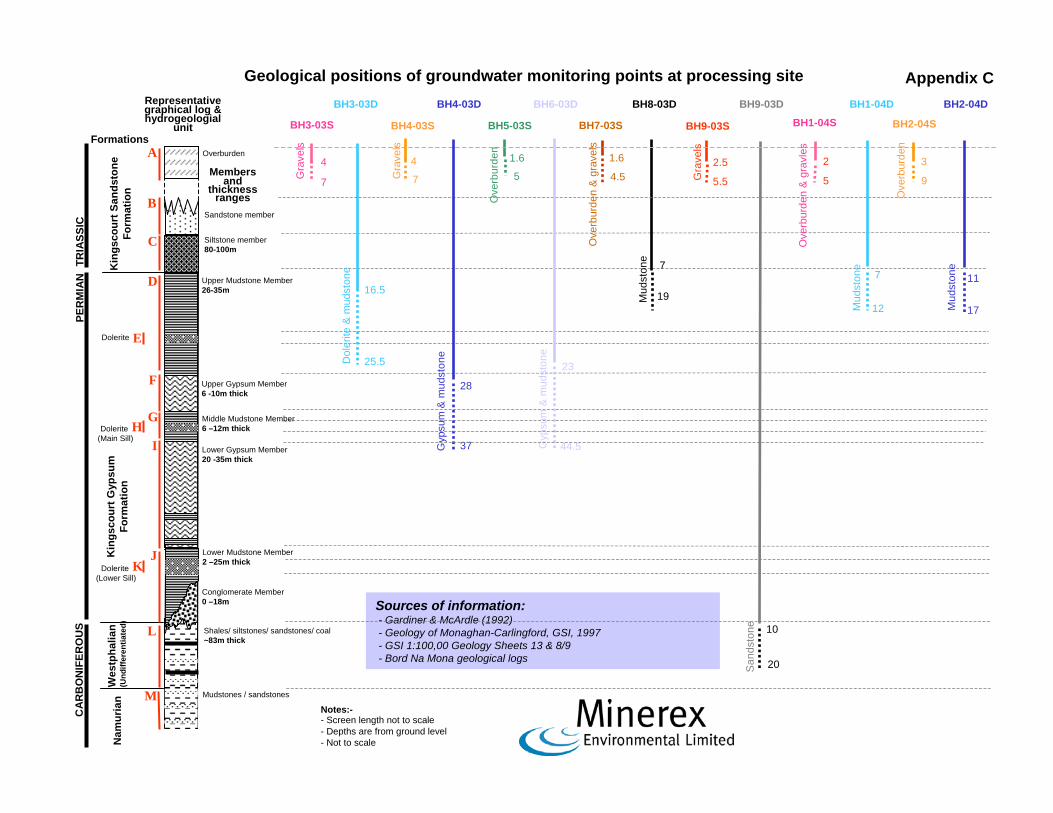
Geological positions of groundwater monitoring points at processing site
7
4
BH3-03D
BH3-03S
Sources of information:- Gardiner & McArdle (1992)- Geology of Monaghan-Carlingford, GSI, 1997- GSI 1:100,00 Geology Sheets 13 & 8/9- Bord Na Mona geological logs
16.5
25.5
4
7
BH4-03S
Gra
vels
Dol
erite
& m
udst
one
Gra
vels
BH4-03D
28
37Gyp
sum
& m
udst
one
1.6
5
BH5-03S
23
44.5
Ove
rbur
den
Gyp
sum
& m
udst
one
BH6-03D
BH7-03S
1.6
4.5
Ove
rbur
den
& g
rave
ls
BH8-03D
7
19Mud
ston
e
BH9-03S
2.5
5.5Gra
vels
BH9-03D
San
dsto
ne 10
20
BH1-04S
2
5
Ove
rbur
den
& g
ravl
es
BH1-04D
7
12Mud
ston
e
BH2-04S
Ove
rbur
den
3
9
BH2-04D
Mud
ston
e
11
17
Kin
gsco
urt S
ands
tone
Fo
rmat
ion
Kin
gsco
urt G
ypsu
m
Form
atio
nW
estp
halia
n (U
ndiff
eren
tiate
d)
Siltstone member80-100m
Upper Mudstone Member26-35m
Upper Gypsum Member6 -10m thick
Lower Gypsum Member20 -35m thick
Middle Mudstone Member6 –12m thick
Lower Mudstone Member2 –25m thick
Conglomerate Member0 –18m
Nam
uria
n
TRIA
SSIC
PER
MIA
NC
AR
BO
NIF
ERO
US
Members and
thickness ranges
Representative graphical log & hydrogeologial
unitFormations
Sandstone member
Overburden
Dolerite
Dolerite(Lower Sill)
A
B
C
D
F
E
G
K
HI
J
Shales/ siltstones/ sandstones/ coal ~83m thick
Mudstones / sandstones
L
M
Dolerite(Main Sill)
Appendix C
Notes:-- Screen length not to scale- Depths are from ground level- Not to scale

REPORT TO REPORT BYIrish Gypsum Limited Minerex Environmental Limited
IPPC Licence No. 688 Doc Ref MEL1632-756 (Final 11-03-09).doc
Report on baseline groundwater chemistry at Irish Gypsum mine & processing sites
Appendix D

Clontail Formation
Calcareous red-mica greywacke
Silurian age
Kingscourt Sandstone Formation
Red sandstone
Triassic age
Westphalian (undifferentiated)
Grey shale, thin siltstone & sandstone
Westphalian age
Kingscourt Gypsum Formation
Mudstone with gypsum & anhydrite
Permian age
Fingal Group (undifferentiated)
Dark limestone, shale & micrite
Carboniferous age
Kin
gsc
ourt
Fa
ult
BH03-03S
BH03-03D
BH09-03D
BH09-03S
BH04-03D95A
BH04-03S
96ABH05-03S
BH06-03D
Malone’s Well
BH07-03S
BH06-01D
BH02-03S
BH01-03S
N (National Grid)
TP 4
214,000
197,500
D2
S1
250mdownstream
90
74.80
FG 5
D3-SW 1
PWS 3
SG 1
Iron Pan 1
Peat 1
Soil 2
Ag drain
Road runoffSW 1
Yard runoffSW 1
Drawing Ref.: 1632-008
(PROCESSING SITE) (GEOLOGY).cdr
STATUS - UPDATED - JR 06/02/08
Common legend
Irish Gypsum Limited
Kingscourt, County Cavan
- Basemap courtesy of Ordnance Survey of Ireland
NOTES
D2
D1-SW 1
Tel 01-2964435, Fax 01-2964436, Email: [email protected]
Mw6
Mapped geological faults
N (National Grid)N (National Grid)
Groundwater monitoring point
Appendix D
Bedrock geology &
groundwater monitoring points

REPORT TO REPORT BYIrish Gypsum Limited Minerex Environmental Limited
IPPC Licence No. 688 Doc Ref MEL1632-756 (Final 11-03-09).doc
Report on baseline groundwater chemistry at Irish Gypsum mine & processing sites
Appendix E

Appendix E
Parameter/ substance
Results
Geo
logy Dolerite
in Lower Mudst.
Dolerite in Mid Mudst.
Dolerite in Mid Mudst.
Dolerite in Mid. Mudst.
Lower Mudst.
Mid Mudst.
Mid Mudst.
Mid. Mudst.
Upper Mudst.
Upper Mudst.
Upper Mudst.
Upper Mudst.
Upper Mudst. O/B O/B O/B O/B
Upper Gypsum
Upper Gypsum
Upper Gypsum
Namurian/ Westphalian
Namurian/ Westphalian
MW
4-P1
Dee
p
MW
1-P1
MW
5-P1
01JP
-D
M10
1PA
MW
7-P1
95A
1-D
MW
3-P2
D01
HP
MW
1-P3
03A
-P1
95A
2
M10
1P
M10
2PA
MW
2-P1
MW
4-P2
Sh
allo
w
MW
5-P2
03A
-P2
01JP
-S
MW
1-P2
MW
6-P1
MW
3-P1
Uni
ts
Mon
th/
year
Alkalinity - total mg/l CaCO3 Nov-03 MEL 170 190 1190 140 50 180 NDP 70 380 340 100 230 130 130Calcium - dissolved mg/l Ca Nov-03 MEL 446.8 574 486.4 470.9 76.69 457 479.6 264.1 160 180.8 675.1 599.3 284.6 412.6Chloride - dissolved mg/l Cl Nov-03 MEL 17 14 16 20 56 76 65 12 15 53 21 24 16 19Electrical conductivity uS/cm Nov-03 MEL 2310 2370 2290 2390 958 3390 2470 1471 1430 1363 2380 3000 1785 2390Electrical conductivity uS/cm Nov-03 MEL 2265 2485 4992 2280 977 3249 2721 1536 1500 1331 2494 2993 1719 2264Electrical conductivity (Lab value minus field uS/cm Nov-03 MEL -45 115 2702 -110 19 -141 251 65 70 -32 114 -7 -66 -126Electrical conductivity (Lab value minus field uS/cm Nov-03 MEL 45 115 2702 110 19 141 251 65 70 32 114 7 66 126Electrical conductivity (Percentage difference) uS/cm Nov-03 MEL 1.95% 4.85% 117.99% 4.60% 1.98% 4.16% 10.16% 4.42% 4.90% 2.35% 4.79% 0.23% 3.70% 5.27%Magnesium - dissolved mg/l Mg Nov-03 MEL 51.57 49.4 0.53 49.43 6.1 105.7 53.82 43.67 74.2 41.99 43.64 0.03 49 39.98Nitrate mg/l NO3 Nov-03 MEL <0.3 <0.3 <0.3 0.5 <0.3 4.3 <0.3 <0.3 <0.3 1.1 <0.3 <0.3 1.4 <0.3pH
punits pH units Nov-03 MEL 7.66 7.83 11.25 7.70 11.08 7.63 7.67 7.77 7.41 7.16 7.79 11.69 7.69 7.61
pHpunits pH units Nov-03 MEL 7.44 7.82 11.99 7.33 9.69 7.29 7.30 7.41 7.89 6.94 7.55 11.08 7.42 6.83
Potassium mg/l K Nov-03 MEL 5.6 11.8 13 6.8 11.8 10.4 18.6 4.4 8.4 4.2 12.4 74 10.8 5.8Sodium mg/l Na Nov-03 MEL 31.5 39.5 94 65 136 315 212 77 92 69 102 296 74 67Sulphate mg/l SO4 Nov-03 MEL 1466 1471 610 1550 355 2341 1431 772 521 456 1426 1488 1005 1586Total Dissolved Solids mg/l Solids Nov-03 MEL 2191 2757 1538 2210 557 3136 2285 1189 975 1072 2163 1953 1533 1299Temperature oC Degree C Nov-03 MEL 10.8 8.6 8.5 9.9 9.0 9.8 10.5 8.8 8.5 7.1 10.2 8.1 10.5 9.1Ionic balance % Nov-03 MEL 1.7 4.5 NP 7.7 5.6 14.1 12.5Ionic balance % Nov-03 MEL 9.3 0.9 6.4 7 3.7 8.5 NP 7.1 2.3 3.1 13.7 11.5 4 14Alkalinity - total mg/l CaCO3 Feb-05 MEL 160 360Calcium - dissolved mg/l Feb-05 MEL 145.9 405.2Chloride - dissolved mg/l Cl Feb-05 MEL 24 19Electrical conductivity uS/cm Feb-05 MEL 1216 2133Magnesium - dissolved mg/l Mg Feb-05 MEL 28.96 2.68Nitrate mg/l N Feb-05 MEL 1.3 <0.3pH Feb-05 MEL 8.02 11.6Potassium mg/l K Feb-05 MEL 7.8 108Sodium mg/l Na Feb-05 MEL 77 48Sulphate mg/l SO4 Feb-05 MEL 442 598Total Dissolved Solids mg/l Feb-05 MEL 848 1414Alkalinity - total mg/l CaCO3 May-05 QED 20 26 346 30 642 38 1092 48 20 316 10 56 56 28 16 1370 24 62Ammonia mg/l N May-05 QED 0.18 0.102 0.92 0.14 0.7 0.151 2 0.109 0.42 1.48 0.12 0.16 0.281 0.24 0.26 4.58 0.13 0.165Calcium - dissolved mg/l May-05 QED 171 554 530 175 461 1081 376 154 559 522 523 191 383 529 604 1016 600 864Chloride - dissolved mg/l Cl May-05 QED 22.9 22.3 26.4 22.7 85.6 24.7 16.2 2.68 378 30.5 13.8 15.8 42.5 24.3 69.5 10.8 20.8 30.7Electrical conductivity uS/cm May-05 QED 1082 1928 3426 1046 4815 2266 4716 453 3169 3329 2227 1275 1425 2159 2688 10036 2189 2342Magnesium - dissolved mg/l Mg May-05 QED 31 85 0.12 29 1.03 154 0.04 9.5 109 0.15 63 80 59 100 117 0.02 57 284Nitrate mg/l N May-05 QED <0.08 <0.05 0.36 <0.08 <0.08 <0.05 0.46 <0.05 <0.08 0.29 <0.08 <0.08 <0.05 <0.08 <0.08 0.12 <0.08 <0.05pH May-05 QED 7.71 7.49 12.91 7.88 13.39 7.4 7.84 8.2 7.69 12.82 8.61 7.84 6.27 8.89 7.75 13.82 7.52 7.52Potassium mg/l K May-05 QED 0.7 0.4 0.1 0.1 0.8 <0.1 <0.1 <0.1 0.4 0.1 0.1 0.1 0.6 0.1 0.6 0.6 0.5 0.7
Para
met
er
Rep
orte
d pa
ram
eter
Sam
ple
ID
Com
pany
taki
ng s
ampl
e
1632-010 (Mine GW Chemistry).xls 06/02/2009 Page 1 of 5

Appendix E
Parameter/ substance
Results
Geo
logy Dolerite
in Lower Mudst.
Dolerite in Mid Mudst.
Dolerite in Mid Mudst.
Dolerite in Mid. Mudst.
Lower Mudst.
Mid Mudst.
Mid Mudst.
Mid. Mudst.
Upper Mudst.
Upper Mudst.
Upper Mudst.
Upper Mudst.
Upper Mudst. O/B O/B O/B O/B
Upper Gypsum
Upper Gypsum
Upper Gypsum
Namurian/ Westphalian
Namurian/ Westphalian
MW
4-P1
Dee
p
MW
1-P1
MW
5-P1
01JP
-D
M10
1PA
MW
7-P1
95A
1-D
MW
3-P2
D01
HP
MW
1-P3
03A
-P1
95A
2
M10
1P
M10
2PA
MW
2-P1
MW
4-P2
Sh
allo
w
MW
5-P2
03A
-P2
01JP
-S
MW
1-P2
MW
6-P1
MW
3-P1
Uni
ts
Mon
th/
year
Para
met
er
Rep
orte
d pa
ram
eter
Sam
ple
ID
Com
pany
taki
ng s
ampl
e
Sodium mg/l Na May-05 QED 67 51 201 70 115 29 57 14 544 120 45 78 38 49 174 219 30 82Sulphate mg/l SO4 May-05 QED 336 708 2345 332 366 820 68 154 929 1615 729 390 438 706 910 14.2 706 818Alkalinity - total mg/l CaCO3 Nov-05 QED 140 60 112 1178 620 136 20 120 62 316 278 120 114 2024 148 112Ammonia mg/l N Nov-05 QED 0.09 <0.011 8.64 0.7 1.76 0.17 0.16 0.27 0.025 0.029 0.19 0.71 0.27 4.2 0.11 0.076Calcium - dissolved mg/l Nov-05 QED 128.8 444.4 514 708.3 546 635.1 147.7 683.5 563 167.2 354 451.2 638.7 1105 662.8 605.5Chloride - dissolved mg/l Cl Nov-05 QED 23.1 16.2 38.9 18.8 21.1 21.4 21.1 198 13.5 19.1 44.8 19.2 68.2 12.2 22.2 163.6Electrical conductivity uS/cm Nov-05 QED 1071 1739 3478 2310 2226 680 5483.3 2201 1345 1485 2231 3027 11638 2206 2410Magnesium - dissolved mg/l Mg Nov-05 QED 28.5 70 <0.05 0.5 47.2 50.7 20.5 166.8 69.2 88.7 70.2 89.7 148.1 <0.05 59.3 95.9Nitrate mg/l N Nov-05 QED <0.27 0.707 0.636 0.144 <0.27 0.588 0.742 0.367 0.117 0.036 0.575 <0.27 0.446 1.24 0.61 0.415pH Nov-05 QED 8.59 7.74 11.8 13.77 13.04 7.41 7.04 6.72 8.45 7.3 6.53 8.74 9.37 12.8 7.69 7.54Potassium mg/l K Nov-05 QED 4.8 19.9 32.5 100.5 54.8 4.9 6.8 22.4 3.5 5.6 3.2 8.5 8.3 162 4.5 7.4Sodium mg/l Na Nov-05 QED 74 38 460.9 107.8 63.5 29.7 17.1 692.7 50.7 73.5 35.8 57.9 229.4 159.8 28.1 96Sulphate mg/l SO4 Nov-05 QED 432 1618 3459 587 826 2160 24.8 3632 2803 506 395 1456 2473 53.8 2315 2533
1632-010 (Mine GW Chemistry).xls 06/02/2009 Page 2 of 5

Appendix E
Parameter/ substance
Results
Geo
logy Dolerite
in Lower Mudst.
Dolerite in Mid Mudst.
Dolerite in Mid Mudst.
Dolerite in Mid. Mudst.
Lower Mudst.
Mid Mudst.
Mid Mudst.
Mid. Mudst.
Upper Mudst.
Upper Mudst.
Upper Mudst.
Upper Mudst.
Upper Mudst. O/B O/B O/B O/B
Upper Gypsum
Upper Gypsum
Upper Gypsum
Namurian/ Westphalian
Namurian/ Westphalian
MW
4-P1
Dee
p
MW
1-P1
MW
5-P1
01JP
-D
M10
1PA
MW
7-P1
95A
1-D
MW
3-P2
D01
HP
MW
1-P3
03A
-P1
95A
2
M10
1P
M10
2PA
MW
2-P1
MW
4-P2
Sh
allo
w
MW
5-P2
03A
-P2
01JP
-S
MW
1-P2
MW
6-P1
MW
3-P1
Uni
ts
Mon
th/
year
Para
met
er
Rep
orte
d pa
ram
eter
Sam
ple
ID
Com
pany
taki
ng s
ampl
e
Alkalinity - total mg/l CaCO3 Jun-06 QED 40 90 202 780 590 150 570 64 100 90 304 200 32 200 136 2480 140 190 120Ammonia mg/l N Jun-06 QED 0.145 0.03 0.0143 0.432 0.708 0.11 0.731 0.037 0.227 0.0252 0.0863 0.607 0.136 0.0678 10.153 3.702 0.108 0.083 0.114Calcium - dissolved mg/l Jun-06 QED 304.6 327.2 100.4 309 461.2 476.1 366.3 442.1 432.9 524.3 154.4 189.7 392.9 48.1 482.4 814.3 467.7 63.9 437.6Chloride - dissolved mg/l Cl Jun-06 QED 53.9 11.4 24.1 10.8 10.9 16.6 14.5 33.3 319.9 13.7 15.6 41.6 12 10.6 17.4 9.2 16.5 12.6 28.7Electrical conductivity uS/cm Jun-06 QED 2003 1717 663 3277 1827 2077 2979 2349 4120 2320 1303 1177 1070 463 3375 9290 2051 520 2441Magnesium - dissolved mg/l Mg Jun-06 QED 65.9 57 20.4 0.13 0.6 48.3 152.4 96.9 95.9 60.2 71.9 36 61.6 5 108 <1 47.8 18.8 72.5Nitrate mg/l N Jun-06 QED 0.25 0.081 <0.054 3.272 0.655 <0.054 2.38 <0.054 0.17 <0.054 <0.054 0.122 0.477 0.242 0.196 4.225 0.134 0.477 0.055pH Jun-06 QED 6.81 7.66 7.06 13.24 9.4 7.77 11.1 6.67 6.58 8.42 7.21 5.93 6.76 6.69 6.67 12.52 7.65 6.72 7.58Potassium mg/l K Jun-06 QED 6.2 8.2 3.8 116.4 52 4 245.5 6.5 13.8 3.5 5.5 1 5.9 2.9 6.9 12.7 4 4.2 6Sodium mg/l Na Jun-06 QED 94.1 36.2 45.4 15.5 57 22.7 158.5 129.3 5.04.1 46.8 63.3 25.7 87.1 17.2 202.1 97.8 27.3 36.3 123.7Sulphate mg/l SO4 Jun-06 QED 2556.8 1509.3 166.2 2.3 792.2 2132.1 2905.1 2003.4 4027.7 2454.5 498.4 599.7 77.6 39.5 136 17.4 1967.6 1438.8 2415.8Alkalinity - total mg/l CaCO3 Oct-06 QED 30 70 200 82 40 110 100 68 276 80 24 150 150 1628 126 154 126Ammonia mg/l N Oct-06 QED 0.133 0.82 0.139 <0.0089 0.021 <0.0089 0.212 0.062 0.09 0.27 0.027 0.039 0.155 0.014 3.86 0.06 <0.0089Calcium - dissolved mg/l Oct-06 QED 351 423 53.55 574 181 838 408.9 462 145.4 240 367 76.26 453.8 766 762 59.62 837Chloride - dissolved mg/l Cl Oct-06 QED 51.3 6.59 9.81 21.9 12.8 11.5 301 10.6 15.2 14.3 45.2 21.8 54 5.29 1.84 13.8 6.59Electrical conductivity uS/cm Oct-06 QED 2917 1656 382 2700 991 2120 3950 2170 1171 1168 1838 550 3890 8110 2080 406 2080Magnesium - dissolved mg/l Mg Oct-06 QED 73.92 51.95 16.27 0.21 22.02 37.57 80.63 52.58 65.34 34.46 56.08 19.29 92.18 <0.1 45.31 19.98 46.36Nitrate mg/l N Oct-06 QED 0.81 0.74 0.254 0.195 0.22 0.37 <0.125 <0.125 <0.125 0.243 0.73 0.125 <0.125 0.784 0.464 0.156 0.403pH Oct-06 QED 7.9 7.9 8.1 10.9 7.8 7.8 7.9 7.7 7.9 6.2 8 8.1 7.5 12.3 7.9 8 7.5Potassium mg/l K Oct-06 QED 7 9.74 3.06 28.46 11.6 4.93 15.33 4.39 6.45 1.31 7.11 3.41 7.27 93.35 4.85 3.754 5.03Sodium mg/l Na Oct-06 QED 94.12 30.05 27.15 625.3 23.66 26.36 442 46.58 60.85 23.23 95.96 32.91 197.7 65.68 21.32 24.1 22.19Sulphate mg/l SO4 Oct-06 QED 2756 1159 21.7 1686 419 1594 2666 1331 426 626 1775 105 2092 7.06 1511 74.3 837Alkalinity - total mg/l CaCO3 May-07 QED 124 216 1000 162 166 122 144 694 414 328 24 466 130 3000 110 184 90Ammonia mg/l N May-07 QED 0.351 0.044 0.344 0.394 0.268 0.158 0.242 0.338 0.091 0.247 0.493 0.064 0.151 3.87 0.096 0.094 0.102Calcium - dissolved mg/l May-07 QED 115 481.5 74 171.7 126.7 542.8 475.8 494 166.6 260.1 331.2 61.32 493.7 817.6 565.7 81.61 472Chloride - dissolved mg/l Cl May-07 QED 20.594 12.432 9.483 9.318 9.454 16.636 257.2 9.242 13.779 33.108 15.438 9.608 63.359 9.668 15.586 12.949 14.278Electrical conductivity uS/cm May-07 QED 957 679 3277 989 1107 2839 4170 3650 1954 1149 1941 641 2970 2211 2743 862 3055Magnesium - dissolved mg/l Mg May-07 QED 26 28.7 <3 24.9 55.7 39.9 103.3 5.5 76.8 47.6 64.6 14.6 114.4 <3 61.2 21.1 64.5Nitrate mg/l N May-07 QED <0.125 <0.125 0.1 0.963 <0.125 <0.125 <0.125 <0.125 <0.125 <0.125 <0.125 0.152 <0.125 0.41 <0.125 <0.125 <0.125pH May-07 QED 6.21 6.79 13.24 7.4 6.96 6.09 6.84 11.9 6.68 6.06 5.77 5.7 6.96 12.12 5.94 7.46 6.58Potassium mg/l K May-07 QED 4.4 4.8 13.9 4.2 6.8 5.6 18.3 9.5 6.9 3.4 6.1 2.5 8.4 146.8 6 4.3 7Sodium mg/l Na May-07 QED 66.7 30.9 14.2 21.1 34.7 25.2 510.1 45.5 70 25.5 85.3 34.3 191.6 116.1 26.9 33.6 51.8Sulphate mg/l SO4 May-07 QED 1526.1 91.8 15.8 471 494.3 2173.4 4288.4 825.2 634.2 542.5 1526.1 23.9 3197.4 30.8 1828.6 96 2282.8Alkalinity - total mg/l CaCO3 Apr-08 QED 154 316 110 72 280 260 250 220 1820 100Ammonia mg/l N Apr-08 QEDCalcium - dissolved mg/l Apr-08 QED 366.7 109.7 490.4 171.2 171.2 223.4 118.8 53.8 861.3 642.5Chloride - dissolved mg/l Cl Apr-08 QED 17.8 10.3 17.3 48.8 14.6 39.3 21.1 11.8 10.6 14.6Electrical conductivity uS/cm Apr-08 QED 640 2638 2221 2323 1643 1389 1939 798 1997 3186Magnesium - dissolved mg/l Mg Apr-08 QED 25.4 <0.3 47.3 116.3 71.9 32.1 24.6 15 <0.3 64.6Nitrate mg/l N Apr-08 QEDpH Apr-08 QED 7.03 10.6 7.18 6.86 6.9 6.56 12.03 6.22Potassium mg/l K Apr-08 QED 2.8 12.9 4.5 6 6.2 1.3 4.7 1.8 155.5 69Sodium mg/l Na Apr-08 QED 16.5 15.1 33.1 123.2 62.7 22.1 55.7 18.5 147.9 56
1632-010 (Mine GW Chemistry).xls 06/02/2009 Page 3 of 5

Appendix E
Parameter/ substance
Results
Geo
logy Dolerite
in Lower Mudst.
Dolerite in Mid Mudst.
Dolerite in Mid Mudst.
Dolerite in Mid. Mudst.
Lower Mudst.
Mid Mudst.
Mid Mudst.
Mid. Mudst.
Upper Mudst.
Upper Mudst.
Upper Mudst.
Upper Mudst.
Upper Mudst. O/B O/B O/B O/B
Upper Gypsum
Upper Gypsum
Upper Gypsum
Namurian/ Westphalian
Namurian/ Westphalian
MW
4-P1
Dee
p
MW
1-P1
MW
5-P1
01JP
-D
M10
1PA
MW
7-P1
95A
1-D
MW
3-P2
D01
HP
MW
1-P3
03A
-P1
95A
2
M10
1P
M10
2PA
MW
2-P1
MW
4-P2
Sh
allo
w
MW
5-P2
03A
-P2
01JP
-S
MW
1-P2
MW
6-P1
MW
3-P1
Uni
ts
Mon
th/
year
Para
met
er
Rep
orte
d pa
ram
eter
Sam
ple
ID
Com
pany
taki
ng s
ampl
e
Sulphate mg/l Na Apr-08 QED 94.3 12.3 838 867 438 389 259 17.1 6.17 825Alkalinity - total mg/l CaCO3 Sep-08 QED 131 392 356 31 273 410 45 207 1660 538Ammonia mg/l N Sep-08 QEDCalcium - dissolved mg/l Sep-08 QED 32.9 159.8 793.1 20 140.3 254.2 341 76.9 1252 802.7Chloride - dissolved mg/l Cl Sep-08 QED 36.1 12.1 29.9 <2.6 13.4 27.6 15.2 8.68 9.6 25.7Electrical conductivity uS/cm Sep-08 QED 486 1758 2144 1410 1241 1325 1979 424 >3999 2587Magnesium - dissolved mg/l Mg Sep-08 QED 10.2 <0.3 54.9 1.7 64.4 43.9 65.8 20.1 <0.3 80.7Nitrate mg/l N Sep-08 QEDpH Sep-08 QED 8.36 12.78 7.24 8.83 7.6 6.47 7.8 7.89 13.23 7.7Potassium mg/l K Sep-08 QED 3.2 17.4 7.8 3.6 9 2.3 7.2 2.4 29.2 12.1Sodium mg/l Na Sep-08 QED 73.8 25.4 114.5 11.3 65.9 23.2 81.3 14.7 72.6 168.1
higher than lower guideline value
1632-010 (Mine GW Chemistry).xls 06/02/2009 Page 4 of 5
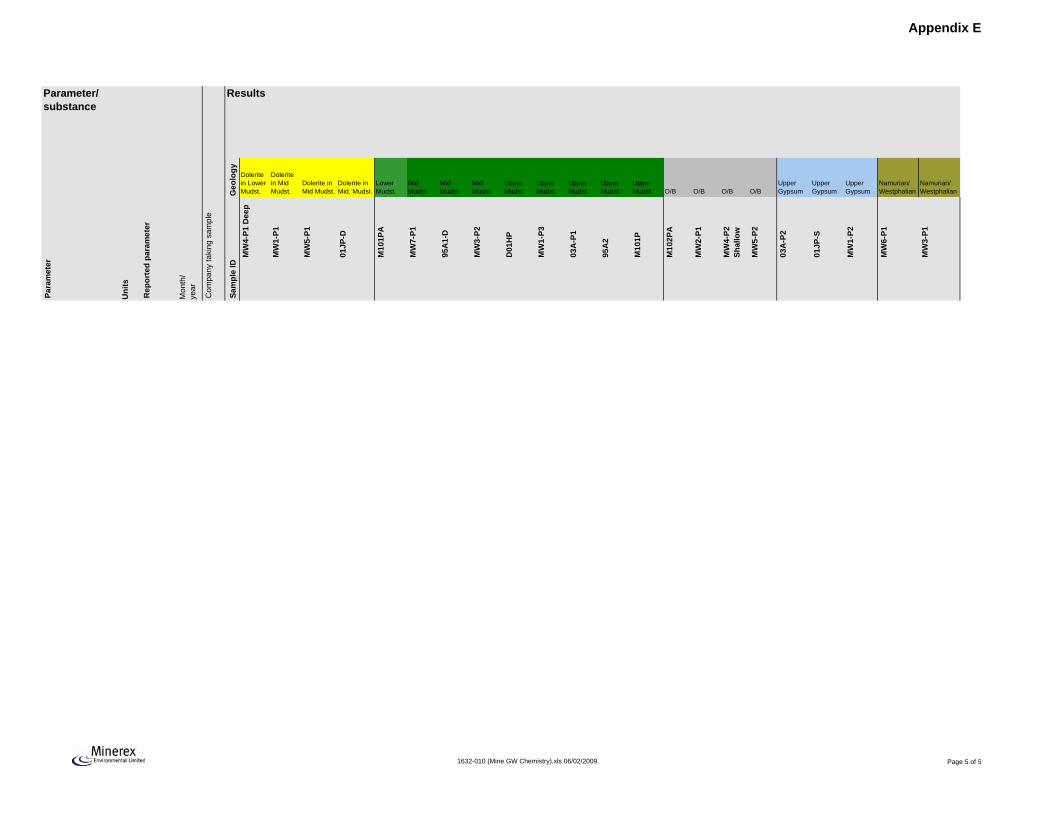
Appendix E
Parameter/ substance
Results
Geo
logy Dolerite
in Lower Mudst.
Dolerite in Mid Mudst.
Dolerite in Mid Mudst.
Dolerite in Mid. Mudst.
Lower Mudst.
Mid Mudst.
Mid Mudst.
Mid. Mudst.
Upper Mudst.
Upper Mudst.
Upper Mudst.
Upper Mudst.
Upper Mudst. O/B O/B O/B O/B
Upper Gypsum
Upper Gypsum
Upper Gypsum
Namurian/ Westphalian
Namurian/ Westphalian
MW
4-P1
Dee
p
MW
1-P1
MW
5-P1
01JP
-D
M10
1PA
MW
7-P1
95A
1-D
MW
3-P2
D01
HP
MW
1-P3
03A
-P1
95A
2
M10
1P
M10
2PA
MW
2-P1
MW
4-P2
Sh
allo
w
MW
5-P2
03A
-P2
01JP
-S
MW
1-P2
MW
6-P1
MW
3-P1
Uni
ts
Mon
th/
year
Para
met
er
Rep
orte
d pa
ram
eter
Sam
ple
ID
Com
pany
taki
ng s
ampl
e
1632-010 (Mine GW Chemistry).xls 06/02/2009 Page 5 of 5

REPORT TO REPORT BYIrish Gypsum Limited Minerex Environmental Limited
IPPC Licence No. 688 Doc Ref MEL1632-756 (Final 11-03-09).doc
Report on baseline groundwater chemistry at Irish Gypsum mine & processing sites
Appendix F

Appendix F
Geo
logy
O/B
O/B
Gra
vels
Gra
vels
Dol
erite
Gyp
sum
&
mud
ston
e
Gyp
sum
&
mud
ston
e
Mud
ston
e
Mud
ston
e
Wes
tpha
lian
Para
met
er
Uni
ts
Mon
th
sam
pled
Alkalinity - total mg/l Dec-03 MEL 230 130 70 170 50 190 340 140 130Calcium - dissolved mg/l Dec-03 MEL 599.3 412.6 264.1 446.8 76.69 574 180.8 470.9 284.6Chloride - dissolved mg/l Dec-03 MEL 24 19 12 17 56 14 53 20 16Electrical conductivity uS/cm Dec-03 MEL 3000 2390 1471 2310 958 2370 1363 2390 1785Magnesium - dissolved mg/l Mg Dec-03 MEL 0.03 39.98 43.67 51.57 6.1 49.4 41.99 49.43 49Nitrate mg/l NO3 Dec-03 MEL <0.3 <0.3 <0.3 <0.3 <0.3 <0.3 1.1 0.5 1.4pH units pH units Dec-03 MEL 11.69 7.61 7.77 7.66 11.08 7.83 7.16 7.70 7.69pH units pH units Dec-03 MEL 11.08 6.83 7.41 7.44 9.69 7.82 6.94 7.33 7.42Potassium mg/l K Dec-03 MEL 74 5.8 4.4 5.6 11.8 11.8 4.2 6.8 10.8Sodium mg/l Na Dec-03 MEL 296 67 77 31.5 136 39.5 69 65 74Sulphate mg/l SO4 Dec-03 MEL 1488 1586 772 1466 355 1471 456 1550 1005(dissolved) mg/l Solids Dec-03 MEL 1953 1299 1189 2191 557 2757 1072 2210 1533pH pH Aug-03 BNM 7.06 7.05 6.96 7.05 7.36 7.18 7.61Electrical conductivity uS/cm Aug-03 BNM 1463 1503 372 910 372 1830 485Temperature oC Aug-03 BNM 15.2 14.4 14.1 14.4 14.5 14.2 14Ammonia mg/l NH3-N Aug-03 BNM <0.2 3.8 <0.2 <0.2 0.3 <0.2 <0.2Chloride - dissolved mg/l Aug-03 BNM 34 10 11 17 16 14 14Nitrite mg/l N Aug-03 BNM <0.02 <0.02 <0.02 0.02 <0.02 0.02 <0.02Ortho-Phospate mg/l P Aug-03 BNM <0.02 <0.02 <0.02 <0.02 <0.02 <0.02 <0.02Sulphate mg/l Aug-03 BNM 800 2100 76 76 1800 950 111Nitrate mg/l N Aug-03 BNM 0.89 <0.2 0.81 0.2 <0.2 0.22 1.14TOC ug/l Aug-03 BNM <250 5 <5 <250 14 <5Calcium - dissolved mg/l Aug-03 BNM 258 461 58 58 463 446 80Sodium mg/l Aug-03 BNM 38 40 8.6 17 60 12 12Magnesium - dissolved mg/l Aug-03 BNM 40 144 8.7 14 94 43 7.7Potassium mg/l Aug-03 BNM 4 8.2 1.4 4.4 11 4.9 2.8Chromium ug/l Aug-03 BNM <2 <2 <2 <2 <2 <2 <2Manganese - dissolved ug/l Aug-03 BNM 14 81 2 88 97 516 45Nickel ug/l Aug-03 BNM 4 <2 <2 26 2 4 <2Copper ug/l Aug-03 BNM 6 2 <2 7 2 <2 2Zinc ug/l Aug-03 BNM 81 17 42 95 55 87 34Aresnic ug/l Aug-03 BNM 4 <2 <2 2 <2 <2 <2Cadmium ug/l Aug-03 BNM <2 <2 <2 <2 <2 <2 <2Barium - dissolved ug/l Aug-03 BNM 136 94 110 112 64 110 98Lead ug/l Aug-03 BNM <2 <2 <2 2 <2 6 <2Iron mg/l Aug-03 BNM 0.6 1.3 0.1 0.2 1.3 1.1 0.2Boron ug/l Aug-03 BNM 203 462 118 59 598 209 187Mercury ug/l Aug-03 BNM <1 <1 <1 <1 <1 <1 <1pH uS/cm Jan-04 QED 6.9 6.72 7.76 7.73 7.39 7.6 7.6 7.7 7.45Electrical conductivity mg/l Jan-04 QED 1110 1055 331 321 574 903 1024 721 505Temperature mg/l Jan-04 QED 10.3 9.6 10.3 10 9.6 9.1 10.5 9.5 9.7Ammonia mg/l NH3-N Jan-04 QED 0.02 3.8 0.06 0.05 0.26 0.3 0.11 0.05 <0.2Chloride - dissolved mg/l Jan-04 QED 25 10 14 15 16 11 16 61.3 6.8Sulphate mg/l Jan-04 QED 458.4 511 74.7 79 1659 524 1125 116.7 43.5Calcium - dissolved mg/l Jan-04 QED 361 426 59 52 745 70 554 75 49Magnesium - dissolved mg/l Jan-04 QED 42 33 10 14 88 32 39 17 8.5
Com
pany
taki
ng s
ampl
e
Rep
orte
d pa
ram
eter
BH
6-03
D
BH
3-03
S
BH
9-03
S
BH
3-03
D
Sam
ple
ID
BH
9-03
D
BH
5-03
S
BH
2-04
S
BH
4-03
D
BH
2-04
D
BH
1-04
D
1632-010 (Processing Site GW Chemistry) 06/02/2008 Page 1 of 3

Appendix F
Geo
logy
O/B
O/B
Gra
vels
Gra
vels
Dol
erite
Gyp
sum
&
mud
ston
e
Gyp
sum
&
mud
ston
e
Mud
ston
e
Mud
ston
e
Wes
tpha
lian
Para
met
er
Uni
ts
Mon
th
sam
pled
Com
pany
taki
ng s
ampl
e
Rep
orte
d pa
ram
eter
BH
6-03
D
BH
3-03
S
BH
9-03
S
BH
3-03
D
Sam
ple
ID
BH
9-03
D
BH
5-03
S
BH
2-04
S
BH
4-03
D
BH
2-04
D
BH
1-04
D
Potassium mg/l Jan-04 QED 2.8 4.7 3 4 9.3 2.8 5.3 1.3 1..4Chromium ug/l Jan-04 QED <2 <2 <2 <2 <2 <2 <2 <2 <2Manganese - dissolved ug/l Jan-04 QED 50 8249 55 203 162 12 104 <2 5Zinc ug/l Jan-04 QED 258 79 69 164 64 77 69 186 220Barium - dissolved ug/l Jan-04 QED 314 150 196 133 51 174 59 239 543Iron mg/l Jan-04 QED 0.6 0.9 0.2 0.2 2 0.2 0.8 0.2 0.1pH ##### QED 6.9 6.77 7.8 7.63 6.98 7.39 7.12 7.51 7.29Electrical conductivity uS/cm ##### QED 1147 1133 525 809 2321 1000 2077 532 441Calcium - dissolved mg/l ##### QED 244 293 115 63 604 302 547 149 109Barium - dissolved ug/l Ba ##### QED 57 63 176 35 36 74 114 298 234Manganese - dissolved ug/l Mn ##### QED 140 7940 115 322 288 197 352 274 89COD mg/l COD ##### QED 15 32 <8 24 <8 42 <8 <8 <8Sulphate mg/l SO4 ##### QED 255 330 62.4 27.4 905 362 700 104 74Ammonia mg/l NH3-N ##### QED 0.09 4.47 0.08 0.14 0.36 0.14 0.15 0.08 0.16Chloride - dissolved mg/l Cl ##### QED 15.2 19.2 9.2 16.9 15 19.8 22.3 21.3 12.8pH Nov-05 QED 7.18 6.53 7.93 7.8 7.26 7.64 7.12 7.17 7.99Electrical conductivity uS/cm Nov-05 QED 1232 1530 344 427 2800 1596 2005 632 467Calcium - dissolved mg/l Nov-05 QED 223.6 304 44.5 69.4 536.5 394 479.9 99.8 56.4Barium - dissolved ug/l Ba Nov-05 QED 178.7 141 99.1 108 8.1 50.6 40.8 572 127.7Manganese - dissolved ug/l Mn Nov-05 QED 178.7 9927 99.1 1720 8.1 50.6 818.1 1611 127.7COD mg/l COD Nov-05 QED 156 197 <8 476 <8 408 <8 61.3 <8Sulphate mg/l SO4 Nov-05 QED 365 653 5.4 14.8 1634 862 1157 91.9 47.9Ammonia mg/l NH3-N Nov-05 QED 0.125 0.271 <0.0110.11 2.25 0.111 0.3 0.169 <0.011pH Jun-06 QED 5.28 6.72 7.02 7.19 7.1 8.5 7.04 6.67 7.12Electrical conductivity uS/cm Jun-06 QED 1065 1298 430 384 2643 1446 1932 610 348Calcium - dissolved mg/l Jun-06 QED 177.7 223.1 61.9 52.3 535.4 305.9 437.6 91.3 53.3Barium - dissolved ug/l Ba Jun-06 QED 43.2 91.1 162.8 40.2 9.5 32.7 20.6 139.4 129.1Manganese - dissolved ug/l Mn Jun-06 QED 56.3 9081 70.3 349 149.6 318 166.3 7.1 2.4COD mg/l COD Jun-06 QED 8 24 8 8 8 8 8 8 8Sulphate mg/l SO4 Jun-06 QED 281 533 71.4 11.7 1865 833 2455 127.6 30.8Ammonia mg/l NH3-N Jun-06 QED 0.009 3.93 0.084 0.43 0.283 0.059 0.147 0.009 0.009Chloride - dissolved mg/l Cl Jun-06 QED 4.2 18.2 12.5 11 14.1 11.5 13.9 16.4 4.7pH Oct-06 QED 7.44 7.09 7.24 7.06 7.44Electrical conductivity uS/cm Oct-06 QED 1019 1634 404 2583 1878Calcium - dissolved mg/l Oct-06 QED 174 327 54.6 543 403Barium - dissolved ug/l Ba Oct-06 QED 41.43 126 37.3 11.62 29.08Manganese - dissolved ug/l Mn Oct-06 QED 45.2 10110 207 199 265.4COD mg/l COD Oct-06 QED 8 102 42 21 33.2Sulphate mg/l SO4 Oct-06 QED 180 2515 203 665 763Ammonia mg/l NH3-N Oct-06 QED 0.009 3.4 0.07 0.264 0.045Chloride - dissolved mg/l Cl Oct-06 QED 6.26 14.8 14.1 41.9 10.9Water Level m May-07 QED 2.25 1.39 1.63 1.75 2.21 9.23 0 12.94 1.72pH pH May-07 QED 7.58 6.6 7.2 7.11 6.85 7.3 7.07 6.43 7.48Electrical conductivity us/cm May-07 QED 845 1556 614 533 3506 1873 2613 830 470Calcium - dissolved mg/l May-07 QED 140 201.9 64 50.6 544.6 505.1 408.9 89.5 55.4Barium - dissolved ug/l May-07 QED 40.6 68.7 156.5 29 10.9 1.7 16.8 153.5 130.8Manganese - dissolved ug/l May-07 QED 48.3 8849 71.3 308 221.1 407.7 164 233 21.5
1632-010 (Processing Site GW Chemistry) 06/02/2008 Page 2 of 3

Appendix F
Geo
logy
O/B
O/B
Gra
vels
Gra
vels
Dol
erite
Gyp
sum
&
mud
ston
e
Gyp
sum
&
mud
ston
e
Mud
ston
e
Mud
ston
e
Wes
tpha
lian
Para
met
er
Uni
ts
Mon
th
sam
pled
Com
pany
taki
ng s
ampl
e
Rep
orte
d pa
ram
eter
BH
6-03
D
BH
3-03
S
BH
9-03
S
BH
3-03
D
Sam
ple
ID
BH
9-03
D
BH
5-03
S
BH
2-04
S
BH
4-03
D
BH
2-04
D
BH
1-04
D
COD mg/l May-07 QED 10 37 <8 16 <8 <8 <8 <8 <8Sulphate mg/l May-07 QED 200.2 446 <50 <50 2332 734.4 1687 <50 53.5Ammonia mg/l NH3-N May-07 QED <0.0067 4.45 0.101 0.06 0.242 0.081 0.109 0.027 0.021Chloride - dissolved mg/l May-07 QED 7.069 18.8 12.2 12 14.6 17.1 14.9 16.7 6.82Water Level m Sep-07 QED 2.5 1.27 1.38 1.6 1.74 9.38 0 12.51 1.5pH pH Sep-07 QED 6.46 6.91 7.2 7.37 5.83 6.87 6.59 6.15 7.11Electrical conductivity us/cm Sep-07 QED 999 2099 450 553 3809 2211 2737 1019 351Calcium - dissolved mg/l Sep-07 QED 173 <1 68.4 45 480.7 292.3 387.8 114.3 50Barium - dissolved ug/l Sep-07 QED 55 <1 134.2 29.7 9.3 36.9 15.2 161.8 97.1Manganese - dissolved ug/l Sep-07 QED 143.1 <1 108.7 183 153.3 263 107.2 45.6 53.83COD mg/l Sep-07 QED <8 28 <8 <8 <8 <8 <8 <8 <8Sulphate mg/l Sep-07 QED 174.7 509.5 74 19.9 1596 707.7 1696 156.7 42.6Ammonia mg/l NH3-N Sep-07 QED 0.065 5.49 0.099 0.14 0.38 0.131 0.217 0.11 0.04Chloride - dissolved mg/l Sep-07 QED 8.6 28.2 12.8 <8 14.5 10 13.6 13 7.7
1632-010 (Processing Site GW Chemistry) 06/02/2008 Page 3 of 3
2008 GROUND WATER RESULTS AND INTERPRETATION
(VI)
APPENDIX

Irish Gypsum Limited IPPC Licence No. 688
Condition 9.3.5
Report on groundwater hydrochemistry for 2008 & mitigation measures for exceedances at Processing Site Plant and Mine site
Minerex Work Item F4 Minerex Doc. Ref.:1632-863 (Final 11-03-09).doc
Date: Wednesday, March 11, 2009
Report by : Report To: Minerex Environmental Limited Catherina McGuirk Hydrogeological, Environmental and Irish Gypsum Limited Geophysical Services Kingscourt, Taney Hall, Dundrum, Dublin 14, Ireland Co. Cavan Dublin 14, Ireland Tel.: +353-(0)1-2964435 Fax.: +353-(0)1-2964436 Email: [email protected] Website: www.minerex.ie Prepared by : Reviewed by :
Jenny Rush MSc. P.Dip. EurGeol Cecil Shine PGeo Project Manager Project Director

REPORT TO REPORT BY
Irish Gypsum Limited Minerex Environmental LimitedIPPC Licence No. 688 Doc Ref 1632-863 (Final 11-03-09).docCondition 9.3.5 Page 2 of 11
Contents
1. Introduction 4 1.1 Background ___________________________________________________________4 1.2 Licence conditions ______________________________________________________4 1.3 Report purpose & content ________________________________________________4
2. Monitoring locations, methodology & parameters 5 2.1 Mine site monitoring locations _____________________________________________5 2.2 Processing site monitoring locations ________________________________________5 2.3 Sampling methodology __________________________________________________5 2.4 Limitations on interpretation_______________________________________________6 2.5 Gypsum saturation______________________________________________________6 2.6 Interim guideline values __________________________________________________7
3. Review of results 7 3.1 Trigger values _________________________________________________________7 3.2 Review of results for Mine Site ____________________________________________9 3.3 Review of results from Processing Site ______________________________________9 3.4 Mitigation measures____________________________________________________10
4. Conclusions & recommendations 11
5. References 11
Appendices Appendix Title Pages Minerex Doc. Ref.
Appendix A Hydrochemical results 1 x A4 1632-008.cdr Appendix B Mine site layout 1 x A4 1632-008.cdr Appendix C Processing site layout 1 x A4 1632-008.cdr Appendix D Rainfall data for 2008 1 x A4 1632-011.xls
DISCLAIMER Minerex Environmental Limited (MEL) has prepared this report for the sole use of its client in accordance with the work authorised. No warranty, expressed or implied, is made as to the professional advice included in this report or any other services provided by MEL. This report may not be relied upon by any other party without the prior and express written permission from MEL. Interpretations contained in this report are derived from available information of the site conditions, the likely environmental responses and the experience of the company. MEL has prepared this report in line with best current practice and with all reasonable skill, care and diligence in consideration of the limits imposed by materials, equipment or methodologies used, and the resources devoted to it as agreed with the client. The interpretative basis of the conclusions contained in this report should be taken into account in any future use of this report. While MEL endeavours to take reasonable effort to assess data in hand at the time of writing and give the best advice possible, MEL will accept no responsibility for how the information within this report is interpreted and used. Where elements of this report are based upon information provided by others, it is assumed that all the relevant information has been supplied to MEL in full and is reliable,

REPORT TO REPORT BY
Irish Gypsum Limited Minerex Environmental LimitedIPPC Licence No. 688 Doc Ref 1632-863 (Final 11-03-09).docCondition 9.3.5 Page 3 of 11
accurate and representative. MEL has not independently verified any information provided by others. MEL, its agents, directors, owners, employees, and contractors will not be held responsible for any loss (reputation, financial, technical or otherwise) occurring from the use of this report, howsoever caused.

REPORT TO REPORT BY
Irish Gypsum Limited Minerex Environmental LimitedIPPC Licence No. 688 Doc Ref 1632-863 (Final 11-03-09).docCondition 9.3.5 Page 4 of 11
1. Introduction
1.1 Background 1.1.1 Irish Gypsum Limited (IGL) operate mining and processing facilities in the Kingscourt area of
Co. Monaghan, which are subject to conditions of IPPC Licence No. 688/ P0519 (Ref. 1). Minerex Environmental Limited (MEL) have undertaken hydrogeological and environmental investigations at IGL since October 2003 for compliance with their IPPC Licence and additional Environmental Protection Agency (EPA) requirements.
1.1.2 IGL were requested by the EPA to submit a proposal to determine guideline values for groundwater quality in both the mine site and the processing sites to be “based on the Agency’s 2003 publication ‘Towards setting guideline values for the protection of groundwater in Ireland’, and/ or the natural groundwater chemistry found in the area of both the mine and processing site’ (Ref. 2), for use in evaluating the results of groundwater monitoring.
1.1.3 IGL commissioned MEL in June 2008 to prepare a report to address the EPA request above and compare the available results (from May 2005 to September 2008 at the mine site and from December 2003 to September 2008) of groundwater monitoring at each site with the EPA interim guideline values for groundwater and natural/ baseline groundwater chemistry in the area and to establish guideline values for each site and for each parameter. MEL submitted the report to IGL in August 2008 entitled ‘Report on baseline groundwater chemistry at Irish Gypsum mine & processing sites and proposal for the setting of guideline values’.
1.2 Licence conditions In compliance with condition 9.3.8 of the IPPC licence, all of the groundwater monitoring points at each site are sampled and analysed on a biannual basis, the results of which are submitted to the EPA annually as part of the AER. In compliance with condition 9.3.5, a report on baseline groundwater hydraulics and hydrochemistry at the mine site was submitted in October 2005 (Ref. 3).
1.3 Report purpose & content The purpose of this report is to:-
A. Review and interpret the available results of groundwater monitoring at the mine site and the processing site for 2008, and;
B. Propose appropriate measures to be taken on reaching the warning and action levels proposed in conjunction with IGL.

REPORT TO REPORT BY
Irish Gypsum Limited Minerex Environmental LimitedIPPC Licence No. 688 Doc Ref 1632-863 (Final 11-03-09).docCondition 9.3.5 Page 5 of 11
2. Monitoring locations, methodology & parameters
2.1 Mine site monitoring locations A total of 26 groundwater monitoring points have been installed within 1.5km of the mining facilities at Knocknacran to determine the impact of dewatering operations on groundwater levels in the surrounding hydrogeological units (Appendix A). The locations of these monitoring points are shown in Appendix B. These are as follows:
Monitoring point ID Hydrogeological unit Aquifer type 01JP-S Upper gypsum Aquiclude 01JP-D Dolerite in middle mudstone Aquitard MW1-P3 Upper mudstone Aquiclude MW1-P1 Dolerite in middle mudstone Aquitard MW2-P1 Overburden - MW3-P2 Middle mudstone Aquiclude MW3-P1 Westphalian Poor aquifer MW4-P1 Dolerite in lower mudstone Aquitard MW5-P2 Overburden - MW5-P1 Dolerite in middle mudstone Aquitard MW6-P1 Namurian Locally important aquifer M102PA Overburden - 95A1-D Middle mudstone Aquiclude 95A1-S Overburden -
2.2 Processing site monitoring locations A total of 19 groundwater monitoring points have been installed in the vicinity of the IGL processing facility at Lisnabow to determine the impact of site operations on groundwater chemistry in the surrounding hydrogeological units. All the monitoring points are currently monitored on a biannual basis. The locations of these monitoring points are shown in Appendix C. These are as follows:
Monitoring Point ID Hydrogeological unit Aquifer type BH2-04S Overburden - BH5-03S Overburden - BH1-04D Mudstone Aquiclude BH2-04D Mudstone Aquiclude BH9-03S Gravels Locally important aquifer BH3-03S Gravels Locally important aquifer BH9-03D Westphalian Poor aquifer BH3-03D Dolerite Aquitard BH4-03D Gypsum & mudstone Aquiclude BH6-03D Gypsum & mudstone Aquiclude
2.3 Sampling methodology Groundwater monitoring has been carried out by QED Limited on a biannual basis since May
2005 at the mine site and since January 2004 at the processing site in accordance with Schedule 4 (ii) of the IPPC Licence, with irregular sampling by MEL at the mine site in November 2003 and February and May 2005 and at the processing site in December 2003. The sampling methodology was consistent between QED and MEL, where samples are obtained using a submersible Wasp pump and Waterra tubing following standards and

REPORT TO REPORT BY
Irish Gypsum Limited Minerex Environmental LimitedIPPC Licence No. 688 Doc Ref 1632-863 (Final 11-03-09).docCondition 9.3.5 Page 6 of 11
protocols based on ISO 5667 standard methods and EPA guidelines, whereby every practical effort was made to purge each monitoring borehole of three borehole volumes prior to a sample being taken. The samples are dispatched to ELS Laboratory for analysis. The following table details the parameters for analysis at each site.
Mine site Processing sitepH pH Conductivity Conductivity Calcium COD Sulphate Calcium Ammonia Sulphate Nitrate Ammonia Chloride Chloride Sodium Manganese Potassium Barium Magnesium Alkalinity
2.4 Limitations on interpretation In order to account for the wide range of values for each parameter within each hydrogeological unit, the following issues were looked at to ensure that seemingly anomalous data was in fact representative of the variation within the hydrogeological unit:
- The variation in results is not attributed to potential inconsistencies in using different laboratories between MEL and QED sampling events, as the results from each for similar times of year remain consistent;
- The variation in results is not attributed to potential inconsistencies in sampling methodology between MEL and QED sampling events, as the sampling methodology should adhere to ISO standards and therefore should remain consistent;
- The variation in results is not attributed to potential insufficient purging of water from the boreholes after drilling, as sampling at the mine site dates from after drilling and while sampling at the processing site dates from immediately after drilling, the results remain consistent;
- The variation in results is not attributed to seasonal variations in antecedent rainfall, as there is no obvious seasonal trend in the results;
- It is unclear if the variation in the results can be attributed to anthropogenic activities, leaking annuli, human error, and variation in sample preservation or natural hydrochemical fluctuation.
2.5 Gypsum saturation Gypsum is soluble in fresh water and therefore water that comes in contact with gypsum tends to have naturally elevated sulphate and conductivity levels (Ref. 4). An assessment undertaken on the potential impacts of mine flooding on the long term stability at Drummond shows that a solution saturated with respect to gypsum would contain approximately 560mg/l of calcium and 1340mg/l of sulphate (Ref. 4). Assuming stable conditions, once these levels have been reached, in theory no more gypsum can dissolve in the saturated solution. However, sulphate levels of >1340mg/l, as apparent at the mine site, may indicate that other sulphate minerals have dissolved.

REPORT TO REPORT BY
Irish Gypsum Limited Minerex Environmental LimitedIPPC Licence No. 688 Doc Ref 1632-863 (Final 11-03-09).docCondition 9.3.5 Page 7 of 11
2.6 Interim guideline values
The Water Framework Directive (WFD) (2000/60/EEC) establishes a strategic framework for managing the water environment and sets out a common approach to protecting and setting environmental objectives for all groundwater and surface waters within the European Community (Ref. 5). Specifically for groundwater, the WFD aims to maintain and / or attain ‘good chemical status’ in all groundwater bodies. However the exact requirements of the WFD are not yet fully determined. In the interim, Member States were required to establish appropriate criteria. Interim guideline values (IGV’s) for specific parameters were drawn up taking account of various legislative and guidance values but are chiefly derived from the drinking water standards.
3. Review of results
3.1 Trigger values
3.1.1 The values for groundwater chemistry recorded in each hydrogeological unit at each of the sites generally exceed the interim guideline values for groundwater as set by the EPA’s document ‘Towards setting guideline values for the protection of groundwater in Ireland’, reflecting the unique geology and hydrochemistry of this area. Therefore the EPA requested site specific guideline values with which to compare the results of the groundwater monitoring.
3.1.2 The range of values recorded in each hydrogeological unit at each of the sites show significant variation, reflecting the unique geology and hydrogeology of the area, the enhanced permeabilities of the gypsum, where weathered and where mined, and direction of groundwater flow direction e.g. where upward or downward gradients are present.
3.1.3 In order to take account of the significant variation in hydrochemistry, it was proposed to use the average value for each parameter within each unit as a lower guideline or ‘warning’ value, while the upper value from the range of values to date as an upper guideline or ‘action’ value. These values are summarised for each site in the following tables.
3.1.4 The exception to these trigger values are the values for ammonia in the gravel and values for COD in the dolerite at the processing site, and values for potassium in the gypsum at the mine site, which are considered to be influenced by anthropogenic activities.

REPORT TO REPORT BY
Irish Gypsum Limited Minerex Environmental LimitedIPPC Licence No. 688 Doc Ref 1632-863 (Final 11-03-09).docCondition 9.3.5 Page 8 of 11
Mine Site Overburden Gypsum Dolerite Mudstone Namurian/ Westphalian
Comparison
MW2–P1 01JP-S 01JP-D MW1-P3 MW3-P1 MW5-P2 MW1-P1 MW3-P2 MW6-P1 M102PA MW4-P1 95A1-D
Monitoring points
MW5-P1
Interim guideline values for groundwater chemistry (EPA, 2004)
Parameter Lower Upper Lower Upper Lower Upper Lower Upper Lower Upper IGV Unit Alkalinity 214 466 666 3,000 188 1,000 304 1,190 168 538 No
abnormal change
mg/l
Calcium 212 529 673 1,252 301 574 405 1,081 351 864 200 mg/l Chloride 22 53 25 70 21 54 50 378 26 164 30 mg/l Magnesium 50 100 52 148 35 85 45 167 57 284 50 mg/l Potassium 4.3 9 32 162 12 116 12 55 9 69 5 mg/l Sodium 50 96 122 296 83 625 122 693 57 168 150 mg/l Sulphate 504 1,775 1,164 3,197 962 3,459 1,224 4,288 1,018 2,533 200 mg/l Conductivity 1,299 2,231 3,748 11,638 1,716 3,478 2,451 5,483 1,562 3,186 1,000 uS/cm pH 7.0 8.9 9 13.8 8.5 13.3 9.2 13.8 7 8 ≥6.5, ≤9.5 pH
Table 1 Summary of lower and upper trigger values for each hydrogeological unit at Mine Site

REPORT TO REPORT BY
Irish Gypsum Limited Minerex Environmental LimitedIPPC Licence No. 688 Doc Ref 1632-863 (Final 11-03-09).docCondition 9.3.5 Page 9 of 11
Mine Site Overburden Gravels Gypsum Dolerite Mudstone Comparison BH2-04S BH9-03S BH4-03D BH3-03D BH1-04D BH5-03S BH3-03S BH6-03D BH2-4D
Monitoring points
Interim guideline values for groundwater chemistry (EPA, 2004)
Parameter Lower Upper Lower Upper Lower Upper Lower Upper Lower Upper IGV Unit pH 7.5 11.7 7.2
7.9 7.4 11.1 7.3 8.8 7.1 7.7 ≥6.5,
≤9.5 pH
Conductivity 1,907 3,000 1,165 2,310 1,740 3,809 1,407 2,971 1,506 2,737 1,000 uS/cm COD 39 156 39 197 49 408 61 476 21 61 - mg/l Calcium 337 599 214 447 416 745 295 775 292 554 200 mg/l Sulphate 1,026 1,586 596 2,515 1,040 2,891 1,447 7,002 841 2,455 200 mg/l Ammonia 0.08 0.221 1.9 5.5 0.19 2.25 0.39 4.4 0.12 0.3 0.15* mg/l Chloride 23 78.1 14.5 28.2 18.5 56 13 17 24 61 30 mg/l Manganese 120 406.3 3,911 10,110 559.3 1,679 386 6,950 360 1,611 50 ug/l Barium 108 314 126 196 40 174 58 245 153 572 100 ug/l
Table 2 Summary of lower and upper trigger values for each hydrogeological unit at Processing Site
* IGV for Ammonium

REPORT TO REPORT BY
Irish Gypsum Limited Minerex Environmental LimitedIPPC Licence No. 688 Doc Ref 1632-863 (Final 11-03-09).docCondition 9.3.5 Page 9 of 11
3.2 Review of results for Mine Site
3.2.1 Overburden 40% of the results for groundwater monitoring in 2008 at boreholes installed in the overburden are higher than the lower guideline value, while there are no results higher than the upper guideline value (Appendix A). These include all parameters except pH.
3.2.2 Dolerite 22% of the results for groundwater monitoring in 2008 at boreholes installed in the overburden are higher than the lower guideline value; while there are no results higher than the upper guideline value. The parameters are alkalinity, calcium, electrical conductivity and potassium.
3.2.3 Mudstone 21% of the results for groundwater monitoring in 2008 at boreholes installed in the overburden are higher than the lower guideline value; while there are no results higher than the upper guideline value. These parameters are alkalinity, calcium, magnesium and potassium.
3.2.4 Gypsum 47% of the results for groundwater monitoring in 2008 at boreholes installed in the overburden are higher than the lower guideline value; while there are no results higher than the upper guideline value. These parameters are alkalinity, calcium, electrical conductivity, potassium and sodium.
3.2.5 Namurian/ Westphalian 59% of the results for groundwater monitoring in 2008 at boreholes installed in the overburden are higher than the lower guideline value, while there are no results higher than the upper guideline value. These parameters include alkalinity, calcium, electrical conductivity, magnesium, potassium and sodium.
3.3 Review of results from Processing Site
3.3.1 Overburden 11% of the results for groundwater monitoring in 2008 at boreholes installed in the overburden are higher than the lower guideline value; while there are no results higher than the upper guideline value (Appendix A).
3.3.2 Gravel 30% of the results for groundwater monitoring in 2008 at boreholes installed in the gravels are higher than the lower guideline value, while there are no results higher than the upper guideline value. These parameters are ammonia, barium, chloride, electrical conductivity and manganese.

REPORT TO REPORT BY
Irish Gypsum Limited Minerex Environmental LimitedIPPC Licence No. 688 Doc Ref 1632-863 (Final 11-03-09).docCondition 9.3.5 Page 10 of 11
3.3.3 Gypsum
16% of the results for groundwater monitoring in 2008 at boreholes installed in the gypsum are higher than the lower guideline value; while 5% are higher than the upper guideline value namely manganese values in BH6-03D in April and manganese values in BH4-03D in September.
3.3.4 Dolerite 16% of the results for groundwater monitoring in 2008 at boreholes installed in the dolerite are higher than the lower guideline value, while there are no results higher than the upper guideline value. These parameters are ammonia, electrical conductivity and pH.
3.3.5 Mudstone 30% of the results for groundwater monitoring in 2008 at boreholes installed in the mudstone are higher than the lower guideline value, while there are no results higher than the upper guideline value. These parameters are barium, calcium, electrical conductivity and sulphate.
3.3.6 Summary - In general, there are more results in September which are higher than the lower guideline
values than in April but there is an equal occurrence of results higher than the upper guideline values.
3.4 Mitigation measures
3.4.1 Mine site
Operations at the mine site are confined to gypsum mining and processing and therefore little or no anthropogenic influence on the groundwater hydrochemistry is anticipated. The results which are higher than the lower guideline or ‘warning’ value here are considered to be naturally occurring fluctuations within the hydrogeological system. Mining and karstification in places are likely to have increased the permeability of the shallow hydrogeological units, leading to effectively underground streams and showing increased susceptibility to hydrochemical fluctuation similar to chemical variations in surface waters.
Should results which are higher than the upper guideline or ‘action’ value occur, it is proposed that mitigation is considered on an event specific basis and applied only to parameters known or thought to be of anthropogenic origin, such as ammonia, chloride and potassium.
3.4.2 Processing site
The processing site houses an unlined historical landfill, which is anticipated to influence the groundwater hydrochemistry. This is evident from high concentrations of ammonia, chloride and COD across the site.
The results for manganese which are higher than the lower guideline or ‘warning’ value are likely to be attributed to naturally occurring manganese in the area, as recorded at an adjacent site. The results for ammonia, chloride and COD which are higher than the lower guideline or ‘warning’ value suggest that either the groundwater here is influenced by the unlined historical landfill, agricultural fertilisers or wastewater treatment systems external to the site.

REPORT TO REPORT BY
Irish Gypsum Limited Minerex Environmental LimitedIPPC Licence No. 688 Doc Ref 1632-863 (Final 11-03-09).docCondition 9.3.5 Page 11 of 11
4. Conclusions & recommendations 4.1 The values for groundwater chemistry recorded in each hydrogeological unit at each of the sites
generally exceed the interim guideline values for groundwater as set by the EPA’s document ‘Towards setting guideline values for the protection of groundwater in Ireland’, reflecting the unique geology and hydrochemistry of this area.
4.2 The range of values recorded in each hydrogeological unit at each of the sites show significant variation, reflecting the unique geology of the area and the enhanced permeabilities of the gypsum, where weathered and where mined.
4.3 In order to take account of the significant variation in hydrochemistry, it is proposed to establish guideline or ‘trigger’ values for each hydrogeological unit at each site.
4.4 In order to take account of the significant variation in hydrochemistry, it is proposed to use the average value for each parameter within each unit as a lower guideline or ‘warning’ value, while the upper value from the range of values to date as an upper guideline or ‘action’ value. These values are summarised for each site in the following tables.
4.5 The exception to these trigger values are the values for ammonia in the gravel and values for COD in the dolerite at the processing site and values for potassium in the gypsum at the mine site, which are considered to be influenced by anthropogenic activities.
5. References No. Description Minerex Doc Ref 1. IPPC Licence No. 668/ P0519-02 (2005) Environmental Protection
Agency. 1632-260
2. Environmental Protection Agency (2004) Towards setting guideline values for the protection of groundwater in Ireland.
F827
3. Minerex Environmental Limited (2008) Report on baseline groundwater chemistry at Irish Gypsum mine & processing sites and proposal for the setting of guideline values
1632-756.doc
4. Irish Gypsum Limited (2002) An assessment of the impact of mine flooding on the long term stability of Drummond Mine – Appendix 13 in Irish Gypsum Limited (2004) Response to request for additional information
1632-668
5. www.wfdireland.ie Water Framework Directive, Ireland

REPORT TO REPORT BY
Irish Gypsum Limited Minerex Environmental LimitedIPPC Licence No. 688 Doc Ref 1632-863 (Final 11-03-09).docCondition 9.3.5
Appendix A

Appendix A
Parameter/ substance
Results
Geo
logy Dolerite
in Lower Mudst.
Dolerite in Mid Mudst.
Dolerite in Mid Mudst.
Dolerite in Mid. Mudst.
Lower Mudst.
Mid Mudst.
Mid Mudst.
Mid. Mudst.
Upper Mudst.
Upper Mudst.
Upper Mudst.
Upper Mudst.
Upper Mudst. O/B O/B O/B O/B
Upper Gypsum
Upper Gypsum
Upper Gypsum
Namurian/ Westphalian
Namurian/ Westphalian
MW
4-P1
Dee
p
MW
1-P1
MW
5-P1
01JP
-D
M10
1PA
MW
7-P1
95A
1-D
MW
3-P2
D01
HP
MW
1-P3
03A
-P1
95A
2
M10
1P
M10
2PA
MW
2-P1
MW
4-P2
Sh
allo
w
MW
5-P2
03A
-P2
01JP
-S
MW
1-P2
MW
6-P1
MW
3-P1
Uni
ts
Mon
th/
year
Alkalinity - total mg/l CaCO3 Nov-03 MEL 170 190 1190 140 50 180 NDP 70 380 340 100 230 130 130Calcium - dissolved mg/l Ca Nov-03 MEL 446.8 574 486.4 470.9 76.69 457 479.6 264.1 160 180.8 675.1 599.3 284.6 412.6Chloride - dissolved mg/l Cl Nov-03 MEL 17 14 16 20 56 76 65 12 15 53 21 24 16 19Electrical conductivity uS/cm Nov-03 MEL 2310 2370 2290 2390 958 3390 2470 1471 1430 1363 2380 3000 1785 2390Electrical conductivity uS/cm Nov-03 MEL 2265 2485 4992 2280 977 3249 2721 1536 1500 1331 2494 2993 1719 2264Electrical conductivity (Lab value minus field uS/cm Nov-03 MEL -45 115 2702 -110 19 -141 251 65 70 -32 114 -7 -66 -126Electrical conductivity (Lab value minus field uS/cm Nov-03 MEL 45 115 2702 110 19 141 251 65 70 32 114 7 66 126Electrical conductivity (Percentage difference) uS/cm Nov-03 MEL 1.95% 4.85% 117.99% 4.60% 1.98% 4.16% 10.16% 4.42% 4.90% 2.35% 4.79% 0.23% 3.70% 5.27%Magnesium - dissolved mg/l Mg Nov-03 MEL 51.57 49.4 0.53 49.43 6.1 105.7 53.82 43.67 74.2 41.99 43.64 0.03 49 39.98Nitrate mg/l NO3 Nov-03 MEL <0.3 <0.3 <0.3 0.5 <0.3 4.3 <0.3 <0.3 <0.3 1.1 <0.3 <0.3 1.4 <0.3pH
punits pH units Nov-03 MEL 7.66 7.83 11.25 7.70 11.08 7.63 7.67 7.77 7.41 7.16 7.79 11.69 7.69 7.61
pHpunits pH units Nov-03 MEL 7.44 7.82 11.99 7.33 9.69 7.29 7.30 7.41 7.89 6.94 7.55 11.08 7.42 6.83
Potassium mg/l K Nov-03 MEL 5.6 11.8 13 6.8 11.8 10.4 18.6 4.4 8.4 4.2 12.4 74 10.8 5.8Sodium mg/l Na Nov-03 MEL 31.5 39.5 94 65 136 315 212 77 92 69 102 296 74 67Sulphate mg/l SO4 Nov-03 MEL 1466 1471 610 1550 355 2341 1431 772 521 456 1426 1488 1005 1586Total Dissolved Solids mg/l Solids Nov-03 MEL 2191 2757 1538 2210 557 3136 2285 1189 975 1072 2163 1953 1533 1299Temperature oC Degree C Nov-03 MEL 10.8 8.6 8.5 9.9 9.0 9.8 10.5 8.8 8.5 7.1 10.2 8.1 10.5 9.1Ionic balance % Nov-03 MEL 1.7 4.5 NP 7.7 5.6 14.1 12.5Ionic balance % Nov-03 MEL 9.3 0.9 6.4 7 3.7 8.5 NP 7.1 2.3 3.1 13.7 11.5 4 14Alkalinity - total mg/l CaCO3 Feb-05 MEL 160 360Calcium - dissolved mg/l Feb-05 MEL 145.9 405.2Chloride - dissolved mg/l Cl Feb-05 MEL 24 19Electrical conductivity uS/cm Feb-05 MEL 1216 2133Magnesium - dissolved mg/l Mg Feb-05 MEL 28.96 2.68Nitrate mg/l N Feb-05 MEL 1.3 <0.3pH Feb-05 MEL 8.02 11.6Potassium mg/l K Feb-05 MEL 7.8 108Sodium mg/l Na Feb-05 MEL 77 48Sulphate mg/l SO4 Feb-05 MEL 442 598Total Dissolved Solids mg/l Feb-05 MEL 848 1414Alkalinity - total mg/l CaCO3 May-05 QED 20 26 346 30 642 38 1092 48 20 316 10 56 56 28 16 1370 24 62Ammonia mg/l N May-05 QED 0.18 0.102 0.92 0.14 0.7 0.151 2 0.109 0.42 1.48 0.12 0.16 0.281 0.24 0.26 4.58 0.13 0.165Calcium - dissolved mg/l May-05 QED 171 554 530 175 461 1081 376 154 559 522 523 191 383 529 604 1016 600 864Chloride - dissolved mg/l Cl May-05 QED 22.9 22.3 26.4 22.7 85.6 24.7 16.2 2.68 378 30.5 13.8 15.8 42.5 24.3 69.5 10.8 20.8 30.7Electrical conductivity uS/cm May-05 QED 1082 1928 3426 1046 4815 2266 4716 453 3169 3329 2227 1275 1425 2159 2688 10036 2189 2342Magnesium - dissolved mg/l Mg May-05 QED 31 85 0.12 29 1.03 154 0.04 9.5 109 0.15 63 80 59 100 117 0.02 57 284Nitrate mg/l N May-05 QED <0.08 <0.05 0.36 <0.08 <0.08 <0.05 0.46 <0.05 <0.08 0.29 <0.08 <0.08 <0.05 <0.08 <0.08 0.12 <0.08 <0.05pH May-05 QED 7.71 7.49 12.91 7.88 13.39 7.4 7.84 8.2 7.69 12.82 8.61 7.84 6.27 8.89 7.75 13.82 7.52 7.52Potassium mg/l K May-05 QED 0.7 0.4 0.1 0.1 0.8 <0.1 <0.1 <0.1 0.4 0.1 0.1 0.1 0.6 0.1 0.6 0.6 0.5 0.7
Para
met
er
Rep
orte
d pa
ram
eter
Sam
ple
ID
Com
pany
taki
ng s
ampl
e
1632-010 (Mine GW Chemistry).xls 06/02/2009 Page 1 of 5
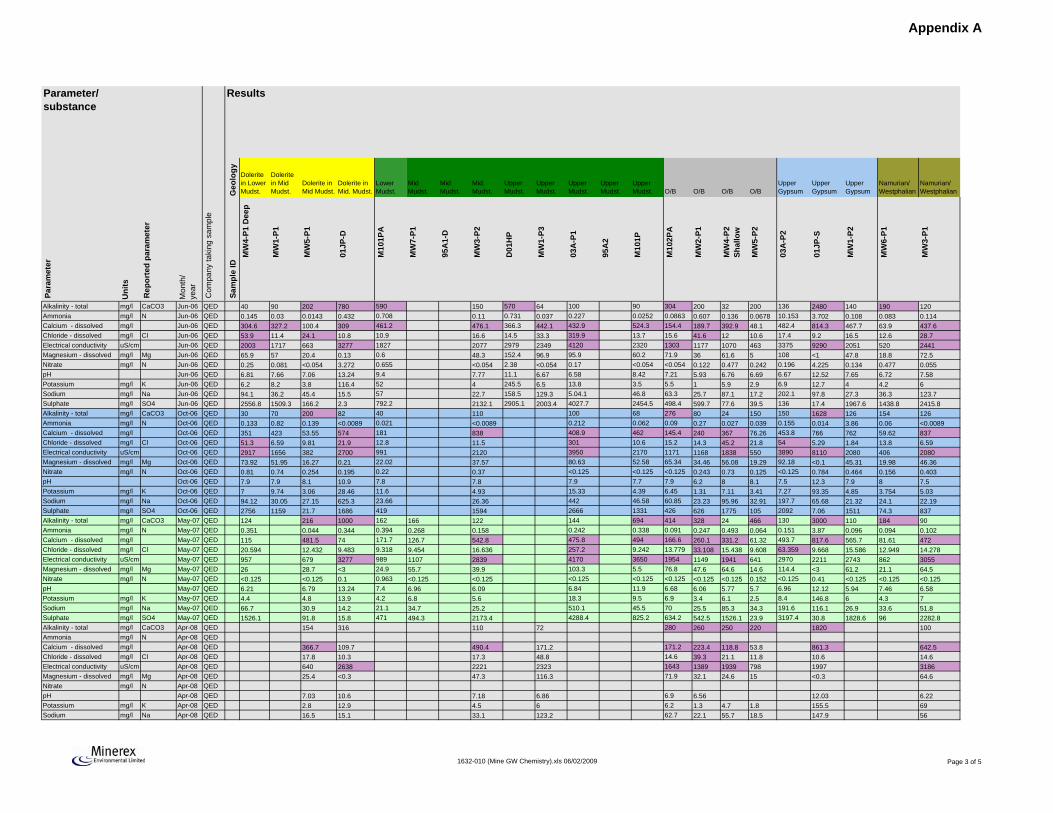
Appendix A
Parameter/ substance
Results
Geo
logy Dolerite
in Lower Mudst.
Dolerite in Mid Mudst.
Dolerite in Mid Mudst.
Dolerite in Mid. Mudst.
Lower Mudst.
Mid Mudst.
Mid Mudst.
Mid. Mudst.
Upper Mudst.
Upper Mudst.
Upper Mudst.
Upper Mudst.
Upper Mudst. O/B O/B O/B O/B
Upper Gypsum
Upper Gypsum
Upper Gypsum
Namurian/ Westphalian
Namurian/ Westphalian
MW
4-P1
Dee
p
MW
1-P1
MW
5-P1
01JP
-D
M10
1PA
MW
7-P1
95A
1-D
MW
3-P2
D01
HP
MW
1-P3
03A
-P1
95A
2
M10
1P
M10
2PA
MW
2-P1
MW
4-P2
Sh
allo
w
MW
5-P2
03A
-P2
01JP
-S
MW
1-P2
MW
6-P1
MW
3-P1
Uni
ts
Mon
th/
year
Para
met
er
Rep
orte
d pa
ram
eter
Sam
ple
ID
Com
pany
taki
ng s
ampl
e
Alkalinity - total mg/l CaCO3 Jun-06 QED 40 90 202 780 590 150 570 64 100 90 304 200 32 200 136 2480 140 190 120Ammonia mg/l N Jun-06 QED 0.145 0.03 0.0143 0.432 0.708 0.11 0.731 0.037 0.227 0.0252 0.0863 0.607 0.136 0.0678 10.153 3.702 0.108 0.083 0.114Calcium - dissolved mg/l Jun-06 QED 304.6 327.2 100.4 309 461.2 476.1 366.3 442.1 432.9 524.3 154.4 189.7 392.9 48.1 482.4 814.3 467.7 63.9 437.6Chloride - dissolved mg/l Cl Jun-06 QED 53.9 11.4 24.1 10.8 10.9 16.6 14.5 33.3 319.9 13.7 15.6 41.6 12 10.6 17.4 9.2 16.5 12.6 28.7Electrical conductivity uS/cm Jun-06 QED 2003 1717 663 3277 1827 2077 2979 2349 4120 2320 1303 1177 1070 463 3375 9290 2051 520 2441Magnesium - dissolved mg/l Mg Jun-06 QED 65.9 57 20.4 0.13 0.6 48.3 152.4 96.9 95.9 60.2 71.9 36 61.6 5 108 <1 47.8 18.8 72.5Nitrate mg/l N Jun-06 QED 0.25 0.081 <0.054 3.272 0.655 <0.054 2.38 <0.054 0.17 <0.054 <0.054 0.122 0.477 0.242 0.196 4.225 0.134 0.477 0.055pH Jun-06 QED 6.81 7.66 7.06 13.24 9.4 7.77 11.1 6.67 6.58 8.42 7.21 5.93 6.76 6.69 6.67 12.52 7.65 6.72 7.58Potassium mg/l K Jun-06 QED 6.2 8.2 3.8 116.4 52 4 245.5 6.5 13.8 3.5 5.5 1 5.9 2.9 6.9 12.7 4 4.2 6Sodium mg/l Na Jun-06 QED 94.1 36.2 45.4 15.5 57 22.7 158.5 129.3 5.04.1 46.8 63.3 25.7 87.1 17.2 202.1 97.8 27.3 36.3 123.7Sulphate mg/l SO4 Jun-06 QED 2556.8 1509.3 166.2 2.3 792.2 2132.1 2905.1 2003.4 4027.7 2454.5 498.4 599.7 77.6 39.5 136 17.4 1967.6 1438.8 2415.8Alkalinity - total mg/l CaCO3 Oct-06 QED 30 70 200 82 40 110 100 68 276 80 24 150 150 1628 126 154 126Ammonia mg/l N Oct-06 QED 0.133 0.82 0.139 <0.0089 0.021 <0.0089 0.212 0.062 0.09 0.27 0.027 0.039 0.155 0.014 3.86 0.06 <0.0089Calcium - dissolved mg/l Oct-06 QED 351 423 53.55 574 181 838 408.9 462 145.4 240 367 76.26 453.8 766 762 59.62 837Chloride - dissolved mg/l Cl Oct-06 QED 51.3 6.59 9.81 21.9 12.8 11.5 301 10.6 15.2 14.3 45.2 21.8 54 5.29 1.84 13.8 6.59Electrical conductivity uS/cm Oct-06 QED 2917 1656 382 2700 991 2120 3950 2170 1171 1168 1838 550 3890 8110 2080 406 2080Magnesium - dissolved mg/l Mg Oct-06 QED 73.92 51.95 16.27 0.21 22.02 37.57 80.63 52.58 65.34 34.46 56.08 19.29 92.18 <0.1 45.31 19.98 46.36Nitrate mg/l N Oct-06 QED 0.81 0.74 0.254 0.195 0.22 0.37 <0.125 <0.125 <0.125 0.243 0.73 0.125 <0.125 0.784 0.464 0.156 0.403pH Oct-06 QED 7.9 7.9 8.1 10.9 7.8 7.8 7.9 7.7 7.9 6.2 8 8.1 7.5 12.3 7.9 8 7.5Potassium mg/l K Oct-06 QED 7 9.74 3.06 28.46 11.6 4.93 15.33 4.39 6.45 1.31 7.11 3.41 7.27 93.35 4.85 3.754 5.03Sodium mg/l Na Oct-06 QED 94.12 30.05 27.15 625.3 23.66 26.36 442 46.58 60.85 23.23 95.96 32.91 197.7 65.68 21.32 24.1 22.19Sulphate mg/l SO4 Oct-06 QED 2756 1159 21.7 1686 419 1594 2666 1331 426 626 1775 105 2092 7.06 1511 74.3 837Alkalinity - total mg/l CaCO3 May-07 QED 124 216 1000 162 166 122 144 694 414 328 24 466 130 3000 110 184 90Ammonia mg/l N May-07 QED 0.351 0.044 0.344 0.394 0.268 0.158 0.242 0.338 0.091 0.247 0.493 0.064 0.151 3.87 0.096 0.094 0.102Calcium - dissolved mg/l May-07 QED 115 481.5 74 171.7 126.7 542.8 475.8 494 166.6 260.1 331.2 61.32 493.7 817.6 565.7 81.61 472Chloride - dissolved mg/l Cl May-07 QED 20.594 12.432 9.483 9.318 9.454 16.636 257.2 9.242 13.779 33.108 15.438 9.608 63.359 9.668 15.586 12.949 14.278Electrical conductivity uS/cm May-07 QED 957 679 3277 989 1107 2839 4170 3650 1954 1149 1941 641 2970 2211 2743 862 3055Magnesium - dissolved mg/l Mg May-07 QED 26 28.7 <3 24.9 55.7 39.9 103.3 5.5 76.8 47.6 64.6 14.6 114.4 <3 61.2 21.1 64.5Nitrate mg/l N May-07 QED <0.125 <0.125 0.1 0.963 <0.125 <0.125 <0.125 <0.125 <0.125 <0.125 <0.125 0.152 <0.125 0.41 <0.125 <0.125 <0.125pH May-07 QED 6.21 6.79 13.24 7.4 6.96 6.09 6.84 11.9 6.68 6.06 5.77 5.7 6.96 12.12 5.94 7.46 6.58Potassium mg/l K May-07 QED 4.4 4.8 13.9 4.2 6.8 5.6 18.3 9.5 6.9 3.4 6.1 2.5 8.4 146.8 6 4.3 7Sodium mg/l Na May-07 QED 66.7 30.9 14.2 21.1 34.7 25.2 510.1 45.5 70 25.5 85.3 34.3 191.6 116.1 26.9 33.6 51.8Sulphate mg/l SO4 May-07 QED 1526.1 91.8 15.8 471 494.3 2173.4 4288.4 825.2 634.2 542.5 1526.1 23.9 3197.4 30.8 1828.6 96 2282.8Alkalinity - total mg/l CaCO3 Apr-08 QED 154 316 110 72 280 260 250 220 1820 100Ammonia mg/l N Apr-08 QEDCalcium - dissolved mg/l Apr-08 QED 366.7 109.7 490.4 171.2 171.2 223.4 118.8 53.8 861.3 642.5Chloride - dissolved mg/l Cl Apr-08 QED 17.8 10.3 17.3 48.8 14.6 39.3 21.1 11.8 10.6 14.6Electrical conductivity uS/cm Apr-08 QED 640 2638 2221 2323 1643 1389 1939 798 1997 3186Magnesium - dissolved mg/l Mg Apr-08 QED 25.4 <0.3 47.3 116.3 71.9 32.1 24.6 15 <0.3 64.6Nitrate mg/l N Apr-08 QEDpH Apr-08 QED 7.03 10.6 7.18 6.86 6.9 6.56 12.03 6.22Potassium mg/l K Apr-08 QED 2.8 12.9 4.5 6 6.2 1.3 4.7 1.8 155.5 69Sodium mg/l Na Apr-08 QED 16.5 15.1 33.1 123.2 62.7 22.1 55.7 18.5 147.9 56
1632-010 (Mine GW Chemistry).xls 06/02/2009 Page 3 of 5

Appendix A
Parameter/ substance
Results
Geo
logy Dolerite
in Lower Mudst.
Dolerite in Mid Mudst.
Dolerite in Mid Mudst.
Dolerite in Mid. Mudst.
Lower Mudst.
Mid Mudst.
Mid Mudst.
Mid. Mudst.
Upper Mudst.
Upper Mudst.
Upper Mudst.
Upper Mudst.
Upper Mudst. O/B O/B O/B O/B
Upper Gypsum
Upper Gypsum
Upper Gypsum
Namurian/ Westphalian
Namurian/ Westphalian
MW
4-P1
Dee
p
MW
1-P1
MW
5-P1
01JP
-D
M10
1PA
MW
7-P1
95A
1-D
MW
3-P2
D01
HP
MW
1-P3
03A
-P1
95A
2
M10
1P
M10
2PA
MW
2-P1
MW
4-P2
Sh
allo
w
MW
5-P2
03A
-P2
01JP
-S
MW
1-P2
MW
6-P1
MW
3-P1
Uni
ts
Mon
th/
year
Para
met
er
Rep
orte
d pa
ram
eter
Sam
ple
ID
Com
pany
taki
ng s
ampl
e
Sodium mg/l Na May-05 QED 67 51 201 70 115 29 57 14 544 120 45 78 38 49 174 219 30 82Sulphate mg/l SO4 May-05 QED 336 708 2345 332 366 820 68 154 929 1615 729 390 438 706 910 14.2 706 818Alkalinity - total mg/l CaCO3 Nov-05 QED 140 60 112 1178 620 136 20 120 62 316 278 120 114 2024 148 112Ammonia mg/l N Nov-05 QED 0.09 <0.011 8.64 0.7 1.76 0.17 0.16 0.27 0.025 0.029 0.19 0.71 0.27 4.2 0.11 0.076Calcium - dissolved mg/l Nov-05 QED 128.8 444.4 514 708.3 546 635.1 147.7 683.5 563 167.2 354 451.2 638.7 1105 662.8 605.5Chloride - dissolved mg/l Cl Nov-05 QED 23.1 16.2 38.9 18.8 21.1 21.4 21.1 198 13.5 19.1 44.8 19.2 68.2 12.2 22.2 163.6Electrical conductivity uS/cm Nov-05 QED 1071 1739 3478 2310 2226 680 5483.3 2201 1345 1485 2231 3027 11638 2206 2410Magnesium - dissolved mg/l Mg Nov-05 QED 28.5 70 <0.05 0.5 47.2 50.7 20.5 166.8 69.2 88.7 70.2 89.7 148.1 <0.05 59.3 95.9Nitrate mg/l N Nov-05 QED <0.27 0.707 0.636 0.144 <0.27 0.588 0.742 0.367 0.117 0.036 0.575 <0.27 0.446 1.24 0.61 0.415pH Nov-05 QED 8.59 7.74 11.8 13.77 13.04 7.41 7.04 6.72 8.45 7.3 6.53 8.74 9.37 12.8 7.69 7.54Potassium mg/l K Nov-05 QED 4.8 19.9 32.5 100.5 54.8 4.9 6.8 22.4 3.5 5.6 3.2 8.5 8.3 162 4.5 7.4Sodium mg/l Na Nov-05 QED 74 38 460.9 107.8 63.5 29.7 17.1 692.7 50.7 73.5 35.8 57.9 229.4 159.8 28.1 96Sulphate mg/l SO4 Nov-05 QED 432 1618 3459 587 826 2160 24.8 3632 2803 506 395 1456 2473 53.8 2315 2533
1632-010 (Mine GW Chemistry).xls 06/02/2009 Page 2 of 5

Appendix A
Parameter/ substance
Results
Geo
logy Dolerite
in Lower Mudst.
Dolerite in Mid Mudst.
Dolerite in Mid Mudst.
Dolerite in Mid. Mudst.
Lower Mudst.
Mid Mudst.
Mid Mudst.
Mid. Mudst.
Upper Mudst.
Upper Mudst.
Upper Mudst.
Upper Mudst.
Upper Mudst. O/B O/B O/B O/B
Upper Gypsum
Upper Gypsum
Upper Gypsum
Namurian/ Westphalian
Namurian/ Westphalian
MW
4-P1
Dee
p
MW
1-P1
MW
5-P1
01JP
-D
M10
1PA
MW
7-P1
95A
1-D
MW
3-P2
D01
HP
MW
1-P3
03A
-P1
95A
2
M10
1P
M10
2PA
MW
2-P1
MW
4-P2
Sh
allo
w
MW
5-P2
03A
-P2
01JP
-S
MW
1-P2
MW
6-P1
MW
3-P1
Uni
ts
Mon
th/
year
Para
met
er
Rep
orte
d pa
ram
eter
Sam
ple
ID
Com
pany
taki
ng s
ampl
e
Sulphate mg/l Na Apr-08 QED 94.3 12.3 838 867 438 389 259 17.1 6.17 825Alkalinity - total mg/l CaCO3 Sep-08 QED 131 392 356 31 273 410 45 207 1660 538Ammonia mg/l N Sep-08 QEDCalcium - dissolved mg/l Sep-08 QED 32.9 159.8 793.1 20 140.3 254.2 341 76.9 1252 802.7Chloride - dissolved mg/l Cl Sep-08 QED 36.1 12.1 29.9 <2.6 13.4 27.6 15.2 8.68 9.6 25.7Electrical conductivity uS/cm Sep-08 QED 486 1758 2144 1410 1241 1325 1979 424 >3999 2587Magnesium - dissolved mg/l Mg Sep-08 QED 10.2 <0.3 54.9 1.7 64.4 43.9 65.8 20.1 <0.3 80.7Nitrate mg/l N Sep-08 QEDpH Sep-08 QED 8.36 12.78 7.24 8.83 7.6 6.47 7.8 7.89 13.23 7.7Potassium mg/l K Sep-08 QED 3.2 17.4 7.8 3.6 9 2.3 7.2 2.4 29.2 12.1Sodium mg/l Na Sep-08 QED 73.8 25.4 114.5 11.3 65.9 23.2 81.3 14.7 72.6 168.1
higher than lower guideline value
1632-010 (Mine GW Chemistry).xls 06/02/2009 Page 4 of 5

Appendix A
1632-010 (Processing Site GW Chemistry) 22/12/2008
Ammonia
0
0.05
0.1
0.15
0.2
0.25
Aug-03
Oct-03
Dec-03
Feb-04
Apr-04
Jun-0
4Aug
-04Oct-
04Dec
-04Feb
-05Apr-
05Ju
n-05
Aug-05
Oct-05
Dec-05
Feb-06
Apr-06
Jun-0
6Aug
-06Oct-
06Dec
-06Feb
-07Apr-
07Ju
n-07
Aug-07
Oct-07
Dec-07
Feb-08
Apr-08
Jun-0
8Aug
-08
Date
Am
mon
ia (m
g/l)
BH5-03S - OverburdenLower guideline valueUpper guideline value

Appendix A
1632-010 (Processing Site GW Chemistry) 22/12/2008
Manganese
0
50
100
150
200
250
300
350
400
450
Aug-03
Oct-03
Dec-03
Feb-04
Apr-04
Jun-0
4Aug
-04Oct-
04Dec
-04Feb
-05Apr-
05Ju
n-05
Aug-05
Oct-05
Dec-05
Feb-06
Apr-06
Jun-0
6Aug
-06Oct-
06Dec
-06Feb
-07Apr-
07Ju
n-07
Aug-07
Oct-07
Dec-07
Feb-08
Apr-08
Jun-0
8Aug
-08
Date
Man
gane
se (u
g/l)
BH5-03S - OverburdenLower guideline valueUpper guideline value
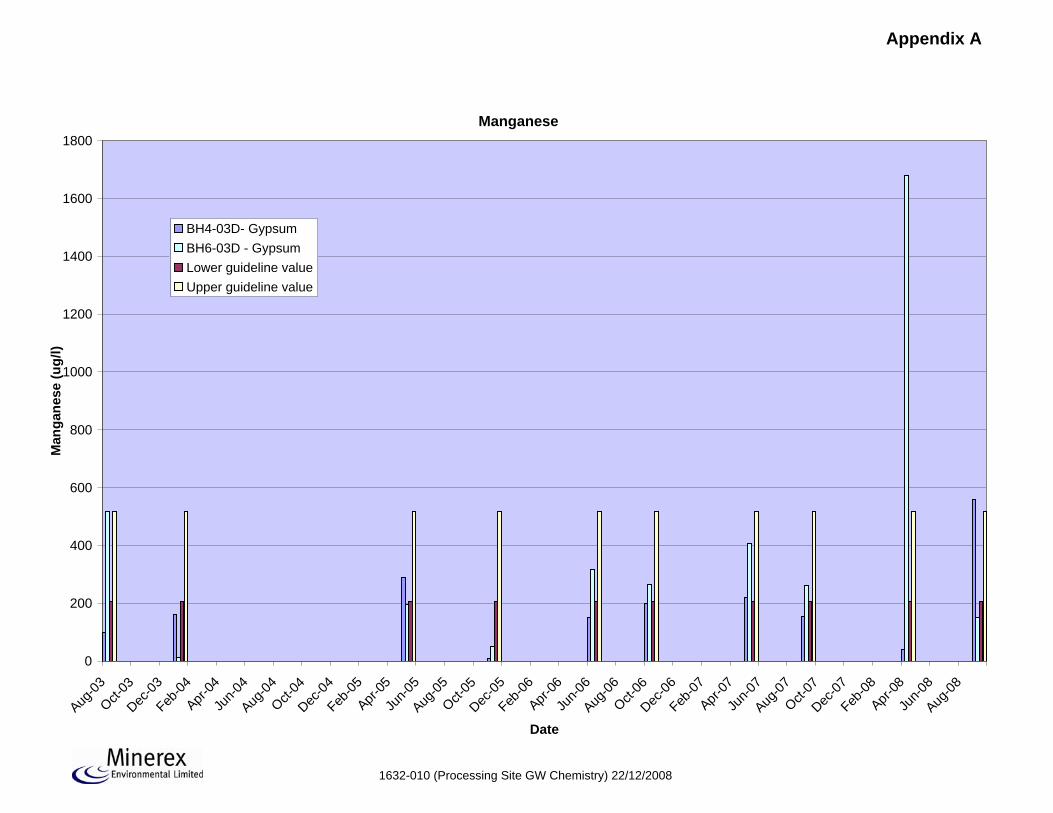
Appendix A
1632-010 (Processing Site GW Chemistry) 22/12/2008
Manganese
0
200
400
600
800
1000
1200
1400
1600
1800
Aug-03
Oct-03
Dec-03
Feb-04
Apr-04
Jun-0
4Aug
-04Oct-
04Dec
-04Feb
-05Apr-
05Ju
n-05
Aug-05
Oct-05
Dec-05
Feb-06
Apr-06
Jun-0
6Aug
-06Oct-
06Dec
-06Feb
-07Apr-
07Ju
n-07
Aug-07
Oct-07
Dec-07
Feb-08
Apr-08
Jun-0
8Aug
-08
Date
Man
gane
se (u
g/l)
BH4-03D- GypsumBH6-03D - GypsumLower guideline valueUpper guideline value

Appendix A
1632-010 (Mine GW Chemistry) 22/12/08
Overburden
0
1
2
3
4
5
6
7
8
9
10
Nov-03
Jan-0
4Mar-
04May
-04Ju
l-04
Sep-04
Nov-04
Jan-0
5Mar-
05May
-05Ju
l-05
Sep-05
Nov-05
Jan-0
6Mar-
06May
-06Ju
l-06
Sep-06
Nov-06
Jan-0
7Mar-
07May
-07Ju
l-07
Sep-07
Nov-07
Jan-0
8Mar-
08May
-08Ju
l-08
Sep-08
Date
Pota
ssiu
m (m
g/l)
M102PALower guideline valueUpper guideline value

Appendix A
1632-010 (Mine GW Chemistry) 22/12/08
Namurian/ Westphalian
0
10
20
30
40
50
60
70
Nov-03
Jan-0
4Mar-
04May
-04Ju
l-04
Sep-04
Nov-04
Jan-0
5Mar-
05May
-05Ju
l-05
Sep-05
Nov-05
Jan-0
6Mar-
06May
-06Ju
l-06
Sep-06
Nov-06
Jan-0
7Mar-
07May
-07Ju
l-07
Sep-07
Nov-07
Jan-0
8Mar-
08May
-08Ju
l-08
Sep-08
Date
Pota
ssiu
m (m
g/l)
MW3-P1Lower guideline valueUpper guideline value
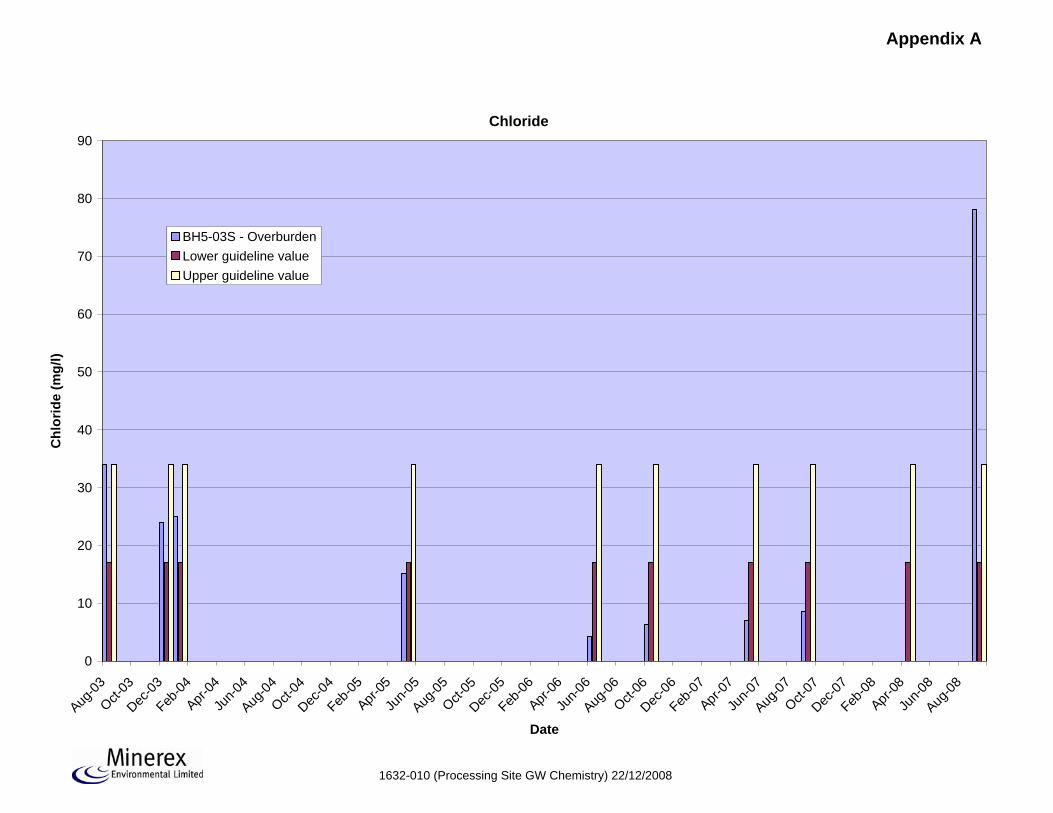
Appendix A
1632-010 (Processing Site GW Chemistry) 22/12/2008
Chloride
0
10
20
30
40
50
60
70
80
90
Aug-03
Oct-03
Dec-03
Feb-04
Apr-04
Jun-0
4Aug
-04Oct-
04Dec
-04Feb
-05Apr-
05Ju
n-05
Aug-05
Oct-05
Dec-05
Feb-06
Apr-06
Jun-0
6Aug
-06Oct-
06Dec
-06Feb
-07Apr-
07Ju
n-07
Aug-07
Oct-07
Dec-07
Feb-08
Apr-08
Jun-0
8Aug
-08
Date
Chl
orid
e (m
g/l)
BH5-03S - OverburdenLower guideline valueUpper guideline value

Appendix A
1632-010 (Mine GW Chemistry) 22/12/08
Gypsum
0
100
200
300
400
500
600
700
800
900
1000
1100
1200
1300
Nov-03
Jan-0
4Mar-
04May
-04Ju
l-04
Sep-04
Nov-04
Jan-0
5Mar-
05May
-05Ju
l-05
Sep-05
Nov-05
Jan-0
6Mar-
06May
-06Ju
l-06
Sep-06
Nov-06
Jan-0
7Mar-
07May
-07Ju
l-07
Sep-07
Nov-07
Jan-0
8Mar-
08May
-08Ju
l-08
Sep-08
Date
Alk
alin
ity (m
g/l)
01JP-SLower guideline valueUpper guideline value
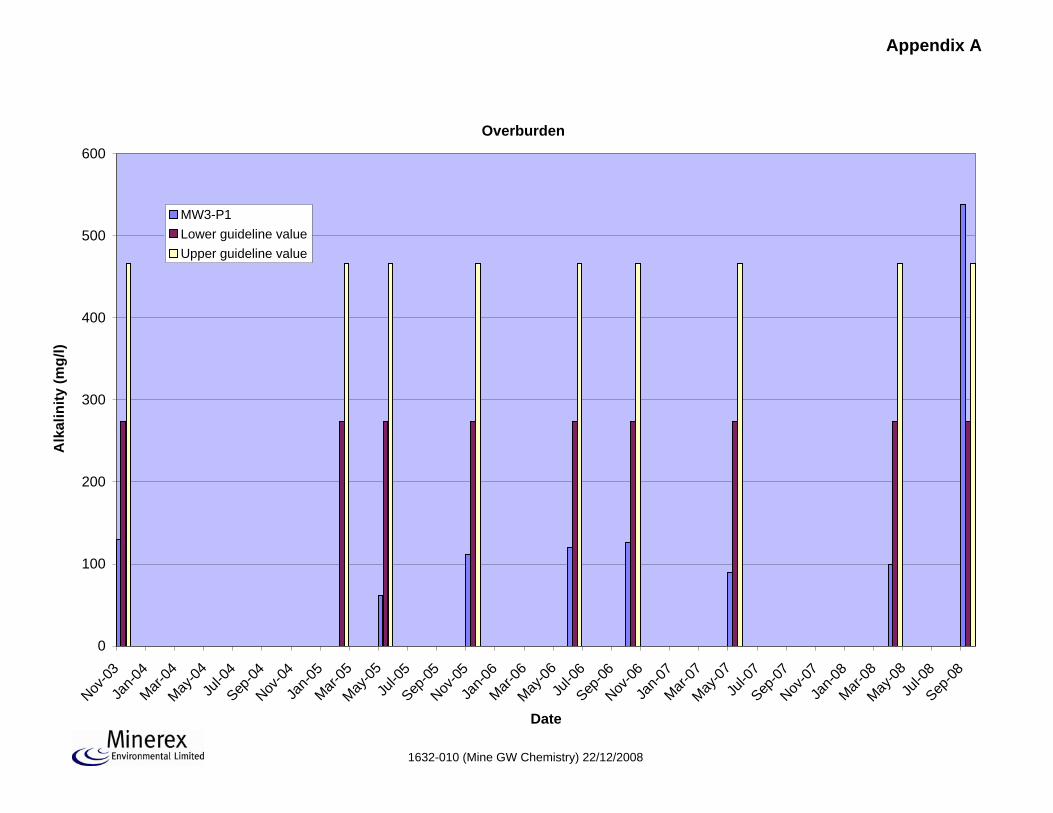
Appendix A
1632-010 (Mine GW Chemistry) 22/12/2008
Overburden
0
100
200
300
400
500
600
Nov-03
Jan-0
4Mar-
04May
-04Ju
l-04
Sep-04
Nov-04
Jan-0
5Mar-
05May
-05Ju
l-05
Sep-05
Nov-05
Jan-0
6Mar-
06May
-06Ju
l-06
Sep-06
Nov-06
Jan-0
7Mar-
07May
-07Ju
l-07
Sep-07
Nov-07
Jan-0
8Mar-
08May
-08Ju
l-08
Sep-08
Date
Alk
alin
ity (m
g/l)
MW3-P1Lower guideline valueUpper guideline value

Appendix A
Geo
logy
O/B
O/B
Gra
vels
Gra
vels
Dol
erite
Gyp
sum
&
mud
ston
e
Gyp
sum
&
mud
ston
e
Mud
ston
e
Mud
ston
e
Wes
tpha
lian
Para
met
er
Uni
ts
Mon
th
sam
pled
Alkalinity - total mg/l Dec-03 MEL 230 130 70 170 50 190 340 140 130Calcium - dissolved mg/l Dec-03 MEL 599.3 412.6 264.1 446.8 76.69 574 180.8 470.9 284.6Chloride - dissolved mg/l Dec-03 MEL 24 19 12 17 56 14 53 20 16Electrical conductivity uS/cm Dec-03 MEL 3000 2390 1471 2310 958 2370 1363 2390 1785Magnesium - dissolved mg/l Mg Dec-03 MEL 0.03 39.98 43.67 51.57 6.1 49.4 41.99 49.43 49Nitrate mg/l NO3 Dec-03 MEL <0.3 <0.3 <0.3 <0.3 <0.3 <0.3 1.1 0.5 1.4pH units pH units Dec-03 MEL 11.69 7.61 7.77 7.66 11.08 7.83 7.16 7.70 7.69pH units pH units Dec-03 MEL 11.08 6.83 7.41 7.44 9.69 7.82 6.94 7.33 7.42Potassium mg/l K Dec-03 MEL 74 5.8 4.4 5.6 11.8 11.8 4.2 6.8 10.8Sodium mg/l Na Dec-03 MEL 296 67 77 31.5 136 39.5 69 65 74Sulphate mg/l SO4 Dec-03 MEL 1488 1586 772 1466 355 1471 456 1550 1005(dissolved) mg/l Solids Dec-03 MEL 1953 1299 1189 2191 557 2757 1072 2210 1533pH pH Aug-03 BNM 7.06 7.05 6.96 7.05 7.36 7.18 7.61Electrical conductivity uS/cm Aug-03 BNM 1463 1503 372 910 372 1830 485Temperature oC Aug-03 BNM 15.2 14.4 14.1 14.4 14.5 14.2 14Ammonia mg/l NH3-N Aug-03 BNM <0.2 3.8 <0.2 <0.2 0.3 <0.2 <0.2Chloride - dissolved mg/l Aug-03 BNM 34 10 11 17 16 14 14Nitrite mg/l N Aug-03 BNM <0.02 <0.02 <0.02 0.02 <0.02 0.02 <0.02Ortho-Phospate mg/l P Aug-03 BNM <0.02 <0.02 <0.02 <0.02 <0.02 <0.02 <0.02Sulphate mg/l Aug-03 BNM 800 2100 76 76 1800 950 111Nitrate mg/l N Aug-03 BNM 0.89 <0.2 0.81 0.2 <0.2 0.22 1.14TOC ug/l Aug-03 BNM <250 5 <5 <250 14 <5Calcium - dissolved mg/l Aug-03 BNM 258 461 58 58 463 446 80Sodium mg/l Aug-03 BNM 38 40 8.6 17 60 12 12Magnesium - dissolved mg/l Aug-03 BNM 40 144 8.7 14 94 43 7.7Potassium mg/l Aug-03 BNM 4 8.2 1.4 4.4 11 4.9 2.8Chromium ug/l Aug-03 BNM <2 <2 <2 <2 <2 <2 <2Manganese - dissolved ug/l Aug-03 BNM 14 81 2 88 97 516 45Nickel ug/l Aug-03 BNM 4 <2 <2 26 2 4 <2Copper ug/l Aug-03 BNM 6 2 <2 7 2 <2 2Zinc ug/l Aug-03 BNM 81 17 42 95 55 87 34Aresnic ug/l Aug-03 BNM 4 <2 <2 2 <2 <2 <2Cadmium ug/l Aug-03 BNM <2 <2 <2 <2 <2 <2 <2Barium - dissolved ug/l Aug-03 BNM 136 94 110 112 64 110 98Lead ug/l Aug-03 BNM <2 <2 <2 2 <2 6 <2Iron mg/l Aug-03 BNM 0.6 1.3 0.1 0.2 1.3 1.1 0.2Boron ug/l Aug-03 BNM 203 462 118 59 598 209 187Mercury ug/l Aug-03 BNM <1 <1 <1 <1 <1 <1 <1pH uS/cm Jan-04 QED 6.9 6.72 7.76 7.73 7.39 7.6 7.6 7.7 7.45Electrical conductivity mg/l Jan-04 QED 1110 1055 331 321 574 903 1024 721 505Temperature mg/l Jan-04 QED 10.3 9.6 10.3 10 9.6 9.1 10.5 9.5 9.7Ammonia mg/l NH3-N Jan-04 QED 0.02 3.8 0.06 0.05 0.26 0.3 0.11 0.05 <0.2Chloride - dissolved mg/l Jan-04 QED 25 10 14 15 16 11 16 61.3 6.8Sulphate mg/l Jan-04 QED 458.4 511 74.7 79 1659 524 1125 116.7 43.5Calcium - dissolved mg/l Jan-04 QED 361 426 59 52 745 70 554 75 49Magnesium - dissolved mg/l Jan-04 QED 42 33 10 14 88 32 39 17 8.5
Com
pany
taki
ng s
ampl
e
Rep
orte
d pa
ram
eter
BH
6-03
D
BH
3-03
S
BH
9-03
S
BH
3-03
D
Sam
ple
ID
BH
9-03
D
BH
5-03
S
BH
2-04
S
BH
4-03
D
BH
2-04
D
BH
1-04
D
1632-010 (Processing Site GW Chemistry) 06/02/2008 Page 1 of 3
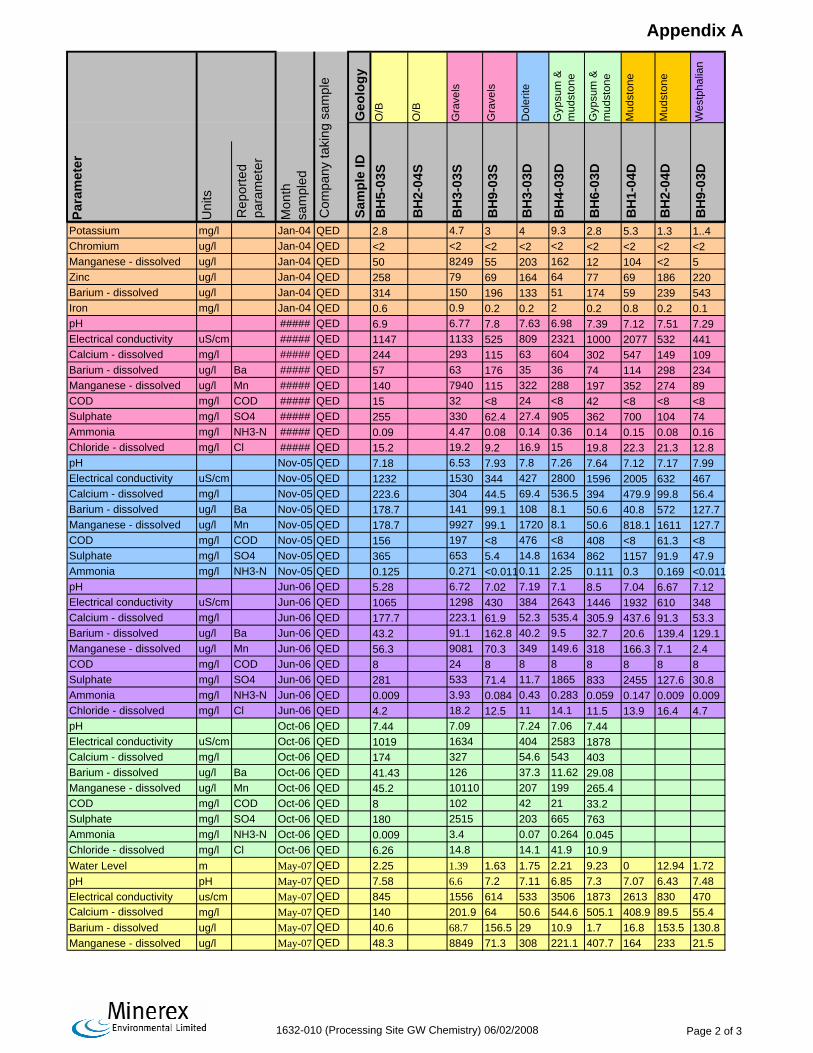
Appendix A
Geo
logy
O/B
O/B
Gra
vels
Gra
vels
Dol
erite
Gyp
sum
&
mud
ston
e
Gyp
sum
&
mud
ston
e
Mud
ston
e
Mud
ston
e
Wes
tpha
lian
Para
met
er
Uni
ts
Mon
th
sam
pled
Com
pany
taki
ng s
ampl
e
Rep
orte
d pa
ram
eter
BH
6-03
D
BH
3-03
S
BH
9-03
S
BH
3-03
D
Sam
ple
ID
BH
9-03
D
BH
5-03
S
BH
2-04
S
BH
4-03
D
BH
2-04
D
BH
1-04
D
Potassium mg/l Jan-04 QED 2.8 4.7 3 4 9.3 2.8 5.3 1.3 1..4Chromium ug/l Jan-04 QED <2 <2 <2 <2 <2 <2 <2 <2 <2Manganese - dissolved ug/l Jan-04 QED 50 8249 55 203 162 12 104 <2 5Zinc ug/l Jan-04 QED 258 79 69 164 64 77 69 186 220Barium - dissolved ug/l Jan-04 QED 314 150 196 133 51 174 59 239 543Iron mg/l Jan-04 QED 0.6 0.9 0.2 0.2 2 0.2 0.8 0.2 0.1pH ##### QED 6.9 6.77 7.8 7.63 6.98 7.39 7.12 7.51 7.29Electrical conductivity uS/cm ##### QED 1147 1133 525 809 2321 1000 2077 532 441Calcium - dissolved mg/l ##### QED 244 293 115 63 604 302 547 149 109Barium - dissolved ug/l Ba ##### QED 57 63 176 35 36 74 114 298 234Manganese - dissolved ug/l Mn ##### QED 140 7940 115 322 288 197 352 274 89COD mg/l COD ##### QED 15 32 <8 24 <8 42 <8 <8 <8Sulphate mg/l SO4 ##### QED 255 330 62.4 27.4 905 362 700 104 74Ammonia mg/l NH3-N ##### QED 0.09 4.47 0.08 0.14 0.36 0.14 0.15 0.08 0.16Chloride - dissolved mg/l Cl ##### QED 15.2 19.2 9.2 16.9 15 19.8 22.3 21.3 12.8pH Nov-05 QED 7.18 6.53 7.93 7.8 7.26 7.64 7.12 7.17 7.99Electrical conductivity uS/cm Nov-05 QED 1232 1530 344 427 2800 1596 2005 632 467Calcium - dissolved mg/l Nov-05 QED 223.6 304 44.5 69.4 536.5 394 479.9 99.8 56.4Barium - dissolved ug/l Ba Nov-05 QED 178.7 141 99.1 108 8.1 50.6 40.8 572 127.7Manganese - dissolved ug/l Mn Nov-05 QED 178.7 9927 99.1 1720 8.1 50.6 818.1 1611 127.7COD mg/l COD Nov-05 QED 156 197 <8 476 <8 408 <8 61.3 <8Sulphate mg/l SO4 Nov-05 QED 365 653 5.4 14.8 1634 862 1157 91.9 47.9Ammonia mg/l NH3-N Nov-05 QED 0.125 0.271 <0.0110.11 2.25 0.111 0.3 0.169 <0.011pH Jun-06 QED 5.28 6.72 7.02 7.19 7.1 8.5 7.04 6.67 7.12Electrical conductivity uS/cm Jun-06 QED 1065 1298 430 384 2643 1446 1932 610 348Calcium - dissolved mg/l Jun-06 QED 177.7 223.1 61.9 52.3 535.4 305.9 437.6 91.3 53.3Barium - dissolved ug/l Ba Jun-06 QED 43.2 91.1 162.8 40.2 9.5 32.7 20.6 139.4 129.1Manganese - dissolved ug/l Mn Jun-06 QED 56.3 9081 70.3 349 149.6 318 166.3 7.1 2.4COD mg/l COD Jun-06 QED 8 24 8 8 8 8 8 8 8Sulphate mg/l SO4 Jun-06 QED 281 533 71.4 11.7 1865 833 2455 127.6 30.8Ammonia mg/l NH3-N Jun-06 QED 0.009 3.93 0.084 0.43 0.283 0.059 0.147 0.009 0.009Chloride - dissolved mg/l Cl Jun-06 QED 4.2 18.2 12.5 11 14.1 11.5 13.9 16.4 4.7pH Oct-06 QED 7.44 7.09 7.24 7.06 7.44Electrical conductivity uS/cm Oct-06 QED 1019 1634 404 2583 1878Calcium - dissolved mg/l Oct-06 QED 174 327 54.6 543 403Barium - dissolved ug/l Ba Oct-06 QED 41.43 126 37.3 11.62 29.08Manganese - dissolved ug/l Mn Oct-06 QED 45.2 10110 207 199 265.4COD mg/l COD Oct-06 QED 8 102 42 21 33.2Sulphate mg/l SO4 Oct-06 QED 180 2515 203 665 763Ammonia mg/l NH3-N Oct-06 QED 0.009 3.4 0.07 0.264 0.045Chloride - dissolved mg/l Cl Oct-06 QED 6.26 14.8 14.1 41.9 10.9Water Level m May-07 QED 2.25 1.39 1.63 1.75 2.21 9.23 0 12.94 1.72pH pH May-07 QED 7.58 6.6 7.2 7.11 6.85 7.3 7.07 6.43 7.48Electrical conductivity us/cm May-07 QED 845 1556 614 533 3506 1873 2613 830 470Calcium - dissolved mg/l May-07 QED 140 201.9 64 50.6 544.6 505.1 408.9 89.5 55.4Barium - dissolved ug/l May-07 QED 40.6 68.7 156.5 29 10.9 1.7 16.8 153.5 130.8Manganese - dissolved ug/l May-07 QED 48.3 8849 71.3 308 221.1 407.7 164 233 21.5
1632-010 (Processing Site GW Chemistry) 06/02/2008 Page 2 of 3

Appendix A
Geo
logy
O/B
O/B
Gra
vels
Gra
vels
Dol
erite
Gyp
sum
&
mud
ston
e
Gyp
sum
&
mud
ston
e
Mud
ston
e
Mud
ston
e
Wes
tpha
lian
Para
met
er
Uni
ts
Mon
th
sam
pled
Com
pany
taki
ng s
ampl
e
Rep
orte
d pa
ram
eter
BH
6-03
D
BH
3-03
S
BH
9-03
S
BH
3-03
D
Sam
ple
ID
BH
9-03
D
BH
5-03
S
BH
2-04
S
BH
4-03
D
BH
2-04
D
BH
1-04
D
COD mg/l May-07 QED 10 37 <8 16 <8 <8 <8 <8 <8Sulphate mg/l May-07 QED 200.2 446 <50 <50 2332 734.4 1687 <50 53.5Ammonia mg/l NH3-N May-07 QED <0.0067 4.45 0.101 0.06 0.242 0.081 0.109 0.027 0.021Chloride - dissolved mg/l May-07 QED 7.069 18.8 12.2 12 14.6 17.1 14.9 16.7 6.82Water Level m Sep-07 QED 2.5 1.27 1.38 1.6 1.74 9.38 0 12.51 1.5pH pH Sep-07 QED 6.46 6.91 7.2 7.37 5.83 6.87 6.59 6.15 7.11Electrical conductivity us/cm Sep-07 QED 999 2099 450 553 3809 2211 2737 1019 351Calcium - dissolved mg/l Sep-07 QED 173 <1 68.4 45 480.7 292.3 387.8 114.3 50Barium - dissolved ug/l Sep-07 QED 55 <1 134.2 29.7 9.3 36.9 15.2 161.8 97.1Manganese - dissolved ug/l Sep-07 QED 143.1 <1 108.7 183 153.3 263 107.2 45.6 53.83COD mg/l Sep-07 QED <8 28 <8 <8 <8 <8 <8 <8 <8Sulphate mg/l Sep-07 QED 174.7 509.5 74 19.9 1596 707.7 1696 156.7 42.6Ammonia mg/l NH3-N Sep-07 QED 0.065 5.49 0.099 0.14 0.38 0.131 0.217 0.11 0.04Chloride - dissolved mg/l Sep-07 QED 8.6 28.2 12.8 <8 14.5 10 13.6 13 7.7
1632-010 (Processing Site GW Chemistry) 06/02/2008 Page 3 of 3

REPORT TO REPORT BY
Irish Gypsum Limited Minerex Environmental LimitedIPPC Licence No. 688 Doc Ref 1632-863 (Final 11-03-09).docCondition 9.3.5
Appendix B
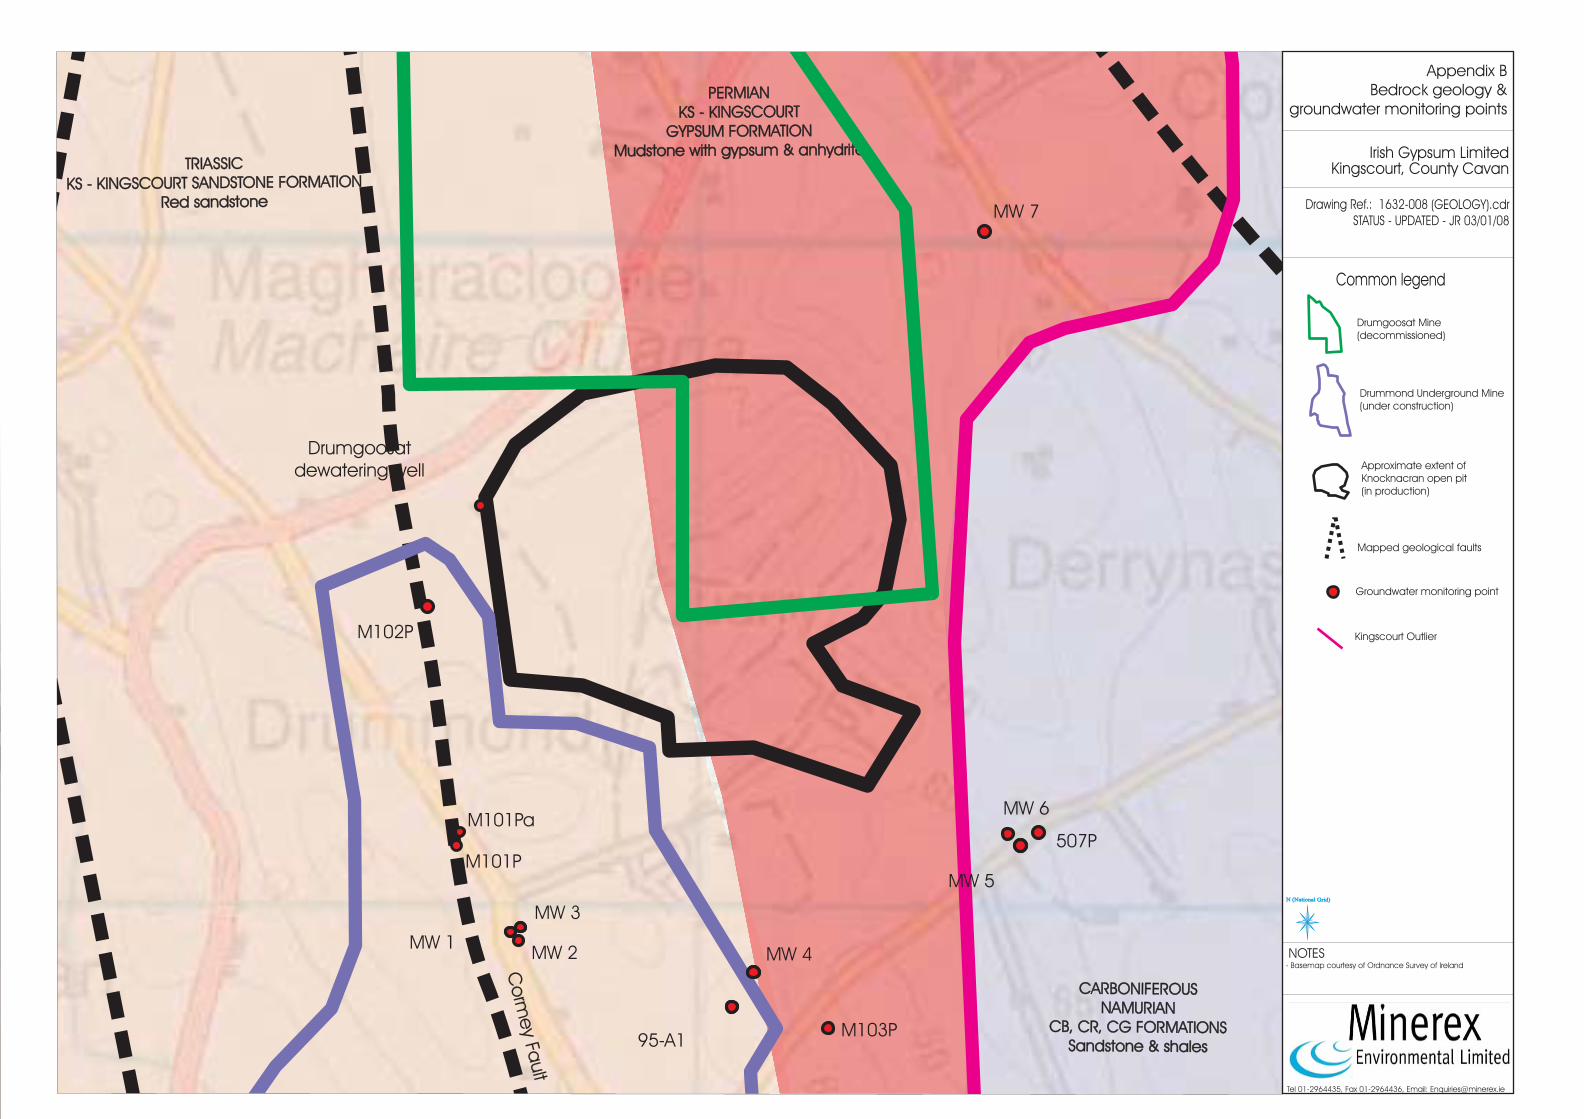
Kin
gsc
ourt
Fa
ult
=W
este
rnBo
und
ary
Fa
ult
Co
rme
yFa
ult
ORDOVICIAN- SILURIANRA - CASTLERAHAN FORMATION
Dark grey quartzite and microconglomerate
CARBONIFEROUSDINANTIAN
MNV-MILVERTON GROUPMicrite, crinoidal grainstone / packstone
TRIASSIC
KS - KINGSCOURT SANDSTONE FORMATION
Red sandstone
TRIASSIC
KS - KINGSCOURT SANDSTONE FORMATION
Red sandstone
PERMIAN
KS - KINGSCOURT
GYPSUM FORMATION
Mudstone with gypsum & anhydrite
PERMIAN
KS - KINGSCOURT
GYPSUM FORMATION
Mudstone with gypsum & anhydrite
CARBONIFEROUS
NAMURIAN
CB, CR, CG FORMATIONS
Sandstone & shales
CARBONIFEROUS
NAMURIAN
CB, CR, CG FORMATIONS
Sandstone & shales
CARBONIFEROUSDINANTIAN
FNG - FINGAL GROUP (Undifferentialted)Dark limestone, shale & micrite
DINANTIANMNV-MILVERTON GROUP
Micrite, crinoidal grainstone / packstone
ORDOVICIAN-SILURIANTM-TAGHART MOUNTAIN FORMATION
Greywacke, massive sandstone & siltstone
WESTPHALIAN - WESUndifferentiated
Grey shale, thin siltstone and sandstone
WESTPHALIAN - WESUndifferentiated
Grey shale, thin siltstone and sandstone
Extent of Kingscourt Outlier
M101P
MW 6
MW 4
MW 7
Drumgoosat
dewatering well
M103P
MW 1
MW 5
95-A1
MW 3
M101Pa
M102P
MW 2
507P
N (National Grid)
TP 4
214,000
197,500
D2
S1
250mdownstream
90
74.80
FG 5
D3-SW 1
PWS 3
SG 1
Iron Pan 1
Peat 1
Soil 2
Ag drain
Road runoffSW 1
Yard runoffSW 1
Drawing Ref.: 1632-008 (GEOLOGY).cdr
STATUS - UPDATED - JR 03/01/08
Common legend
Irish Gypsum Limited
Kingscourt, County Cavan
- Basemap courtesy of Ordnance Survey of Ireland
NOTES
D2
D1-SW 1
Tel 01-2964435, Fax 01-2964436, Email: [email protected]
Drumgoosat Mine
(decommissioned)
Drummond Underground Mine
(under construction)
Approximate extent of
Knocknacran open pit
(in production)
Mw6
Mapped geological faults
N (National Grid)N (National Grid)
Groundwater monitoring point
Appendix B
Bedrock geology &
groundwater monitoring points
Kingscourt Outlier

REPORT TO REPORT BY
Irish Gypsum Limited Minerex Environmental LimitedIPPC Licence No. 688 Doc Ref 1632-863 (Final 11-03-09).docCondition 9.3.5
Appendix C

Clontail Formation
Calcareous red-mica greywacke
Silurian age
Kingscourt Sandstone Formation
Red sandstone
Triassic age
Westphalian (undifferentiated)
Grey shale, thin siltstone & sandstone
Westphalian age
Kingscourt Gypsum Formation
Mudstone with gypsum & anhydrite
Permian age
Fingal Group (undifferentiated)
Dark limestone, shale & micrite
Carboniferous age
Kin
gsc
ourt
Fa
ult
BH03-03S
BH03-03D
BH09-03D
BH09-03S
BH04-03D
95ABH04-03S
96ABH05-03S
BH06-03D
Malone’s Well
BH07-03S
BH06-01D
BH02-03S
BH01-03S
N (National Grid)
TP 4
214,000
197,500
D2
S1
250mdownstream
90
74.80
FG 5
D3-SW 1
PWS 3
SG 1
Iron Pan 1
Peat 1
Soil 2
Ag drain
Road runoffSW 1
Yard runoffSW 1
Drawing Ref.: 1632-008
(PROCESSING SITE) (GEOLOGY).cdr
STATUS - UPDATED - JR 22/12/08
Common legend
Irish Gypsum Limited
Kingscourt, County Cavan
- Basemap courtesy of Ordnance Survey of Ireland
NOTES
D2
D1-SW 1
Tel 01-2964435, Fax 01-2964436, Email: [email protected]
Mw6
Mapped geological faults
N (National Grid)N (National Grid)
Groundwater monitoring point
Appendix C
Processing site, groundwater
monitoring points & WWTP
Wastewater treatment plant

REPORT TO REPORT BY
Irish Gypsum Limited Minerex Environmental LimitedIPPC Licence No. 688 Doc Ref 1632-863 (Final 11-03-09).docCondition 9.3.5
Appendix D

Appendix D
1632-010 (Mine GW Chemistry) 22/12/2008
0.0
20.0
40.0
60.0
80.0
100.0
120.0
140.0
160.0
180.0
200.0
JAN FEB MAR APR MAY JUN JUL AUG SEPT OCT NOV
Month
Rai
nfal
l (m
m)
Rainfall 2008Average

SUMMARY TABLES PRTR(VII)
APPENDIX

| PRTR# : P0519 | Facility Name : Gypsum Industries Limited | Filename : P0519_2008.xls | Return Year : 2008 | 4462 25/03/2009 15:03
Version 1.1.03
REFERENCE YEAR 2008
1. FACILITY IDENTIFICATIONParent Company Name Gypsum Industries Limited
Facility Name Gypsum Industries LimitedPRTR Identification Number P0519
Licence Number P0519-02
Waste or IPPC Classes of ActivityNo. class_name
1.3.0
The extraction and processing (including size reduction, grading and heating) of minerals within the meaning of the Minerals Development Acts, 1940 to 1999, where an activity involves – (a)a metalliferous operation, or(b)any other operation where eit...
Address 1 KingscourtAddress 2 Co. CavanAddress 3Address 4
Country IrelandCoordinates of Location 28102994
River Basin DistrictNACE Code 0729
Main Economic Activity Mining of other non-ferrous metal oresAER Returns Contact Name Aidan Gormley
AER Returns Contact Email Address [email protected] Returns Contact Position Quality/Environmental Manager
AER Returns Contact Telephone Number 042-9698165AER Returns Contact Mobile Phone Number
AER Returns Contact Fax Number 042-9667221Production Volume 0.0
Production Volume UnitsNumber of Installations 2
Number of Operating Hours in Year 0Number of Employees 0
User Feedback/CommentsWeb Address
2. PRTR CLASS ACTIVITIESActivity Number Activity Name3a Underground mining and related operations
3. SOLVENTS REGULATIONS (S.I. No. 543 of 2002)Is it applicable? No
Have you been granted an exemption ?If applicable which activity class applies (as per
Schedule 2 of the regulations) ?Is the reduction scheme compliance route being
used ?
AER Returns Worksheet

4.1 RELEASES TO AIR | PRTR# : P0519 | Facility Name : Gypsum Industries Limited | Filename : P0519_2008.xls | Return Year : 2008 | 25/03/2009 15:03
8 10 18 18 26 26 6 13 6 6 6 6 0SECTION A : SECTOR SPECIFIC PRTR POLLUTANTS
QUANTITYAE-1 BE-1 AE-8 AE-9 BE-4 BE-5 BE-6 AE-10
No. Annex II Name M/C/E Method Code Designation or Description Emission Point 1 Emission Point 2 Emission Point 3 Emission Point 4 Emission Point 5 Emission Point 6 Emission Point 7 Emission Point 8T (Total) KG/Year
A (Accidental) KG/Year
F (Fugitive) KG/Year
02 Carbon monoxide (CO) M PER Flue Gas analyser 0.0 4146.29 0.0 0.0 0.0 0.0 0.0 0.0 4146.29 0.0 0.0
86 Particulate matter (PM10) M ISO 9096
Stationary source emissions. Manual determination of mass concentration of particulate matter 4945.13 961.17 277.36 1141.44 181.62 3.31 32.985 405.29 7948.305 0.0 0.0
08 Nitrogen oxides (NOx/NO2) M PER Flue Gas analyser 10024.77 2457.94 8536.94 926.49 2960.39 72.82 943.37 173.69 26096.41 0.0 0.0* Select a row by double-clicking on the Pollutant Name (Column B) then click the delete button
SECTION B : REMAINING PRTR POLLUTANTS
QUANTITY
No. Annex II Name M/C/E Method Code Designation or Description Emission Point 1 T (Total) KG/Year A (Accidental) KG/Year F (Fugitive) KG/Year0.0 0.0 0.0 0.0
* Select a row by double-clicking on the Pollutant Name (Column B) then click the delete button
SECTION C : REMAINING POLLUTANT EMISSIONS (As required in your Licence)
QUANTITY
Pollutant No. Name M/C/E Method Code Designation or Description Emission Point 1 T (Total) KG/Year A (Accidental) KG/Year F (Fugitive) KG/Year0.0 0.0 0.0 0.0
* Select a row by double-clicking on the Pollutant Name (Column B) then click the delete button
Additional Data Requested from Landfill operators
Landfill: Gypsum Industries LimitedPlease enter summary data on the quantities of methane flared and / or utilised
additional_pollutant_no T (Total) kg/Year M/C/E Method CodeDesignation or
DescriptionFacility Total Capacity m3
per hourTotal estimated methane generation (as per site
model) 0.0 N/AMethane flared 0.0 0.0 (Total Flaring Capacity)
Methane utilised in engine/s 0.0 0.0 (Total Utilising Capacity)Net methane emission (as reported in Section A
above) 0.0 N/A
For the purposes of the National Inventory on Greenhouse Gases, landfill operators are requested to provide summary data on landfill gas (Methane) flared or utilised on their facilities to accompany the figures for total methane generated. Operators should only report their Net methane (CH4) emission to the environment under T(total) KG/yr for Section A: Sector specific PRTR pollutants above. Please complete the table below:
Method Used
RELEASES TO AIRPOLLUTANT METHOD
Method Used
POLLUTANT
RELEASES TO AIR
RELEASES TO AIR
Method UsedMETHOD
POLLUTANT METHODMethod Used

4.2 RELEASES TO WATERS | PRTR# : P0519 | Facility Name : Gypsum Industries Limited | Filename : Facility ID and Activities.xls | Return Year : 2008 | 25/03/2009 15:10
8 16 24 25 33 47 6 7 6 7 6SECTION A : SECTOR SPECIFIC PRTR POLLUTANTS Data on ambient monitoring of storm/surface water or groundwater, conducted as part of your licence requirements, should NOT be submitted under AER / PRTR Reporting as this only concerns Releases from your facility
QUANTITYMSE-1 S-8
No. Annex II Name M/C/E Method Code Designation or Description Emission Point 1 Emission Point 2 T (Total) KG/YearA (Accidental) KG/Year
F (Fugitive) KG/Year
17 Arsenic and compounds (as As) M PER EM 130 ICP -MS 1.737 0.031 1.768 0.0 0.018 Cadmium and compounds (as Cd) M PER EM 130 ICP -MS 0.101 0.002 0.103 0.0 0.079 Chlorides (as Cl) M PER Spectrophotometry 28562.9 0.0 28562.9 0.0 0.019 Chromium and compounds (as Cr) M PER EM 130 ICP -MS 0.938 0.019 0.957 0.0 0.020 Copper and compounds (as Cu) M PER EM 130 ICP -MS 3.04 0.052 3.092 0.0 0.023 Lead and compounds (as Pb) M PER EM 130 ICP -MS 0.634 0.015 0.649 0.0 0.022 Nickel and compounds (as Ni) M PER EM 130 ICP -MS 4.744 0.0544 4.7984 0.0 0.013 Total phosphorus M PER Digestion 107.0 1.7 108.7 0.0 0.0
0.0 0.0 0.0 0.0 0.0* Select a row by double-clicking on the Pollutant Name (Column B) then click the delete button
SECTION B : REMAINING PRTR POLLUTANTS
QUANTITYMSE-1 S-8
No. Annex II Name M/C/E Method Code Designation or Description Emission Point 1 Emission Point 2 T (Total) KG/YearA (Accidental) KG/Year
F (Fugitive) KG/Year
21 Mercury and compounds (as Hg) M PER EM 130 ICP -MS 0.03 0.0005 0.0305 0.0 0.00.0 0.0 0.0 0.0 0.0
* Select a row by double-clicking on the Pollutant Name (Column B) then click the delete button
SECTION C : REMAINING POLLUTANT EMISSIONS (as required in your Licence)
QUANTITYMSE-1 S-8
Pollutant No. Name M/C/E Method Code Designation or Description Emission Point 1 Emission Point 2 T (Total) KG/YearA (Accidental) KG/Year
F (Fugitive) KG/Year
238 Ammonia (as N) M PER Spectrophotometry 93.0 0.0 93.0 0.0 0.0205 Antimony (as Sb) M PER EM 130 ICP -MS 0.279 0.0075 0.2865 0.0 0.0303 BOD M PER EW 001 BOD 4803.0 109.3 4912.3 0.0 0.0
306 COD M PEREW 094 COD by closed reflux colorimetry 9742.0 256.6 9998.6 0.0 0.0
321 Manganese (as Mn) M PER EM 130 ICP -MS 33.0 0.0 33.0 0.0 0.0324 Mineral oils M PER Extraction / GC-FID 48.0 0.0 48.0 0.0 0.0327 Nitrate (as N) M PER Spectrophotometry 856.0 0.0 856.0 0.0 0.0370 Selenium M PER EM 130 ICP -MS 0.71 0.011 0.721 0.0 0.0343 Sulphate M PER Spectrophotometry 1655809.0 11860.0 1667669.0 0.0 0.0
240 Suspended Solids M PERStandard Method 2540-F Gravimetric 20935.0 233.2 21168.2 0.0 0.0
371 Tellurium M PER EM 130 ICP -MS 1.319 0.027 1.346 0.0 0.0358 Tin M PER EM 130 ICP -MS 1.014 0.016 1.03 0.0 0.0347 Total heavy metals M PER EM 130 ICP -MS 15.318 0.253 15.571 0.0 0.0314 Fats, Oils and Greases M PER Infra Red Measurement 15.6 0.0 15.6 0.0 0.0
0.0 0.0 0.0 0.0 0.0* Select a row by double-clicking on the Pollutant Name (Column B) then click the delete button
RELEASES TO WATERS
RELEASES TO WATERS
Method Used
POLLUTANTMethod Used
POLLUTANT
POLLUTANTRELEASES TO WATERS
Method Used

5. ONSITE TREATMENT & OFFSITE TRANSFERS OF WASTE | PRTR# : P0519 | Facility Name : Gypsum Industries Limited | Filename : Facility ID and Activities.xls | Return Year : 2008 | 25/03/2009 15:12
5 42 41
Transfer DestinationEuropean Waste
Code HazardousQuantity T/Year Description of Waste
Waste Treatment Operation M/C/E Method Used
Location of Treatment
Name and Licence / Permit No. of Recoverer / Disposer /
BrokerAddress of Recoverer /
Disposer / Broker
Name and Address of Final Destination i.e. Final
Recovery / Disposal Site (HAZARDOUS WASTE
ONLY)
Licence / Permit No. of Final Destination i.e. Final
Recovery / Disposal Site (HAZARDOUS WASTE
ONLY)
To Other Countries 15 01 01 No 42.86 Paper and Cardboard Packaging R3 M Weighed Abroad
CWS Recycling. Waste Permit No. ROC 1105. Waste Collection Permit MH 2005/18B
CWS Lisnalea Business Park, 195 Bessbrook Rd. Mount Norris, Co. Armagh. BT 602 UD
Within the Country 15 01 01 No 46.74 Paper and Cardboard Packaging R3 M Weighed Offsite in Ireland
Midland Waste. Waste Licence No WO-131-2 Waste Collection Permit MH 2001/04D
Midland Waste. Proudstown Rd. Navan, Co.Meath.
Within the Country 15 01 03 No 120.12 Timber Packaging R3 M Weighed Offsite in Ireland
Owen Duffy. Waste Collection Permit MH2001/29C
Owen Duffy. Clonturk, Ballymackney, Co.Louth.
Within the Country 15 01 03 No 76.94 Timber Packaging R3 M Weighed Offsite in Ireland
Midland Waste. Waste Licence No WO-131-2 Waste Collection Permit MH 2001/04D
Midland Waste. Proudstown Rd. Navan, Co.Meath.
Within the Country 16 01 17 No 56.8 Ferrous Metal R4 M Weighed Offsite in Ireland
Charles Byrne Waste Collection Permit No MH 2005/95C
Charles Byrne, Dernascobe, Magheracloone, Carrickmacross, Co. Monaghan
Within the Country 20 03 01 No 126.24 Municipal Waste D1 M Weighed Offsite in Ireland
Midland Waste. Waste Licence No WO-131-2 Waste Collection Permit MH 2001/04D
Midland Waste. Proudstown Rd. Navan, Co.Meath.
Within the Country 20 03 01 No 14.36 Municipal Waste D1 M Weighed Offsite in Ireland
Oxigen. Waste Licence No WO-152-03. Waste Collection Permit No MH2001/046E
Oxigen Commercial Limited. Coes Rd. Dundalk, Co.Louth.
Within the Country 20 03 01 No 403.2 Municipal Waste D1 E Volume Calculation Offsite in Ireland
Oxigen. Waste Licence No WO-152-03. Waste Collection Permit No MH2001/046E
Oxigen Commercial Limited. Coes Rd. Dundalk, Co.Louth.
Within the Country 20 03 01 No 56.16 Municipal Waste; Dry Recyclables R3 E Volume Calculation Offsite in Ireland
Oxigen. Waste Licence No WO-152-03. Waste Collection Permit No MH2001/046E
Oxigen Commercial Limited. Coes Rd. Dundalk, Co.Louth.
Within the Country 15 01 02 No 0.4 Plastic Packaging R3 M Weighed Offsite in IrelandShabra Plastics Limited, WCP MH2001/068D
Shabra Plastics Limited, Killycard Industrial Estate, Bree, Castleblaney, Co.Monaghan
Within the Country 15 01 02 No 0.36 Plastic Packaging R3 M Weighed Offsite in Ireland
Midland Waste. Waste Licence No WO-131-2 Waste Collection Permit MH 2001/04D
Midland Waste. Proudstown Rd. Navan, Co.Meath.
Within the Country 20 03 04 No 469.08 Septic Tank Sludge D8 M Weighed Offsite in Ireland
Owen Duffy. Waste Collection Permit MH2001/29C
Owen Duffy. Clonturk, Ballymackney, Co.Louth.
Within the Country 10 13 99 No 12185 Gypsum Waste D1 E Volume Calculation Onsite in IrelandGypsum Industries Limited P0519-02
Gypsum Industries Limited, Kingscourt, Co.Cavan
Within the Country 10 13 99 No 17804 Gypsum Waste R5 M Weighed Onsite in IrelandGypsum Industries Limited P0519-02
Gypsum Industries Limited, Kingscourt, Co.Cavan
Method Used

Transfer DestinationEuropean Waste
Code HazardousQuantity T/Year Description of Waste
Waste Treatment Operation M/C/E Method Used
Location of Treatment
Name and Licence / Permit No. of Recoverer / Disposer /
BrokerAddress of Recoverer /
Disposer / Broker
Name and Address of Final Destination i.e. Final
Recovery / Disposal Site (HAZARDOUS WASTE
ONLY)
Licence / Permit No. of Final Destination i.e. Final
Recovery / Disposal Site (HAZARDOUS WASTE
ONLY)
Method Used
Within the Country 20 01 21 Yes 0.243 Fluorescent tubes and bulbs R5 M Weighed Offsite in Ireland
Irish Lamp Recycling. WASTE Permit No: 02/2000B. Waste Collection Permit MH2001/101D
Irish Lamp Recycling. Athy, Co. Kildare
Mercury contaminated filters and sludge; EWC 060404 Claushuis Metaals, 3899AH Zeewolde, Holland for recycling. Glass, EWC 200102 processed in Irish Lamp and reused as raw material in the glass industry. End caps EWC 200140, forwarded for recycling to Midland Scrap Metal Co. Mountmellick, Co Laois.
Claushuis Metaals, 3899AH Zeewolde, Holland Permit MB/00.091030/A (GS van Flevoland). Midland Scrap Metal Co. Mountmellick, Co Laois Permit No.WMP005
Within the Country 20 01 35 Yes 2.712 Waste electrical and electronic waste R4 M Weighed Offsite in Ireland
Irish Lamp Recycling. WASTE Permit No: 02/2000B. Waste Collection Permit MH2001/101D
Irish Lamp Recycling. Athy, Co. Kildare
Waste Electronic Electrical Equipment. forwarded for shredding and recovery. KMK Metals, Tullamore, Co. Offaly.
KMK Metals, Tullamore, Co. Offaly. EPA Licence No. 113-2
Within the Country 13 02 08 Yes 10.76 Waste Oil R9 M Weighed Offsite in Ireland
Enva Ireland Limited. Waste Licence No: WO-184-01. Waste Collection Permit No: MH 2001/107D
Enva Ireland Limited. Clonminam Industrial Estate, Portlaoise, Co. Laois
Enva Ireland Limited. Clonminam Industrial Estate, Portlaoise, Co. Laois
Enva Ireland Limited. Waste Licence No: WO-184-01. Waste Collection Permit No: MH 2001/107D
Within the Country 13 05 03 Yes 49.06 Oily Water R9 M Weighed Offsite in Ireland
Enva Ireland Limited. Waste Licence No: WO-184-01. Waste Collection Permit No: MH 2001/107D
Enva Ireland Limited. Clonminam Industrial Estate, Portlaoise, Co. Laois
Enva Ireland Limited. Clonminam Industrial Estate, Portlaoise, Co. Laois
Enva Ireland Limited. Waste Licence No: WO-184-01. Waste Collection Permit No: MH 2001/107D
To Other Countries 13 02 08 Yes 0.205 Waste Lubricating Grease R1 M Weighed Abroad
Enva Ireland Limited. Waste Licence No: WO-184-01. Waste Collection Permit No: MH 2001/107D
Enva Ireland Limited. Clonminam Industrial Estate, Portlaoise, Co. Laois Lindenschmidt KG Umwelt
Lindenschmidt KG Umwelt. Registration No 04 714 98089 Rev1
To Other Countries 13 08 99 Yes 0.6561 Waste Lubricating Grease containers R1 M Weighed Abroad
Enva Ireland Limited. Waste Licence No: WO-184-01. Waste Collection Permit No: MH 2001/107D
Enva Ireland Limited. Clonminam Industrial Estate, Portlaoise, Co. Laois Lindenschmidt KG Umwelt
Lindenschmidt KG Umwelt. Registration No 04 714 98089 Rev1
To Other Countries 13 08 99 Yes 3.565 Solid Oily Waste R1 M Weighed Abroad
Enva Ireland Limited. Waste Licence No: WO-184-01. Waste Collection Permit No: MH 2001/107D
Enva Ireland Limited. Clonminam Industrial Estate, Portlaoise, Co. Laois Lindenschmidt KG Umwelt
Lindenschmidt KG Umwelt. Registration No 04 714 98089 Rev1
To Other Countries 15 02 02 Yes 1.68 Oil Filters R1 M Weighed Abroad
Enva Ireland Limited. Waste Licence No: WO-184-01. Waste Collection Permit No: MH 2001/107D
Enva Ireland Limited. Clonminam Industrial Estate, Portlaoise, Co. Laois Lindenschmidt KG Umwelt
Lindenschmidt KG Umwelt. Registration No 04 714 98089 Rev1
Within the Country 13 05 03 Yes 65.64 Interceptor Sludge R9 M Weighed Offsite in Ireland
Enva Ireland Limited. Waste Licence No: WO-184-01. Waste Collection Permit No: MH 2001/107D
Enva Ireland Limited. Clonminam Industrial Estate, Portlaoise, Co. Laois
Enva Ireland Limited. Clonminam Industrial Estate, Portlaoise, Co. Laois
Enva Ireland Limited. Waste Licence No: WO-184-01. Waste Collection Permit No: MH 2001/107D
To Other Countries 16 06 01 Yes 0.848 Lead acid Batteries R4 M Weighed Abroad
Return batt Ltd. Waste Permit 97/2002A. Waste Collection Permit MH 2001/61D
Return batt Ltd. Old Mill Industrial Estate, Kill, Co. Kildare.
HJ Enthoven (Matlock UK), Derbyshire, UK. GB DE42LP
HJ Enthoven (Matlock UK) Licence No BL 5598
To Other Countries 16 06 03 Yes 0.134 Primary Batteries R4 M Weighed Abroad
Return batt Ltd. Waste Permit 97/2002A. Waste Collection Permit MH 2001/61D
Return batt Ltd. Old Mill Industrial Estate, Kill, Co. Kildare.
Accurec Recycling, Mulheim, Germany
Accurec Recycling, Licence No E11715338
To Other Countries 16 06 04 No 0.061 Alkaline batteries R4 M Weighed Abroad
Return batt Ltd. Waste Permit 97/2002A. Waste Collection Permit MH 2001/61D
Return batt Ltd. Old Mill Industrial Estate, Kill, Co. Kildare.
Accurec Recycling, Mulheim, Germany
Accurec Recycling, Licence No E11715338
Within the Country 16 05 06 Yes 2.077 IBC's D9 M Weighed Offsite in Ireland
Enva Ireland Limited. Waste Licence No: WO-041-01. Waste Collection Permit No: MH 2001/107D
Enva Ireland Limited. Smithstown Industrial Estate Shannon
Enva Ireland Limited. Smithstown Industrial Estate Shannon
Enva Ireland Limited. Waste Licence No: WO-041-01. Waste Collection Permit No: MH 2001/107D
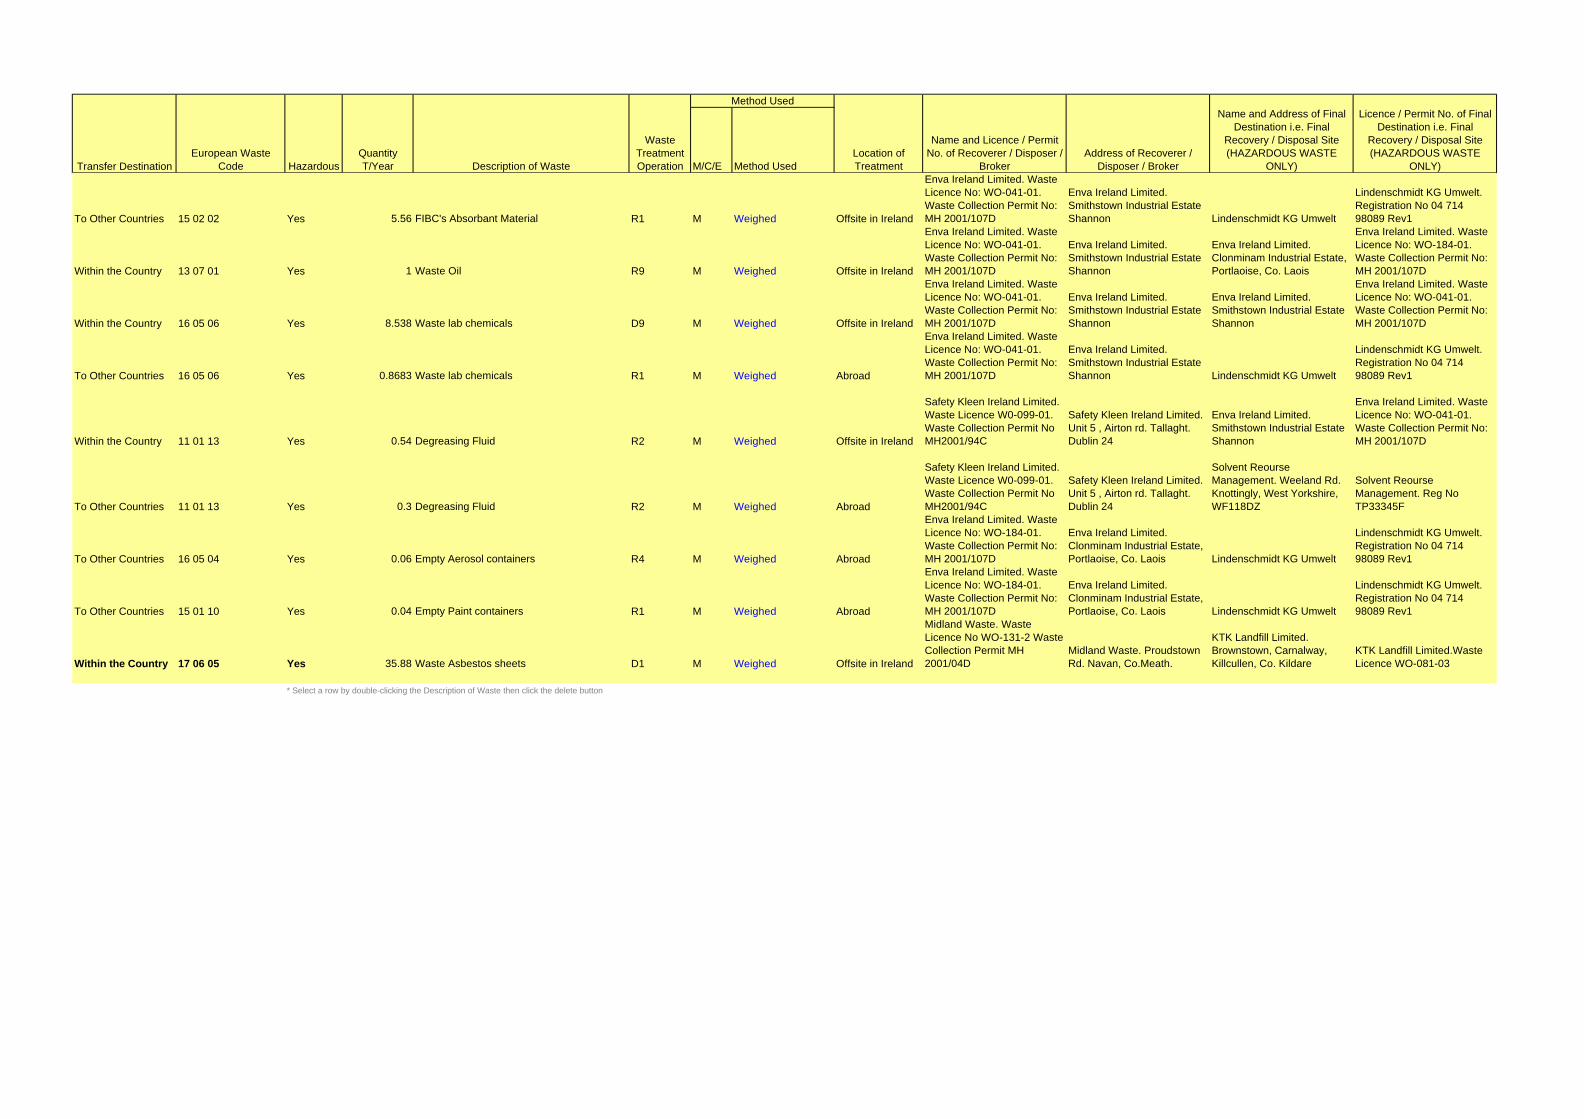
Transfer DestinationEuropean Waste
Code HazardousQuantity T/Year Description of Waste
Waste Treatment Operation M/C/E Method Used
Location of Treatment
Name and Licence / Permit No. of Recoverer / Disposer /
BrokerAddress of Recoverer /
Disposer / Broker
Name and Address of Final Destination i.e. Final
Recovery / Disposal Site (HAZARDOUS WASTE
ONLY)
Licence / Permit No. of Final Destination i.e. Final
Recovery / Disposal Site (HAZARDOUS WASTE
ONLY)
Method Used
To Other Countries 15 02 02 Yes 5.56 FIBC's Absorbant Material R1 M Weighed Offsite in Ireland
Enva Ireland Limited. Waste Licence No: WO-041-01. Waste Collection Permit No: MH 2001/107D
Enva Ireland Limited. Smithstown Industrial Estate Shannon Lindenschmidt KG Umwelt
Lindenschmidt KG Umwelt. Registration No 04 714 98089 Rev1
Within the Country 13 07 01 Yes 1 Waste Oil R9 M Weighed Offsite in Ireland
Enva Ireland Limited. Waste Licence No: WO-041-01. Waste Collection Permit No: MH 2001/107D
Enva Ireland Limited. Smithstown Industrial Estate Shannon
Enva Ireland Limited. Clonminam Industrial Estate, Portlaoise, Co. Laois
Enva Ireland Limited. Waste Licence No: WO-184-01. Waste Collection Permit No: MH 2001/107D
Within the Country 16 05 06 Yes 8.538 Waste lab chemicals D9 M Weighed Offsite in Ireland
Enva Ireland Limited. Waste Licence No: WO-041-01. Waste Collection Permit No: MH 2001/107D
Enva Ireland Limited. Smithstown Industrial Estate Shannon
Enva Ireland Limited. Smithstown Industrial Estate Shannon
Enva Ireland Limited. Waste Licence No: WO-041-01. Waste Collection Permit No: MH 2001/107D
To Other Countries 16 05 06 Yes 0.8683 Waste lab chemicals R1 M Weighed Abroad
Enva Ireland Limited. Waste Licence No: WO-041-01. Waste Collection Permit No: MH 2001/107D
Enva Ireland Limited. Smithstown Industrial Estate Shannon Lindenschmidt KG Umwelt
Lindenschmidt KG Umwelt. Registration No 04 714 98089 Rev1
Within the Country 11 01 13 Yes 0.54 Degreasing Fluid R2 M Weighed Offsite in Ireland
Safety Kleen Ireland Limited. Waste Licence W0-099-01. Waste Collection Permit No MH2001/94C
Safety Kleen Ireland Limited. Unit 5 , Airton rd. Tallaght. Dublin 24
Enva Ireland Limited. Smithstown Industrial Estate Shannon
Enva Ireland Limited. Waste Licence No: WO-041-01. Waste Collection Permit No: MH 2001/107D
To Other Countries 11 01 13 Yes 0.3 Degreasing Fluid R2 M Weighed Abroad
Safety Kleen Ireland Limited. Waste Licence W0-099-01. Waste Collection Permit No MH2001/94C
Safety Kleen Ireland Limited. Unit 5 , Airton rd. Tallaght. Dublin 24
Solvent Reourse Management. Weeland Rd. Knottingly, West Yorkshire, WF118DZ
Solvent Reourse Management. Reg No TP33345F
To Other Countries 16 05 04 Yes 0.06 Empty Aerosol containers R4 M Weighed Abroad
Enva Ireland Limited. Waste Licence No: WO-184-01. Waste Collection Permit No: MH 2001/107D
Enva Ireland Limited. Clonminam Industrial Estate, Portlaoise, Co. Laois Lindenschmidt KG Umwelt
Lindenschmidt KG Umwelt. Registration No 04 714 98089 Rev1
To Other Countries 15 01 10 Yes 0.04 Empty Paint containers R1 M Weighed Abroad
Enva Ireland Limited. Waste Licence No: WO-184-01. Waste Collection Permit No: MH 2001/107D
Enva Ireland Limited. Clonminam Industrial Estate, Portlaoise, Co. Laois Lindenschmidt KG Umwelt
Lindenschmidt KG Umwelt. Registration No 04 714 98089 Rev1
Within the Country 17 06 05 Yes 35.88 Waste Asbestos sheets D1 M Weighed Offsite in Ireland
Midland Waste. Waste Licence No WO-131-2 Waste Collection Permit MH 2001/04D
Midland Waste. Proudstown Rd. Navan, Co.Meath.
KTK Landfill Limited. Brownstown, Carnalway, Killcullen, Co. Kildare
KTK Landfill Limited.Waste Licence WO-081-03
* Select a row by double-clicking the Description of Waste then click the delete button

DRAWING OF LANDFILL SITE(VIII)
APPENDIX
