gypsum -- phase ii benchmark...
TRANSCRIPT

Final Report
1
h:\projects\em-260\17000 projects\17304 ppaqcc dti eu ets ner spreadsheet\c - client\final reports 200306\gypsum -- phase ii benchmark review.doc
March 2006
17304 © Entec
7. Gypsum
7.1 This Section
This section covers the gypsum sector (“Contract M”), as part of an overall project for DTI on
“EU Emissions Trading Scheme (ETS) Phase II – UK New Entrants Spreadsheet revisions”.
The overall aim of this project is to validate and revise appropriately the existing New Entrants
(NE) allocation spreadsheet. The following sub-sections present the findings for this sector.
7.2 Background and Sector Description
7.2.1 Sector Structure (DEFRA 2005b, WRAP 2005)
The gypsum sector within the UK comprises three major companies (British Gypsum, Knauf
and Lafarge). The sector’s main output is plaster products for use in the construction industry.
Gypsum (calcium sulphate dihydrate, CaSO4.2H2O) is a mineral that has found many uses in the
construction industry, from use as a retarding additive in cement to being the main compound
used in industrial building plasters and wallboards (plasterboard). There are two main forms of
gypsum that are used by the sector:
• Natural gypsum (mined); and,
• Synthetic desulphogypsum (a byproduct from flue gas desulphurisation at large
power plants).
The total UK production of gypsum (natural and synthetic) in 2000 was estimated as
approximately 3 million tonnes. UK annual production of bagged plaster in 2000 was around
700,000 tonnes (more than 60 million bags) and over 200 million square metres (Mm2) of
plasterboard. UK production levels of all types of gypsum products have increased since 2000
to meet market demand. The UK gypsum industry directly employs approximately 2,500 with
over 20,000 indirectly employed as merchants, installers, etc. The gypsum industry is one of
the few fully integrated industries within the field of construction products. The companies
which mine gypsum also process it and manufacture the value-added products and systems used
extensively in construction and other industries.
The sector operators are part of a Climate Change Agreement (CCA) through the Gypsum
Products Development Association (GPDA). This agreement was revised in 2004 and sets a
sector target to reduce specific energy consumption by 8.1% from 2000 to 2010 (DEFRA
2005c). The sites in the CCA each use different measures of production to define their specific
energy consumption but kWh/m2 of plasterboard is the most common. CCA data indicates that
all gypsum facilities were re-certified at the end of 2004 either because they have met their
individual targets outright, or through a mixture of trading and/or product mix corrections. The
GPDA (2006) have stated that they believe UK manufacturing plants are amongst the most
efficient in Europe, although at the time of writing there is no specific independent information
available to confirm this.
Final Report
2
h:\projects\em-260\17000 projects\17304 ppaqcc dti eu ets ner spreadsheet\c - client\final reports 200306\gypsum -- phase ii benchmark review.doc
March 2006
17304 © Entec
The overall demand for gypsum in the UK for all uses in 2004 is estimated to be 4.6-5.0 Mtpa
(WRAP 2005). It is estimated that, by 2010 the overall demand for gypsum in the UK will rise
by 2.0–2.5 Mtpa, to a reach an overall total of 6.6–7.5 Mtpa (WRAP 2005). It is predicted that
by 2010 the plasterboard sector will have grown to utilise approximately 5.0 Mtpa (WRAP
2005). A recent report by Oxford Economic Forecasting predicts gypsum sector growth rates of
5% per annum with a corresponding 34% increase in sector CO2 emissions over the period
2008-2012 (OEF 2006). These growth rates are comfortably in excess of those recorded by the
construction sector and reflect a rising share of gypsum products in the construction material
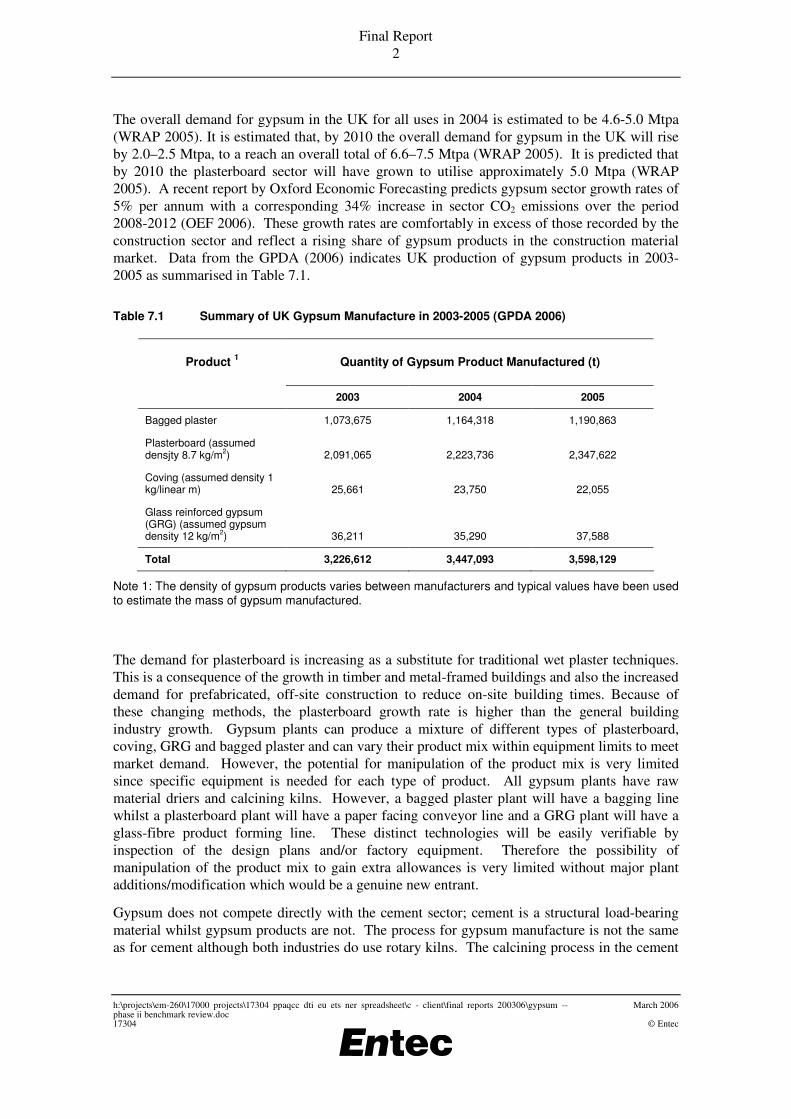
market. Data from the GPDA (2006) indicates UK production of gypsum products in 2003-
2005 as summarised in Table 7.1.
Table 7.1 Summary of UK Gypsum Manufacture in 2003-2005 (GPDA 2006)
Quantity of Gypsum Product Manufactured (t) Product 1
2003 2004 2005
Bagged plaster 1,073,675 1,164,318 1,190,863
Plasterboard (assumed densjty 8.7 kg/m
2) 2,091,065 2,223,736 2,347,622
Coving (assumed density 1 kg/linear m) 25,661 23,750 22,055
Glass reinforced gypsum (GRG) (assumed gypsum density 12 kg/m
2) 36,211 35,290 37,588
Total 3,226,612 3,447,093 3,598,129
Note 1: The density of gypsum products varies between manufacturers and typical values have been used to estimate the mass of gypsum manufactured.
The demand for plasterboard is increasing as a substitute for traditional wet plaster techniques.
This is a consequence of the growth in timber and metal-framed buildings and also the increased
demand for prefabricated, off-site construction to reduce on-site building times. Because of
these changing methods, the plasterboard growth rate is higher than the general building
industry growth. Gypsum plants can produce a mixture of different types of plasterboard,
coving, GRG and bagged plaster and can vary their product mix within equipment limits to meet
market demand. However, the potential for manipulation of the product mix is very limited
since specific equipment is needed for each type of product. All gypsum plants have raw
material driers and calcining kilns. However, a bagged plaster plant will have a bagging line
whilst a plasterboard plant will have a paper facing conveyor line and a GRG plant will have a
glass-fibre product forming line. These distinct technologies will be easily verifiable by
inspection of the design plans and/or factory equipment. Therefore the possibility of
manipulation of the product mix to gain extra allowances is very limited without major plant
additions/modification which would be a genuine new entrant.
Gypsum does not compete directly with the cement sector; cement is a structural load-bearing
material whilst gypsum products are not. The process for gypsum manufacture is not the same
as for cement although both industries do use rotary kilns. The calcining process in the cement

Final Report
3
h:\projects\em-260\17000 projects\17304 ppaqcc dti eu ets ner spreadsheet\c - client\final reports 200306\gypsum -- phase ii benchmark review.doc
March 2006
17304 © Entec
sector involves the release of process CO2, whereas in the gypsum sector no process CO2 is
released from calcining.
Approximately 360 million m2 of plasterboard was used in UK construction in 2004 (ONS
2005), of which 40 million m2 (11%) was net imports. Detailed statistics on waste plasterboard
arisings are currently scarce, but it is estimated that some 300,000 tonnes of waste plasterboard
are generated each year from new construction activity, largely as offcuts (WRAP 2005).
Plasterboard waste arising out of demolition and refurbishment projects is more difficult to
quantify, but may amount to between 0.5 and 1.0 million tonnes per year. The majority of
plasterboard waste has traditionally been landfilled, as it has been classified as a non-hazardous
inert waste able to be co-disposed of with other wastes. However, since July 2005, the EU
Landfill Directive requires that high sulphate wastes (including plasterboard and other waste
gypsum products) be landfilled in separately engineered cells, segregated from other waste
types, in non-hazardous landfill sites. Research programmes are underway in the sector to
explore opportunities to recycle plasterboard into the gypsum production process. In future this
may lead to changes in the specific fuel use and CO2 emissions of the sector which is an issue
for new entrant allocation.
Flue-gas desulphurisation (FGD) of power station emissions is the largest production method of
gypsum used in plasterboard manufacture. The emission stacks of certain coal fired power
stations incorporate ‘scrubbers’ which remove much of the sulphur from the waste gas, so
reducing emissions of sulphur dioxide. The by-product of this process is gypsum. This gypsum
is also sometimes referred to as desulphogypsum (DSG). Its use is increasing as the technology
is installed in more power stations under the requirements of the Large Combustion Plant
Directive and the IPPC Directive. It is increasingly being used in plasterboard manufacture as it
is a very pure form of gypsum. It is noted that Gypsum companies have a majority control over
UK mined gypsum so that DSG is an attractive source for other gypsum users, particularly
cement manufacturers. The table below summarises UK gypsum sources in 2002 and 2004
indicating a rise in the use of synthetic gypsum to at least 40% of total UK consumption.
Further growth is DSG use by the gypsum sector is expected as more UK power plants install
FGD units, thereby increasing the availability of DSG. DSG has a higher purity than natural
gypsum and is a desirable feedstock. It is noted that DSG typically has higher moisture levels
than natural gypsum and therefore requires more energy for drying in the gypsum
manufacturing process. Otherwise DSG is used in the same products as synthetic gypsum
allowing higher product quality to be achieved but at the expense of more energy use for drying.
Table 7.2 Summary of UK Gypsum Sources in 2002 and 2004 (WRAP 2005)
Gypsum Source Quantity in 2002 (Mt) Quantity in 2004 (Mt)
Natural gypsum (UK mined) 1.7 1.7
Synthetic gypsum (UK produced) 0.8-1.2 1.9
Net imports (natural and synthetic) 0.6-0.8 1.0-1.5
Total 3.1-3.7 4.6-5.1
The European gypsum and anhydrite industry operates around 220 sites and generates
employment directly and indirectly for 400,000 people (WRAP 2005). The overall European
Final Report
4
h:\projects\em-260\17000 projects\17304 ppaqcc dti eu ets ner spreadsheet\c - client\final reports 200306\gypsum -- phase ii benchmark review.doc
March 2006
17304 © Entec
sector turnover is estimated at over €3 billion. Worldwide natural gypsum resources are large
and widely distributed with more than 90 countries producing gypsum. Mine production was
estimated at around 106 million tonnes in 2004. The largest producer is the United States,
producing some 18 million tones in 2004, of which 26% was synthetic gypsum (WRAP 2005).
There is limited international competition from global companies. Plasterboard is a commodity
material, but there is competitive advantage in manufacturing close to the market although
imports to the UK are still significant.
7.2.2 Process Overview
Gypsum occurs naturally as a mineral ore (calcium sulphate dihydrate, CaSO4.2H2O) that can be
quarried using conventional extraction techniques. If the moisture content of the mined ore is
greater than 0.5% by weight (%w/w), the ore must be first dried in a rotary dryer or heated roller
mill.
Synthetic gypsum is mainly produced as a by-product of wet flue gas desulphurisation (FGD) in
large power stations, through the reaction between limestone slurry and sulphur dioxide in the
flue gas;
CaCO3 + SO2 + 2H2O � CaSO4.2H2O + CO2
Synthetic gypsum resulting from this process is often termed desulphogypsum. Several other
forms of synthetic gypsum exist as a result of industrial processes, including titanogyspum
(titanium dioxide manufacture), phosphogypsum (phosphoric acid and phosphate fertiliser
manufacture) and fluorogypsum (hydrofluoric acid manufacture). Desulphogyspum has a
higher purity than mined gypsum and weighs less. The lighter weight has production benefits,
allowing more plasterboard to be made in less time. Its disadvantage is that higher moisture
levels (8-12% free moisture) mean more energy is required for drying. FGD gypsum may be
pressed and spun at source (the FGD unit), but it is not dried by compression at any gypsum
product or plasterboard manufacturing site.
The high moisture content of the raw material dihydrate gypsum (natural or synthetic) make it
unsuitable for use in plasters and wallboards. It must first be partially dehydrated at a
temperature of ~120°C in order to form a boiled plaster hemihydrate compound (calcium
sulphate hemihydrate, CaSO4.½H2O). This results in a loss of 1½ moles of water and a
reduction in molecular mass from to 172 to 145 g/mol. As a result one tonne of dihydrate
gypsum feedstock produces 0.84 tonnes of hemihydrate gypsum product. Further dehydration
of the boiled plaster at ~200°C results in ‘stucco’ which is used to manufacture plasterboard,
whilst calcination at a temperature of ~1300°C creates building plaster. Temperature controls
and rate of heating are crucial factors in the manufacture of various forms of gypsum. Two
combustion techniques are used by the sector to dry the dihydrate gypsum;
• Dehydration using kettle calciners; and,
• Dehydration using rotary kilns.
The rotary kilns and kettle calciners are usually operated using natural gas or distillate fuel oil as
their main fuel source. It is the combustion of these fuels that generate the sector’s contribution
to CO2 emissions. The CO2 emissions per unit of production varies between gypsum plants
according to the product mix and the technology type employed. There are no process CO2
emissions arising from gypsum manufacture.

Final Report
5
h:\projects\em-260\17000 projects\17304 ppaqcc dti eu ets ner spreadsheet\c - client\final reports 200306\gypsum -- phase ii benchmark review.doc
March 2006
17304 © Entec
Plasterboard is made from ‘stucco’ mixed with additives, processed into a board and usually
faced with a paper covering. Once formed the plasterboard is allowed to set and then dried to a
specific moisture content before being cut to size and final finishing. Many different types of
plasterboard are made, each requiring different levels of energy input for drying, such as:
• different thicknesses;
• boards with specialist properties such as being particularly fire or moisture
resistant, or for sound insulation (acoustic) uses; and,
• composite boards formed from plasterboard with layers such as insulation bonded
to it.
There are also glass-fibre reinforced gypsum (GRG) building boards which do not have paper
facings and are not described as plasterboard. These boards are heavier than standard
plasterboard and typically require more heat input for drying/curing. Plasterboard can also be
recycled and this requires removal of the paper facing and reprocessing of the gypsum core via
the normal gypsum product manufacturing route.
In summary there are three main sources of CO2 emissions in gypsum product manufacture
which any allocation methodology must account for:
• Drying the raw gypsum feed (natural or synthetic) to achieve ~0.5%w/w moisture;
• Calcining the gypsum at high temperature; and,
• Drying of the final plasterboard product.
7.2.3 Phase I incumbent and new entrant installations
Identification of how sector is covered under EU ETS
The gypsum manufacturing sector is not included as a named sector in the EU ETS. Also, since
the UK applied a ‘medium’ definition of combustion in phase I, gypsum sites were not covered
even though many have aggregate combustion plant capacity of >20MWth for process heating.
The government have announced that in Phase II gypsum manufacture will be covered by the
following definition:
“The manufacture of gypsum products at installations with a rated thermal input exceeding 20
megawatts, where the processes on the site include grinding, calcining and board drying (if
applicable)” (DEFRA 2006)
There are believed to be six sites covered by this definition (i.e. those with CCA agreements for
the Gypsum sector as listed below). There are also a number of smaller sites that are owned by
gypsum manufacturers including mines without processing facilities and ‘secondary product’
manufacturing (e.g. adhesives and coatings for the construction industry). We assume that these
associated operations would not be covered by phase II of the EU ETS.
CO2 emissions from sector
There are six gypsum manufacturing installations in the sector CCA:
• British Gypsum, East Leak, Leicestershire

Final Report
6
h:\projects\em-260\17000 projects\17304 ppaqcc dti eu ets ner spreadsheet\c - client\final reports 200306\gypsum -- phase ii benchmark review.doc
March 2006
17304 © Entec
• British Gypsum, Kirkby Thore, Cumbria
• British Gypsum, Robertsbridge, East Sussex
• British Gypsum, Sherburn in Elmet, Leeds
• Knauf UK, Sittingbourne, Kent
• Lafarge Plasterboard Ltd., Bristol
The table below summarises the total fuel use at these sites in 2003-2005 based on data
provided by the GPDA (2006). The direct CO2 emissions are calculated using standard fuel
emission factors from the FES new entrant allocation report1.
Table 7.3 Summary of Gypsum Sector Fuel Use and CO2 Emissions for 2003-2005 (GPDA 2006)
Total Sector Fuel Consumption (kWh)
Year
Natural gas Gas oil/Diesel oil
LPG/Propane Total
Total CO2 Emissions
(t CO2)
2003 2,045,607,497 13,553,455 6,345,502 2,065,506,454 393,513
2004 2,230,757,897 11,488,511 10,959,398 2,253,205,806 429,237
2005 2,325,912,366 9,041,347 9,727,540 2,344,681,253 446,421
From this data it is possible to calculate average CO2 emissions per unit of production for all
gypsum products in the most recent CCA milestone year of 2004. Data from Table 7.1 indicates
total UK production of gypsum of 3.45 Mt in 2004. Based on this data the average UK
emission factor for gypsum production in 2004 is estimated at 125 kgCO2/t gypsum. Also
from this data it is estimated that UK average energy consumption for gypsum production in
2004 was 654 kWh/t gypsum. These values provide an initial benchmark in that any new plant
would be expected to achieve this current level of efficiency as a minimum. The 2010 CCA
sector target requires a further 5.8% reduction on 2004 energy consumption levels to achieve
approximately 629 kWh/t gypsum (DEFRA 2005c).
Data provided by the GPDA (2006) for use in this study also indicates a range of fuel
consumption figures for different products as summarised in the table below.
1 EU Emissions Trading Scheme – Calculating the Free Allocation for New Entrants, Report for DTI
produced by Future Energy Solutions (FES), November 2004,

Final Report
7
h:\projects\em-260\17000 projects\17304 ppaqcc dti eu ets ner spreadsheet\c - client\final reports 200306\gypsum -- phase ii benchmark review.doc
March 2006
17304 © Entec
Table 7.4 Summary of Gypsum Sector Fuel Use by Product Type for 2003-2005 (GPDA 2006)
Specific Fuel Consumption (kWh/t) for Product
Value
Bagged Plaster Plasterboard Coving1 GRG
Minimum 260 637 No data 1198
Maximum 547 915 No data 1322
Average 393 794 No data 1267
Note 1: Some sites producing plasterboard and GRG also produce limited quantities of coving but the energy use for this is not separated out. The relatively small quantity of energy used for coving manufacture is therefore already captured in the plasterboard and GRG figures.
The above data indicates a significant variation in energy use between manufacturers for each
type of product. The minimum specific energy use figures are those for the best performing
plants which represent BAT for gypsum product manufacture. Taking the UK product mix in
2005 from Table 7.1, and assuming that all producers could achieve the minimum specific fuel
consumption from the Table 7.4, the average sector energy use would be 515 kWh/t which is
significantly below the 2010 CCA target. However, energy use is a function of the raw material
moisture content, process technology employed and drying requirements for the product mix
and therefore it is unrealistic for all operators to achieve the minimum specific fuel consumption
in practice. The increased energy use for plasterboard and GRG compared to bagged plaster is
due to heat input for drying.
The sector can continue to optimise the energy efficiency of its plants by the methods such as
optimising burner performance, scheduling, process control and waste heat recovery, although
there is now limited scope for such improvements and no significant additional potential has
been identified as a result of the CCA 2004 target review.
It is noted that the majority of fuel use (99% by energy content) in the sector is natural gas. Only
a small proportion of energy comes from other fuels and this may include non-process use for
ancillary equipment and heating of buildings. It appears that CO2 emissions from the sector can
be estimated to within 1% of actual for each site by assuming that natural gas is the only fuel,
with a standard emission factor of 0.19 kgCO2/kWh (gross basis).
Identification of Non-benchmarked incumbents, Benchmarked incumbents and New Entrants
There is no existing Phase I NE allocation method for gypsum manufacture, and no gypsum
installations are currently covered by the EU ETS.
7.2.4 Possible new entrant technologies in Phase II
Brief description of known or likely new entrants and market developments
There is an expectation/speculation of significant investment at selected sites in the gypsum
sector to meet future construction sector requirements for bagged plaster and plasterboard
products. However, the exact scale and number of new plants/developments that are likely to
come on-stream in Phase II (2008-2012) are difficult to predict at this early stage (i.e. 3-7 years
Final Report
8
h:\projects\em-260\17000 projects\17304 ppaqcc dti eu ets ner spreadsheet\c - client\final reports 200306\gypsum -- phase ii benchmark review.doc
March 2006
17304 © Entec
ahead). A potential future increase in FGD produced gypsum and in gypsum recycling also
makes it difficult to predict future gypsum sector developments. Data provided by the DTI
indicates that Phase II new entrants may include one new plant operated by Lafarge which is
due to come on stream in 2007. A plant operated by Knauf (location details not provided) and
one operated by British Gypsum (at East Leake) also underwent a significant expansion in 2005
and these may therefore be classed as new entrants in phase II due to lack of historical
emissions data.
Summary of possible types of New Entrants in Phase II
A summary of possible types of New Entrants in Phase II is given in Table 7.5.

Final Report
9
h:\projects\em-260\17000 projects\17304 ppaqcc dti eu ets ner spreadsheet\c - client\final reports 200306\gypsum -- phase ii benchmark review.doc
March 2006
17304 © Entec
Type of New Entrant Is this type of New
Entrant
realistically
possible in Phase
II? (Y/N)
Technology type(s)? Fuel type(s)? Other relevant details
New installation Y New gypsum manufacturing installations
are likely in the UK.
Rotary kilns and kettle
calciners are usually operated
using natural gas or distillate
fuel oil as their main fuel
source. Biofuel use is a
possibility to reduce CO2
emissions in future but would
require further research by
operators and possibly kiln
design modifications to ensure
product quality is not adversely
affected.
It is difficult to predict what new plants will come on
line in Phase II due to the commercial confidentiality
of operator's production and development plans.
The demand for bagged plaster and plasterboard
products is increasing as a result of changes to
building regulations and government targets for new
house construction. Increasing fuel prices and
tightening environmental regulation of the sector are
also drivers for new plant investment. The GDPA is
aware of plans by Lafarge to open a new gypsum
plant in the UK in the near future.
New piece of equipment
to increase capacity
Y New process units to expand production
capacity are possible at existing gypsum
plants. In theory, an operator could
install any one of the main types of
process unit found at gypsum plants as
part of a capacity increase.
Rotary kilns and kettle
calciners are usually operated
using natural gas or distillate
fuel oil as their main fuel
source. Biofuel use is a
possibility in future.
The demand for production of gypsum products is
increasing. Operators can choose between
desulpho-gypsum which is a byproduct of flue gas
desulphurisation (FGD) at power stations and mined
gypsum as a raw material. Desulpho-gypsum has a
higher purity than natural gypsum but requires more
energy for drying due to its higher moisture content.
Extension to existing
piece of equipment to
increase capacity
Y Modifications to existing gypsum plants
to increase production and replace end-
of-life equipment are likely. In theory,
an operator could rebuild/extend any one
of the main types of process unit found
at gypsum plants as part of a capacity
increase.
Rotary kilns and kettle
calciners are usually operated
using natural gas or distillate
fuel oil as their main fuel
source. Biofuel use is a
possibility in future.
The GPDA consider UK operators to be amongst the
most energy efficient in the European gypsum sector
and are part of a sectoral Climate Change
Agreement (CCA).
Other Sector Notes There is an expectation/speculation of significant investment at selected sites in the gypsum sector to meet future construction sector requirements
for bagged plaster and plasterboard products. However, the exact scale and number of new plants/developments that are likely to come on-stream
in Phase II (2008-2012) are difficult to predict at this early stage (i.e. 3-7 years ahead). Increasing supplies of FGD produced gypsum also makes it
difficult to predict future gypsum sector developments.
Table 7.5 Summary of possible types of New Entrants in Phase II
7.3 Review of Relevant Data
7.3.1 Data sources
The Gypsum Products Development Association (GPDA) has been contacted to obtain data on
gypsum plants. The data and comments provided have been used to inform the assessment and
development of alternative allocation methods. A range of additional data sources on gypsum
plant energy use and CO2 emissions have been obtained and reviewed, as follows:
• Recent DEFRA and WRAP reports on the gypsum sector;
• Digest of UK Energy Statistics 2005;
• US Environmental Protection Agency (USEPA) data on gypsum sector emissions;

Final Report
10
h:\projects\em-260\17000 projects\17304 ppaqcc dti eu ets ner spreadsheet\c - client\final reports 200306\gypsum -- phase ii benchmark review.doc
March 2006
17304 © Entec
• Journal articles on gypsum manufacture;
• FES report and spreadsheet on NER allocations, including methods for CHP units,
and boilers; and
• Papers on allocation methodologies from other member states.
The above data sources have been useful in assessing aggregate energy use figures for the sector
and some sites. However, the data available is limited since energy use and CO2 emissions from
the gypsum manufacturing sector are not separated out in national energy statistics and GHG
inventories and are typically totalled together with those for all other mineral-based industries.
Also, data for specific plants and types of process unit has been difficult to obtain since this
information is normally considered confidential by operators.
7.3.2 Data from literature
Data from literature searches and other sources on emission factors and capacity utilisation /
load factors of best operating practice installations relevant to Phase II New Entrants is
summarised in Table 7.6 below. The only readily available literature source of fuel use and CO2
emission data for individual process units is from the USEPA. This type of data is usually
treated as confidential by the operators. The USEPA report (2005) presents data for a number
of plants with different types of rotary ore dryers and flash calciners. The table therefore simply
represents the variation in emission factors from typical US plant.
Table 7.6 Data from literature searches and other sources on emission factors and capacity utilisation / load factors of best operating practice installations relevant to Phase II New Entrants (USEPA 2005)
Type of installation and process unit 1 Specific CO2
emissions range (kg/t feed)
Specific CO2 emissions average (kg/t feed)
Flash calciner with no control 60-65 60
Flash calciner (fuel unknown) with Fabric filter 60-65 60
Flash calciner (gas fired) with no control 42-49 45
Flash calciner (gas fired) with Fabric filter 48-55 50
Calciner with Fabric filter 55-75 65
Rotary ore dryer with no control 21-25 23
Rotary ore dryer with Fabric filter 15 15
Rotary ore dryer (gas fired) with Cyclone 3.9-4.8 4.3
Rotary ore dryer (gas fired) with Cyclone/fabric filter 3.5-4.5 4.1
Note 1: Variation in specific emissions is a function of feed moisture content and dryer/calciner efficiency. Pollution control devices such as cyclones/fabric filters generally have a negligible effect on CO2 emissions. Based on the above data the USEPA use standard (average) emission factors of 55 and 12 kgCO2/t feed for gypsum calciners and gypsum rotary ore driers respectively. This gives total emission 67 kg CO2 per tonne of feed but does not include product drying in the case of plasterboard. It can be assumed that one tonne of raw gypsum feed results in approximately 0.84 tonnes of product due to the loss of water.
Final Report
11
h:\projects\em-260\17000 projects\17304 ppaqcc dti eu ets ner spreadsheet\c - client\final reports 200306\gypsum -- phase ii benchmark review.doc
March 2006
17304 © Entec
From the table above the key points are as follows:
• The lowest specific CO2 emissions for raw material drying is around 4 kg/t feed for
gas-fired units. However this varies significantly with the feed moisture content
and fuel type;
• The lowest specific CO2 emissions for calcining is around 45 kg/t feed for gas-fired
units. However this varies with the moisture content of the feed, plant
configuration and fuel type giving higher values for some plants;
• The lowest specific CO2 emissions for gypsum plants in the US study appear to be
in the region of 49 kg/t feed for gas-fired units. This equates to total emissions of
approximately 58 kgCO2/t product or energy use of 310 kWh/t product assuming
natural gas firing but this does not include emissions or energy use from product
drying in the case of plasterboard; and,
• The above data represents typical US plant based on monitoring carried out in the
last 20 years and does not necessarily represent BAT for current plant. Since the
above US data is not comprehensive it is not further analysed. Data from UK
operators may be more appropriate to accurately benchmark energy use or CO2
emissions for UK process units.
7.3.3 Benchmarks used in other contexts, including other Member States (if available)
Investigations have been undertaken to try to identify benchmarking approaches for new
entrants in other Member States. Overall, the extent of information available within the tight
timescales of this study has been limited. Furthermore, information will tend to relate to Phase I
approaches, and hence may not be indicative of approaches in Phase II, which this study is
focussed on. Notwithstanding this, it is useful to consider these approaches, as briefly
summarised below.
Denmark
The Danish NAP assumes an efficiency factor of 0.9 for new entrants but no distinction is made
between sectors for this factor. No discussion of new entrant benchmarks or formula.
Germany
New entrants are granted allocation on BAT benchmarks. These benchmarks are established for
installations with comparable products, and derived from BAT for new installations in that
class. Also, each product category will have a benchmark. New entrants that don’t have defined
benchmarks will be granted allowance based on BAT.
New entrant formula (industry non-specific);
Allocationi = Ci ·P
iU ·BAT,
where
i is an index for the installation;
Ci is the installation-specific output capacity in MW;
Final Report
12
h:\projects\em-260\17000 projects\17304 ppaqcc dti eu ets ner spreadsheet\c - client\final reports 200306\gypsum -- phase ii benchmark review.doc
March 2006
17304 © Entec
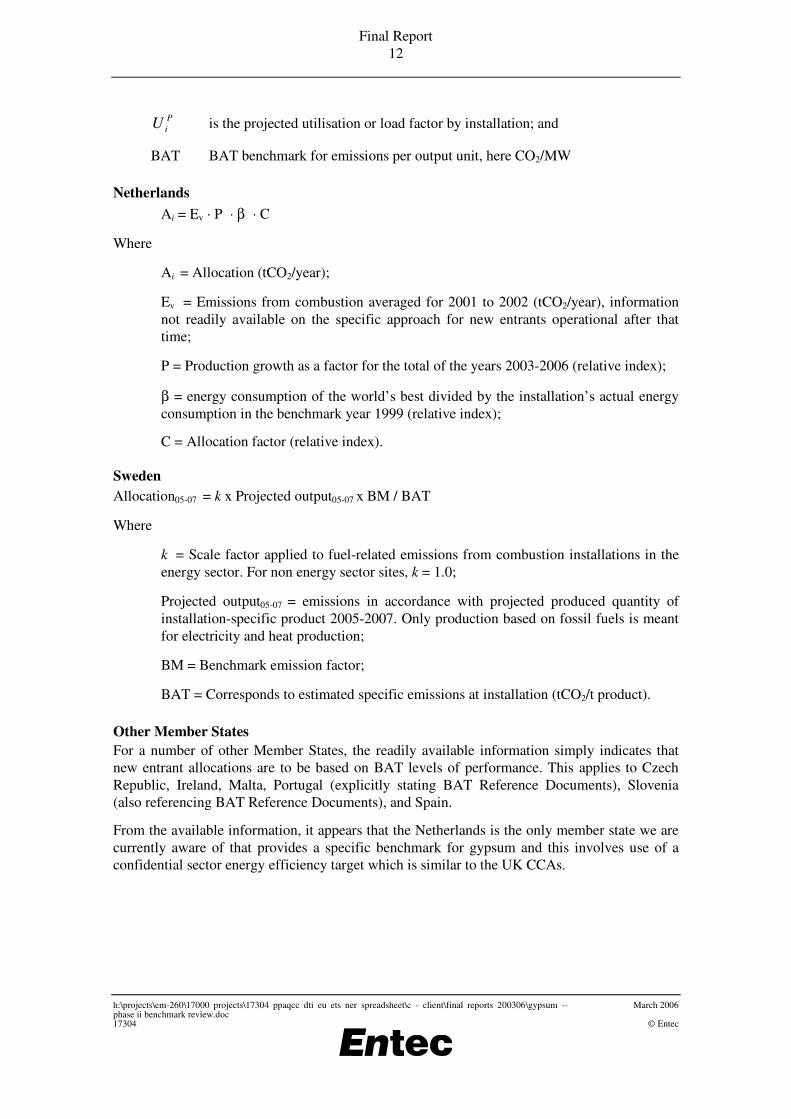
P
iU is the projected utilisation or load factor by installation; and
BAT BAT benchmark for emissions per output unit, here CO2/MW
Netherlands
Ai = Ev · P · β · C
Where
Ai = Allocation (tCO2/year);
Ev = Emissions from combustion averaged for 2001 to 2002 (tCO2/year), information
not readily available on the specific approach for new entrants operational after that
time;
P = Production growth as a factor for the total of the years 2003-2006 (relative index);
β = energy consumption of the world’s best divided by the installation’s actual energy
consumption in the benchmark year 1999 (relative index);
C = Allocation factor (relative index).
Sweden
Allocation05-07 = k x Projected output05-07 x BM / BAT
Where
k = Scale factor applied to fuel-related emissions from combustion installations in the
energy sector. For non energy sector sites, k = 1.0;
Projected output05-07 = emissions in accordance with projected produced quantity of
installation-specific product 2005-2007. Only production based on fossil fuels is meant
for electricity and heat production;
BM = Benchmark emission factor;
BAT = Corresponds to estimated specific emissions at installation (tCO2/t product).
Other Member States
For a number of other Member States, the readily available information simply indicates that
new entrant allocations are to be based on BAT levels of performance. This applies to Czech
Republic, Ireland, Malta, Portugal (explicitly stating BAT Reference Documents), Slovenia
(also referencing BAT Reference Documents), and Spain.
From the available information, it appears that the Netherlands is the only member state we are
currently aware of that provides a specific benchmark for gypsum and this involves use of a
confidential sector energy efficiency target which is similar to the UK CCAs.

Final Report
13
h:\projects\em-260\17000 projects\17304 ppaqcc dti eu ets ner spreadsheet\c - client\final reports 200306\gypsum -- phase ii benchmark review.doc
March 2006
17304 © Entec
7.4 Review of Phase I Benchmarks
7.4.1 Characterisation of existing New Entrant allocation benchmarks
The existing allocation methodology (used in Phase I) for new entrants from the FES report2
and spreadsheet3 do not cover the gypsum sector.
In the FES report, load factors and allocation methodologies are given for standard boilers (i.e.
‘other combustion plant >20 MW’) and CHP plants operating in any sector. However, in
gypsum manufacturing plant, the main fuel use is for direct process heating (i.e. drying and
calcining) and therefore none of the existing allocation methodologies from other sectors can
readily be applied to gypsum. The gypsum sector cannot be compared with cement/lime
production processes since there is no process CO2 emitted from gypsum kilns and they operate
at lower temperatures than cement kilns using a single fuel type.
7.4.2 Validation of existing New Entrant allocation spreadsheet
Since the Phase I benchmarking methods for new entrants do not cover gypsum manufacture it
is not possible to make any meaningful validation of the existing new entrant spreadsheet for
gypsum.
It is concluded that the existing new entrant benchmarking methods are not comprehensive
enough to cover gypsum new entrants. The list of key gypsum processes below indicates the
potential scope of coverage of the new entrant benchmarking in the gypsum sector:
GYPSUM PROCESSES (to be considered by new entrant benchmarking methods)
Raw material drying Natural gypsum drying
Synthetic gypsum drying
Calcining Kettle calciners
Rotary kilns
Final product drying Plasterboard drying lines and ovens
(including different plasterboard grades)
Auxiliary facilities Site services/utilities (unlikely to be significant in relation to other process energy use)
2 EU Emissions Trading Scheme – Calculating the Free Allocation for New Entrants, Report for DTI
produced by Future Energy Solutions (FES), November 2004.
3 Calculating the Allocation for New Entrants: spreadsheet for applicants by FES, updated 23
rd May 2005,
available at www.dti.gov.uk.

Final Report
14
h:\projects\em-260\17000 projects\17304 ppaqcc dti eu ets ner spreadsheet\c - client\final reports 200306\gypsum -- phase ii benchmark review.doc
March 2006
17304 © Entec
7.5 Assessment of proposed benchmarks
7.5.1 Potential alternative New Entrant allocation methods
On the basis of our investigations there are two types of alternative benchmarking allocation
methodology that may be appropriate for use in the gypsum sector, as follows:
Option 1 – Single Benchmark Fuel Consumption Approach
This approach would use a single value for benchmark energy consumption in gypsum
manufacture.
As summarised in Section 7.3.2 the lowest specific energy consumption values for gypsum
manufacture in the US appear to be in the region of 310 kWh/t product based on gas-fired units.
However, this data cannot be reasonably used for benchmarking as it is not well referenced and
does not appear to include energy use for board drying. From Table 7.4 the lowest equivalent
value for UK plants (bagged plaster production only) is 260 kWh/t product and the difference
most likely reflects different feed moisture content. From Section 7.2.3 the average UK energy
consumption by gypsum plants (including bagged plaster, plasterboard, coving and GRG) in
2004 appears to be in the region of 654 kWh/t product. The UK sector CCA requires a further
reduction in average energy use to achieve around 629 kWh/t product by 2010.
Therefore, based on available data an initial energy consumption benchmark for all UK gypsum
sector new entrants of 629 kWh/t could be chosen by way of example. It is noted that the final
level at which this benchmark would be set cannot be determined without further data
submission from the sector operators to include feed moisture content and a more detailed
breakdown of plant energy use in the sector. This initial benchmark level would assume that
gypsum new entrants should be able to achieve the sector 2010 CCA target during phase II of
the EU ETS (i.e. 2008 to 2012) by application of BAT for energy efficiency. The allocation
would also assume natural gas use since this is the principal fuel and also represents BAT in
terms of reducing CO2 emissions. The allocation equation would then be:
Ai = Ci * Us/100 * SEC * EF
Allocation = Capacity * Utilisation * Benchmark Specific
Energy Consumption
* Emissions
Factor
tCO2 tonnes product capacity
% kWh/ tonne product tCO2 /kWh fuel
Where:
Parameter / Variable Value
SEC 629 kWh/t product
EF 0.00021 tCO2/kWh
Us 80%
Final Report
15
h:\projects\em-260\17000 projects\17304 ppaqcc dti eu ets ner spreadsheet\c - client\final reports 200306\gypsum -- phase ii benchmark review.doc
March 2006
17304 © Entec
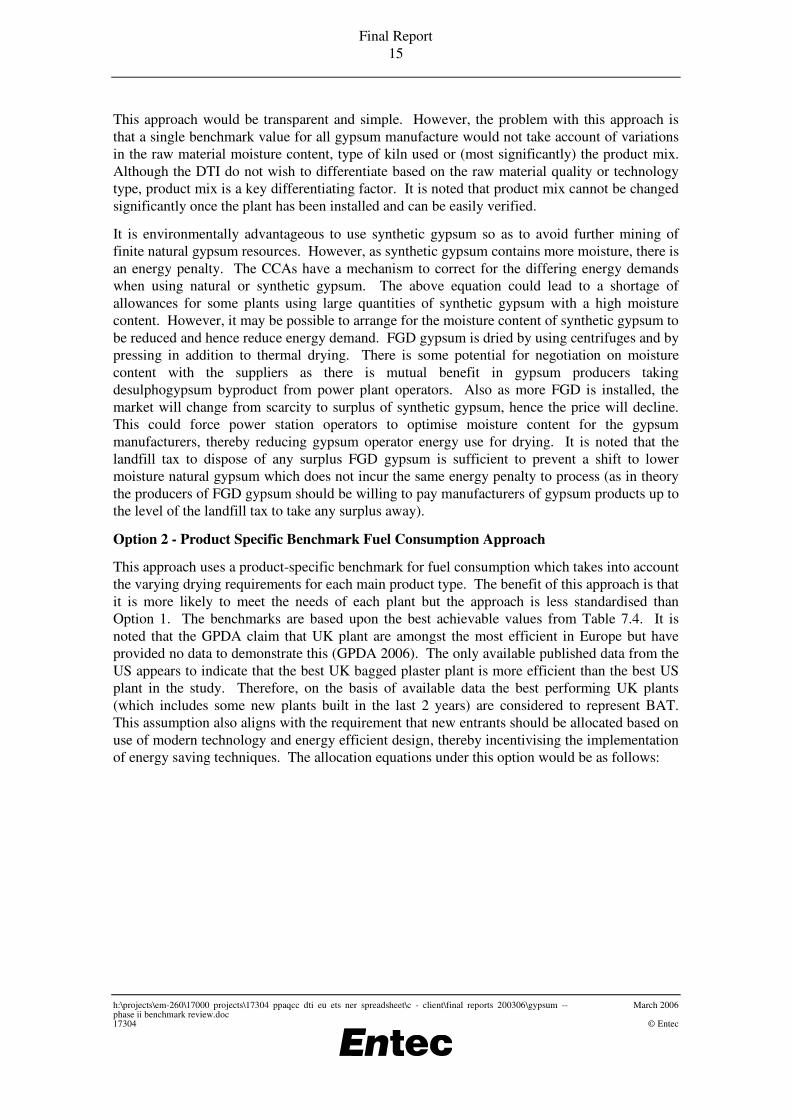
This approach would be transparent and simple. However, the problem with this approach is
that a single benchmark value for all gypsum manufacture would not take account of variations
in the raw material moisture content, type of kiln used or (most significantly) the product mix.
Although the DTI do not wish to differentiate based on the raw material quality or technology
type, product mix is a key differentiating factor. It is noted that product mix cannot be changed
significantly once the plant has been installed and can be easily verified.
It is environmentally advantageous to use synthetic gypsum so as to avoid further mining of
finite natural gypsum resources. However, as synthetic gypsum contains more moisture, there is
an energy penalty. The CCAs have a mechanism to correct for the differing energy demands
when using natural or synthetic gypsum. The above equation could lead to a shortage of
allowances for some plants using large quantities of synthetic gypsum with a high moisture
content. However, it may be possible to arrange for the moisture content of synthetic gypsum to
be reduced and hence reduce energy demand. FGD gypsum is dried by using centrifuges and by
pressing in addition to thermal drying. There is some potential for negotiation on moisture
content with the suppliers as there is mutual benefit in gypsum producers taking
desulphogypsum byproduct from power plant operators. Also as more FGD is installed, the
market will change from scarcity to surplus of synthetic gypsum, hence the price will decline.
This could force power station operators to optimise moisture content for the gypsum
manufacturers, thereby reducing gypsum operator energy use for drying. It is noted that the
landfill tax to dispose of any surplus FGD gypsum is sufficient to prevent a shift to lower
moisture natural gypsum which does not incur the same energy penalty to process (as in theory
the producers of FGD gypsum should be willing to pay manufacturers of gypsum products up to
the level of the landfill tax to take any surplus away).
Option 2 - Product Specific Benchmark Fuel Consumption Approach
This approach uses a product-specific benchmark for fuel consumption which takes into account
the varying drying requirements for each main product type. The benefit of this approach is that
it is more likely to meet the needs of each plant but the approach is less standardised than
Option 1. The benchmarks are based upon the best achievable values from Table 7.4. It is
noted that the GPDA claim that UK plant are amongst the most efficient in Europe but have
provided no data to demonstrate this (GPDA 2006). The only available published data from the
US appears to indicate that the best UK bagged plaster plant is more efficient than the best US
plant in the study. Therefore, on the basis of available data the best performing UK plants
(which includes some new plants built in the last 2 years) are considered to represent BAT.
This assumption also aligns with the requirement that new entrants should be allocated based on
use of modern technology and energy efficient design, thereby incentivising the implementation
of energy saving techniques. The allocation equations under this option would be as follows:

Final Report
16
h:\projects\em-260\17000 projects\17304 ppaqcc dti eu ets ner spreadsheet\c - client\final reports 200306\gypsum -- phase ii benchmark review.doc
March 2006
17304 © Entec
Ai = Ci * Us/100 * SECs * EF
Allocation = Capacity * Utilisation *
Benchmark Specific Energy
Consumption for product
* Emissions
Factor
tCO2 tonnes product capacity
% kWh/ tonne product tCO2 /kWh fuel
Where:
Parameter / Variable Value
SECs 260 kWh/t product for bagged plaster
637 kWh/t product for plasterboard and coving
1198 kWh/t product for glass reinforced gypsum (GRG)
EF 0.00021 tCO2/kWh
Us 80%
The benefit of this approach is that it accounts for the variation in energy use between different
product types. Each plant is designed to produce a certain product mix and there is little
potential for change of product mix without major plant modifications/additions. There is also
some accounting of average feed moisture content since the benchmark figures include current
UK consumption of desulphogypsum. However specific factors for differentiation based on
feed moisture is not included since this would award extra allowances for use of a higher
moisture feed.
Load Factors and Plant Capacity
Gypsum plants can operate at high load factors of between 90 and 100% with production output
close to rated capacity although more detailed data would have to be provided by the sector
operators to verify this (GPDA 2006). The operator’s future production plans will typically
assume a high plant load factor although there may be some small variations based on the type
of kiln in use, maintenance schedules and projected sales volumes. Also, as gypsum products
are likely to remain in demand in the UK due to increasing construction use, operators will tend
to run their plants at maximum achievable throughput. No detailed data on plant load factors is
available as operators typically consider this data to be commercially confidential. It is
suggested that a standard load factor of 80% be used for the sector as a whole, in the absence of
more detailed information. The value used for plant capacity should be the nameplate capacity
of the equipment on a ‘final product’ basis and should be backed up with verifiable data such as
relevant sections of the PPC permit for the site. A plant is typically designed to produce a
specified number of tonnes (or square metres) of final product (be that bagged plaster,
plasterboard, coving or GRG) and this cannot easily be changed one the plant is operating
without significant equipment modification/additions. The plant production capacity is also
defined in any contract between the operator and process design/construction company and is
therefore easily verified.

Final Report
17
h:\projects\em-260\17000 projects\17304 ppaqcc dti eu ets ner spreadsheet\c - client\final reports 200306\gypsum -- phase ii benchmark review.doc
March 2006
17304 © Entec
Fuel Emission Factors
There is a strong argument for use of a standard fuel factor for all gypsum manufacture based on
natural gas. This is because 99% of the sectors fuel use is natural gas and this also represents
clean technology option. Use of a natural gas fuel factor will not lead to any significant under
or over allocation for individual operators.
Summary
From the above information both Options 1 and 2 have some benefits and limitations.
However, Option 2 is more likely to meet the overall aims of the study in terms of feasibility
and preventing any significant under or over allocation. Option 2 also has the backing of the
GPDA. It is based on actual product mix output and this aligns with the approach taken for
other sectors. Option 2 also provides and incentive for production methods which are less
energy intensive as operators are not awarded extra allowances for use of high moisture feeds.
It is concluded that Option 2 is the most robust alternative allocation method for the purposes of
new entrant allocation.
The following table briefly considers the key elements of the existing NE allocation spreadsheet
and summarises details of proposed revisions. The proposals are then justified against the
agreed evaluation criteria in the following section.
Table 7.7 Summary assessment of key elements of existing New Entrant allocation spreadsheet and proposals for potential revision
Tests to be applied to existing NE allocation spreadsheet
Answer / Details of proposed revision
Source of data
Differentiation: should there be less or more differentiation within the sector (i.e. differentiating based on sub-product, raw materials, technology, fuel, efficiency etc)? If so, what should it be?
The existing NE spreadsheet does not cover the gypsum sector.
The proposed allocation Option 2 uses a standard energy use benchmark for each main type of gypsum product.
is the emission factor consistent with sector best practice
4? If “No”, what should
it be?
The existing NE spreadsheet does not cover the gypsum sector.
The Proposed NE allocation Option 2 uses a standard energy use benchmark combined with a standard emissions factor based on natural gas as the fuel.
Data on best practice for UK plants
Level at which benchmark is set
is the load factor realistic for new entrants in that sector? If “No”, what should it be?
The existing NE spreadsheet does not cover the gypsum sector.
The proposed NE allocation Option 2 uses a standard load factor of 80%.
Expert judgement
4 Interpreted as ‘Best Available Techniques’ (BAT), as defined in the IPPC Directive. In practice, within
the scope of this study it will only be possible to assess this in broad indicative terms at a sectoral level. It
is clearly not within our scope to define BAT at the level of detail that would be required for a site
specific PPC Permit.

Final Report
18
h:\projects\em-260\17000 projects\17304 ppaqcc dti eu ets ner spreadsheet\c - client\final reports 200306\gypsum -- phase ii benchmark review.doc
March 2006
17304 © Entec
Overall, the proposals for potential revisions to the formulae to be used in the New Entrant
allocation spreadsheet are:
Ai = Ci * Us/100 * SECs * EF
Allocation = Capacity * Utilisation *
Benchmark Specific Energy
Consumption for product
* Emissions
Factor
tCO2 tonnes product capacity
% kWh/ tonne product tCO2 /kWh fuel
Where:
Parameter / Variable Value
SECs 260 kWh/t product for bagged plaster
637 kWh/t product for plasterboard and coving
1198 kWh/t product for glass reinforced gypsum (GRG)
EF 0.00021 tCO2/kWh
Us 80%
And:
• The operator specifies the plant capacity based on the process design final product
output. Where a single plant makes more than one product then the total allocation
is calculated by summing the individual allocations for each product type.
• Values for operator-specified parameters should be verifiable. For example, the
new entrant application could be supported by a technical annex which includes a
copy of relevant parts of the PPC permit or plant design documentation to justify
the plant capacity.
7.6 Evaluation of Proposed Benchmarks
Feasibility
• A single benchmark for all gypsum products would not recognise the significant
variation in energy use for drying different products. Therefore the proposed
product-based benchmarks are considered to be the most feasible and would not
lead to significant under or over allocation.
• The suggested benchmarks for each product type are based on best practice in UK
plant and any new entrant would be expected to achieve this level of performance
through application of BAT. This is considered to be achievable given that new
plant will employ the latest technology and energy efficiency measures compared
Final Report
19
h:\projects\em-260\17000 projects\17304 ppaqcc dti eu ets ner spreadsheet\c - client\final reports 200306\gypsum -- phase ii benchmark review.doc
March 2006
17304 © Entec
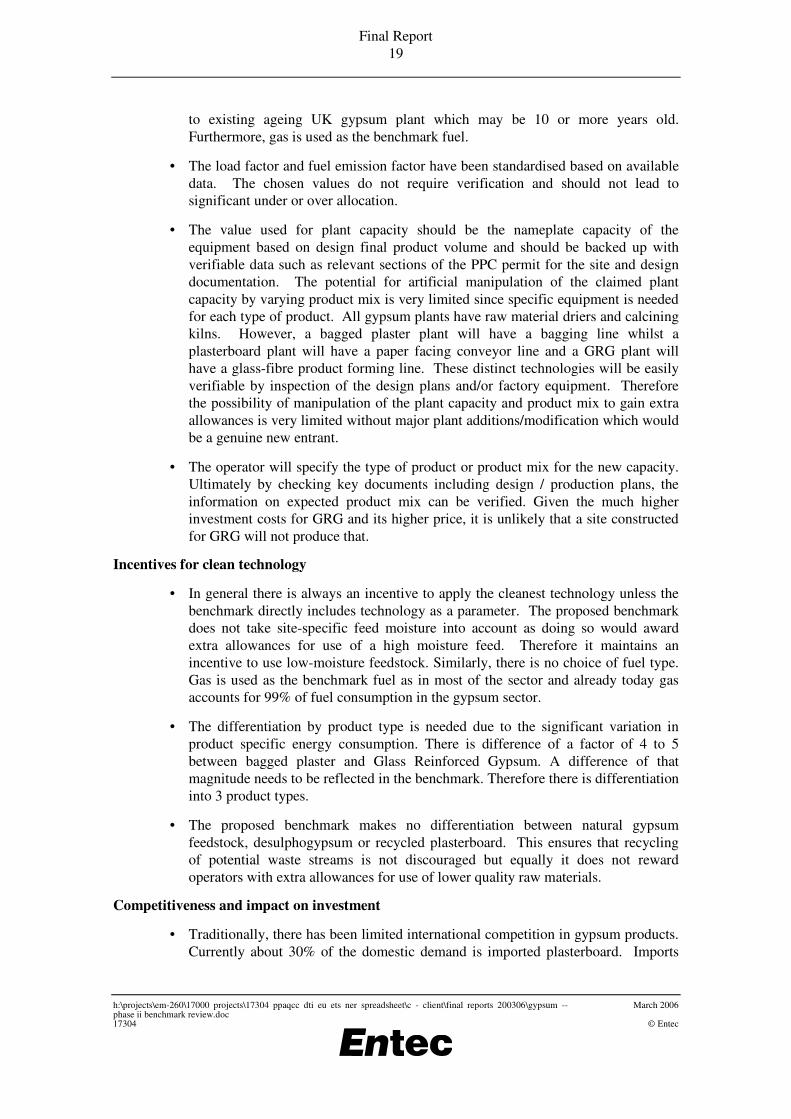
to existing ageing UK gypsum plant which may be 10 or more years old.
Furthermore, gas is used as the benchmark fuel.
• The load factor and fuel emission factor have been standardised based on available
data. The chosen values do not require verification and should not lead to
significant under or over allocation.
• The value used for plant capacity should be the nameplate capacity of the
equipment based on design final product volume and should be backed up with
verifiable data such as relevant sections of the PPC permit for the site and design
documentation. The potential for artificial manipulation of the claimed plant
capacity by varying product mix is very limited since specific equipment is needed
for each type of product. All gypsum plants have raw material driers and calcining
kilns. However, a bagged plaster plant will have a bagging line whilst a
plasterboard plant will have a paper facing conveyor line and a GRG plant will
have a glass-fibre product forming line. These distinct technologies will be easily
verifiable by inspection of the design plans and/or factory equipment. Therefore
the possibility of manipulation of the plant capacity and product mix to gain extra
allowances is very limited without major plant additions/modification which would
be a genuine new entrant.
• The operator will specify the type of product or product mix for the new capacity.
Ultimately by checking key documents including design / production plans, the
information on expected product mix can be verified. Given the much higher
investment costs for GRG and its higher price, it is unlikely that a site constructed
for GRG will not produce that.
Incentives for clean technology
• In general there is always an incentive to apply the cleanest technology unless the
benchmark directly includes technology as a parameter. The proposed benchmark
does not take site-specific feed moisture into account as doing so would award
extra allowances for use of a high moisture feed. Therefore it maintains an
incentive to use low-moisture feedstock. Similarly, there is no choice of fuel type.
Gas is used as the benchmark fuel as in most of the sector and already today gas
accounts for 99% of fuel consumption in the gypsum sector.
• The differentiation by product type is needed due to the significant variation in
product specific energy consumption. There is difference of a factor of 4 to 5
between bagged plaster and Glass Reinforced Gypsum. A difference of that
magnitude needs to be reflected in the benchmark. Therefore there is differentiation
into 3 product types.
• The proposed benchmark makes no differentiation between natural gypsum
feedstock, desulphogypsum or recycled plasterboard. This ensures that recycling
of potential waste streams is not discouraged but equally it does not reward
operators with extra allowances for use of lower quality raw materials.
Competitiveness and impact on investment
• Traditionally, there has been limited international competition in gypsum products.
Currently about 30% of the domestic demand is imported plasterboard. Imports

Final Report
20
h:\projects\em-260\17000 projects\17304 ppaqcc dti eu ets ner spreadsheet\c - client\final reports 200306\gypsum -- phase ii benchmark review.doc
March 2006
17304 © Entec
have increased in recent years to meet UK construction demand but new UK plants
have now come on line/are planned to reduce the need for imports. On the UK and
European market there are three main companies competing. Benchmark CO2
emissions for plasterboard are about 120 kg per tonne. With a CO2 allowance price
of 25 €/tonne, the maximum potential impact is about £2/tonne of product. If the
plasterboard price is assumed to be in the order of £100 to £150 per tonne the
impact is slightly above 1%. The difference between the specific energy
consumption for bagged plaster and plaster board is factor of almost 3 and
therefore, using the low SEC value would only give the plasterboard producers
40% of their need. This would amounts to a potential impact on costs of about
£1.20 per tonne of product. Therefore the benchmark differentiates between types
of product to avoid competitive distortion.
• The proposed benchmark is believed to be close to meeting site need if the operator
applies the most efficient equipment. By allowing the product specific benchmarks
there should be no distortion of the domestic market favouring companies with a
certain expected product profile. As the calculation above illustrates, the value of
the potential under-allocation of using the lowest SEC is not particularly high. On
the other hand, 1% on of sales value could be around 10% of profit margin. No
detailed studies have been made on the gypsum sector and the potential impact of
the EU ETS. Therefore, the possibilities of passing on additional costs to the
consumers and other key issues have not be addressed. Accordingly, it is not
possible to assess whether a significant under allocation would affect investment
and production decisions within the industry. The benchmarks proposed are
designed to prevent any significant under or over allocation.
• The proposed benchmark method uses UK plant data as the basis for setting a
benchmark for new entrants. UK Plant is considered by the GPDA to be amongst
the most efficient in Europe and any new entrant should use BAT to minimise
energy use per unit of production.
• The existing UK gypsum plants that will be entering into phase II have historical
CCA data from which to make allocations using a grandfathering approach. Those
plants which do not have enough historical data are relatively new plants and they
would be expected to already be using BAT and attaining the benchmark levels of
energy efficiency. It is concluded that no significant under or over allocation is
likely for existing plants or new entrants.
• The proposed benchmark method uses a standard fuel factor based on natural gas
use. The majority of sector fuel use (99%) is already from gas and therefore this
does not affect competitiveness.
Consistency with incumbent allocations
• The gypsum sector is not currently covered by the EU ETS. If the benchmark were
to be applied to all existing plants an under allocation of approximately 20% across
the sector is estimated to occur. Existing plants that do not have enough historical
data are likely to be already operating at BAT levels and therefore the benchmark
would not lead to significant under or over allocation.

Final Report
21
h:\projects\em-260\17000 projects\17304 ppaqcc dti eu ets ner spreadsheet\c - client\final reports 200306\gypsum -- phase ii benchmark review.doc
March 2006
17304 © Entec
• Gypsum plants tend to operate at high load factors and therefore a standard value
of 80% has been used for new entrants which is considered to be consistent with
incumbents.
7.7 References
DTI 2005. Digest of UK Energy Statistics 2005. Department of Trade and Industry. 2005.
DEFRA 2005a. Revised UK National Allocation Plan (NAP) for the EU ETS. Department of
the Environment, Food and Rural Affairs. 14 February 2005.
DEFRA 2005b. EU Emission Trading Scheme: Phase II Expansion Sector Specific Analysis:
Foundries, Integrated Steelworks, Glass, Gypsum and Rock Wool. September 2005.
DEFRA 2005c. Climate Change Agreements - Results of the Second Target Period
Assessment. Department of the Environment, Food and Rural Affairs. July 2005.
DEFRA 2006. EU ETS Phase II Expansion - Explanatory Note. Department of the
Environment, Food and Rural Affairs. March 2006.
EA 1995. IPC Guidance Note S2 1.01: Combustion Processes: Large Boilers and Furnaces
50MW(th) and Over. Environment Agency. November 1995.
EA 2006. Pollution Inventory England & Wales. Environment Agency. www.environment-
agency.gov.uk (accessed January 2006).
GPDA 2006. Communication with Crispin Dunn-Meynell, Gypsum Products Development
Association. February 2006.
OEF 2006. Research on Output Growth Rates and Carbon Dioxide Emissions of the Industrial
Sectors of EU-ETS. Oxford economic Forecasting and the Carbon Consortium. Report for the
DTI. February 2006.
ONS 2005. UK Products Sales and Trade Statistics 2004: Plaster Products and Plasterboard
(PRA 26620 and PRA 26530). Office of National Statistics. 2005.
USEPA 2005. Emission Factor Documentation for AP-42 Section 11.16 - Gypsum
Manufacturing. US environmental protections Agency. 2005.
WRAP 2005. Review of Plasterboard Material Flows and Barriers to Greater Use of Recycled
Plasterboard. Waste and Resources Action Programme. November 2005.