h 9489 narr - yum! brands · mcdonald’s 32 subway 23 burger king 11 wendy’s 10 domino’s pizza...
TRANSCRIPT

“multibrand power”
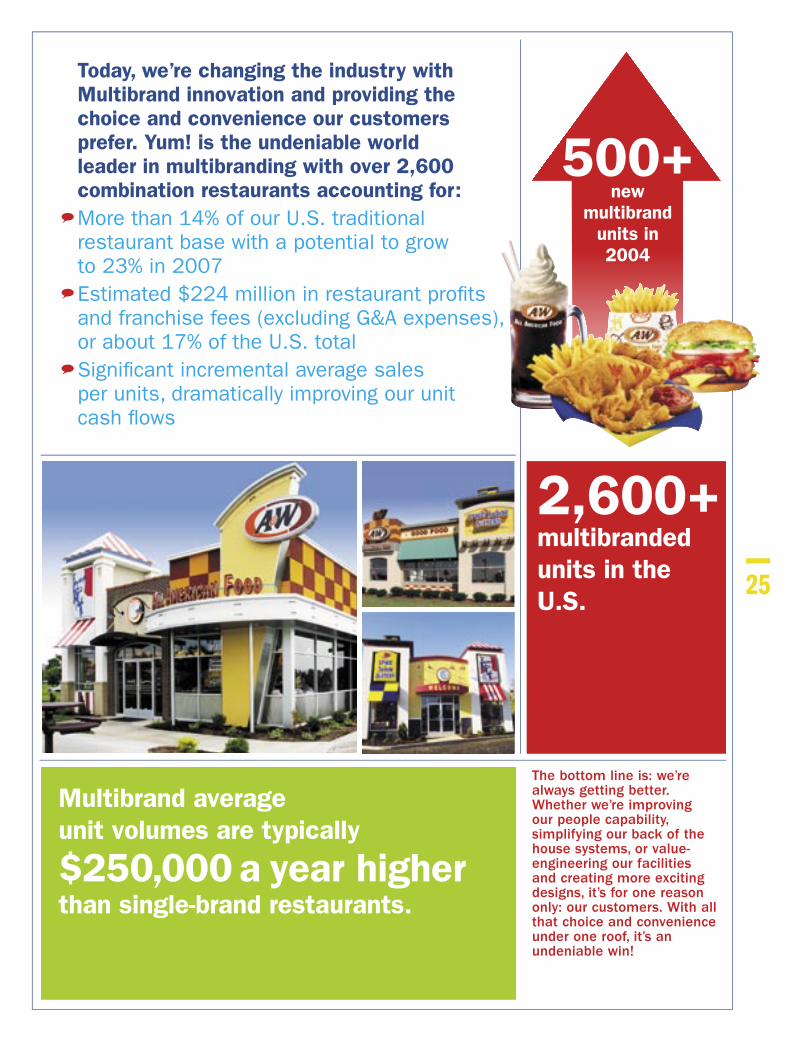
500+new
multibrandunits in2004
Today, we’re changing the industry with Multibrand innovation and providing the choice and convenience our customers prefer. Yum! is the undeniable world leader in multibranding with over 2,600 combination restaurants accounting for: More than 14% of our U.S. traditional restaurant base with a potential to grow to 23% in 2007 Estimated $224 million in restaurant profi ts and franchise fees (excluding G&A expenses), or about 17% of the U.S. total Signifi cant incremental average sales per units, dramatically improving our unit cash fl ows
Multibrand average unit volumes are typically
$250,000 a year higherthan single-brand restaurants.
The bottom line is: we’re always getting better. Whether we’re improving our people capability, simplifying our back of the house systems, or value-engineering our facilities and creating more exciting designs, it’s for one reason only: our customers. With all that choice and convenience under one roof, it’s an undeniable win!
2,600+multibranded units in the U.S.
25

PRODUCT QUALITY How do you sayYum? Just ask RGM Diane Oney. This28-year veteran drives a passionateCustomer Mania culture in her restaurantwith consistent CHAMPS scores in thehigh 90’s. Just listen to the rings ofsatisfaction on the Long John Silver’sbell in her lobby. Ring!
SPEED OF SERVICE Don’t blink. Youmight miss RGM Abul Azad makingthings happen—fast. Abul runs oneof KFC’s best restaurants! In 2004, hemaintained a 97% CHAMPS average anda near-perfect 5.0 Balanced Scorecard.Abul constantly reinforces CHAMPS witha Yes!—serving up his special brand ofCustomer Mania—in a snap.Abul Azad, KFC
MAINTENANCE “We’re always readyfor our customers.” That’s how 19-yearveteran RGM Jim Gribble runs his restau-rant and keeps it humming. Last yearhe boosted sales by 32%! Jim is alwaysrunning a great restaurant and servingup delicious root beer floats with a smile.Jim Gribble, A&W All American Food,Daugharthy, Inc. franchisee
P
S
Diane Oney, Long John Silver’s,Sterling Silver Restaurants franchisee
C
H
A
M
CCleanliness
HHospitality
AAccuracy
MMaintenance
PProduct Quality
SSpeed of Service
power”customer mania
“
26

The power of our people is our secret ingredient, and what sets us apart from the competition.
Around the world, our 850,000 Customer Maniacs are striving each and every day to put a smile on our
customers’ faces. At Yum! Brands, we’re building an operating culture dedicated to 100% CHAMPS with a Yes! Attitude. It’s a daily focus on executing the basics with passion, urgency and excellence so that we will drive Same Store Sales Growth in every restaurant. We know that if we put the customer first in everything we do, then we’re running great restaurants. And when we do that, we’re driving consistent perfor-mance year over year.
This is our fifth year of executing against our operational framework and our fourth year of Customer and Sales Mania training every quarter in every restaurant. Throughout our journey we have not changed our focus, we’ve just become more maniacal about driving our unique oper-ating culture deep to our restaurant teams. And I’m proud to report that we’re making steady progress in our operating measures. While we still have work to do, we’re committed to continuing our efforts to satisfy our customers better than anyone in the industry. It’s that commitment to Customer Mania that will take this company to the next level!
Please open this page to meet some of our very best Customer Maniacs from around the world.
DAVE DENO, CHIEF OPERATING OFFICER
Customer Mania = 100% CHAMPS with a Yes! AttitudePLEASE OPEN
29
of results
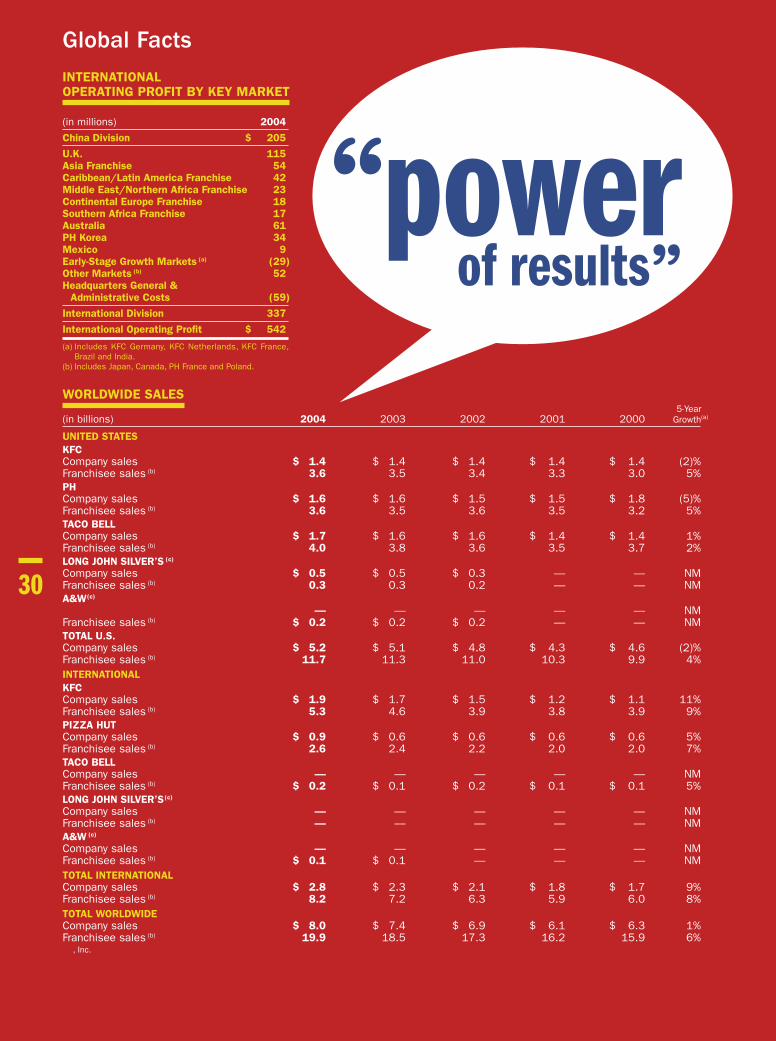
powerGlobal FactsINTERNATIONAL OPERATING PROFIT BY KEY MARKET
(in millions) 2004
China Division $ 205
U.K. 115Asia Franchise 54Caribbean/Latin America Franchise 42Middle East/Northern Africa Franchise 23Continental Europe Franchise 18Southern Africa Franchise 17Australia 61PH Korea 34Mexico 9Early-Stage Growth Markets (a) (29)Other Markets (b) 52Headquarters General & Administrative Costs (59)
International Division 337
International Operating Profit $ 542
(a) Includes KFC Germany, KFC Netherlands, KFC France, Brazil and India.
(b) Includes Japan, Canada, PH France and Poland.
WORLDWIDE SALES 5-Year (in billions) 2004 2003 2002 2001 2000 Growth(a)
UNITED STATESKFCCompany sales $ 1.4 $ 1.4 $ 1.4 $ 1.4 $ 1.4 (2)%Franchisee sales (b) 3.6 3.5 3.4 3.3 3.0 5%PHCompany sales $ 1.6 $ 1.6 $ 1.5 $ 1.5 $ 1.8 (5)%Franchisee sales (b) 3.6 3.5 3.6 3.5 3.2 5%TACO BELLCompany sales $ 1.7 $ 1.6 $ 1.6 $ 1.4 $ 1.4 1%Franchisee sales (b) 4.0 3.8 3.6 3.5 3.7 2%LONG JOHN SILVER’S (c)
Company sales $ 0.5 $ 0.5 $ 0.3 — — NMFranchisee sales (b) 0.3 0.3 0.2 — — NMA&W(c)
— — — — — NMFranchisee sales (b) $ 0.2 $ 0.2 $ 0.2 — — NMTOTAL U.S.Company sales $ 5.2 $ 5.1 $ 4.8 $ 4.3 $ 4.6 (2)%Franchisee sales (b) 11.7 11.3 11.0 10.3 9.9 4%INTERNATIONALKFCCompany sales $ 1.9 $ 1.7 $ 1.5 $ 1.2 $ 1.1 11%Franchisee sales (b) 5.3 4.6 3.9 3.8 3.9 9%PIZZA HUTCompany sales $ 0.9 $ 0.6 $ 0.6 $ 0.6 $ 0.6 5%Franchisee sales (b) 2.6 2.4 2.2 2.0 2.0 7%TACO BELLCompany sales — — — — — NMFranchisee sales (b) $ 0.2 $ 0.1 $ 0.2 $ 0.1 $ 0.1 5%LONG JOHN SILVER’S (c)
Company sales — — — — — NMFranchisee sales (b) — — — — — NMA&W (c)
Company sales — — — — — NMFranchisee sales (b) $ 0.1 $ 0.1 — — — NMTOTAL INTERNATIONALCompany sales $ 2.8 $ 2.3 $ 2.1 $ 1.8 $ 1.7 9%Franchisee sales (b) 8.2 7.2 6.3 5.9 6.0 8%TOTAL WORLDWIDECompany sales $ 8.0 $ 7.4 $ 6.9 $ 6.1 $ 6.3 1%Franchisee sales (b) 19.9 18.5 17.3 16.2 15.9 6% , Inc.
30
“”
29
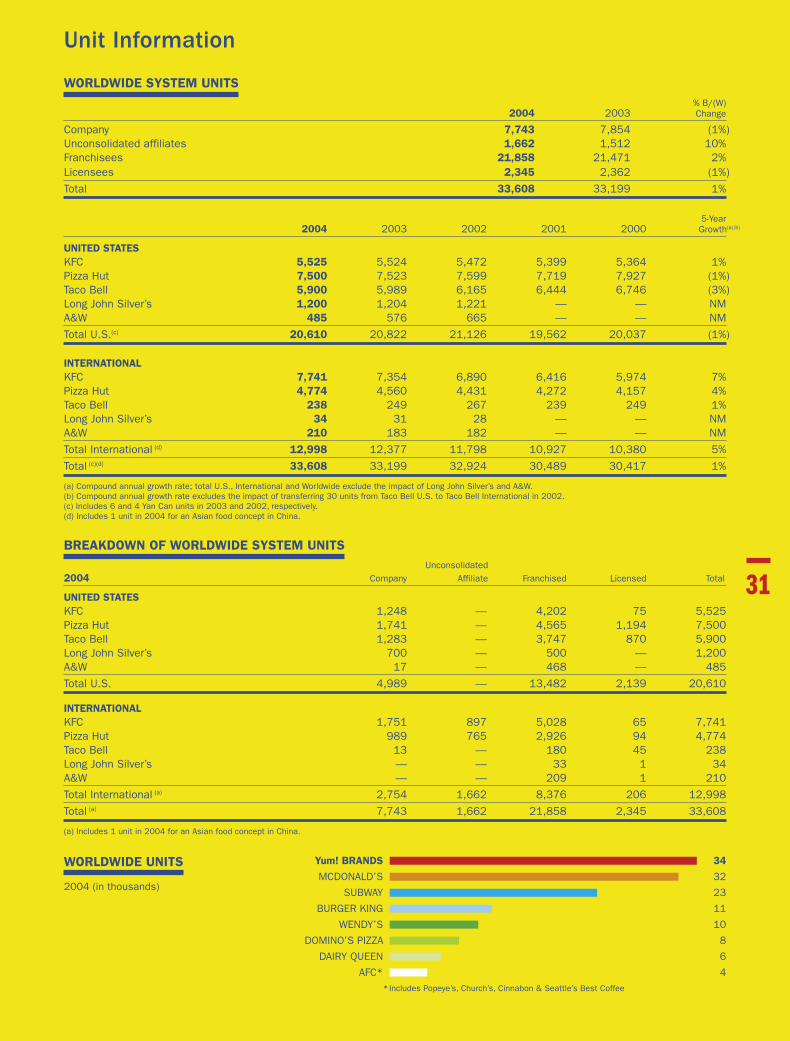
WORLDWIDE SYSTEM UNITS % B/(W) 2004 2003 Change
Company 7,743 7,854 (1%)Unconsolidated affiliates 1,662 1,512 10%Franchisees 21,858 21,471 2%Licensees 2,345 2,362 (1%)
Total 33,608 33,199 1%
5-Year 2004 2003 2002 2001 2000 Growth(a) (b)
UNITED STATESKFC 5,525 5,524 5,472 5,399 5,364 1%Pizza Hut 7,500 7,523 7,599 7,719 7,927 (1%)Taco Bell 5,900 5,989 6,165 6,444 6,746 (3%)Long John Silver’s 1,200 1,204 1,221 — — NMA&W 485 576 665 — — NM
Total U.S.(c) 20,610 20,822 21,126 19,562 20,037 (1%)
INTERNATIONALKFC 7,741 7,354 6,890 6,416 5,974 7%Pizza Hut 4,774 4,560 4,431 4,272 4,157 4%Taco Bell 238 249 267 239 249 1%Long John Silver’s 34 31 28 — — NMA&W 210 183 182 — — NM
Total International (d) 12,998 12,377 11,798 10,927 10,380 5%
Total (c)(d) 33,608 33,199 32,924 30,489 30,417 1%
(a) Compound annual growth rate; total U.S., International and Worldwide exclude the impact of Long John Silver’s and A&W.(b) Compound annual growth rate excludes the impact of transferring 30 units from Taco Bell U.S. to Taco Bell International in 2002.(c) Includes 6 and 4 Yan Can units in 2003 and 2002, respectively.(d) Includes 1 unit in 2004 for an Asian food concept in China.
BREAKDOWN OF WORLDWIDE SYSTEM UNITS Unconsolidated 2004 Company Affiliate Franchised Licensed Total
UNITED STATESKFC 1,248 — 4,202 75 5,525 Pizza Hut 1,741 — 4,565 1,194 7,500 Taco Bell 1,283 — 3,747 870 5,900 Long John Silver’s 700 — 500 — 1,200 A&W 17 — 468 — 485
Total U.S. 4,989 — 13,482 2,139 20,610
INTERNATIONALKFC 1,751 897 5,028 65 7,741 Pizza Hut 989 765 2,926 94 4,774 Taco Bell 13 — 180 45 238 Long John Silver’s — — 33 1 34 A&W — — 209 1 210
Total International (a) 2,754 1,662 8,376 206 12,998
Total (a) 7,743 1,662 21,858 2,345 33,608
(a) Includes 1 unit in 2004 for an Asian food concept in China.
Unit Information
Yum! BRANDS 34
MCDONALD’S 32
SUBWAY 23
BURGER KING 11
WENDY’S 10
DOMINO’S PIZZA 8
DAIRY QUEEN 6
AFC* 4 *Includes Popeye’s, Church’s, Cinnabon & Seattle’s Best Coffee
WORLDWIDE UNITS
2004 (in thousands)
31

Yum! at a glance
Dinner 59% Lunch 35%Snacks/Breakfast 6%
Dine Out 78%Dine In 22%
Dinner 63% Lunch 27%Snacks/Breakfast 10%
Dine Out 72%Dine In 28%
Dinner 42% Lunch 46%Snacks/Breakfast 12%
Dine Out 73%Dine In 27%
Dinner 53% Lunch 44%Snacks/Breakfast 3%
Dine Out 59%Dine In 41%
Dinner 32% Lunch 48%Snacks/Breakfast 20%
Dine Out 50%Dine In 50%
U.S. SALES BY DAYPART BY DISTRIBUTION CHANNEL
Source: The NPD Group, Inc.; NPD Foodworld; CREST
32