h ealth care industry market update facilities · “welcome,” although “the nursing home...
TRANSCRIPT

HEALTH CARE INDUSTRY MARKET UPDATE
Nursing Facilities
May 20, 2003
Dear Friends of CMS: As the regulators of over $500 billion per year of Medicare, Medicaid, and S-CHIP funds, we believe it is incumbent on us to better understand the finances of our contractors, health providers, and other related businesses that provide services to the more than 70 million beneficiaries these programs serve. Health plans, hospitals, nursing homes, home health agencies, medical device manufacturers, and pharmaceutical companies are just some of those whose finances depend heavily on these public programs. I have always been surprised at how little Wall Street and Washington interact—and how companies often paint different financial pictures for each audience. I am a strong believer in adequate funding for our major partners in these programs, but I do not think they should be saying one thing to investors and another to regulators (as it is occasionally in their interest to do). If health plans or providers are struggling to serve our beneficiaries, we should have a thorough understanding of their real financial status to assess the true level of need. Many investment banking firms conduct detailed analyses of major health providers, both for the equity investors in for-profit companies, and for the debt holders of for-profit and nonprofit entities. Health systems typically provide these investors with clear financial data. These data can be used by regulators and legislators to assess funding adequacy or the need for regulatory reforms. CMS’ Office of Research, Development & Information (ORDI) has gathered research reports from the major investment firms, summarized their analyses, and condensed them into a short, and hopefully, understandable format. Our goal is to provide objective summary information that can be quickly used by CMS, HHS, Congress, and their staffs that oversee these programs. The primary person at CMS assigned to this task is Lambert van der Walde. Lambert previously worked for Salomon Smith Barney in New York and is experienced with corporate financial analysis and research review. Also on the team is Kristen Choi who previously worked for JPMorgan in New York in health care equity research. This Market Update focuses on nursing facility companies, updating our first report about this sector published February 6, 2002. The industry currently faces issues including the effect of the sunset of certain Medicare add-on payment provisions, risk to Medicaid payments as states balance tight budgets, and rising liability costs. In coming months, we will continue to review the major provider and supplier sectors. Though I am proud of this effort, and believe it will add to understanding of the programs, we welcome comments on the content and format of this report. We want to make this as consumer friendly as possible for everyone who reads it. Please provide comments to Lambert van der Walde at [email protected] or Kristen Choi at [email protected]. Sincerely, Tom Scully

HEALTH CARE INDUSTRY MARKET UPDATE
Nursing Facilities
May 20, 2003
Tom Scully Administrator Office of Research, Development & Information:
Lambert van der Walde [email protected]
Kristen Choi [email protected]
Wall Street’s View of Nursing FacilitiesInvestor sentiment is mostly negative due to uncertainties related to government payment and the rising cost of liability insurance. Profit margins continue to decline after the October 2002 sunset of over $1 billion of federal Medicare add-on payment provisions, exacerbating Wall Street’s concerns about Medicaid payment levels.
Rising insurance costs and aggressive litigation have led to the exit of many nursing facility chains from states where liability costs are high.
Analysts worry how some chains, especially those that have recently emerged from bankruptcy, will weather the uncertain government payment environment.
Three chains have filed for bankruptcy in the last six months.
For nursing facilities, access to equity financing is essentially nonexistent and debt financing is available to only a few.

Nursing Facilities − May 20, 2003
CONTENTS
Executive Summary 3 Wall Street’s View 4 Industry Overview 5 Industry Performance 8
Add-on Payment Sunset 8 For-profit, Publicly Traded Nursing Facility Chains 8 Not-for-profit Nursing Facilities 11 Expenses 12
Access to Capital 14
Sources & Uses of Capital 14 Solvency 20 Not-for-profit Access to Capital 21
Revenue Sources 23 Private Sources 23 Public Sources 24
Summary 26

Nursing Facilities − May 20, 2003 -3-
Wall Street is more pessimistic about sector prospects. About $1.4 billion of Medicare add-on payment provisions sunset on October 1, 2002. Higher Medicare payments subsidize lower Medicaid payments for nursing facilities. Many chains are exiting states where liability costs are prohibitively high. Access to capital is extremely limited.
EXECUTIVE SUMMARY
Wall Street’s outlook for the nursing facility sector has grown more negative over the past year. Investment analysts’ main concerns are the sunset of certain Medicare add-on payment provisions, potential Medicaid cuts by states, and skyrocketing liability costs. The Medicare add-on payment provisions sunset on October 1, 2002. Congress originally created these add-on payments to help skilled nursing facilities transition from a cost-based to a prospective payment system. Average profit margins of the publicly traded, for-profit nursing facility companies were declining both before the sunset, (from 2.8% in the first quarter of 2002 to 2.0% in the third quarter) and after the sunset (down to 1.4% in the fourth quarter of 2002 and 1.1% in first quarter of 2003). Some investment analysts believe the not-for-profit and smaller facilities may be hit harder by the sunset. These facilities may be less able to absorb the sunset’s impact due to slimmer operating profit margins and declines in investment income from endowments and charitable contributions in 2002. Wall Street analysts understand that many nursing facilities use higher Medicare and private pay rates to subsidize lower Medicaid payments. Medicare, however, covers only about 10%-15% of nursing facility residents while Medicaid covers 65%-70% at typically lower per diem rates. The Medicare add-on provision sunset has exacerbated Wall Street analyst concerns about Medicaid payment. Analysts worry that fiscal concerns may force states to reduce or freeze Medicaid rates. According to a January 2003 Kaiser Commission on Medicaid and the Uninsured study, 37 states plan to reduce or freeze funding for nursing care in fiscal 2004. Nursing facility margins have also declined due to increases in patient care liability cases, average claim sizes, and insurance premium costs. High and unpredictable liability costs have become a significant driver in many business decisions, including asset sales, relatively expensive financing structures, and bankruptcy filings. Many chains are divesting nursing facilities in those states where liability costs are disproportionately high. In 2002, the three largest nursing facility chains each had large, unexpected increases to the amount of resources reserved that estimate future settlement payments. Although most investment analysts believe the industry is struggling, many do not believe that the industry is necessarily returning to the early days of PPS implementation, during which time five of the top eight nursing facility chains filed for bankruptcy. Two of these companies emerged from bankruptcy in 2001, and another two emerged in 2002. Some investors, however, are concerned that current market conditions could result in a second wave of bankruptcies. Since December 2002, Centennial Healthcare (the 12th largest chain) and two smaller regional chains have filed for bankruptcy. With these uncertainties looming, access to capital is limited. New equity capital is almost non-existent, while publicly-held debt is available to only the highest quality issuers. Other sources of capital, including real estate investment trusts (REITs) and commercial banks, have also diminished for those facilities that have not branched out into other more profitable types of senior care businesses, such as assisted living and continuing care retirement communities (CCRCs). The industry will require a significant amount of capital to refinance maturing debt and maintain facilities in the near-term.

Nursing Facilities − May 20, 2003 -4-
Decreased Medicare payments have reduced profit margins. Investors worry that nursing facilities will not be able to absorb Medicaid cuts. Aggressive patient care litigation has driven up insurance premiums and uncertainty over the timing and magnitude of future settlement payments.
WALL STREET’S VIEW
Skilled nursing facilities struggled after the BBA and profit margins continue to decline due to the sunset of certain BBRA and BIPA add-on provisions on October 1, 2002.1 Congress created these temporary provisions to help nursing facilities transition from a cost-based to a prospective payment system. Waxing and waning prospects for legislation that would restore these add-on payments have clouded the outlook for the sector, whose profit margins have been declining. Jerry Doctrow of Legg Mason writes, “2002 began and ended with concerns over government reimbursement for nursing home operators taking a toll on share prices.” The future is especially murky for the smaller and not-for-profit homes, as well as the larger chains that have recently re-emerged from Chapter 11 bankruptcy filings. A.J. Rice of Merrill Lynch describes CMS’ recently proposed 2.9% full market basket increase to Medicare SNF payments in fiscal 2004 as “welcome,” although “the nursing home industry continues to be in dire straights.…” With states under increasing fiscal pressure, analysts worry that Medicaid nursing facility rates may be frozen or reduced. Every Wall Street nursing facility analyst is concerned states will freeze or cut Medicaid payments to nursing facility providers due to mounting fiscal distress and rising Medicaid costs. Unlike the federal government, many states must balance their budgets. As state revenues fall, funding must be cut. Several states have announced Medicaid provider payment cuts, others have maintained existing levels, and a smaller number have announced modest increases. It is widely understood by Wall Street that for most nursing facilities higher Medicare payment helps subsidize lower Medicaid payment. With the sunset of Medicare add-on provisions, investors worry that nursing facilities will not have much room to absorb potential Medicaid cuts as well. Skyrocketing liability insurance cost increases are a major contributor toward the exit or bankruptcy of nursing facility operators in certain states. Jason Kroll of Bear Stearns estimates that nursing facility liability insurance costs continue to rise between 25% and 35%. Both the number of lawsuits per 1,000 beds as well as the average claim size have tripled over the past ten years, according to AON Risk Consultants. Unexpected material increases in insurance accruals (i.e., reserved resources which estimate future settlement payments) have also depressed stock prices: in 2002, Beverly’s annual insurance accruals grew 50% to $66 million, Kindred’s grew 50% to $82 million, and Manor Care’s grew 20% to $72 million. Doctrow writes, “[V]ery high liability expense levels will continue to pressure nursing home operator cash flows and operating margins for the next year or two at least, in some cases forcing firms into bankruptcy reorganization when liability costs are added to Medicare and potential Medicaid cuts.” In states where liability costs have become too burdensome, or where liability insurers have been unwilling to offer products to long-term care providers, nursing facilities are being closed or divested. Wall Street analysts believe state tort reform may help control rising costs.
1 BBA: Balanced Budget Act of 1997. 1 BBRA: Balanced Budget Refinement Act of 1999. 1 BIPA: Beneficiary Improvement and Protection Act of 2000.

Nursing Facilities − May 20, 2003 -5-
Medicare does not cover nursing care on a long-term basis, as Medicaid does.
INDUSTRY OVERVIEW
Nursing homes provide both short-term rehabilitative and long-term care for patients who require skilled nursing and therapy care on an inpatient basis. There are about 16,500 nursing homes certified to provide Medicare and/or Medicaid care in the United States, with approximately 1.8 million total beds. About 3.5 million people will live in a nursing home during the course of a year. Skilled nursing facility (SNF) is the Medicare designation for a facility that provides beneficiaries with short-term, residentially-based skilled nursing and therapy care. Medicare SNF coverage is limited to 100 days per spell of illness for those beneficiaries who require daily skilled care following a discharge from a stay in an acute care hospital lasting at least three days. Medicare does not cover SNF care on a long-term basis. If beneficiaries continue to require care in a skilled nursing facility once Medicare coverage expires, they can pay out-of-pocket (private pay) as long as they have assets or sufficient income. Once their assets are “spent-down,” they become Medicaid eligible.2 Most SNFs are also certified as nursing facilities under Medicaid and furnish Medicaid and private pay patients with a combination of skilled rehabilitative care and long-term treatment for functional deficits and chronic conditions. Medicare classifies about 15,000 nursing homes as SNFs. About 85% of SNFs are freestanding nursing homes while the other 15% are hospital-based (a SNF unit of an acute care hospital or under administrative control of a hospital). Three-quarters of freestanding SNFs are operated as for-profit entities, while the majority of hospital-based SNFs are attached to not-for-profit hospitals. In total, approximately 65% of nursing homes are owned by for-profit entities, while 28% are owned by not-for-profit organizations and the remainder are owned by government agencies usually at the city or county level. About half of all freestanding SNFs, or two-thirds of all for-profit SNFs, are owned or operated by chains. Many of the largest chains also have significant non-nursing facility lines of business including home health services, long-term acute care hospitals, and assisted living facilities. The financial results for these chains are presented on a consolidated basis in this report.
For-profit entities own 65% of nursing homes.
Figure 1: Nursing Home Facilities and Beds, by Type of Ownership
Type of Ownership Number of Facilities Percent Number of Beds PercentFor-profit 10,759 65.4% 1,188,643 66.2%Not-for-profit 4,676 28.4% 485,706 27.1%Government 1,011 6.1% 120,923 6.7%Total 16,446 100.0% 1,795,272 100.0%
Source: CMS, OSCAR data as of April 2003.
The industry remains very fragmented, with no dominant providers. As of April 2003, the top ten nursing facility companies by bed count accounted for 15.5% of beds, declining from 18.5% in January 2002. The largest chains have divested beds faster than the overall sector. The combined bed count of the top ten chains showed a decline of 17.9% compared to an overall decline in nursing facility beds of 2.1%. This trend may be due to recent exits of the largest chains from states with high liability costs such as Florida.
2 Income and asset tests to determine Medicaid eligibility vary from state to state.

Nursing Facilities − May 20, 2003 -6-
The largest chains have divested beds faster than the overall sector.
Figure 2: Top Ten Nursing Home Facility Companies by Bed Count
April-03 January-02 Change in Number of
Beds% of Total
BedsNumber of
Beds% of Total
BedsNumber of Beds
Beverly Enterprises Inc. 49,396 2.8% 61,716 3.4% -20.0%Manor Care, Inc. 38,666 2.2% 39,659 2.2% -2.5%
Kindred Healthcare, Inc. (formerly Vencor) 36,417 2.0% 38,909 2.1% -6.4%Mariner Health Care, Inc. 34,702 1.9% 44,607 2.4% -22.2%Integrated Health Services, Inc. 25,169 1.4% 38,282 2.1% -34.3%Sun Healthcare Group, Inc. 24,267 1.4% 32,311 1.8% -24.9%Genesis Health Ventures, Inc. 24,264 1.4% 29,666 1.6% -18.2%Life Care Centers of America 16,587 0.9% 19,928 1.1% -16.8%The Evangelical Lutheran Good Samaritan Society 14,892 0.8% 16,077 0.9% -7.4%Extendicare Health Services, Inc. 13,600 0.8% 17,529 1.0% -22.4%Top 10 Total 277,960 15.5% 338,684 18.5% -17.9%
Total Beds 1,795,272 100.0% 1,834,448 100.0% -2.1%
Source: CMS, OSCAR data.
From 1980 to 1997, Medicare nursing home spending grew eight times more than total nursing home spending.
According to CMS’ Office of the Actuary, U.S. spending on freestanding nursing home care was $98.9 billion in 2001, up 5.5% from 2000. As seen in Figure 3, national freestanding nursing home expenditures grew from $17.7 billion in 1980 to $85.1 billion in 1997, growth of 381% or an average annual rate of 9.7%. During this same period, Medicare freestanding nursing home expenditures exploded from $307 million to $9.6 billion, growth of 3022% or an average annual rate of 30.0%. Nursing home care was one of the fastest growing components of the Medicare program during that time.
Figure 3: National Freestanding Nursing Home Care Expenditure Growth, 1980-2012E
0%
2%
4%
6%
8%
10%
12%
14%
16%
18%
1980
1982
1984
1986
1988
1990
1992
1994
1996
1998
2000
2002
E
2004
E
2006
E
2008
E
2010
E
2012
E
Gro
wth
of N
ursi
ng H
ome
Car
e Ex
pend
iture
s
$0
$20
$40
$60
$80
$100
$120
$140
$160
$180
$200
Nursing H
ome C
are Expenditures
Nursing HomeCare Expenditures(Right Axis)
Grow th (Left Axis)
Source: CMS, Office of the Actuary, National Health Statistics Group.
Before BBA 1997 mandated the implementation of SNF PPS, Medicare paid SNFs based
on their reported costs of care, subject to certain limits for routine costs (e.g., nursing, room, and board). Not being subject to the same limits, ancillary services skyrocketed during this time. Utilization also grew rapidly, while average acute-care hospital length of stay decreased. To curb these growth rates, Congress mandated the implementation of a SNF prospective payment system, which pays a per diem rate adjusted for resource needs and geographic

Nursing Facilities − May 20, 2003 -7-
location. The implementation of SNF PPS caused Medicare freestanding nursing home spending to decline 18% in 1999 and national freestanding nursing home spending grew only 0.5%. Growth picked up again after Congress created temporary add-on payment provisions to help the industry transition from the cost-based to the PPS in BBRA 1999 and BIPA 2000.
Credit Suisse First Boston (CSFB) believes that Medicare’s prospective payment system for inpatient hospital stays, implemented in 1983, encourages hospitals to discharge patients “quicker and sicker” compared to a cost-based payment system. The average acute-care hospital length of stay decreased from 4.95 days in 1992 to 4.00 days in 1999, a drop of 19%. CSFB believes this trend resulted in relatively sicker hospital discharges, increasing the number and acuity of cases requiring skilled nursing facility care. Increased utilization and payment per stay contributed to the rapid rise of Medicare nursing home care expenditures in the 1990s.

Nursing Facilities − May 20, 2003 -8-
INDUSTRY PERFORMANCE
Add-on Payment Sunset About $1.4 billion of SNF add-on payment provisions sunset on October 1, 2002. For fiscal 2003, the effect of the sunset was partially offset by a market basket3 increase of 3.1% minus 0.5% as set forth in BIPA 2000, for a net increase of 2.6% (about $400 million). In addition, SNFs retained about $1.0 billion of separate add-on payments in fiscal 2003, which will remain in effect until case-mix refinements are made to the resource utilization group (RUG) system.4 CMS has indicated that it does not plan to implement the case-mix refinements for fiscal 2004. CMS is required to report to Congress alternatives to the existing RUG system by January 1, 2005. The add-on provision sunset is further described in the text box on page 9. In May 2003, CMS proposed a full market basket increase of 2.9% to Medicare SNF payments for fiscal 2004. The proposed rule will result in nearly $400 million in increased payments.
For-profit, Publicly Traded Nursing Facility Chains The major, publicly traded, U.S.-based companies in the nursing facility sector are Manor Care, Beverly Enterprises, Extendicare Health Services (the U.S. subsidiary of the Canadian-based Extendicare, Inc.), Kindred Healthcare (formerly Vencor), Mariner Health Care (formerly Mariner Post-Acute Network), Sun Healthcare, and Genesis Health Ventures. Kindred and Genesis both emerged from bankruptcy proceedings in 2001. Mariner and Sun emerged from bankruptcy in 2002. Integrated Health Services, which is not publicly traded, continues to undergo Chapter 11 bankruptcy restructuring.
Figure 4: Market Cap Table, U.S. Nursing Facility Companies ($ in millions)
Ticker Market CapManor Care HCR $ 2,113Genesis Health Ventures GHVI $ 672Beverly Enterprises BEV $ 322Kindred Healthcare KIND $ 293Extendicare Health Services EXE/A $ 200Mariner Health Care MHCA $ 91Sun Healthcare SUHG $ 15
Source: Bloomberg. As of May 15, 2003. Note: Market capitalization is a measure of company’s equity value or size, calculated by multiplying share price by the number of shares outstanding.
3 CMS uses a skilled nursing facility “market basket” to measure inflation in the prices of an appropriate mix of goods and services included in covered skilled nursing facility stays. The price of items in the market basket is measured each year, and Medicare payments are adjusted accordingly. 4 Medicare pays for SNF services under a prospective payment system (PPS). Under the PPS, each beneficiary is designated to one of 44 resource utilization groups (RUGs). Each RUG includes patients with similar service needs that are expected to require similar amounts of resources. The per diem payment rate for each RUG is calculated as the sum of three components for 1) routine services (e.g., room and board, linens, and administrative services), 2) nursing services, and 3) therapy services.

Nursing Facilities − May 20, 2003 -9-
Post-BBA Medicare Add-On Payments After the skilled nursing facility industry asserted financial difficulty as a result of the prospective payments system (PPS) implementation, Congress passed several temporary Medicare reimbursement increases in BBRA 1999 and BIPA 2000 to help skilled nursing facilities transition from a cost-based payment system to the PPS. Congress mandated the SNF PPS in order to encourage efficiency and control skyrocketing costs of Medicare nursing facility care. Deutsche Bank’s Henry Reukauf believes the nursing facility industry has already cut costs significantly and does not have many more remaining avenues to improve efficiency. Figure 5: SNF Add-on Payment Descriptions
Add-on Description
Statute
Comment
Status
Average Per Diem Effect, FY2003
Annual Payments, FY2003
20% increase for 15 high-acuity RUGs(1)
BBRA 1999
20% increase will be eliminated once HHS refines the RUGs
Current $19.88 $1.0 billion
6.7% increase for 14 rehabilitation therapy RUGs
BIPA 2000
Redirected the 20% increase granted in BBRA 1999 from 3 of those 15 RUGS to an additional 11 RUGs
Current Neutral Neutral to 20% increase in BBRA 1999
4% increase across all RUGs BBRA 1999
Increased adjusted Federal per idem payment rate, exclusive of 20% increase
Sunset on 10/1/02
$9.94 $500 million
16.66% increase for nursing component
BIPA 2000
Increased nursing component of case-mix adjusted Federal rate
Sunset on 10/1/02
$17.89 $900 million
Elimination of market basket index reduction of 1.0% (enacted by BBA 1997)
BIPA 2000
1.0% increase in fiscal year 2001 retained in base rate when CMS applied update for fiscal 2002 rates
Current $1.99 $100 million
Source: CMS. Note: Average Medicare per diem payment, including beneficiary co-payment, is estimated to be $295 in fiscal year 2003. The fiscal year for SNF Medicare payment begins October 1. (1) Resource Utilization Group (RUG): Under the SNF prospective payment system, each beneficiary is designated to one of 44 RUGs. Each RUG includes patients with similar service needs that are expected to require similar amounts of resources. Each RUG has a per diem payment rate. Provisions for the 4% across-the-board increase and the 16.66% nursing component increase sunset as scheduled on October 1, 2002. Wall Street analysts generally do not expect legislation to restore these add-on payments given increased concerns about deficit spending and conflict in the Middle East. Even Ankur Gandhi, a Goldman Sachs debt analyst who is known for her atypically more positive outlook on the nursing facility sector, characterizes the negative impact on certain nursing facility operators:
[T]he October 1, 2002 reduction in Medicare reimbursement has been detrimental for the nursing home sector. This, combined with Medicaid rate pressure and increases in professional liability costs, has resulted in a worsening of operating results for nursing homes and minimal future growth potential, a lack of access to capital markets for many operators, and bankruptcies of smaller chains such as Centennial Healthcare and now potentially Sun Healthcare.

Nursing Facilities − May 20, 2003 -10-
In the mid-1990s, profit margins of the large, for-profit nursing facility chains were in the 5% to 7% range. In 2002, the average profit or net income margin was 2.2% for Beverly, Extendicare, Genesis, Kindred, and Manor Care, Mariner, and Sun. Calendar year 2002 results were impacted by one quarter of operations after the add-on provision sunset.
Figure 6: Publicly-Held Nursing Facility Company Income Statement Summaries, 2002 ($ in millions)
Beverly(BEV)
Extendicare (EXE/a)(1)
Genesis (GHVI)(2)
Kindred (KIND)(2)
Manor Care (HCR)
Mariner (MHCA)(2,3)
Sun(SUHG)(2,4) Average(5)
Revenue $ 2,494.2 $ 815.1 $ 2,654.3 $ 3,357.8 $ 2,903.4 $ 1,183.7 $ 1,598.2 NM EBITDAR Margin 11.9 % 11.2 % 9.6 % 12.3 % 13.9 % 8.6 % 9.1 % 10.9 %EBITDA Margin 8.4 % 9.9 % 8.5 % 4.3 % 13.2 % 6.1 % 1.1 % 7.4 %EBIT Margin 5.0 % 5.3 % 6.1 % 2.1 % 8.9 % 4.2 % (0.6)% 5.2 %Pretax Margin 2.5 % 1.1 % 4.3 % 2.0 % 7.7 % 2.3 % (1.5)% 3.3 %Net Inome Margin 1.6 % 0.6 % 2.6 % 1.2 % 4.8 % 2.2 % (1.5)% 2.2 %
Sources: Company filings and analyst models. Notes: Income statement data presented on a consolidated basis and included non-nursing facility lines of business, which may be significant. All non-recurring items are excluded from results. (1) Canadian-based Extendicare generated 73% of 2002 revenue in the U.S. through its wholly owned subsidiary Extendicare Health Services and its subsidiaries; results shown are for U.S. operations only in U.S. dollars. (2) Because these companies emerged from Chapter 11 bankruptcy using “fresh-start” accounting, results are shown for 2002 operations post-emergence only. Unless noted otherwise, results are shown for full calendar year 2002. (3) Mariner results include operations for eight months ended December 31, 2002 only. (4) Sun results include operations for ten months ended December 31, 2002 only. (5) Averages exclude negative margin values. Definitions: Margin: Value expressed as a percent of total revenues. EBITDAR: Earnings before Interest, Taxes, Depreciation, Amortization, and Rent
EBITDA: Earnings before Interest, Taxes, Depreciation, and Amortization. EBIT: Earnings before Interest and Taxes. Pretax: Earnings before Taxes.
Since the add-on provision sunset, the nursing facility industry has reported financial
results for the fourth quarter of 2002 and the first quarter of 2003. The sunset’s impact varied from provider to provider. Fourth quarter revenue declines attributed to the sunset were $14.0 million for Beverly (2.3% of revenues), $8.8 million for Mariner (2.0%), and $15.0 million for Kindred (1.8%). Following the sunset, margins continued to decline.
The Medicare add-on provision sunset reduced margins further in the fourth quarter of 2002.
Figure 7: Average Margins for Large Publicly Traded Nursing Facility Chains, Quarterly
12.6% 12.3%11.7%
10.5%10.0%
9.6% 9.4%8.8%
7.7%7.2%
2.8%2.2% 2.0%
1.4% 1.1%
0%
2%
4%
6%
8%
10%
12%
14%
Q1'02 Q2'02 Q3'02 Q4'02 Q1'03
Mar
gin
EBITDAR
EBITDA
Net Income
First quarter post-sunset
Source: Public filings, company information, and analyst models. Note: Results exclude extraordinary and non-recurring items. Companies represented include Beverly, Extendicare Health Services, Kindred, Genesis, and Manor Care. Calendar year quarters. Meaningful quarterly data is unavailable for Sun and Mariner, which both emerged from bankruptcy mid-year. Kindred and Genesis financials reflect company reorganizations post-Chapter 11 filings.

Nursing Facilities − May 20, 2003 -11-
Medicare and private pay revenue subsidize Medicaid losses. Industry estimates suggest that average Medicaid payment falls short of costs.
Both Wall Street and the nursing facility industry recognize Medicare payment rates more than cover the cost of care for Medicare patients. Both the General Accounting Office (GAO)5 and the Medicare Payment Advisory Commission (MedPAC)6 concur that Medicare payment for nursing care exceeds costs. In its March 2003 report to Congress, MedPAC estimates that the Medicare margin for all SNFs will be about 5% in fiscal 2003. GAO estimates the median Medicare margin for all freestanding SNFs was 19% in 2000. Investors and industry representatives also agree that many nursing facilities depend on higher payments from Medicare and private pay (about one-third of patient days combined) to subsidize lower payments from Medicaid (two-thirds of patient days).7 The GAO acknowledges that the larger Medicaid’s share of a SNF’s patient days, the smaller the SNF’s total margin. MedPAC also acknowledges the cross-subsidy, but believes that it is “an inefficient way of improving the financial situation of this industry.” MedPAC cites Medicare’s small revenue mix, a disincentive for states to increase Medicaid funding, and inappropriate fund allocation towards high-Medicare-mix instead of high-Medicaid-mix facilities as flaws in the cross-subsidy. Industry representatives counter that, although not ideal, this cross-subsidization is critical for the industry’s short- to medium-term sustainability. In an industry-commissioned survey, accounting firm BDO Seidman estimated that the average Medicaid payment of about $115 per day fell short of costs by $9.78 per day in 2000. BDO also estimated that unreimbursed Medicaid nursing care costs exceeded $3.0 billion in a survey of 37 states, or $3.5 billion when extrapolated to all 50 states, in 2000.
Not-for-profit margins are slim.
Not-for-profit Nursing Facilities About 28% of nursing homes are not-for-profit entities, meaning that revenues generated in excess of costs must be reinvested back into the entity. The GAO has used Medicare cost report data to look at nursing home profit margins by ownership. The GAO found that the median total margin for not-for-profit SNFs was 0.6% in 1999 and 0.3% in 2000, compared to for-profit margins of 1.6% in 1999 and 2.2% in 2000. The American Association of Homes and Services for the Aging (AAHSA), an industry association for the not-for-profit long-term care industry, did a similar analysis of not-for-profit SNF margins. AAHSA bases its analysis on the 990 federal tax form, which not-for-profit organizations with annual revenues over $25,000 are required to file with the IRS. AAHSA estimated that average total margin of a not-for-profit, freestanding, Medicare-certified SNF was 1.9% for the tax year 2001. The AAHSA study found that facilities incurred a negative 4.3% operating margin, and relied on public contributions, investment income and principal from endowments, and the proceeds from sales of assets to cover operating losses. Although neither of these analyses is directly comparable to the GAAP (generally accepted accounting principles) financial reporting required of the publicly traded nursing facilities, they do corroborate each other in showing that not-for-profit margins are slim. The GAO study shows that not-for-profit margins are lower than those of the for-profit facilities. Also, the AAHSA study illustrates how not-for-profit facilities rely on supplemental sources of income beyond program revenues.
5 The General Accounting Office (GAO) is the audit, evaluation, and investigative arm of Congress. 6 MedPAC is an independent federal body that advises the U.S. Congress on issues affecting the Medicare program. 7 For further discussion on payor mix, see pages 23-24.

Nursing Facilities − May 20, 2003 -12-
A labor shortage continues to challenge the industry, although this pressure may be moderating.
Expenses Nursing facilities incur a variety of operating expenses for rent, labor, food, supplies, drugs, equipment, insurance, administration, and other overhead. Investment analysts recently have focused primarily on labor and liability insurance cost trends. Labor During the late 1990s, many nursing facilities cited rapidly escalating labor costs, which were exacerbated by a nursing shortage, as a contributor to deteriorating financial performance. Employee costs represent nursing facilities’ largest expense at approximately 55% to 65% of net revenues, according to Bear Stearns’ Jason Kroll. While the nursing shortage continues, analysts have noticed a recent moderation in labor cost growth as nursing facilities are decreasing reliance on more expensive nursing staffing agencies and turnover is lower in a weak economy. Merrill’s A.J. Rice comments that Manor Care’s 2002 and first quarter 2003 results showed that “[l]abor rate pressures are showing signs of moderating.” A 2002 industry survey found that nursing facilities experienced lower vacancy rates among nursing positions in June 2002 compared to June 2001. Nonetheless, a significant nursing shortage—about 96,000 vacancies in 2002, particularly for the most highly trained nurses—continues to challenge the industry. High turnover also demands that nursing facilities offer attractive wages and benefits to retain staff.
Liability costs are skyrocketing. The average liability claim size has tripled over the last ten years.
Liability Insurance More concerning to analysts than labor costs is the rising cost of liability insurance and settlement payments. JPMorgan’s Matthew Ripperger reports that in 2002, three major nursing facility companies announced unexpected material increases in their annual insurance accruals (i.e., reserved resources which estimate future settlement payments): Beverly was up 50% to $66 million, Kindred was up 50% to $82 million, and Manor Care was up 20% to $72 million. Jason Kroll of Bear Stearns estimates that nursing facility liability insurance costs continue to grow between 25% and 35%. Lehman’s Adam Feinstein notes the rising number of lawsuits and cost of settlements has depressed earnings. Based on data provided by the long-term care industry, AON Risk Consultants found, “Countrywide increases are the result of an explosion in litigation that started in a handful of states and is spreading to a multitude of regions throughout the country.” The national average of liability costs per occupied skilled nursing bed has grown at an average rate of 24% per year since 1991. The analysis also found that the average size of claims, as well as the number of claims per 1,000 beds, has tripled over the past ten years. Figure 8 shows the growth of these costs in recent years.
Figure 8: Long-Term Care Faces Increasing Liability Costs
2000. Growth 2001. Growth 2002. GrowthAverage liability loss costs / occupied long term care bed $2,100 15% $2,340 11% $2,880 23%Average size of a professional liability claim $182,000 9% $182,000 0% $198,000 9%Average claims per year per 1,000 beds 11.5 6% 12.8 11% 14.5 13%
Source: AON Risk Consultants.
These increasing costs parallel the exit of many insurance carriers from the long-term care provider liability market altogether. Over the past five to six years, the number of carriers offering long-term care provider liability insurance has been declining according to a preliminary study conducted by HHS’ Office of the Assistant Secretary for Planning and

Nursing Facilities − May 20, 2003 -13-
Evaluation. For example, in Texas, the number of state-licensed insurance carriers who Liability insurance premiums rise while coverage is reduced.
provide this type of insurance has dropped from 8 in 1996 to 2 in 2002. In Florida, there are no state-licensed carriers of long-term care provider liability insurance. Goldman’s Ankur Gandhi writes:
As a result of the rise in severity and frequency of claims filed, and owing to the unpredictable nature of results, many insurance companies have exited the market and no longer provide coverage. Consequently, annual commercial insurance premium levels increased more than 130% on average between 2000 and 2001, often with reduced coverage. This increase is significantly higher than the annual countrywide professional liability loss cost increase of 24%, and is the result of the inadequacy of past premium levels and the uncertainty associated with projecting future claims.
Legg Mason’s Jerry Doctrow writes, “[V]ery high liability expense levels will continue to pressure nursing home operator cash flows and operating margins for the next year or two at least, in some cases forcing firms into bankruptcy reorganization when liability costs are added to Medicare and potential Medicaid cuts.”
Some nursing facilities have elected to operate without liability insurance.
Many nursing facility companies either have divested or plan to divest operations in certain states with high liability costs, including Florida, Texas, and other Gulf states. Extendicare exited the Texas market in the fourth quarter of 2001 and the Florida market in the second quarter of 2002. Beverly plans to divest facilities that represent 50% of projected 2002 patient care liability costs. Kindred plans to divest its Florida operations. Kroll believes that this strategy may stave off further increases in accruals in the near-term future, rather than reduce costs outright. Strategic exits may help limit future liability, but nursing facilities are still exposed to a liability “tail” for incidents previous to the closure or sale of the facility, depending on state statutes of limitation. There have also been reports of smaller, independent nursing facilities that have elected to operate without insurance altogether. For example, a University of South Florida study found that before Florida required all nursing facilities to have liability coverage, one in five facilities were without coverage. The Texas not-for-profit nursing home association estimates that 50% of nursing facilities operate without liability coverage. Nursing facilities may benefit from state tort reform measures, notably in Florida, Texas, California, and Mississippi. Recently enacted reform measures will, however, likely be subject to court challenges by the plaintiff bar, further delaying positive changes to nursing facility liability insurance costs. Many other state legislatures are considering reform proposals. Ohio, which has not historically been a highly litigious state from the perspective of nursing facility claims, passed pre-emptive tort reform measures as well in January 2003. Some nursing facilities have begun using arbitration to limit medical liability. Patients are asked upon admission to agree to arbitration to settle future disputes. In the fourth quarter of 2002, Beverly reported it was able to sign up 75% of newly admitted patients for arbitration. While Kroll is hopeful that arbitration may be part of the solution, he points out, “[I]t is unclear whether it is only the less litigious patients who are agreeing to arbitration” and therefore whether this approach will materially affect liability costs.

Nursing Facilities − May 20, 2003 -14-
ACCESS TO CAPITAL
Sources & Uses of Capital Nursing facilities invest capital for purposes including maintaining and updating current facilities, building or acquiring new facilities, reducing debt and debt payments, and repurchasing stock. If nursing facilities do not generate sufficient cash flow, capital may also be used to sustain operations. Equity Equity analysts have a generally negative outlook on the nursing facility sector. The publicly traded nursing facility chains have averaged a 3% year-to-date return, compared to the S&P 500 performance of 8%.
Figure 9: Average Nursing Facility Company Stock Performance versus S&P
28%
-50%
3%
-13%
-23%
8%
-60%
-50%
-40%
-30%
-20%
-10%
0%
10%
20%
30%
2001 2002 2003 YTD
Stoc
k Pe
rform
ance
Nursing FacilityCompany AverageS&P 500
Source: Bloomberg. As of May 15, 2003. Average is equally weighted. Average includes Beverly (BEV), Extendicare (EXE/A), Genesis (GHVI), Kindred (KIND), Manor Care (HCR), Mariner (MHCA), and Sun Healthcare (SUHG) while trading under noted tickers for specified years.
Uncertainty reduces the industry’s ability to forecast and manage finances, which in turn reduces access to capital. Most analysts do not believe the industry can raise capital in the equity markets due to continuing uncertainty about the possibility of legislation that may affect Medicare rates, threats to Medicaid rates, and skyrocketing liability insurance costs.
No public equity was issued for the nursing facility sector in 1999, 2000, and 2001.
Figure 10: Public Equity Issuance for Nursing Facility Industry, 1993-2002 ($ in millions)
$250
$656
$228
$662
$154$28$99
6
11
7
9
4
2
0 0 0
1
$0
$100
$200
$300
$400
$500
$600
$700
$800
$900
$1,000
1993 1994 1995 1996 1997 1998 1999 2000 2001 2002
Equi
ty Is
suan
ce V
olum
e
0
2
4
6
8
10
12
Num
ber of Transactions
Volume
# of Transactions
Source: SDC and Salomon Smith Barney. As of April 18, 2003.

Nursing Facilities − May 20, 2003 -15-
Debt The nursing home industry obtains most long-term financing from the debt markets. The interest rate payment typically rises as the quality of the bond declines. Being highly leveraged negatively impacts a company’s profitability, as interest payments eat into profit margins. Debt analysts focus on a company’s ability to pay its debt service and other obligations. In other words, debt analysts look at what major payments are due and whether a company has the ability to meet these obligations without entering bankruptcy. The three main statistics used in this type of analysis are:
• EBITDAR - earnings before interest, taxes, non-cash charges (depreciation and amortization), and rent. EBITDAR shows cash flow available to pay interest, rent, and taxes after paying operational costs. EBITDAR is used to make apples-to-apples comparisons between companies because most companies finance their businesses differently and it represents earnings before financing costs.8
• Rent Adjusted Leverage - measures how much the company has borrowed or obligated through leases as a multiple of the cash flow available to pay such debt service and lease payments. The rule of thumb is that at a rent adjusted leverage multiple of 5x it is very difficult to raise new capital—at 6x it is nearly impossible.
• Fixed Charge Coverage - indicates the company’s ability to pay rent and interest based on the amount of cash flow remaining after capital expenditures. Analysts consider a 2x fixed charge coverage to be the minimum required to raise capital.
The following CSFB analysis in Figure 11 shows these three ratios for the publicly traded, for-profit chains. The analysis includes a sensitivity analysis of how these ratios would have been impacted if the sunset had affected the full year of 2002 instead of just the fourth quarter. This may help investors understand ratio trends for 2003, which will be the first full year post-sunset.
Figure 11: Publicly Traded Nursing Facility Chain Debt Ratios, Sensitivity Analysis
Actual 2002 RatiosEstimated Ratios as if Sunset was in
Effect for Full-Year 2002
Company
Adjusted EBITDAR(1)
Margin
Net Rent Adjusted
Leverage(2)
Fixed Charge
Coverage(3)
Adjusted EBITDAR(1)
Margin
Net Rent Adjusted
Leverage(2)
Fixed Charge
Coverage(3)
Beverly Enterprises 12.0 % 4.8 x 1.3 x 10.9 % 5.3 x 1.1 xGenesis Health Ventures 9.5 % 3.1 x 2.7 x 8.7 % 3.4 x 2.4 xExtendicare Health Services 11.8 % 4.7 x 1.8 x 10.8 % 5.3 x 1.6 xHCR Manor Care 14.1 % 2.0 x 5.1 x 12.8 % 2.2 x 4.4 xKindred Healthcare 12.7 % 4.9 x 1.2 x 11.9 % 5.3 x 1.1 x
Average 12.0 % 3.9 x 2.4 x 11.0 % 4.3 x 2.1 x
Source: Credit Suisse First Boston analysis based on company reports. (1) EBITDAR is Earnings Before Interest, Tax, Depreciation, Amortization, Rent, and unusual or extraordinary items. (2) Net Rent Adjusted Leverage = (Total Debt + 8 x Rent Expense) / EBITDAR (3) Fixed Charge Coverage = (EBITDAR - Capital Expenditures) / (Rent Expense + Net Interest)
Most debt analysts share the negative outlook of equity analysts on the nursing facility sector for the same reasons. Deutsche Bank’s Reukauf believes that the add-on provision sunset could push some other highly levered nursing facilities into bankruptcy, given that facilities are already tightly constrained in how much they can cut back on expenses. This
8 Note: The EBITDAR margin is not the same as a net income margin. A net income margin is earnings (profits) after all other obligations have been met, divided by net revenues.

Nursing Facilities − May 20, 2003 -16-
is particularly true for those facilities that depend heavily on Medicare revenue to subsidize Medicaid patients. Other analysts, although in the minority, believe that certain nursing facility bonds are trading below value. Ankur Gandhi of Goldman Sachs uses Extendicare as an example of her more positive outlook for debt holders. She writes:
From a bondholder's prospective, however, we continue to be bullish on the Extendicare subordinated notes, even though we look for marginal revenue growth and for EBITDA to decline 14.1% in 2003, owing to the Medicare reduction. We are bullish because (1) the company does not face an imminent liquidity crisis, as it has no major debt due until 2007; (2) the company does not operate in states with high patient liability costs; (3) at a current yield of 13.1%, the bonds offer an attractive relative buying opportunity versus the rest of high-yield healthcare, which trades at an average yield of 8.7%; and (4) a strong management team has been able to drive improvements in operating results by improving its quality mix.
Gandhi also notes that the price of Extendicare’s subordinated notes has not moved in tandem with the improvement in certain credit statistics. This reflects investors’ ongoing concerns about an uncertain external environment for all nursing facility operators. Figure 12 shows the major debt issues for the nursing facility sector and the relative rating by Moody’s and Standard and Poor’s. Deteriorating industry performance has resulted in rating agency downgrades.
Figure 12: Publicly-Held Nursing Facility Bonds ($ in millions)
Amount Amount Issue Moody's S&PIssuer Issued Outstanding Date Coupon Maturity Rating RatingBeverly Enterprises Inc. $ 30.0 $ 17.9 7/22/1993 8.625 % 10/1/2008 Ba2 B+
20.0 11.0 4/29/1993 8.750 % 7/1/2008 Ba2 B+180.0 180.0 2/15/1996 9.000 % 2/15/2006 B1 B+200.0 200.0 4/25/2001 9.625 % 4/25/2009 B1 B+
Extendicare Health Services, Inc. $ 200.0 $ 200.0 11/25/1997 9.350 % 12/15/2007 B3 CCC+150.0 150.0 6/20/2002 9.500 % 7/1/2010 B2 B-
Genesis Health Ventures $ 25.0 $ 19.3 10/8/1992 9.250 % 9/1/2007 NR NR
Kindred Healthcare Inc. $ 300.0 $ 160.5 4/20/2001 LIBOR+4.5 % 4/20/2008 NR NR
Manor Care Inc. $ 200.0 $ 200.0 3/8/2001 8.000 % 3/1/2008 Ba1 BBB150.0 150.0 6/4/1996 7.500 % 6/15/2006 Ba1 BBB200.0 200.0 4/15/2003 6.250 % 5/1/2013 Ba1 BBB100.0 (1) 100.0 4/15/2003 2.125 % 4/15/2023 Ba1 BBB
Mariner Health Care, Inc. $ 150.0 $ 150.0 5/13/2002 LIBOR+5.5% 5/13/2009 B3 B-
Source: Company management. Note: Issuance of these kinds of debt involve costs such as underwriting commissions, legal & trustee expenses, debt rating fees, discounted issue price, etc. When such costs are factored in, the effective cost of financing is higher than the nominal coupon rate. (1) Convertible bond that also has contingent interest component. Absent conversion and contingent interest components, estimated coupon is 7.34%.
Nursing Facilities − May 20, 2003 -17-
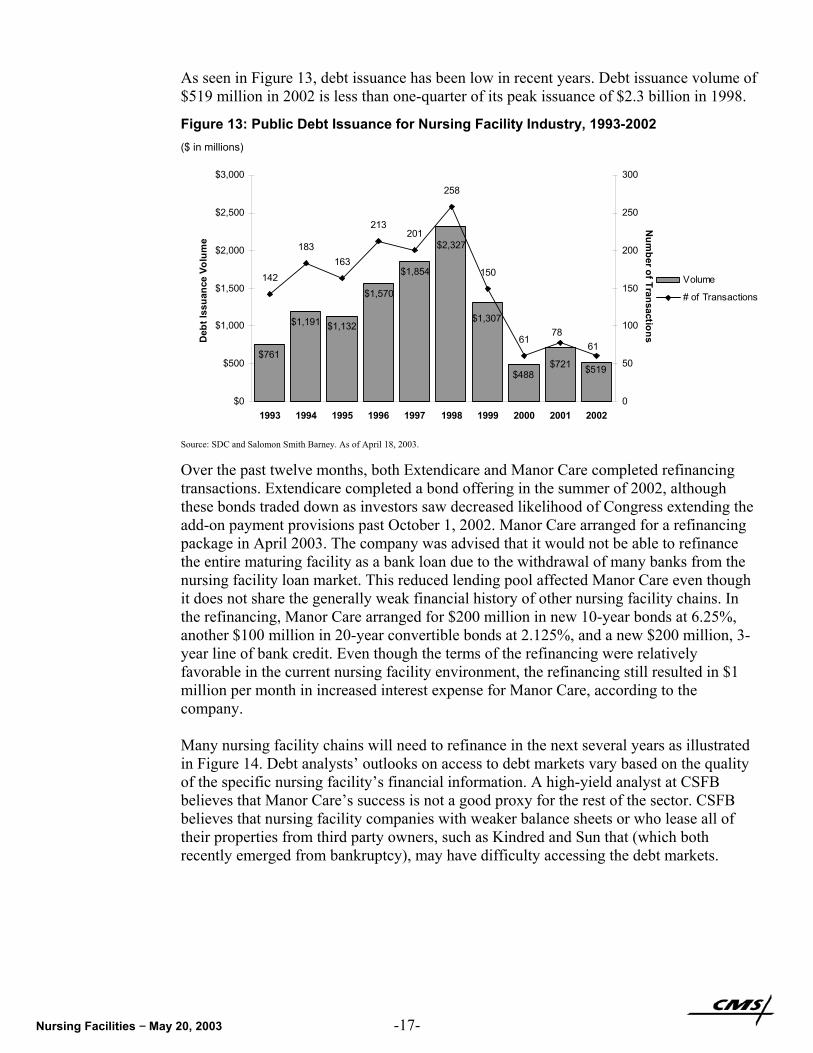
As seen in Figure 13, debt issuance has been low in recent years. Debt issuance volume of $519 million in 2002 is less than one-quarter of its peak issuance of $2.3 billion in 1998.
Figure 13: Public Debt Issuance for Nursing Facility Industry, 1993-2002 ($ in millions)
$761
$1,191 $1,132
$1,570
$1,854
$488 $519
$1,307
$2,327
$721
142
183163
213201
258
150
6178
61
$0
$500
$1,000
$1,500
$2,000
$2,500
$3,000
1993 1994 1995 1996 1997 1998 1999 2000 2001 2002
Deb
t Iss
uanc
e Vo
lum
e
0
50
100
150
200
250
300N
umber of Transactions
Volume
# of Transactions
Source: SDC and Salomon Smith Barney. As of April 18, 2003.
Over the past twelve months, both Extendicare and Manor Care completed refinancing transactions. Extendicare completed a bond offering in the summer of 2002, although these bonds traded down as investors saw decreased likelihood of Congress extending the add-on payment provisions past October 1, 2002. Manor Care arranged for a refinancing package in April 2003. The company was advised that it would not be able to refinance the entire maturing facility as a bank loan due to the withdrawal of many banks from the nursing facility loan market. This reduced lending pool affected Manor Care even though it does not share the generally weak financial history of other nursing facility chains. In the refinancing, Manor Care arranged for $200 million in new 10-year bonds at 6.25%, another $100 million in 20-year convertible bonds at 2.125%, and a new $200 million, 3-year line of bank credit. Even though the terms of the refinancing were relatively favorable in the current nursing facility environment, the refinancing still resulted in $1 million per month in increased interest expense for Manor Care, according to the company. Many nursing facility chains will need to refinance in the next several years as illustrated in Figure 14. Debt analysts’ outlooks on access to debt markets vary based on the quality of the specific nursing facility’s financial information. A high-yield analyst at CSFB believes that Manor Care’s success is not a good proxy for the rest of the sector. CSFB believes that nursing facility companies with weaker balance sheets or who lease all of their properties from third party owners, such as Kindred and Sun that (which both recently emerged from bankruptcy), may have difficulty accessing the debt markets.

Nursing Facilities − May 20, 2003 -18-
Many nursing facility chains will need to refinance in the next several years.
Figure 14: Nursing Facility Refinancing Outlook ($ in millions)
Type of Debt Size of Potential (Actual ) RefinancingIssuer to be Retired Debt Maturity Source of Refinancing Date SizeBeverly Synthetic Lease $ 50.0 4/26/2004 Asset sales, cash and public - - -
Revolving Credit Line 100.0 4/26/2004 bonds as availableMed Term Notes (BFC) 70.0 6/15/2004Publicly-Held Bonds 180.0 2/15/2006
Extendicare Bank credit facility $ 124.5 12/31/2003 Publicly-Held Bonds 6/20/2002 $ 150.0 -
Genesis Secured Notes $ 242.0 4/2/2007 Subordinated Debt - $ 150.0 2.000 %Cash 110.0
Secured Credit Facility 332.0 10/2/2006 Secured Credit Facility - 200.0 1.000 %Mortgages 50.0 - - - - -
Kindred Publicly-Held Bonds $ 160.5 4/20/2008 Publicly-Held Bonds - - - Revolving Credit Line 120.0 4/20/2006 Commercial Bank - - - FloridaLeaseDivestiture 72.0 ASAP Sublease or Purchase&Sale - - -
Manor Care 5 Year Revolving $ 500.0 9/24/2003 3 Yr. Revolving Credit Line 4/21/2003 $ 200.0 0.925 % Credit Line 10-Yr. Notes 4/15/2003 200.0 4.740 %
Convertible Notes 4/15/2003 100.0 0.575 %
Mariner Term Loan $ 210.0 3/31/2005 Public bonds as available, - - - Revolving Credit 22.0 3/31/2005 bankloans - - -
Sun Revolving Credit Line $ 150.0 2/28/2005 Revolving Line of Credit - $ 125.0 - Term Loan and 40.0 2/28/2005 Private Placement, Asset - 34.0 - Discount Note Sales, and/or CashUnpaid rent 10.5 N/A Settlement/FacilityDisposal - - - Bank Mortgage 20.0 5/1/2004 Private Placement - 17.0 -
Rate Increase (Decrease)
Interest
Source: Company management. Note: Potential Source of Refinancing is speculative and based on management’s expectations. Future refinancing will depend upon market conditions and company performance.
In addition to the public bond market, SNFs may also seek debt financing from commercial banks and other lenders. This type of financing, although usually more expensive, can be used when access to the public debt and equity markets is not viable. This type of financing is also often short-term in nature and can be attractive for companies looking to grow that are planning to recapitalize later. Figure 15 shows an industry survey of major national lenders and loan volume representing targeted, project-specific financing (not general corporate financing) for the assisted living, continuing care retirement communities (CCRCs), and nursing facility industries combined. Total loan volume peaked in the third quarter of 2002, also the most recently surveyed quarter, while nursing facility loan volume peaked in the fourth quarter of 2001.
The nursing facility long-term debt market is encouraged by government-chartered organizations such as Fannie Mae and Freddie Mac. The Department of Housing and Urban Development and the Federal Housing Administration (HUD/FHA) also supports debt by insuring loans originated by private lenders for new construction, substantial rehabilitation, refinancing, and acquisition for nursing facilities, intermediate care facilities, board care homes, and assisted living facilities. This guaranteed loan program traditionally serves as a credit enhancer in times of tightening mortgage capital availability. The agency insured $1.2 billion in nursing facility loans (which includes a very small loan amount to intermediate care facilities) in FY 2002 compared to $828 million in FY 2001. Most of the increase was to support refinancing activity in the current low-interest environment. Although access to these capital sources exists, competition for funding from these agencies is strong. Nursing facilities must meet certain underwriting requirements and are subject to ongoing certification and regulation.

Nursing Facilities − May 20, 2003 -19-
Figure 15: Total Loan Volume to Long-Term Care Industry by a Sample of Major National Lenders
($ in millions)
$22 $23 $49$94
$19$50
$19$14
$118 $59 $43$167
$184
$158
$220
$155$233
$314 $162
$259
$1$22
$0
$3$0
$50
$100
$150
$200
$250
$300
$350
$400
$450
$500
4Q00 1Q01 2Q01 3Q01 4Q01 1Q02 2Q02 3Q02
Amou
nt o
f Fin
anci
ng P
lace
d in
Qua
rter
Assisted LivingCCRCsNursing Homes
$327
$263$244
$299
$220
$335
$256
$445
Source: National Investment Center for the Seniors Housing & Care Industries.
Many nursing facility operators lease facilities from REITs. REITs do not assume the same liability risks as those of the tenant operators.
REITs Real estate investment trusts (REITs) are generally considered higher cost alternatives to more traditional debt financing. Instead of owning their facilities outright, many nursing facility operators lease facilities from REITs. These leases are a form of levered financing. Merrill Lynch’s Rice explains how REITs can be the best option for both nursing facilities and other long-term care sectors such as assisted living:
REIT financing in sale/leaseback deals generally represents 100% of the financing for a given asset, whereas a more traditional asset purchase by an operator is generally financed with a 60%/40% mix of debt and equity…. There are sectors of the healthcare services industry, such as assisted living and skilled nursing, which are utilizing substantial amounts of REIT financing. Generally speaking, the equity market does not currently represent an attractive funding option for these sectors, and the financial troubles of these sectors over the last few years have caused many traditional lenders to exit the market. Against this backdrop, the 100% financing provided by a REIT is, in many cases, the best option for many assisted living and skilled nursing operators.
Because nursing facility operators are struggling, one might ask why REITs invest in nursing home facilities. As property owners and landlords, REITs do not assume the same patient care liability risks as those of the tenant operators. Many operators who lease these facilities may be small and carry minimal insurance, or none at all. If faced with a large settlement, these operators may simply close their businesses. Although a bankrupted operator obviously can no longer pay rent, the REIT can still fall back on the hard assets of the facility and can choose to seek another operator to run the facility. There are a number of healthcare REITs, most of which have some investments in nursing facilities.

Nursing Facilities − May 20, 2003 -20-
Figure 16: Examples of Health Care REITs and SNF Rental Income ($ in millions)
REIT
Nursing Facilities
Owned
2002 Nursing Facility Rental
IncomePercent of Total
Rental IncomeTotal Rental
IncomeHealth Care Property Investors 184 $85.8 24.7% $347.8Health Care REIT 76 $64.4 35.9% $179.5Healthcare Realty Trust 31 $174.0 11.7% $1,484.9National Health Investors N/A $10.6 68.9% $15.4Nationwide Health 158 $55.9 40.2% $139.1Senior Housing Properties Trust 60 $12.9 10.6% $122.4Ventas 220 $872.2 71.4% $1,221.4
Source: Company filings.
One REIT analyst notes that financing for the health care REITs became more difficult
after the add-on provision sunset. Nursing facility operators that function in a "hand-to-mouth" business environment may have less flexibility to meet lease obligations as Medicare payments are reduced and Medicaid payments are threatened. However, health care REIT financing is still available, albeit at a higher cost relative to both pre-PPS days as well as other REIT sectors. Despite the analyst's cautious outlook, he does not believe the sector is returning to the worst days of 1998 and 1999: "The current nursing home environment does not resemble 1998 when everybody tipped over at once, but it is more likely that we will see some fall-out throughout 2003 as a result of the add-on sunset."
Solvency Ultimately, access to capital is related to whether a nursing facility can generate positive operating cash flow and stay solvent to avoid bankruptcy. Ankur Gandhi, high-yield debt analyst at Goldman Sachs, notes, “We have seen a number of small operators file for bankruptcy since October 1, 2002. The largest so far has been the December 27, 2002 filing announced by Centennial Health, which operates 100 skilled nursing facilities.” These continuing bankruptcies raise concerns among investors that the industry is returning to the 1999-2000 period when five of the top eight nursing facility operators filed for bankruptcy. While in bankruptcy proceedings, these nursing facilities were able to continue to operate and provide care.
One chain is withholding rent and mortgage payments to stave off bankruptcy re-filing.
Integrated Health Services continues to undergo Chapter 11 bankruptcy restructuring. Kindred and Genesis both emerged from bankruptcy in 2001. Mariner Post-Acute Network and Sun Healthcare emerged from bankruptcy in 2002. However, a CSFB high-yield bond analyst believes Mariner and Sun are “not yet fully out of the woods,” with higher exposure to the California market (where Medicaid rate cuts loom) and fragile capital structures that rely on renegotiating leases to be successful. For example, Sun is withholding rent and mortgage payments for over half of its facilities to stave off re-filing for bankruptcy. Sun hopes to transition these facilities to new operators. If the landlords of these properties aggressively pursue and obtain leasehold or other property damages over the next year, Sun may be forced to re-file for bankruptcy protection, according to the company’s filings with the SEC. For other large nursing facility chains, CSFB believes that despite thin margins, well-managed nursing facilities should be able to survive under current conditions. CSFB notes, “The key obstacles to these companies accessing the capital markets is the uncertainty over patient care liability, Medicaid eligibility and reimbursement levels and the possibility, however remote, that Medicare rates could be cut.”

Nursing Facilities − May 20, 2003 -21-
Figure 17: Bankruptcy Filings among Top 15 Nursing Facility Chains since 1999
Quarter ending
Rank Nursing Facility Chain Mar
-99
Jun-
99
Sep-
99
Dec
-99
Mar
-00
Jun-
00
Sep-
00
Dec
-00
Mar
-01
Jun-
01
Sep-
01
Dec
-01
Mar
-02
Jun-
02
Sep-
02
Dec
-02
Mar
-03
May
-03
1 Beverly
2 Manor Care
3 Kindred Bankruptcy filed 9/13/99 Emerged 4/20/01
4 Mariner Bankruptcy filed 1/18/00 Emerged 5/13/02
5 Integrated Health Services Bankruptcy filed 2/2/00
6 Genesis Bankruptcy filed 6/22/00 Emerged 10/2/01
7 Life Care
8 Sun Bankruptcy filed 10/14/99 Emerged 2/28/02
9 Extendicare
10 Good Samaritan
11 Care Initiatives
12 Centennial Bankruptcy filed 12/20/2002
13 National Healthcare
14 Senior Living
15 Tandem Health Care
Source: Public filings, company information, and analyst models. Note: Chains ranked by bed count, as of April 3, 2003.
Three nursing facility chains filed for bankruptcy during the past six months.
Although most of these bankrupted chains have emerged, there have been several notable, albeit smaller, nursing facility bankruptcy filings in recent months. Centennial Healthcare (which operates 77 SNFs with 8,600 beds in 19 states and the District of Columbia) filed for bankruptcy in December 2002. Regional chains Lexington Healthcare Group (which operates 8 facilities in Connecticut) and Ballantrae Healthcare (which operates 35 facilities in six states and is based in New Mexico) filed for bankruptcy in the spring of 2003.
The smaller for-profit and not-for-profit facilities are estimated to comprise 70% of the industry.
Not-for-Profit Access to Capital The outlook for the smaller and not-for-profit facilities may be bleaker compared to the larger, for-profit facilities. The smaller or not-for-profit facilities must rely on the debt markets to raise capital or in some cases attract philanthropic donations. Gandhi notes that the add-on had a greater impact on the smaller for-profit and not-for-profit facilities, which comprise 70% of the nursing facility industry. While not-for-profit organizations can file for bankruptcy similar to their for-profit peers, many smaller not-for-profits tend to choose to close down operations altogether when unable to overcome a liquidity crisis according to industry sources. Nursing facilities issue a small portion of the total debt issued by not-for-profit health care providers. According to a Fitch credit rating agency analysis:
Nonprofit nursing home bond issuance volume fell dramatically to $508.7 million in 2002 from $2.3 billion in 1998, a 78% decline. Nonprofit nursing facility bond volume composed only 1.9% of total health care bond issuance in 2002, with nearly all nursing facility issuance being speculative grade. This is a decrease from 7.1% of total health care bond issuance in 1997. Fitch expects the nonprofit nursing facility sector’s volume in 2003 to approximate 2002 levels.
Nursing Facilities − May 20, 2003 -22-
SNF bonds rarely achieve investment grade ratings.
Bonds that finance nursing facility operations are typically unrated because they are generally neither investment grade nor secure enough to warrant the fees associated with obtaining a credit rating. The riskiness of these bonds means that the high interest rates are often prohibitively expensive to nursing facility issuers. Skilled nursing facilities rarely have the credit strength on their own to achieve investment grade ratings, and have difficulty in securing credit enhancement in the form of private bond insurance or letters of credit from government mortgage insurance programs like HUD/FHA or Ginnie Mae. Jeanette Price, a public finance investment banker with Salomon Smith Barney, explains that access to the unrated market is helped by a strong balance sheet, adequate debt service coverage, a credible sponsor, high occupancy, decent Medicaid reimbursement, and strong Certificate-of-Need protection. If the bond issue is small, Price believes that it can find sufficient investors without needing to meet the higher credit standards of a large investor pool. Emily Wong, an analyst at Fitch Ratings notes that her 2003 outlook for nonprofit nursing facilities is “much more negative than [her] outlook for hospitals or continuing care retirement communities,” due to nursing facilities’ high reliance on Medicaid, limited revenue streams, and rising costs. Wong believes, “Nonprofit nursing home credit profiles will continue to weaken in the near to long term due to industry pressures. Demand from aging baby boomers may save nursing facilities, but this demand is more than 20 years away.”
Access to capital is better for SNFs that expand into assisted living and CCRC lines of business.
Rod Rolett of Herbert J. Sims Company, an underwriter that focuses on tax-exempt financing of not-for-profit long-term care companies, believes that access to capital is better for SNFs that are expanding into other types of long-term options, including assisted living and continuing care retirement communities (CCRCs). Rolett observes that seniors paying for their own care are opting for less institutional CCRC and assisted living facilities over SNFs. Charles Lynch of CIBC notes that many of the for-profit, publicly traded chains have begun to diversify in this way:
Reimbursement environment is restrictive to organic growth for nursing homes, with Medicare rates reduced in 2002 and Medicaid rates moderating. As a result, most companies are in the midst of embarking on strategic initiatives to diversify into adjunct business, such as home care, hospice, therapy, and pharmacy services.
Not-for-profit facilities, many of which may have a religious or civic mission to provide care for seniors, typically are reluctant to respond to decreased demand by self-financed seniors by cutting beds, according to Rolett. Many aim to operate at high occupancy rates without regard to the Medicaid and charity care census. Many of the nonprofit nursing facilities are dependent on investment income from endowments, funded by philanthropic donations. Because the nursing facility business does not have high margins and does not generate much cash flow, developing adequate endowments is one of the greatest credit challenges for long-term care facilities, according to Price. Fitch notes, “[T]he financial ratios of these [nursing homes that depend on endowment income] have suffered due to reduced investment returns in the past three years…. [P]rudent cash management is important, as the reliance on volatile investment earnings is unpredictable.” Following the terrorist attacks of September 11th, philanthropic donations have also fallen off, further challenging not-for-profit SNFs.

Nursing Facilities − May 20, 2003 -23-
REVENUE SOURCES
In 2001, national freestanding nursing home care expenditures totaled $98.9 billion, or 6.9% of total national health expenditures. Medicaid paid for the greatest component of nursing home expenditures at 48%, compared to private sector at 38% and Medicare at 12%.
Medicaid is the largest payor for nursing home care.
Figure 18: Freestanding Nursing Home Care Expenditures ($ in millions)
2001
% of Nursing Home Care
ExpendituresTotal National Health Expenditures $1,424,541 NA
Nursing Home Care Expenditures $98,911 100 %
Private $38,058 38 %
Out of Pocket 26,866 27 %Private Insurance 7,523 8 %Other 3,670 4 %
Public $60,853 62 %Medicare $11,588 12 %
Medicaid $46,994 48 %Federal 28,119 28 %State and Local 18,875 19 %
Other $2,271 2 %Federal 2,100 2 %State and Local 171 0 %
Source: CMS, Office of the Actuary, National Health Statistics Group. Note: Under “Public” spending, “Medicaid” includes SCHIP expansion and “Other” includes SCHIP.
The census mix of Medicare, Medicaid, and private pay patients affects nursing home profitability both due to differentials in payment rates as well as length of stays.
Residents who spend down their assets can become Medicaid eligible. Very few Americans buy private long-term care health insurance.
Private Sources
Private Pay Among the large for-profit nursing facility companies, private pay and other sources typically comprise 20% of the resident census and typically generate 30% of revenue for nursing facilities. Nursing home residents who pay themselves may eventually spend down their assets to become Medicaid eligible. Some nursing facilities (such as some of those in the Manor Care chain) have historically catered to more affluent customers and still benefit from higher private-pay margins. They do, however, face increasing competition from assisted-living alternatives and expect slowing revenue growth from their private pay business. Long-Term Care Insurance A revenue source in its infancy, long-term care insurance generates a very small portion of nursing facility revenue. Very few aging Americans buy private long-term care health insurance and when they do it is often initiated at an advanced age—defeating the purpose of the insurance design. Inevitably, unless this trend is reversed, likely through changes in tax policy, the growing financing burden will remain on the taxpayer base and present rapidly increasing fiscal pressures on the public programs—Medicare and Medicaid.

Nursing Facilities − May 20, 2003 -24-
Medicare does not cover SNF care on a long-term basis.
Public Sources
Medicare Among the large for-profit nursing facility companies, Medicare typically comprises 10-15% of the resident census and approximately 25% of revenue. This revenue has dropped from prior years as a result of the Balanced Budged Act of 1997 and the implementation of SNF PPS in 1998. As noted earlier, Medicare payments exceed those of Medicaid. While many of the large for-profit nursing facilities were building up their ancillary services businesses prior to the implementation of the SNF PPS, Medicare revenues allowed the industry to expand despite losses on other lines of business. Now, under the constraints of PPS, providers are forced to operate more efficiently. Medicare covers SNF services for beneficiaries who have recently been discharged from a stay in an acute care hospital lasting at least 3 days and who need daily skilled care. SNF coverage is limited to 100 days per spell of illness. Medicare does not cover SNF care on a long-term basis. If beneficiaries continue to require care in a skilled nursing facility once Medicare coverage expires, they can pay out-of-pocket as long as they have assets or sufficient income (private pay). Once their assets are “spent-down,” they become Medicaid eligible. The per diem rate to the provider typically decreases as patients move along each step from Medicare to private pay to Medicaid.
Medicare payments cross-subsidize lower Medicaid payments in nursing facilities.
Medicaid Among the large for-profit nursing facility companies, Medicaid typically comprises 65-70% of the resident census and typically generates 45% of revenue for nursing facilities. A nursing home industry trade association estimates that the average Medicaid rate for nursing home care was $113.50 per day in 2001. Higher Medicare payments cross-subsidize lower Medicaid payments in nursing facilities. With Medicaid comprising a much greater percentage of nursing home residents and revenues than Medicare, CSFB believes that uncertainty over Medicaid reimbursement poses a greater threat than Medicare. As most states must balance their budgets annually, spending for state programs must be cut as revenues fall. Several states have announced Medicaid payment cuts, others have maintained existing levels, and a smaller number have announced modest increases. According to a January 2003 Kaiser Commission on Medicaid and the Uninsured study, 37 states plan to reduce or freeze the amount of funding for nursing care in fiscal 2004. For the state fiscal year beginning July 1, 2003, the major for-profit nursing facilities chains have projected Medicaid payment increases of 2% to 3%. However, many analysts are more pessimistic, as major hospital chains have projected neutral to negative changes in Medicaid payment to providers.

Nursing Facilities − May 20, 2003 -25-
Recent CMS Issues Related to Medicare SNFs Proposed 2.9% Increase to Medicare SNF Payments in Fiscal 2004
On May 8, 2003, CMS announced a proposed 2.9% increase in Medicare payment rates to SNFs for fiscal year 2004. The increase will result in nearly $400 million more in Medicare SNF payments. The proposed rule, published in the Federal Register on May 16, also reflects the decision by CMS to retain the current RUG classification system that establishes daily payment rates to skilled nursing facilities based on the needs of Medicare beneficiaries. CMS is continuing to research case mix refinement methods that could appropriately pay nursing facilities for complicated care. The 60-day public comment period ends July 7. CMS will publish the final rule by August 1 for implementation on October 1, 2003, the first day of fiscal year 2004. Rehabilitation Therapy Caps
The Balanced Budget Act of 1997 created SNF therapy caps for Part B outpatient rehabilitation services. The caps apply to certain providers of outpatient rehabilitation, including SNFs. The payment caps are an annual $1,590 per beneficiary limit on certain Part B outpatient rehabilitation services. The cap applies twice: one $1,590 cap applies to occupational therapy, and a separate $1,590 cap applies to physical therapy and speech therapy combined. The therapy caps were enacted in 1999, but Congress declared a moratorium on these therapy caps in both 2000 and 2001. CMS currently plans to implement these therapy caps in July 2003.
The therapy caps are intended to be per beneficiary. However when initially implemented in 1999, CMS did not have the systems capability to apply this cap if a beneficiary moved to a different provider in another venue. When therapy caps are re-implemented later this year, CMS systems are expected to be able to implement the caps as required by law.
Jason Kroll of Bear Stearns has not included the impact of therapy cap implementation in his financial estimates yet. However, “While this eventuality is not reflected in our projections, there is substantial likelihood, in our view, that the therapy caps could be implemented in July, in which case there would be downside to our estimates.…” Bad Debt Reimbursement
SNFs that provide care to Medicare beneficiaries sometimes incur bad debt because of beneficiaries’ failure to pay deductibles. In February 2003, CMS issued a proposed rule to reduce SNF bad debt reimbursements from 100% to 70% over three-year period beginning October 1, 2003. By doing so, CMS would bring the bad debt reimbursement level in line with hospital rates, and hopes to further encourage collection of bad debt by SNFs and other affected providers. In total, this regulatory change will reduce bad debt payments by about $20 million in FY 2004 and $100M when fully implemented in 2006. Comments on the proposed rule were accepted through mid-April and will be considered in the final rule. Schwab/Washington Research Group believes the effect will be minimal on the major nursing facility chains. Schwab writes, “On average, the change will result in an approximately $1 a day reduction in reimbursements, though the effect may be greater for some companies.” Schwab notes that the industry estimates the effect could rise to as much as $6 a day in 2006. Nursing Home Quality Initiative
In November 2002 CMS released quality measures for all Medicare and Medicaid certified nursing homes. Measures are given for nearly 17,000 nursing homes in all 50 states, the District of Columbia, and some U.S. Territories. This quality initiative is a four-prong effort that consists of: 1) regulation and enforcement efforts conducted by state survey agencies and CMS; 2) improved consumer information on the quality of care in nursing homes; 3) continual, community-based quality improvement programs designed for nursing homes to improve their quality of care; and 4) collaboration and partnership to leverage knowledge and resources. Information on nursing home quality can be found on the Nursing Home Compare site at www.medicare.gov/NHCompare/Home.asp.

Nursing Facilities − May 20, 2003 -26-
SUMMARY • Profit margins for the large, publicly traded nursing facility chains continue to decline,
although no dramatic drop-off has been observed after certain add-on provisions sunset on October 1, 2002.
• The effect of government spending reductions may not yet be fully realized as results
for only six months have been reported since the Medicare add-on provisions expired and many new state budget cuts have not yet been implemented.
• Two additional nursing facility chains emerged from bankruptcy in 2002. However,
some analysts worry how these chains will be able to weather the uncertain government payment environment. The facilities at greatest risk are those that heavily subsidize Medicaid revenue with Medicare payments.
• While Wall Street continues to watch Congress for signs of legislation that would
restore Medicare add-on payments, investors are increasingly concerned by the risk of Medicaid payment cuts and rising liability costs.
• Rising insurance costs and aggressive litigation have led to the exit of many chains
from states where liability costs are high. • Most analysts believe that access to capital remains very limited for the sector in an
uncertain payment environment. Access to capital for not-for-profit nursing facilities is particularly difficult.
• Investment analysts worry that some nursing facilities, recently emerged from
bankruptcy, may need to re-enter bankruptcy protection. Three nursing facility chains have filed for bankruptcy since December 2002.
NOTICE AND DISCLAIMER: The CMS Health Care Industry Market Update is published at the direction of and solely for the benefit of the Centers for Medicare & Medicaid Services (“CMS”) and the United States Department of Health & Human Services (“HHS”) and interested health care policy makers in the Congress, the Federal agencies, and State governments. The CMS Health Care Industry Market Update is not intended to be, nor should it be relied upon in any way, as investment advice to any individual person, corporation, or other entity. CMS and HHS make no recommendations or advice with respect to any particular stocks, bonds, or securities or any particular industry sectors and make no recommendation whatsoever as to the purchase, sale, or exchange of securities and investments. While CMS and the Office of Research, Development & Information attempt to present appropriate factual data from a variety of sources, CMS makes no representation or assurances as to the accuracy or truthfulness of information or data published or provided by third parties used or relied upon in this report. CMS has no duty or obligation and does not undertake to independently verify the accuracy or truthfulness of information or data published or provided by third parties, nor does it have a duty to update any such data provided. Some sourced information is subject to copyright and is used by permission from the cited entities. Further use of such sourced information may be subject to approval by cited entities. Although cited entities obtained information from sources believed to be reliable, cited entities do not guarantee accuracy, and such information may be incomplete or condensed. All sourced figures and quotes included in this report constitute cited entities’ judgment as of the original publication date of such information. Individuals quoted in this report may work for firms that have pursued business relationships with the companies discussed, or may plan to in the future. Although the CMS Health Care Industry Market Update generally discusses health care policy and regulatory and enforcement matters, including regulatory policy and enforcement authority under the jurisdiction of CMS and HHS, the CMS Health Care Industry Market Update does not constitute in any way formal rulemaking or guidance or enforcement policy and procedures by CMS or HHS to any interested party. Information contained in the CMS Health Care Industry Market Update may be reproduced freely, provided that appropriate citation to authority is made.
If you would like to receive the CMS Health Care Industry Market Update via email, please send a request to: [email protected], Subject: Market Update Distribution
The CMS Health Care Industry Market Update is also available on the web at: www.cms.hhs.gov/marketupdate