h12020 performance review · private car, two wheeler and commercial vehicle contributed 55.0%,...
TRANSCRIPT
H12020
Performance Review

Agenda
• Company Strategy
• Financial Performance
• Industry Overview

Agenda
• Company Strategy
• Financial Performance
• Industry Overview
4
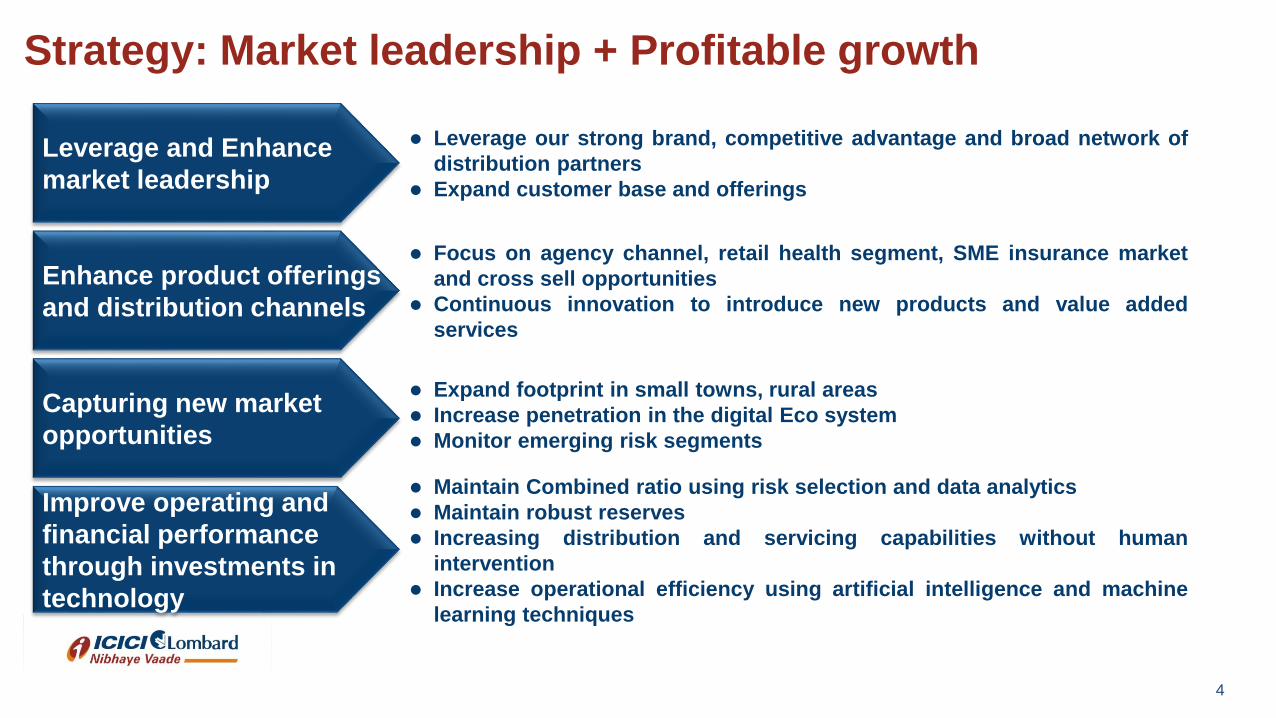
Strategy: Market leadership + Profitable growth
Expand footprint in small towns, rural areas
Increase penetration in the digital Eco system
Monitor emerging risk segments
Maintain Combined ratio using risk selection and data analytics
Maintain robust reserves
Increasing distribution and servicing capabilities without human
intervention
Increase operational efficiency using artificial intelligence and machine
learning techniques
Capturing new market
opportunities
Enhance product offerings
and distribution channels
Improve operating and
financial performance
through investments in
technology
Leverage our strong brand, competitive advantage and broad network of
distribution partners
Expand customer base and offerings
Leverage and Enhance
market leadership
Focus on agency channel, retail health segment, SME insurance market
and cross sell opportunities
Continuous innovation to introduce new products and value added
services
5
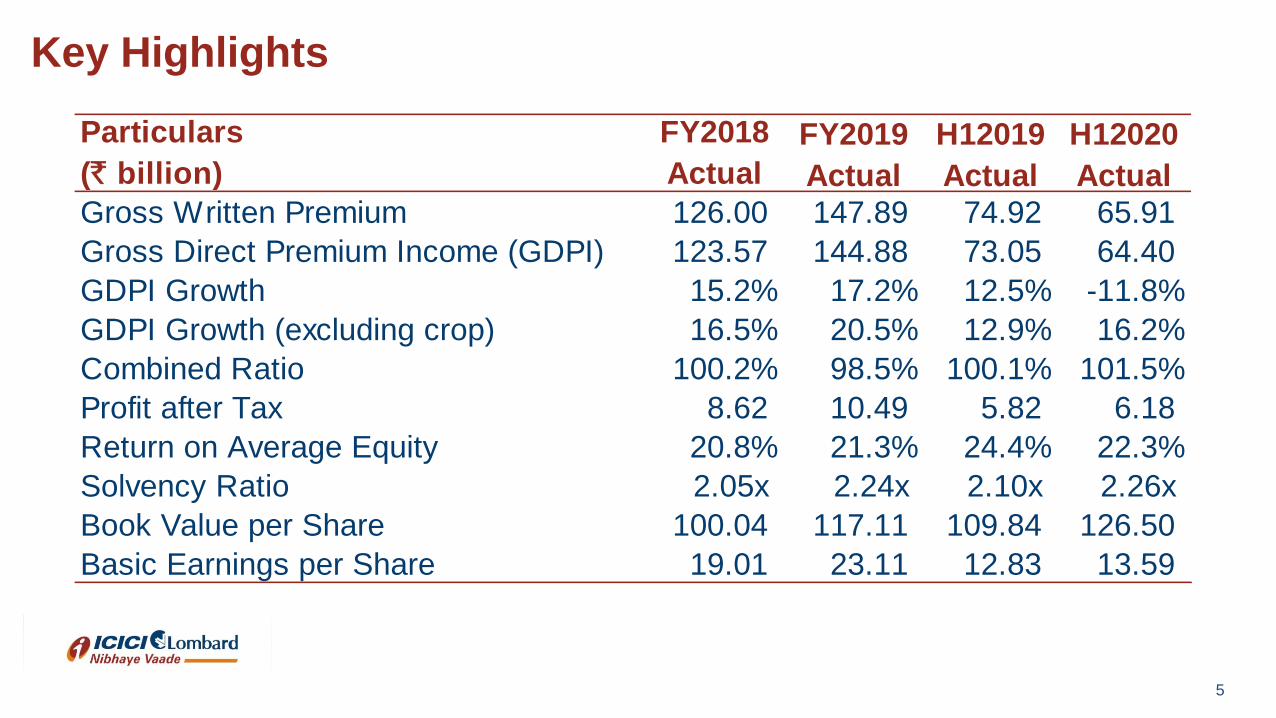
Key Highlights
Particulars
(` billion)
FY2018
Actual
FY2019
Actual
H12019
Actual
H12020
Actual
Gross Written Premium 126.00 147.89 74.92 65.91
Gross Direct Premium Income (GDPI) 123.57 144.88 73.05 64.40
GDPI Growth 15.2% 17.2% 12.5% -11.8%
GDPI Growth (excluding crop) 16.5% 20.5% 12.9% 16.2%
Combined Ratio 100.2% 98.5% 100.1% 101.5%
Profit after Tax 8.62 10.49 5.82 6.18
Return on Average Equity 20.8% 21.3% 24.4% 22.3%
Solvency Ratio 2.05x 2.24x 2.10x 2.26x
Book Value per Share 100.04 117.11 109.84 126.50
Basic Earnings per Share 19.01 23.11 12.83 13.59
6
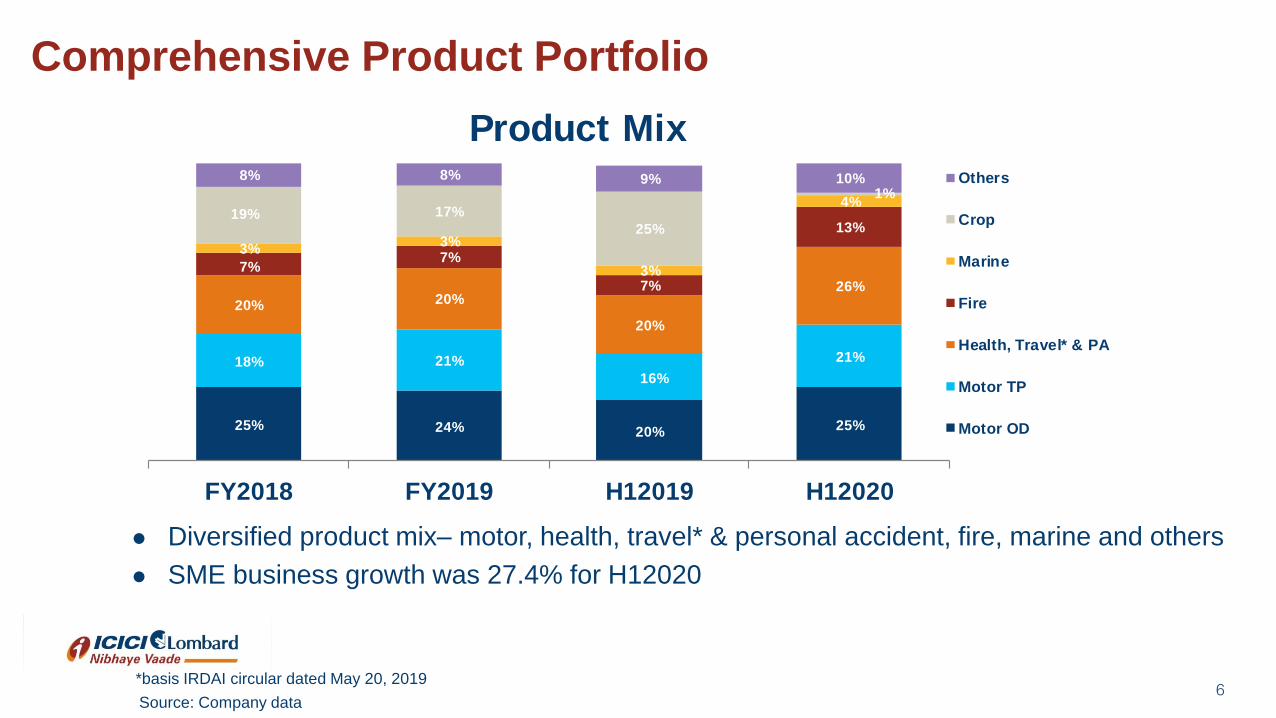
Comprehensive Product Portfolio
Diversified product mix– motor, health, travel* & personal accident, fire, marine and others
SME business growth was 27.4% for H12020
Source: Company data
*basis IRDAI circular dated May 20, 2019
25% 24% 20% 25%
18% 21%
16%
21%
20% 20%
20%
26%
7%7%
7%
13%
3%3%
3%
4%19% 17%
25%
1%
8% 8% 9% 10%
FY2018 FY2019 H12019 H12020
Product MixOthers
Crop
Marine
Fire
Health, Travel* & PA
Motor TP
Motor OD
7
Comprehensive Product Portfolio
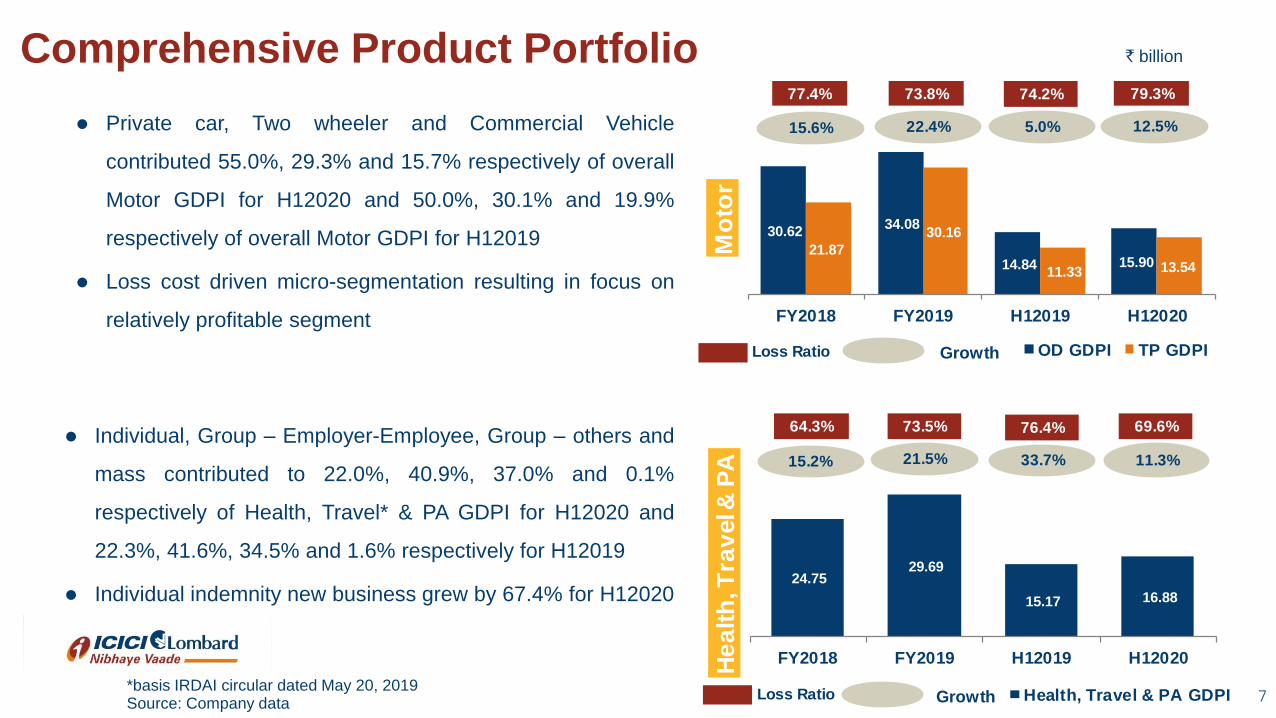
Private car, Two wheeler and Commercial Vehicle
contributed 55.0%, 29.3% and 15.7% respectively of overall
Motor GDPI for H12020 and 50.0%, 30.1% and 19.9%
respectively of overall Motor GDPI for H12019
Loss cost driven micro-segmentation resulting in focus on
relatively profitable segment
Individual, Group – Employer-Employee, Group – others and
mass contributed to 22.0%, 40.9%, 37.0% and 0.1%
respectively of Health, Travel* & PA GDPI for H12020 and
22.3%, 41.6%, 34.5% and 1.6% respectively for H12019
Individual indemnity new business grew by 67.4% for H12020
Source: Company data*basis IRDAI circular dated May 20, 2019
` billion
30.62 34.08
14.84 15.90 21.87
30.16
11.33 13.54
FY2018 FY2019 H12019 H12020
Mo
tor
Growth OD GDPI TP GDPILoss Ratio
15.6% 22.4%
77.4% 73.8% 79.3%
12.5%5.0%
74.2%
24.75 29.69
15.17 16.88
FY2018 FY2019 H12019 H12020He
alt
h, T
rav
el &
PA
Growth Health, Travel & PA GDPI
11.3%
Loss Ratio
15.2% 21.5%
69.6%64.3% 73.5%
33.7%
76.4%
8
Comprehensive Product Portfolio ` billion
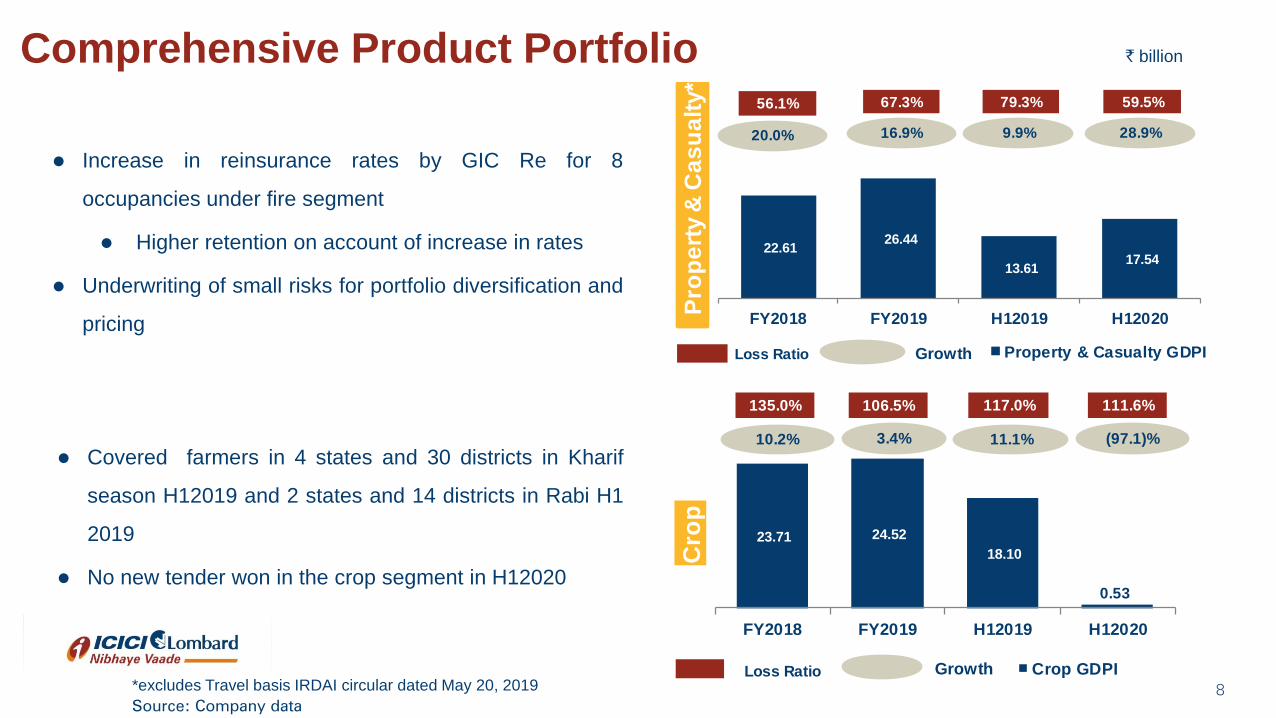
Covered farmers in 4 states and 30 districts in Kharif
season H12019 and 2 states and 14 districts in Rabi H1
2019
No new tender won in the crop segment in H12020
Increase in reinsurance rates by GIC Re for 8
occupancies under fire segment
Higher retention on account of increase in rates
Underwriting of small risks for portfolio diversification and
pricing
Source: Company data
*excludes Travel basis IRDAI circular dated May 20, 2019
23.71 24.52
18.10
0.53
FY2018 FY2019 H12019 H12020
Cro
pGrowth Crop GDPI
11.1%
Loss Ratio
10.2% 3.4%
117.0%135.0% 106.5%
(97.1)%
111.6%
22.61 26.44
13.61 17.54
FY2018 FY2019 H12019 H12020
Growth Property & Casualty GDPI
28.9%
Loss Ratio
20.0% 16.9%
59.5%56.1% 67.3%
9.9%
79.3%
Pro
pe
rty
& C
as
ua
lty*
9
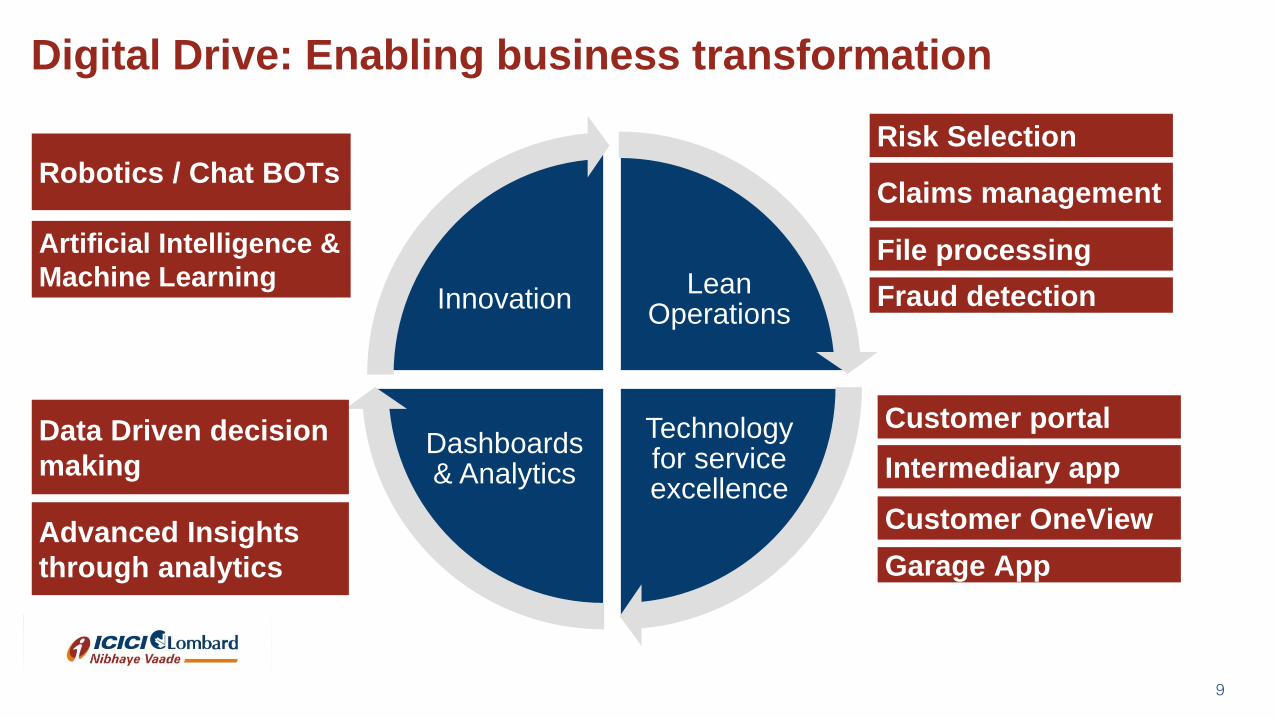
Digital Drive: Enabling business transformation
Lean Operations
Technology for service excellence
Dashboards & Analytics
Innovation
Data Driven decision
making
Advanced Insights
through analytics
Artificial Intelligence &
Machine Learning
Robotics / Chat BOTs
Fraud detection
File processing
Claims management
Risk Selection
Garage App
Customer OneView
Intermediary app
Customer portal
10
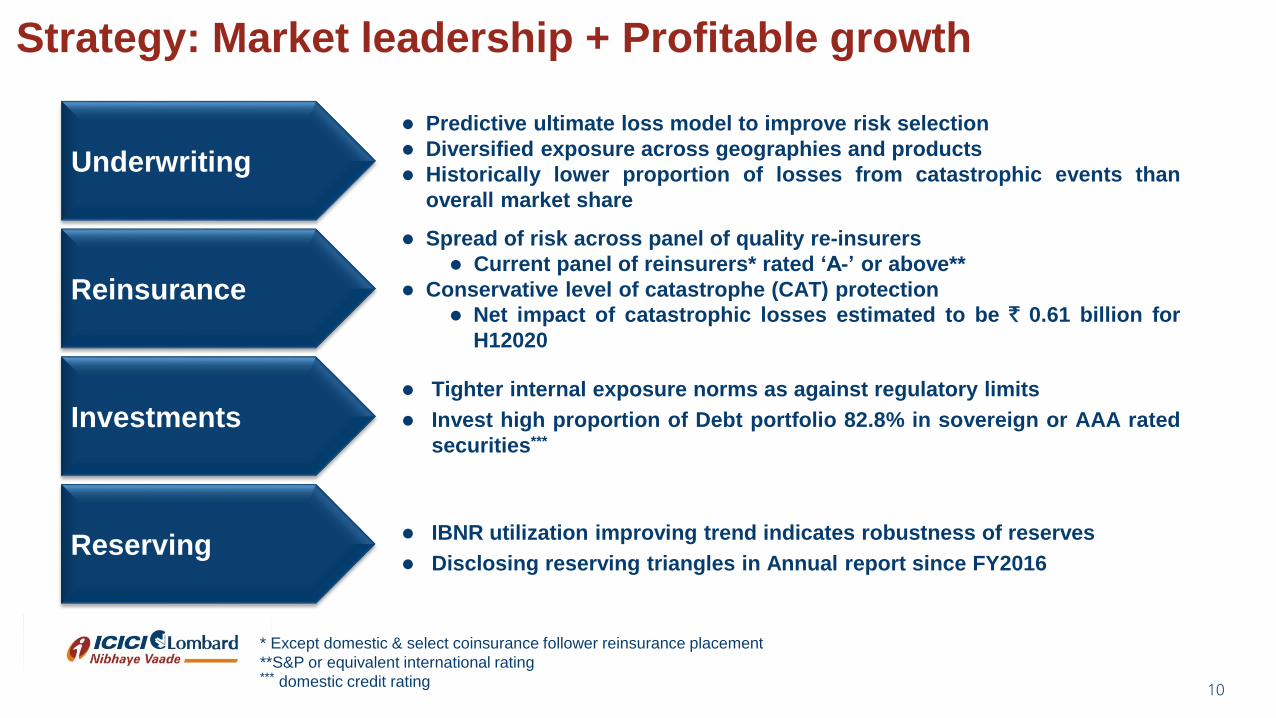
Strategy: Market leadership + Profitable growth
Spread of risk across panel of quality re-insurers
Current panel of reinsurers* rated ‘A-’ or above**
Conservative level of catastrophe (CAT) protection
Net impact of catastrophic losses estimated to be ` 0.61 billion for
H12020
Tighter internal exposure norms as against regulatory limits
Invest high proportion of Debt portfolio 82.8% in sovereign or AAA rated
securities***
IBNR utilization improving trend indicates robustness of reserves
Disclosing reserving triangles in Annual report since FY2016
Investments
Reinsurance
Reserving
Predictive ultimate loss model to improve risk selection
Diversified exposure across geographies and products
Historically lower proportion of losses from catastrophic events than
overall market share
Underwriting
* Except domestic & select coinsurance follower reinsurance placement
**S&P or equivalent international rating*** domestic credit rating

Agenda
• Company Strategy
• Financial Performance
• Industry Overview
12
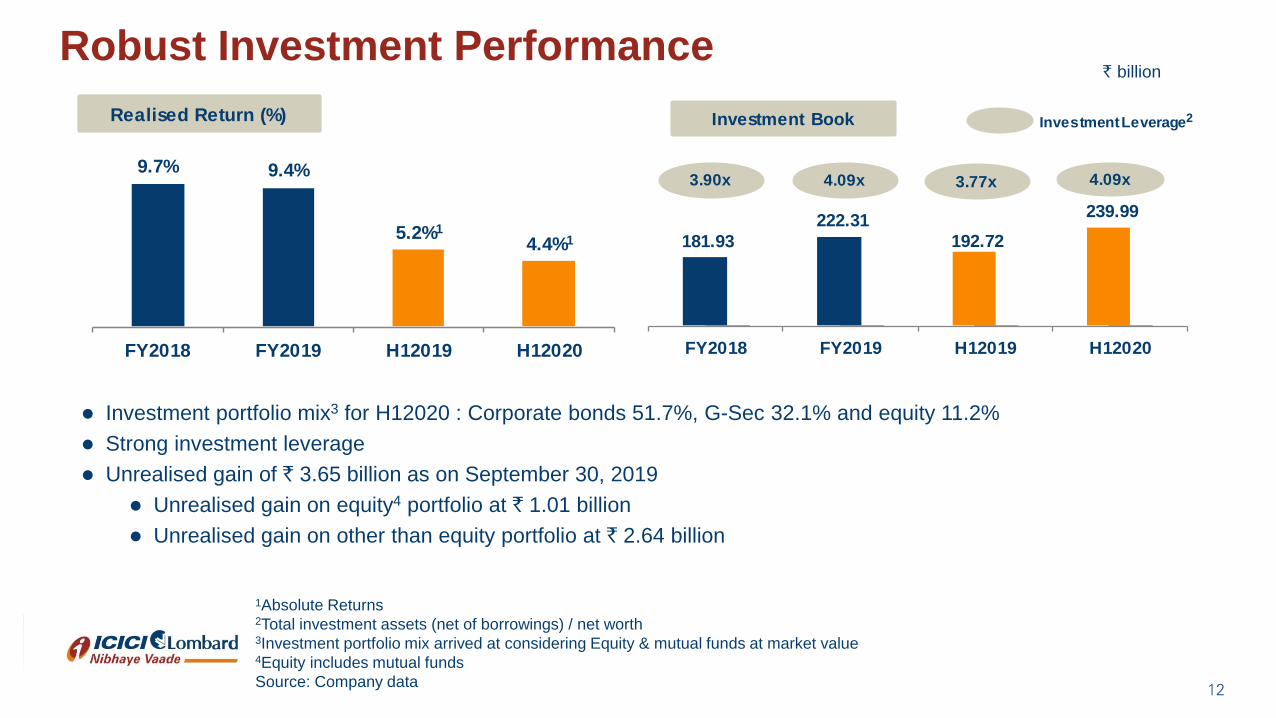
Robust Investment Performance
Investment portfolio mix3 for H12020 : Corporate bonds 51.7%, G-Sec 32.1% and equity 11.2%
Strong investment leverage
Unrealised gain of ` 3.65 billion as on September 30, 2019
Unrealised gain on equity4 portfolio at ` 1.01 billion
Unrealised gain on other than equity portfolio at ` 2.64 billion
1Absolute Returns2Total investment assets (net of borrowings) / net worth3Investment portfolio mix arrived at considering Equity & mutual funds at market value4Equity includes mutual funds
Source: Company data
` billion
9.7% 9.4%
5.2%1
4.4%1
FY2018 FY2019 H12019 H12020
Realised Return (%)Realised Return (%)
181.93
222.31
192.72
239.99
FY2018 FY2019 H12019 H12020
Investment Leverage2
3.90x 4.09x
Investment Book
3.77x 4.09x
13
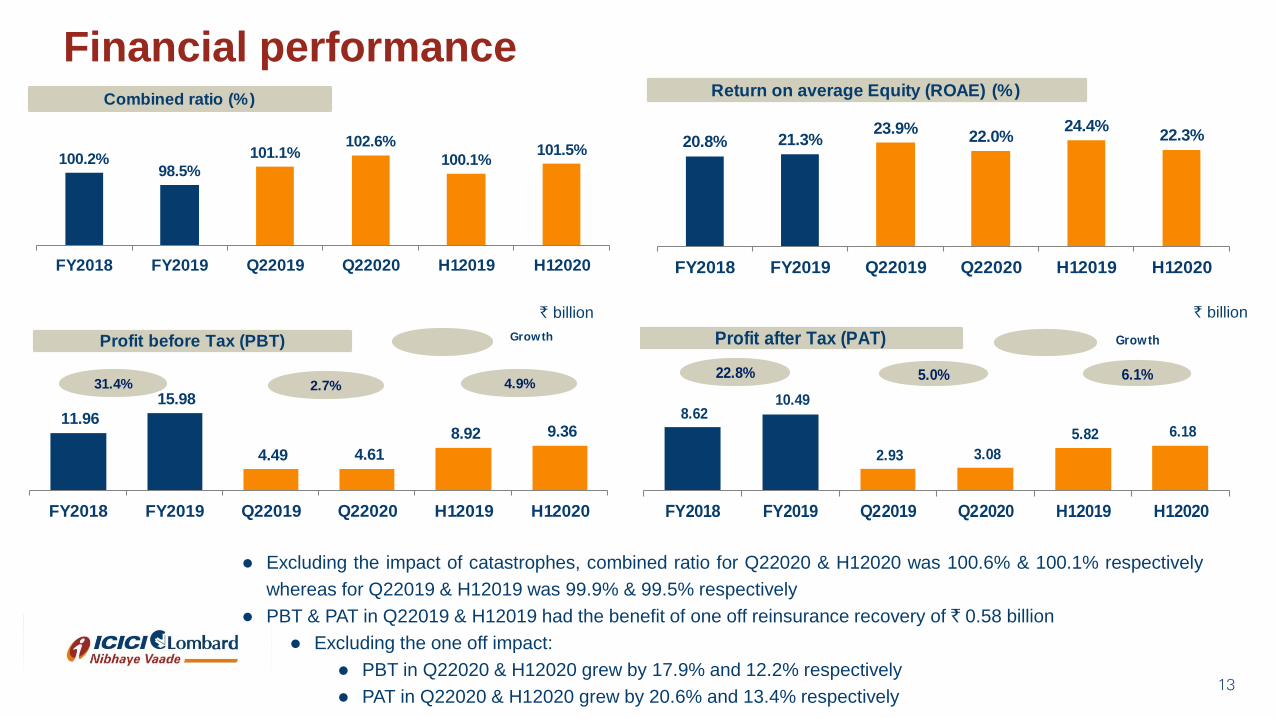
Financial performance
Excluding the impact of catastrophes, combined ratio for Q22020 & H12020 was 100.6% & 100.1% respectively
whereas for Q22019 & H12019 was 99.9% & 99.5% respectively
PBT & PAT in Q22019 & H12019 had the benefit of one off reinsurance recovery of ` 0.58 billion
Excluding the one off impact:
PBT in Q22020 & H12020 grew by 17.9% and 12.2% respectively
PAT in Q22020 & H12020 grew by 20.6% and 13.4% respectively
` billion ` billion
100.2%98.5%
101.1%102.6%
100.1%101.5%
FY2018 FY2019 Q22019 Q22020 H12019 H12020
Combined ratio (%)
20.8% 21.3%23.9%
22.0%24.4%
22.3%
FY2018 FY2019 Q22019 Q22020 H12019 H12020
Return on average Equity (ROAE) (%)
11.96
15.98
4.49 4.61
8.92 9.36
FY2018 FY2019 Q22019 Q22020 H12019 H12020
Growth
2.7%31.4%
Profit before Tax (PBT)
4.9%
8.62 10.49
2.93 3.08
5.82 6.18
FY2018 FY2019 Q22019 Q22020 H12019 H12020
Growth
22.8%
Profit after Tax (PAT)
6.1%5.0%

Agenda
• Company Strategy
• Financial Performance
• Industry Overview
15
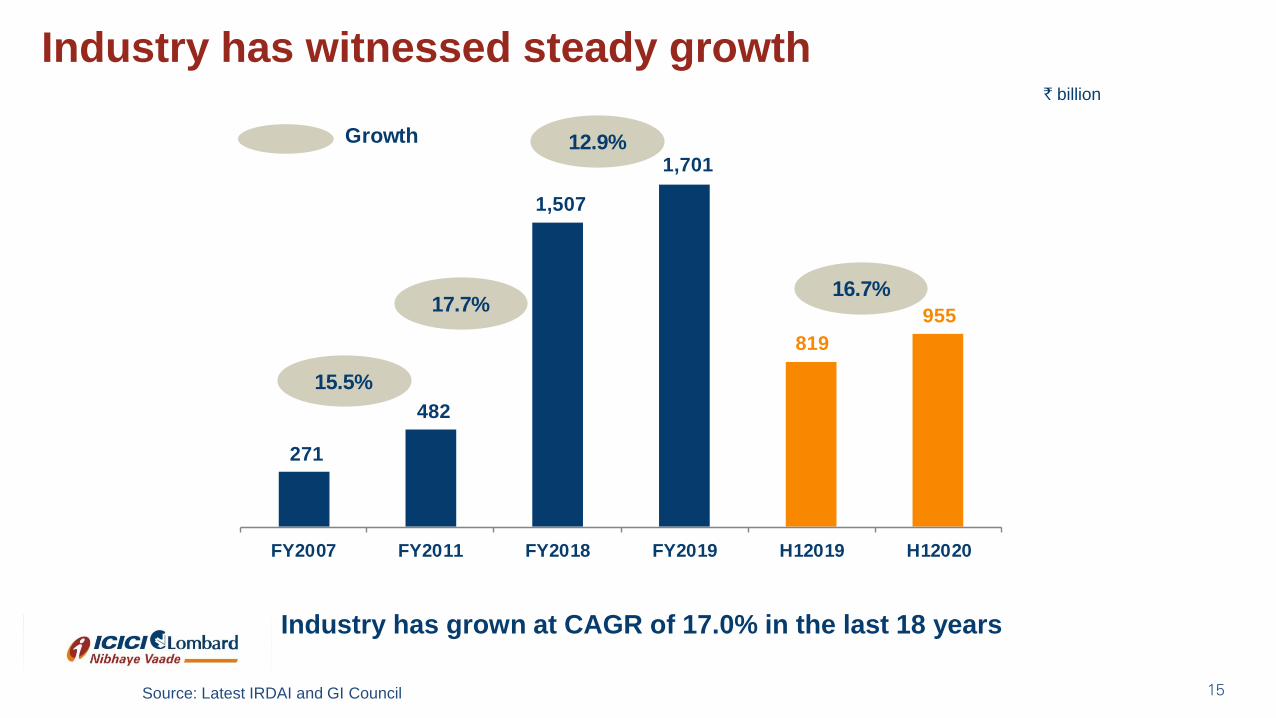
Industry has witnessed steady growth
Source: Latest IRDAI and GI Council
` billion
Industry has grown at CAGR of 17.0% in the last 18 years
271
482
1,507
1,701
819
955
FY2007 FY2011 FY2018 FY2019 H12019 H12020
Growth
15.5%
17.7%
12.9%
16.7%
16
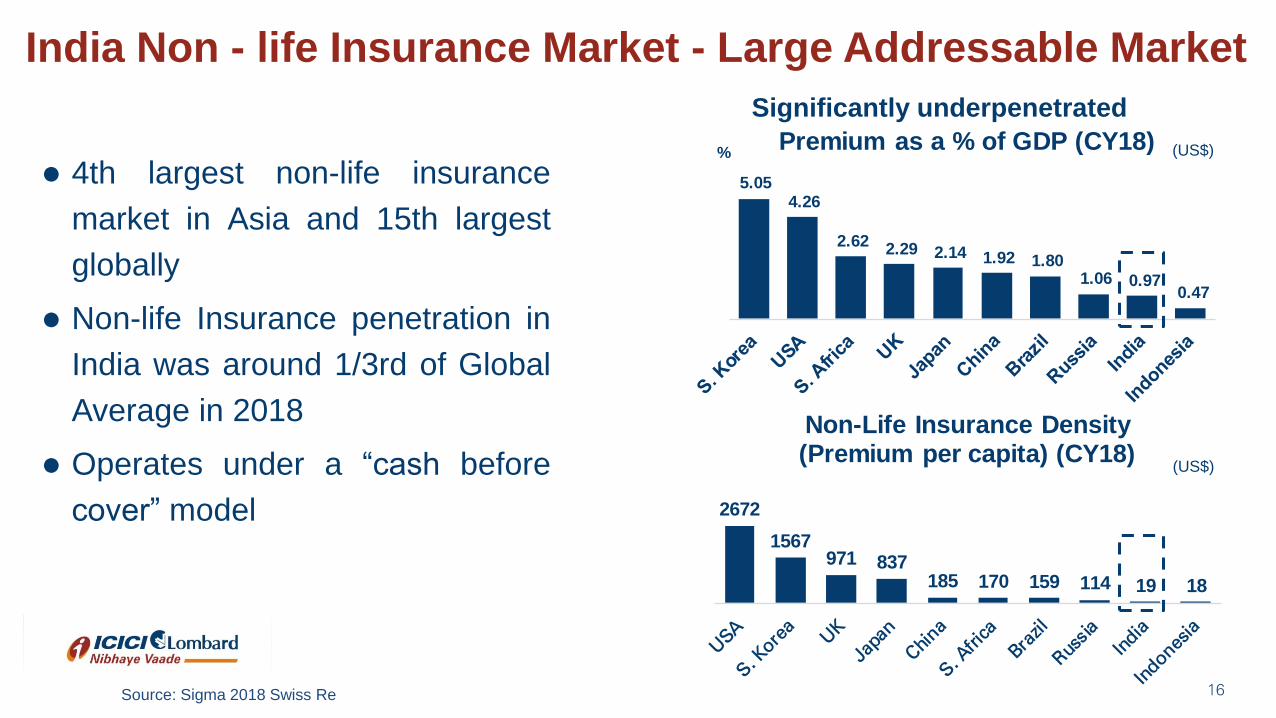
India Non - life Insurance Market - Large Addressable Market
Source: Sigma 2018 Swiss Re
Significantly underpenetrated
4th largest non-life insurance
market in Asia and 15th largest
globally
Non-life Insurance penetration in
India was around 1/3rd of Global
Average in 2018
Operates under a “cash before
cover” model
5.05 4.26
2.62 2.29 2.14 1.92 1.80
1.06 0.97 0.47
Premium as a % of GDP (CY18)
2672
1567971 837
185 170 159 114 19 18
Non-Life Insurance Density (Premium per capita) (CY18)
(US$)%
(US$)
Thank you

Annexure
19
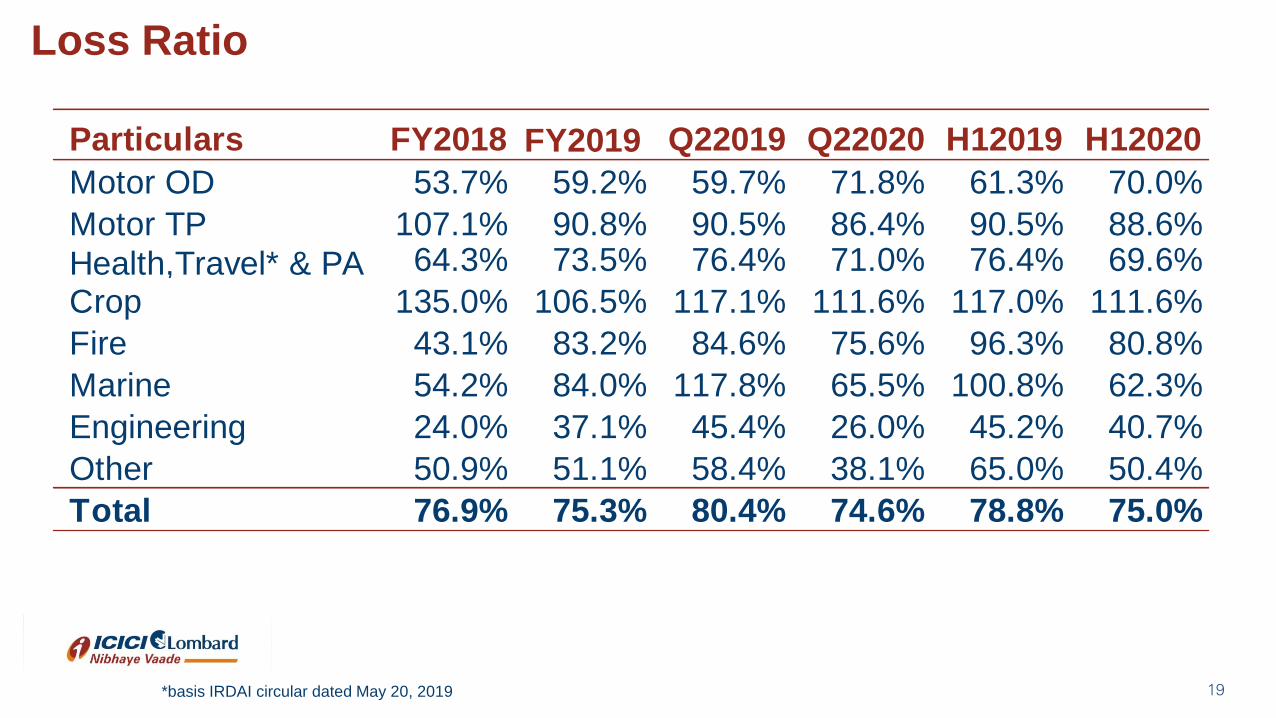
Loss Ratio
*basis IRDAI circular dated May 20, 2019
Particulars FY2018
FY2019 Q22019 Q22020 H12019 H12020
Motor OD 53.7% 59.2% 59.7% 71.8% 61.3% 70.0%
Motor TP 107.1% 90.8% 90.5% 86.4% 90.5% 88.6%
Health,Travel* & PA 64.3% 73.5% 76.4% 71.0% 76.4% 69.6%
Crop 135.0% 106.5% 117.1% 111.6% 117.0% 111.6%
Fire 43.1% 83.2% 84.6% 75.6% 96.3% 80.8%
Marine 54.2% 84.0% 117.8% 65.5% 100.8% 62.3%
Engineering 24.0% 37.1% 45.4% 26.0% 45.2% 40.7%
Other 50.9% 51.1% 58.4% 38.1% 65.0% 50.4%
Total 76.9% 75.3% 80.4% 74.6% 78.8% 75.0%
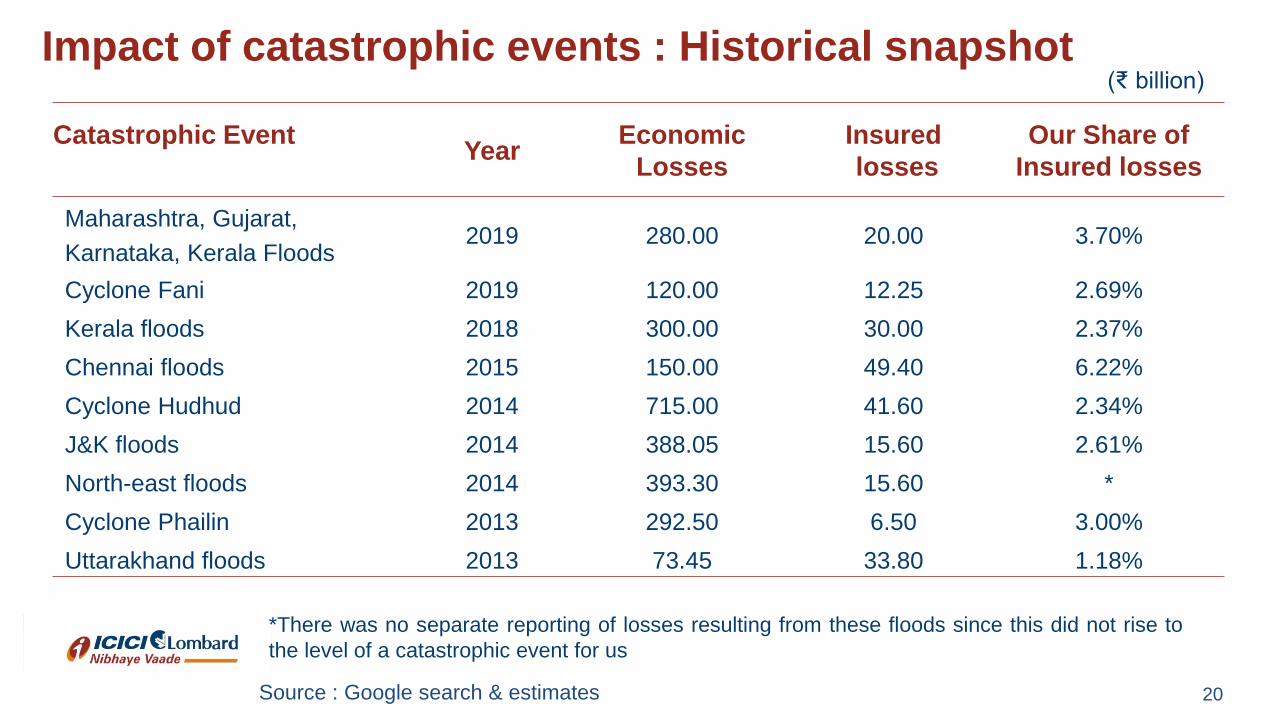
Impact of catastrophic events : Historical snapshot
Catastrophic EventYear
Economic
Losses
Insured
losses
Our Share of
Insured losses
Maharashtra, Gujarat,
Karnataka, Kerala Floods2019 280.00 20.00 3.70%
Cyclone Fani 2019 120.00 12.25 2.69%
Kerala floods 2018 300.00 30.00 2.37%
Chennai floods 2015 150.00 49.40 6.22%
Cyclone Hudhud 2014 715.00 41.60 2.34%
J&K floods 2014 388.05 15.60 2.61%
North-east floods 2014 393.30 15.60 *
Cyclone Phailin 2013 292.50 6.50 3.00%
Uttarakhand floods 2013 73.45 33.80 1.18%
20
*There was no separate reporting of losses resulting from these floods since this did not rise to
the level of a catastrophic event for us
Source : Google search & estimates
(₹ billion)
20
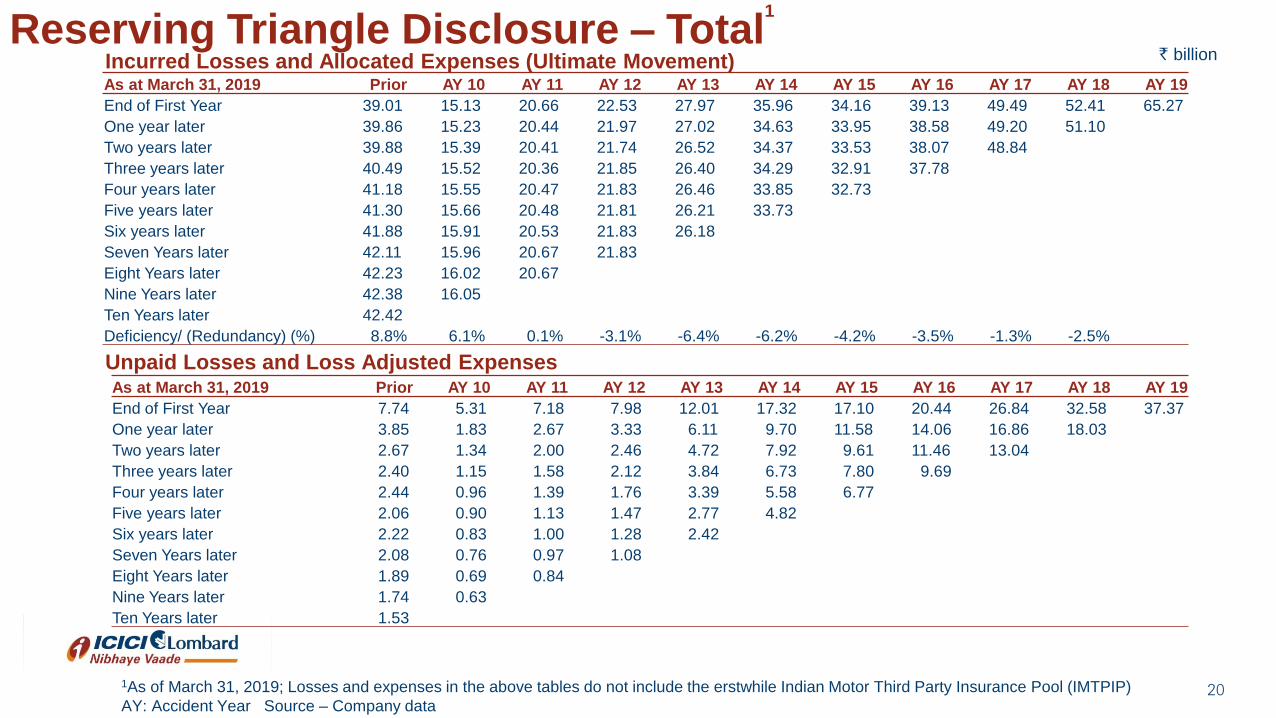
Reserving Triangle Disclosure – Total1
1As of March 31, 2019; Losses and expenses in the above tables do not include the erstwhile Indian Motor Third Party Insurance Pool (IMTPIP)
AY: Accident Year Source – Company data
Incurred Losses and Allocated Expenses (Ultimate Movement)
Unpaid Losses and Loss Adjusted Expenses
` billion
As at March 31, 2019 Prior AY 10 AY 11 AY 12 AY 13 AY 14 AY 15 AY 16 AY 17 AY 18 AY 19
End of First Year 39.01 15.13 20.66 22.53 27.97 35.96 34.16 39.13 49.49 52.41 65.27
One year later 39.86 15.23 20.44 21.97 27.02 34.63 33.95 38.58 49.20 51.10
Two years later 39.88 15.39 20.41 21.74 26.52 34.37 33.53 38.07 48.84
Three years later 40.49 15.52 20.36 21.85 26.40 34.29 32.91 37.78
Four years later 41.18 15.55 20.47 21.83 26.46 33.85 32.73
Five years later 41.30 15.66 20.48 21.81 26.21 33.73
Six years later 41.88 15.91 20.53 21.83 26.18
Seven Years later 42.11 15.96 20.67 21.83
Eight Years later 42.23 16.02 20.67
Nine Years later 42.38 16.05
Ten Years later 42.42
Deficiency/ (Redundancy) (%) 8.8% 6.1% 0.1% -3.1% -6.4% -6.2% -4.2% -3.5% -1.3% -2.5%
As at March 31, 2019 Prior AY 10 AY 11 AY 12 AY 13 AY 14 AY 15 AY 16 AY 17 AY 18 AY 19
End of First Year 7.74 5.31 7.18 7.98 12.01 17.32 17.10 20.44 26.84 32.58 37.37
One year later 3.85 1.83 2.67 3.33 6.11 9.70 11.58 14.06 16.86 18.03
Two years later 2.67 1.34 2.00 2.46 4.72 7.92 9.61 11.46 13.04
Three years later 2.40 1.15 1.58 2.12 3.84 6.73 7.80 9.69
Four years later 2.44 0.96 1.39 1.76 3.39 5.58 6.77
Five years later 2.06 0.90 1.13 1.47 2.77 4.82
Six years later 2.22 0.83 1.00 1.28 2.42
Seven Years later 2.08 0.76 0.97 1.08
Eight Years later 1.89 0.69 0.84
Nine Years later 1.74 0.63
Ten Years later 1.53
21
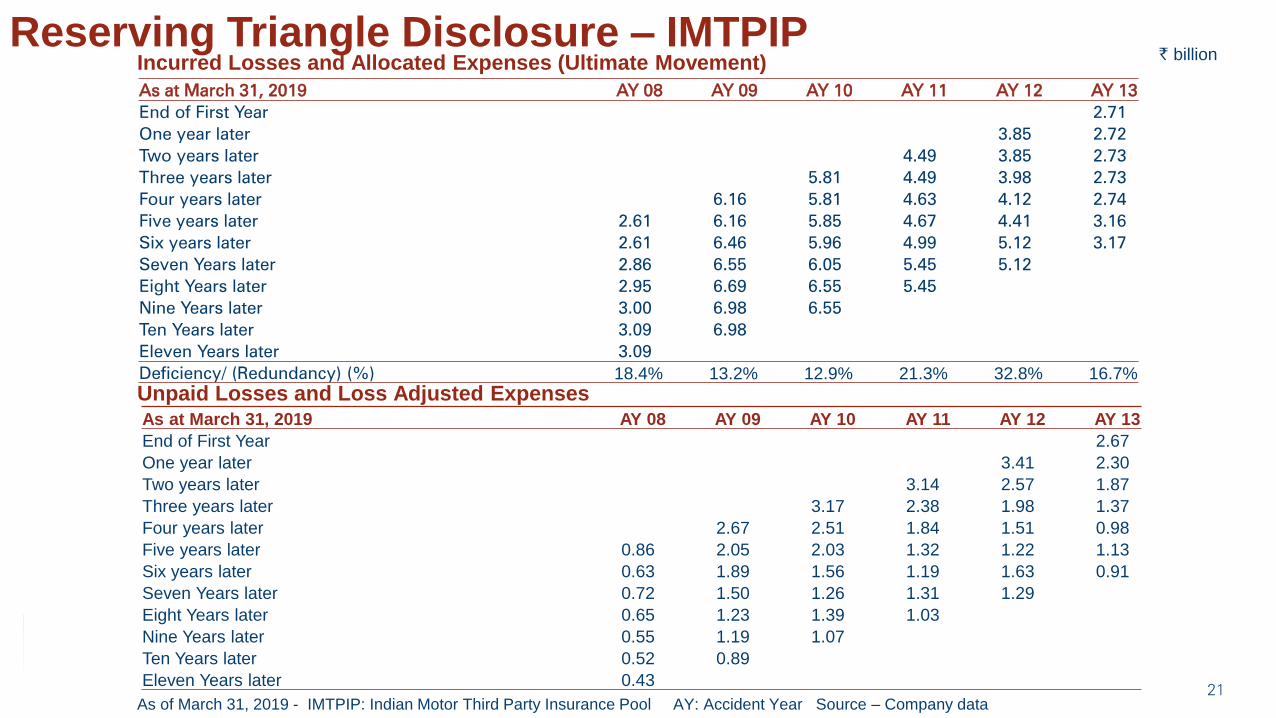
` billionReserving Triangle Disclosure – IMTPIP
As of March 31, 2019 - IMTPIP: Indian Motor Third Party Insurance Pool AY: Accident Year Source – Company data
Unpaid Losses and Loss Adjusted Expenses
As at March 31, 2019 AY 08 AY 09 AY 10 AY 11 AY 12 AY 13
End of First Year 2.71
One year later 3.85 2.72
Two years later 4.49 3.85 2.73
Three years later 5.81 4.49 3.98 2.73
Four years later 6.16 5.81 4.63 4.12 2.74
Five years later 2.61 6.16 5.85 4.67 4.41 3.16
Six years later 2.61 6.46 5.96 4.99 5.12 3.17
Seven Years later 2.86 6.55 6.05 5.45 5.12
Eight Years later 2.95 6.69 6.55 5.45
Nine Years later 3.00 6.98 6.55
Ten Years later 3.09 6.98
Eleven Years later 3.09
Deficiency/ (Redundancy) (%) 18.4% 13.2% 12.9% 21.3% 32.8% 16.7%
Incurred Losses and Allocated Expenses (Ultimate Movement)
As at March 31, 2019 AY 08 AY 09 AY 10 AY 11 AY 12 AY 13
End of First Year 2.67
One year later 3.41 2.30
Two years later 3.14 2.57 1.87
Three years later 3.17 2.38 1.98 1.37
Four years later 2.67 2.51 1.84 1.51 0.98
Five years later 0.86 2.05 2.03 1.32 1.22 1.13
Six years later 0.63 1.89 1.56 1.19 1.63 0.91
Seven Years later 0.72 1.50 1.26 1.31 1.29
Eight Years later 0.65 1.23 1.39 1.03
Nine Years later 0.55 1.19 1.07
Ten Years later 0.52 0.89
Eleven Years later 0.43