h14-110 fireworks air pollution in slovenia · h14-110 . fireworks air pollution in slovenia . ......
TRANSCRIPT

14th Conference on Harmonisation within Atmospheric Dispersion Modelling for Regulatory Purposes – 2-6 October 2011, Kos, Greece
652
H14-110 FIREWORKS AIR POLLUTION IN SLOVENIA
Primož Mlakar, Marija Zlata Božnar, Boštjan Grašič and Darko Popović
MEIS d.o.o., Mali Vrh pri Šmarju 78, SI-1293 Šmarje - Sap, Slovenia
Abstract: Over the last Christmas – New Year period, PM10 air pollution measured on most of the automatic measuring stations in Slovenia reached extreme values up to 300 micrograms per cubic metre. As most stations were operating in on-line mode, it is possible to give half hour averaged data detail evaluation of the events. Closer analysis shows a very close correlation with the timings of the fireworks in the areas. Fireworks are only allowed in this period and are very popular among people as a means of celebration and for visual enjoyment. Fireworks are used by the local inhabitants but also many of the local municipalities organize displays especially in the first minutes of the New Year. The poster will show the other side of this cultural enjoyment – the effect on PM10 air pollution. As the correlation with extreme values is so drastic all over Slovenia the question arises if these events do need some further regulation to prevent harmful health effects. Can the locations for fireworks be selected according to the knowledge about air pollution mechanisms in the area in order to at least decrease the pollution level if not prevent it at all? Some practical examples and analyses of the situations will be given for the Zasavje region in Slovenia, where two automatic stations measured extreme peaks of PM10 pollution during the Christmas – New Year period 2010–2011. The Zasavje region is located along the Sava river's steep canyon and amongst the surrounding hills and valleys with towns and rural areas. In the area a research prognostic and diagnostic air pollution modelling system is in operation based on meteorological measurements, prognostic meteorological data obtained by WRF and a local scale modelling system based on a Swift and numerical Lagrangian particle model Spray (by Arianet, Italy). The modelling system's results for the period examined will be presented and related to the measured PM10 pollution in the area in order to present the part of pollution coming from industry and domestic heating and the remaining part caused by fireworks. Key words: PM10 air pollution, fireworks, Zasavje region, prognostic and diagnostic air pollution modelling system, local scale modelling INTRODUCTION Over the last Christmas – New Year period, PM10 air pollution measured on most of the automatic measuring stations in Slovenia reached extreme values up to 300 micrograms per cubic metre. As most stations were operating in on-line mode, it is possible to give half hour averaged data detail evaluation of the events. Closer analysis shows a very close correlation with the timings of the fireworks in the areas. The purpose of this paper is to present the issue of air pollution due to the use of fireworks in the wider context of all air pollution.
Figure 1. Left: fireworks display over Ljubljana, the capital of Slovenia, right: fireworks devices (http://www.solarfireworks.co.uk)
Slovenia is a country with a complex terrain. Most of the surface is covered with hills and mountains, basins, valleys and canyons. Due to emissions into the atmosphere at unfavourable locations and due to the unfavourable conditions for lowering the concentration of these emissions, we are facing great problems with air pollution. The most important of the unfavourable conditions is calm, which is largely characteristic of almost all regions of Slovenia during all seasons. Wind roses show an abundance of calm. Another large problem are winter temperature inversions, which, mainly in larger and smaller basins, retain the pollutants in the atmosphere for longer periods and prevent their concentration from being efficiently lowered. In the past, we have had great problems with SO2 emissions from large thermal power plants and local domestic heating; for the purpose of quick help with managing production during the toughest episodes of pollution, we have developed forecasting methods on the basis of neural networks (Božnar, M., M. Lesjak and P. Mlakar, 1993). We overcame these problems using desulphurization plants. Today, ozone air pollution is one of the larger problems. We have also successfully forecast the concentrations of ozone at measurement locations using a model based on artificial neural networks (Grašič, B. et al., 2008),; other researchers (Petelin, D., J. Kocijan, and A. Grancharova, 2011).have also adopted a similar approach. In the last few years, the most prominent problem has been PM10 pollution, which occurs at a large part of the measuring stations, scattered across Slovenia.

14th Conference on Harmonisation within Atmospheric Dispersion Modelling for Regulatory Purposes – 2-6 October 2011, Kos, Greece
Topic 6: Inverse Dispersion Modelling and Source Identification 653
Figure 2. Wind rose with relatively high percentage of calm for the January 2011 (left: Veliki Ločnik, Notranjska region, right: Nožice, south of Gorenjska region)
Figure 3. Wind rose with relatively high percentage of calm for the January 2011
(left: Pustice, Dolenjska region, right: Jesenice, north of Gorenjska region) PM 10 POLLUTION IN SLOVENIA PM10 pollution is monitored by a national network of automatic measurement stations for air quality control and at some measurement stations within the operational monitoring of large industrial plants. The annual report of the SEA for year 2010 (Slovenian Environment Agency, 2011) states that the number of days with an excess of the daily limit value for the measurement locations is the following (allowed limit of daily exceedances is 35): Table 4. List of PM10 measuring sites in Slovenia with number of limit value exceedances in days and annual average concentration for year 2010.
Measuring site name (region, place) No. of limit value exceedances [days]
Annual average concentration [μg/m3]
Ljubljan Bežigrad (Ljubljan valley) 43 30 Maribor (Štajerska) 47 33 Kranj (Gorenjska) 37 32 Novo mesto (Dolenjska) 60 31 Celje (Štajerska) 58 32 Trbovlje (Zasavje) 64 34 Hrastnik (Zasavje) 30 27 Zagorje (Zasavje) 68 36 Murska Sobota - Rakičan (Prekmurje) 52 30 Nova Gorica (Primorska) 27 29 Koper (Primorska) 15 25 Žerjav (Zgornja Mežiška valley) 29 26 Iskrba (Notranjska, Kočevje) 5 14
The data for the average yearly value of PM10 pollution are somewhat more encouraging. There are not as many violations with this estimator. This state can be attributed to many causes. These are private domestic heating, traffic, industrial sources, burning waste and biomass outdoors, quarries, rubbish depots, etc. We wish to point out in this article one additional unusual cause – the use of fireworks for firework displays during the period of Christmas and the New Year holidays. EXAMPLES OF PM10 POLLUTION END OF 2010 Extreme values were measured at the Zagorje and Trbovlje stations during the evening hours of the Christmas days in 2010. Only some part of this can be attributed to local heating systems (they are mostly located in the vicinity of the Trbovlje station). The remainder was partly caused by the use of fireworks. The effect of the use of fireworks is even more obvious on New Year’s Eve. The stations “get” at least one day of excess of the daily limit value in this way.

14th Conference on Harmonisation within Atmospheric Dispersion Modelling for Regulatory Purposes – 2-6 October 2011, Kos, Greece
654
Figure 4. Measured PM10 concentrations during the Christmas and New Year holidays
in three regions in Slovenia: Zasavje, Šaleška and Celje (data taken from public portal okolje.info, 2011)
Figure 5. PM10 concentrations during the New Year holidays when highest concentrations had been measured
in three regions in Slovenia: Zasavje, Šaleška and Celje (data taken from public portal okolje.info, 2011) MODELLING OF ZAGORJE FIREWORKS Zagorje is a small town located in a valley in Zasavje region. It had the highest peak at the last New Year among all above enumerated stations in Slovenia. We choose this station for fireworks modelling because of our regional modelling system operating in the area. The area and the modelling system are explained in details in another articles at this conference (Mlakar, P. et al., 2011, Božnar, M. Z., P. Mlakar, and B. Grašič, 2011). The aim of the modelling case study was to determine approximate emissions due to local fireworks that has as a consequence the peak measured at the Zagorje station.
Figure 6: Ground locations of the main fireworks in the Zagorje municipality in the centre of Zagorje town For that purpose we have determined that overall level of 100 μg/m3 are due to other sources (accumulated from local heating, roads re-suspension and local industry) and the peak over this value is due to fireworks. This is speculation, but it is very probable, because there was one main fireworks organised by municipality and it is unfortunately a habit that almost
14th Conference on Harmonisation within Atmospheric Dispersion Modelling for Regulatory Purposes – 2-6 October 2011, Kos, Greece
Topic 6: Inverse Dispersion Modelling and Source Identification 655
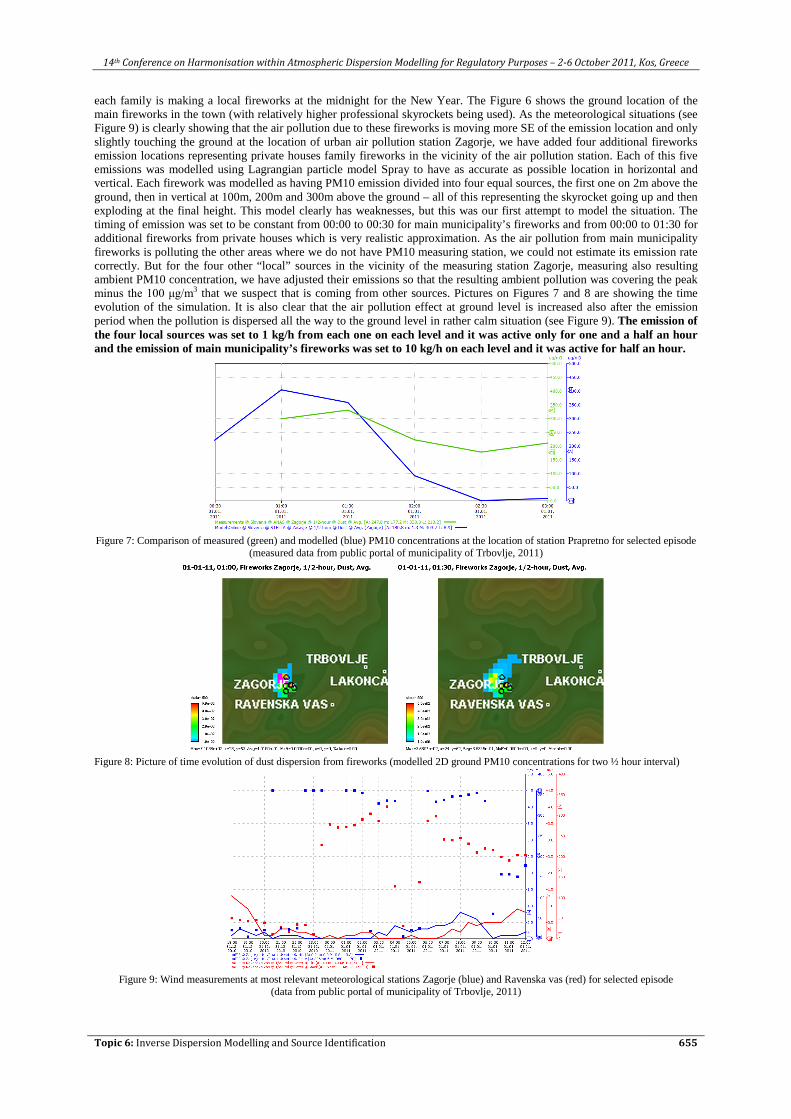
each family is making a local fireworks at the midnight for the New Year. The Figure 6 shows the ground location of the main fireworks in the town (with relatively higher professional skyrockets being used). As the meteorological situations (see Figure 9) is clearly showing that the air pollution due to these fireworks is moving more SE of the emission location and only slightly touching the ground at the location of urban air pollution station Zagorje, we have added four additional fireworks emission locations representing private houses family fireworks in the vicinity of the air pollution station. Each of this five emissions was modelled using Lagrangian particle model Spray to have as accurate as possible location in horizontal and vertical. Each firework was modelled as having PM10 emission divided into four equal sources, the first one on 2m above the ground, then in vertical at 100m, 200m and 300m above the ground – all of this representing the skyrocket going up and then exploding at the final height. This model clearly has weaknesses, but this was our first attempt to model the situation. The timing of emission was set to be constant from 00:00 to 00:30 for main municipality’s fireworks and from 00:00 to 01:30 for additional fireworks from private houses which is very realistic approximation. As the air pollution from main municipality fireworks is polluting the other areas where we do not have PM10 measuring station, we could not estimate its emission rate correctly. But for the four other “local” sources in the vicinity of the measuring station Zagorje, measuring also resulting ambient PM10 concentration, we have adjusted their emissions so that the resulting ambient pollution was covering the peak minus the 100 μg/m3 that we suspect that is coming from other sources. Pictures on Figures 7 and 8 are showing the time evolution of the simulation. It is also clear that the air pollution effect at ground level is increased also after the emission period when the pollution is dispersed all the way to the ground level in rather calm situation (see Figure 9). The emission of the four local sources was set to 1 kg/h from each one on each level and it was active only for one and a half an hour and the emission of main municipality’s fireworks was set to 10 kg/h on each level and it was active for half an hour.
Figure 7: Comparison of measured (green) and modelled (blue) PM10 concentrations at the location of station Prapretno for selected episode
(measured data from public portal of municipality of Trbovlje, 2011)
Figure 8: Picture of time evolution of dust dispersion from fireworks (modelled 2D ground PM10 concentrations for two ½ hour interval)
Figure 9: Wind measurements at most relevant meteorological stations Zagorje (blue) and Ravenska vas (red) for selected episode
(data from public portal of municipality of Trbovlje, 2011)

14th Conference on Harmonisation within Atmospheric Dispersion Modelling for Regulatory Purposes – 2-6 October 2011, Kos, Greece
656
FIREWORKS – ENJOYMENT OR HARMFULL EFFECT ON HEALTH Firework displays have always been a means for giving a visual emphasis to celebrations. But we must also ask ourselves whether their use in some really unfavourable weather conditions is excessive and even harmful to health. We have shown in the article how the use of fireworks in many Slovenian towns during the period of Christmas and New Year holidays greatly contributes to the significant pollution of the air with PM10. In addition to the excess of the limit values for the daily average of PM10, it is necessary to examine the chemical composition of the particles emitted by fireworks. Wikipedia states the following (Wikipedia, 2011): “Many of the chemicals used in the manufacture of fireworks are non-toxic, while many more have some degree of toxicity, can cause skin sensitivity, or exist in dust form and are thereby inhalation hazards. Still others are poisons if directly ingested or inhaled.” The website also features a list of many basic ingredients, chemical compounds and elements alike, which are found in firework displays. STATE REGULATION In Slovenia, the use of fireworks is only permitted for private purposes from 26th of December to 2nd of January (Republic of Slovenia, 2008). For the purpose of preventing PM10 pollution in regions with considerable excesses of the limit values for PM10, a decree is being prepared at the national level, which will prohibit the use of fireworks for firework displays in the Central Sava Valley (Trbovlje, Zagorje in Hrastnik) during the winter time (decree being prepared by (Ministry of the environment and spatial planning, Republic of Slovenia, 2011)). This is undoubtedly a sensible first step. It would also be worth considering the regulation of this issue on a national scale. It is a fact that we are greatly limited in terms of the consequences of fireworks’ displays (air pollution) by common sense in the use of fireworks and by the natural conditions which, during the winter time, prevent us from lowering the concentration of PM10 in the air. CONCLUSIONS The goal of the paper is to bring attention to the issue of the pollution of air with PM10 due to the use of fireworks in the winter time. We shed light on numerous aspects and reinforced our thinking with publicly accessible measurement data on PM10 pollution in Slovenia during the Christmas and New Year period. We have presented a detail modelling of the air pollution in the town of Zagorje where a significant peak due to fireworks was measured. We have used inverse modelling technique to estimate the emission rate due to fireworks. We have also presented the first step in regulating the pollution thus caused – a national decree for one of the heavily polluted regions, where PM10 pollution is significantly excessive. We wish that this issue is given more attention and that on a national level there would be attempts to find a compromise solution which would enable visual pleasure as well as ensure clean air. ACKNOWLEDGEMENT The study was partially financed by the Slovenian Research Agency, Project No. L1-2082 and Project No. L1-4154 (A).
REFERENCES Božnar, M. Z., P. Mlakar, and B. Grašič, 2011: Short-term fine resolution WRF forecast data validation in complex terrain in
Slovenia. HARMO14 : proceedings of the 14th International Conference on Harmonisation within Atmospheric Dispersion Modelling for Regulatory Purposes, 2-6 October 2011, Kos Island, Greece.
Božnar, M., M. Lesjak and P. Mlakar, 1993: A neural network-based method for short-term predictions of ambient SO2 concentrations in highly polluted industrial areas of complex terrain. Atmos. environ., B Urban atmos., vol. 27, pp. 221-230.
Grašič, B., M. Z. Božnar, P. Mlakar and G. Tinarelli, 2008: Re-evaluation of the Lagrangian particle modelling system on an experimental campaign in complex termin. Nuovo cimento Soc. ital. fis., C Geophys. space phys., vol. 30, no. 6, pp. 557-575, doi: 10.1393/ncc/i2007-10257-3
Ministry of the environment and spatial planning, Republic of Slovenia, 2011: Osnutek Uredbe o načrtu za kakovost zunanjega zraka na območju občin Trbovlje, Zagorje ob Savi in Hrastnik. http://www.mop.gov.si/fileadmin/mop.gov.si/pageuploads/dokumenti/ur-pm10-zasavje.doc, 19.08.2011
Mlakar, P., M. Z. Božnar, B. Grašič and G. Tinarelli, 2011: Zasavje canyon regional on-line air pollution modeling system in highly complex terrain as a support to EU directives. HARMO14 : proceedings of the 14th International Conference on Harmonisation within Atmospheric Dispersion Modelling for Regulatory Purposes, 2-6 October 2011, Kos Island, Greece.
okolje.info, 2011: okolje.info, Milan Vidmar Electric Power Research Institute. http://www.okolje.info, 20.08.2011 Petelin, D., J. Kocijan, and A. Grancharova, 2011: On-line Gaussian process model for the prediction of the ozone
concentration in the air. Comptes Rendus de l Academie Bulgare des Sciences, vol. 64, no. 1. Republic of Slovenia, 2008: Explosive Substances and Pyrotechnic Products Act, Zakon o eksplozivih in pirotehničnih
izdelkih (ZEPI), Ur.l. RS, št. 35/2008 Slovenian Environment Agency, 2011: Kakovost zraka v Sloveniji v letu 2010. Agencija RS za okolje, Vojkova 1b,
Ljubljana, Urad za hidrologijo in stanje okolja in Sektor za kakovost zraka, http://www.arso.gov.si/zrak/kakovost%20zraka/poro%c4%8dila%20in%20publikacije/LETNO%20%202010.pdf, 19.08.2011
Trbovlje, 2011: Predstavitev podatkov o vremenu in kvaliteti zunanjega zraka v Zasavju (Presentation of weather data and air quality in Zasavje region), Public portal of municipality of Trbovlje. http://www.trbovlje.si/index.php?option=com_content&task=view&id=326&Itemid=155, 01.01.2011
Wikipedia, 2011: Fireworks. http://en.wikipedia.org/wiki/Fireworks. 21.08.2011