h2 2012 results - capgemini capgemini investors en · onepathtm: sap as-a-service products and...
TRANSCRIPT

2012 Half Year Results
July 26, 2012

2012 Half Year Results
2 Copyright © Capgemini 2012. All Rights Reserved
Paul Hermelin Chairman and CEO

2012 Half Year Results
3 Copyright © Capgemini 2012. All Rights Reserved
€5,150M revenue in H1 2012, +8.3% +2.3% organically, in line with guidance
Positive net cash position €27M Business model under control
6.4% of revenue, in line with FY guidance
121,000+ headcount Continuous increase of our offshore basis, 38.1% (+1pt vs YE 2011)
Growth
Operating
margin
Sales activity
Offshore
Good booking level, BBR at 1.09, 1.16 in Q2 2012
Price pressure resistance thanks to high-value offer development
Cash
Strong resilience demonstrated again

2012 Half Year Results
4 Copyright © Capgemini 2012. All Rights Reserved
We execute our strategy
Sell new offerings bringing higher value to clients
and higher margins (eg. Cloud based offers - Salesforce.com)
Develop solutions and new business models
(eg. SAP Mobility)
Accelerate offshore expansion (e.g. XRIM)
Reshape onshore pyramids, hire more freshers
Develop a strong industrialized network of AM factories
Improve cost position leveraging Lean methods
and standardization
Portfolio
Pyramid
Industrialization & Cost cutting

2012 Half Year Results
5 Copyright © Capgemini 2012. All Rights Reserved
Client appetite for our cloud-based portfolio strategy
Customer
experience
Operational
Process Business model
SAAS
PAAS
IAAS
"Cloud"
Digital Transformation MIT framework
Cloud is everywhere!
Mobility
Big Data

2012 Half Year Results
6 Copyright © Capgemini 2012. All Rights Reserved
SAP as-a-service, innovative cloud-based solutions
PartnerEdge
Channel
Program
RapidPath for
Medical Devices
EnergyPath
CRESCENT
Consumer retail
IBX platform
Procurement
CHROME
Manufacturing
Financials and
Accounting
BPO
Procurement
BPO
Public Cloud
Private Cloud
SAP Managed
Mobility Partner
Program
Illustration with SAP
business in North America
5% of bookings
are “As a Service”
25% of bookings
are “Solutions based”
For 100% of bookings,
solutions were part of the
discussions
License Build Host Operate
Solutions
Products
Services Support for
Solutions
IAAS SAAS PAAS
OnePathTM : SAP as-a-service Products and Solutions
2012 Half Year Results
7 Copyright © Capgemini 2012. All Rights Reserved
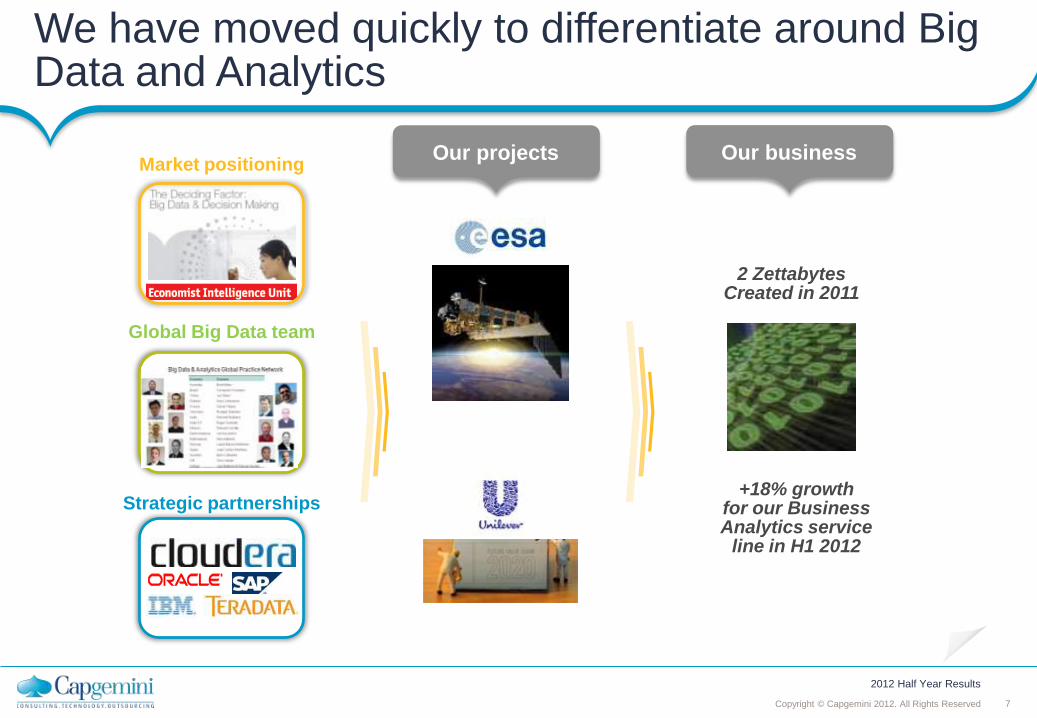
We have moved quickly to differentiate around Big Data and Analytics
Market positioning
Global Big Data team
Strategic partnerships
Our projects Our business
2 Zettabytes Created in 2011
+18% growth for our Business Analytics service
line in H1 2012

2012 Half Year Results
8 Copyright © Capgemini 2012. All Rights Reserved
Re-shaping fast our pyramid
Offshore expansion
75K
44 k (35k in India)
80 K
YE 2011 Target 2015
46 k (near 37k in India)
H1 2012
End-to-end pyramid
40% freshers out of H1 2012 total recruits, +3pts versus 2011
Objective of 47% freshers out of total H2 recruits with the
upcoming recruitment season in September
Strengthening senior positions offshore: +19% increase this
year

2012 Half Year Results
9 Copyright © Capgemini 2012. All Rights Reserved
2012 2015
Major deals including large offshore components
Recent major deals validate our Rightshore® strategy
2011
550 FTEs
80 FTEs 250 FTEs
230 FTEs
The champion in Continental Europe
with a share of 10% of total offshored
resources serving Europe
Several Banking
Deals

2012 Half Year Results
10 Copyright © Capgemini 2012. All Rights Reserved
Globalization agenda Winning clients are engaged
in a globalization journey
We entered the elite world of global players
Global delivery network Demanding customers want global
delivery networks, including industrialized onshore centers
Global consistency Alliance partners require global
coverage and alignment
(1) : IBM, Accenture, Indian pure players
€20m+ deal pipeline up 42% vs January
We are increasingly bidding against global players (1) : 71% of our bids
(versus 58% in 2011)

2012 Half Year Results
11 Copyright © Capgemini 2012. All Rights Reserved
A tangible shift of the Group in H1 2012
Group
momentum
Sustained growth in North America
Top accounts strategy & reference clients
New geographies expansion
Demonstrated resilience in troubled Europe
+9.7% H1 YoY
20.8% of the Group revenue in Q2
Caixa multi-year deal in Brazil
ANZ deal in Australia
Double-digit growth in Nordic and in the UK, excl. Aspire Turnaround program in NL
Portfolio management to offset price pressure
Limited price decrease +29% growth of our Top Line Initiatives
+10% growth on strategic accounts for
the second year
Acquisition of reference customers
New business models uptake
+30% SAP business As a service/ solutions in the US Significant Prosodie deal with CNAM
1
3 6
4
2 5
Successful combination
of organic growth and accretive acquisitions
2012 Half Year Results
12 Copyright © Capgemini 2012. All Rights Reserved
2012 growth guidance revised upward
Revenue: over 1% organic growth in 2012
Operating margin rate increase confirmed,
in line with consensus

2012 Half Year Results
13 Copyright © Capgemini 2012. All Rights Reserved
Paul Nannetti Group Sales and Portfolio Director

2012 Half Year Results
14 Copyright © Capgemini 2012. All Rights Reserved
At budget rates and constant perimeter
H1 2012 revenue by sector
H1 2012
H1 2012
vs. 2011
Revenue
Financial services -5.6%
Energy, utilities & chemicals 5.3%
MALS 0.7%
CPRDT 9.8%
Public sector -0.9%
Telecom, Media & entertainment 0.0%
Total 2.3%
19.0%
23.9%
17.3%
13.7%
10.9%
9.0%
6.2%
External revenue
Financial services Public sector
MALS CPRDT
Energy, utilities & chemicals Telecom, media & entertainment
Others

2012 Half Year Results
15 Copyright © Capgemini 2012. All Rights Reserved
Bookings evolution by business
M€
1639 1754 1371
1713 1586 1749
784
1004
815
764
559
1219
0
500
1000
1500
2000
2500
3000
3500
Q1 11 Q2 11 Q3 11 Q4 11 Q1 12 Q2 12
CS / TS / LPS Outsourcing
2423
2758
2186
2477
2145
2968
At budget rates and constant perimeter

2012 Half Year Results
16 Copyright © Capgemini 2012. All Rights Reserved
Book to Bill evolution
Q2 2012
Consulting/Technology/Local professional services
M€ Booking Revenue BBR
North America 390 343 1.14
Rest of the World 1 359 1 163 1.17
Total 1 749 1 506 1.16
At budget rates
H1 2012
Consulting/Technology/Local professional services
M€ Booking Revenue BBR
North America 739 679 1.09
Rest of the World 2 596 2 383 1.09
Total 3 335 3 062 1.09
At budget rates

2012 Half Year Results
17 Copyright © Capgemini 2012. All Rights Reserved
Major H1 2012 deals
IT partner
Smart metering
+ Customer experience
ALS
ALS
Service Integration
Testing
€MMM years
€130M
€80M
~€50M
€MM
€MM
TCV figures

2012 Half Year Results
18 Copyright © Capgemini 2012. All Rights Reserved
How we see the market
Geographies
Digital Transformation
Multi Channel Exp.
Cloud, Big Data, Mobility
Offers
CPR
EU
FS outside Continental
Europe
Sectors
Benelux
Iberia
Mega, multi-tower deals FS in Continental
Europe
Public Sector
“Hot”
“Cold”
Overall, transition from Capex to Opex, caution on long-term investments
but appetite for new technologies… and a good flow of larger deals
North America
Nordic
Asia Pacific
France, Germany,
UK, Italy, Latam
Mid size offshore
AM/IM/BPO
TME
MALS
Stable
=

2012 Half Year Results
19 Copyright © Capgemini 2012. All Rights Reserved
Nicolas Dufourcq Deputy General Manager and CFO

2012 Half Year Results
20 Copyright © Capgemini 2012. All Rights Reserved
(in M€)
H1 2011 H2 2011 H1 2012 H1 2012
vs
H1 2011
Revenues 4 756 4 937 5 150 + 8.3%
Operating expenses - 4 467 - 4 513 - 4 822
Operating Margin before amortization of intangible assets acquired through business combinations
301 437 347
(% Revenues) 6.3% 8.9% 6.7% + 0.4 pt
Amortization of intangible assets acquired through business combinations
- 12 -13 -19
Operating Margin 289 424 328
(% Revenues) 6.1% 8.6% 6.4% + 0.3 pt
Other operating expenses - 49 - 69 - 91
Operating Profit 240 355 237
(% Revenues) 5.1% 7.2% 4.6% - 0.5 pt
Net financial expense - 51 - 54 - 49
Income tax expense - 70 - 31 - 55
Share of profit of associates - - -1
Non-controlling interests 8 7 11
Net Profit (Group Share) 127 277 143
Normalized Net Profit (Group Share) (*) 158 321 211
Net cash (end of period) 169 454 27
Number of employees (end of period) 114 274 119 707 121 026
Income Statement: Overview
+ 2.3 % Organic
(*) Normalized net profit (Group share) equal Net profit (Group share) corrected for the impact of restructurings costs and amortization of
intangible assets acquired through business combination, net of tax.

2012 Half Year Results
21 Copyright © Capgemini 2012. All Rights Reserved
Current Organic
Current Sequential Year on
year Sequential
Year on year
(in M€) Q2 2011 Q1 2012 Q2 2012 Q2 12 /
Q1 12
Q2 12 /
Q2 11
Q2 12 /
Q1 12
Q2 12 /
Q2 11
North America 445 505 536 6.1% 20.2% 4.3% 7.2%
UK & Ireland 508 510 559 9.5% 9.9% 6.3% 0.9%
France 515 578 538 -7.1% 4.5% -7.1% -4.3%
Benelux 319 298 278 -6.9% -12.9% -6.9% -13.0%
Rest of Europe, Asia & Latin America
619 674 674 0.3% 9.1% 1.5% 5.6%
TOTAL 2 406 2 565 2 585 0.8% 7.4% 0.2% 0.4%
Benelux
North America
UK &
Ireland
France
Rest of Europe,
Asia & Latin
America
20.8%
21.6%
10.7%
20.8%
26.1%
Q2 2012 Revenues by Main Geography

2012 Half Year Results
22 Copyright © Capgemini 2012. All Rights Reserved
At constant rates and perimeter
Q2 2012 Growth by Discipline
5.2%
39.9%
40.3%
14.6%
Consulting
Services
Technology
Services
Local Professional
Services
Outsourcing Services
Sequential Year on year
Q2 12 / Q1 12 Q2 12 / Q2 11
Consulting Services 1.3% 1.4%
Technology Services -0.2% 3.1%
Local Professional Services
-7.2% -3.0%
CS / TS / LPS -1.9% 1.4%
Outsourcing Services 3.4% -1.0%
TOTAL GROUP 0.2% 0.4%

2012 Half Year Results
23 Copyright © Capgemini 2012. All Rights Reserved
Current Organic
Current Sequential Year on
year Sequential
Year on year
(in M€) H1 2011 H2 2011 H1 2012 H1 12 /
H2 11
H1 12 /
H1 11
H1 12 /
H2 11
H1 12 /
H1 11
North America 869 936 1 041 11.3% 19.7% 4.5% 9.7%
France 1 039 1 099 1 116 1.6% 7.4% 2.0% - 1.6%
UK & Ireland 987 958 1 069 11.6% 8.3% 5.8% 2.3%
Benelux 642 624 576 - 7.6% - 10.3% - 7.7% - 10.4%
Rest of Europe, Asia & Latin America
1 219 1 320 1 348 2.1% 10.6% 0.4% 6.8%
TOTAL 4 756 4 937 5 150 4.3% 8.3% 1.6% 2.3%
Benelux
North America
UK &
Ireland
France
Rest of Europe,
Asia & Latin
America
20.2%
20.8%
11.2%
21.7%
26.1%
H1 2012 Revenues by Main Geography

2012 Half Year Results
24 Copyright © Capgemini 2012. All Rights Reserved
At constant rates and perimeter
H1 2012 Growth by Discipline
5.2%
39.3% 40.3%
15.2%
Consulting
Services
Technology
Services Local
Professional
Services
Outsourcing
Services
Sequential Year on year
H1 12 / H2 11 H1 12 / H1 11
Consulting Services 6.3% -0.5%
Technology Services 3.3% 4.8%
Local Professional Services
2.8% 0.6%
CS / TS / LPS 3.4% 3.3%
Outsourcing Services - 1.0% 0.9%
TOTAL GROUP 1.6% 2.3%
5.3%
39.8% 39.4%
15.5%
Consulting
Services
Technology
Services Local
Professional
Services
Outsourcing
Services
H1 2012
H1 2011

2012 Half Year Results
25 Copyright © Capgemini 2012. All Rights Reserved
50
60
70
80
90
8284 84 83
8283
7978
7980 80 80
656867
7168 67
Consulting Services Technology Services Local Professional Services
At constant perimeter
Q1 Q2 Q2 Q4
2011 2012
Q3 Q1
(%)
Q1 Q2 Q2 Q4
2011 2012
Q3 Q1 Q1 Q2 Q2 Q4
2011 2012
Q3 Q1
Utilization Rates by Business

2012 Half Year Results
26 Copyright © Capgemini 2012. All Rights Reserved
Charge-out Rates
Year on year
Variation
Q1 11 Q2 11 Q3 11 Q4 11 Q1 12 Q2 12
Consulting Services
Local Professional Services
Technology Services
Weighted average
0.4%
0.1%
- 2.2%
- 1.8 %
-0.7%
1.1%
- 3.0%
- 1.6%
0.8%
1.3%
- 3.7 %
- 1.9%
- 1.3%
1.9%
- 1.0%
0.0%
- 1.6%
2.2%
- 1.0%
- 0.1%
- 1.6%
1.1%
- 1.1%
- 0.5%
Pricing Evolution (onshore)

2012 Half Year Results
27 Copyright © Capgemini 2012. All Rights Reserved
Headcount as of Dec. 31, 2011 119 707
Recruits (*) 14 570
Acquisitions / Outsourcing Deals 104
Disposals - 65
Layoffs - 2 993
Leavers - 10 297
Headcount as of June 30, 2012 121 026
(*) out of which 1 571 in Sogeti (excl. India)
5 625 in India
1 899 in other offshore centers
52% offshore
Attrition YTD June
2011
Dec
2011
June
2012 YoY Var.
Consulting services 21.3% 20.5% 17.1% - 4.2 pts
Technology services 17.0% 18.4% 16.7% - 0.3 pt
Local Professional
services 17.3% 18.0% 16.3% - 1.0 pt
Outsourcing services 17.7% 16.6% 17.0% - 0.7 pt
Total Business 17.7% 18.2% 17.0% - 0.7 pt
Headcount Evolution

2012 Half Year Results
28 Copyright © Capgemini 2012. All Rights Reserved
“Pyramid Effect” Improving
ONSHORE (cost of 2 899 M€ in H1 2012)
OFFSHORE (cost of 274 M€ in H1 2012)
in % Year on Year H1 2010 H2 2010 H1 2011 H2 2011 H1 2012
Salary increase 1.3 1.5 2.7 3.3 2.4 Average remuneration increase 2 3.6 2.8 0.4 -1
Pyramid effect 0.7 2.1 0.1 -2.9 -3.4
Continuous
effect in
H1 2012
Favorable pyramid effect continues into H1 2012, group average remuneration is down 3.1% in H1 2012
In % Year on Year H1 2010 H2 2010 H1 2011 H2 2011 H1 2012
Salary increase 6.6 7.8 7.4 9.2 7.1 Average remuneration increase 1.7 7.3 5 0.8 3.1
Pyramid effect -4.9 -0.5 -2.4 -8.4 -4

2012 Half Year Results
29 Copyright © Capgemini 2012. All Rights Reserved
Evolution of Group Remuneration Cost from H1 2011 to H1 2012
At current rates
& perimeter
At constant rates
& perimeter
Group average remuneration costs evolution - 1.2% - 3.1%
2012 Average salary increase onshore : 2.4%
2012 Average salary increase offshore : 7.1%

2012 Half Year Results
30 Copyright © Capgemini 2012. All Rights Reserved
H1 2011 H2 2011 H1 2012
Revenues 4 756 4 937 5 150
Personnel costs - 2 958 - 2 858 - 3 173
% of Revenues 62.2% 57.9% 61.6%
Purchases and subcontracting expenses - 1 052 - 1 179 - 1 129
% of Revenues 22.1% 23.9% 21.9%
Travel expenses - 192 - 199 - 208
% of Revenues 4.0% 4.0% 4.0%
Rent and local taxes - 158 - 166 - 162
% of Revenues 3.3% 3.4% 3.2%
Depreciation, amortization, provisions and proceeds from asset disposal - 107 - 111 - 150
% of Revenues 2.3% 2.2% 2.9%
Total operating expenses - 4 467 - 4 513 - 4 822
% of Revenues 93.9% 91.4% 93.6%
Operating margin 289 424 328
% of Revenues 6.1% 8.6% 6.4%
Operating Margin before amortization of intangible assets acquired through business combinations
301 437 347
% of Revenues 6.3% 8.9% 6.7%
77.3% Cost of
services
rendered
Operating
Margin
Selling
8.6% 8.0% 6.1%
G&A
At current rates and perimeter (in M€)
Operating Margin Analysis
H1 2011
Operating
Margin 7.9% 7.8%
77.9%
6.4%
G&A
Cost of
services
rendered
Selling
H1 2012

2012 Half Year Results
31 Copyright © Capgemini 2012. All Rights Reserved
H1 2011 H2 2011 H1 2012
Consulting Services
Technology Services
Local Professional Services
CS / TS / LPS
Outsourcing Services
11.8%
5.8%
9.9%
7.4%
5.7%
12.2%
7.7%
12.0%
9.1%
9.6%
10.8%
6.7%
9.5%
7.7%
5.9%
Total Operations (*) 6.8% 9.3% 7.0%
GROUP 6.1% 8.6% 6.4%
At current rates and perimeter
(*) before headquarters’ expenses
Operating Margin by Discipline
2012 Half Year Results
32 Copyright © Capgemini 2012. All Rights Reserved
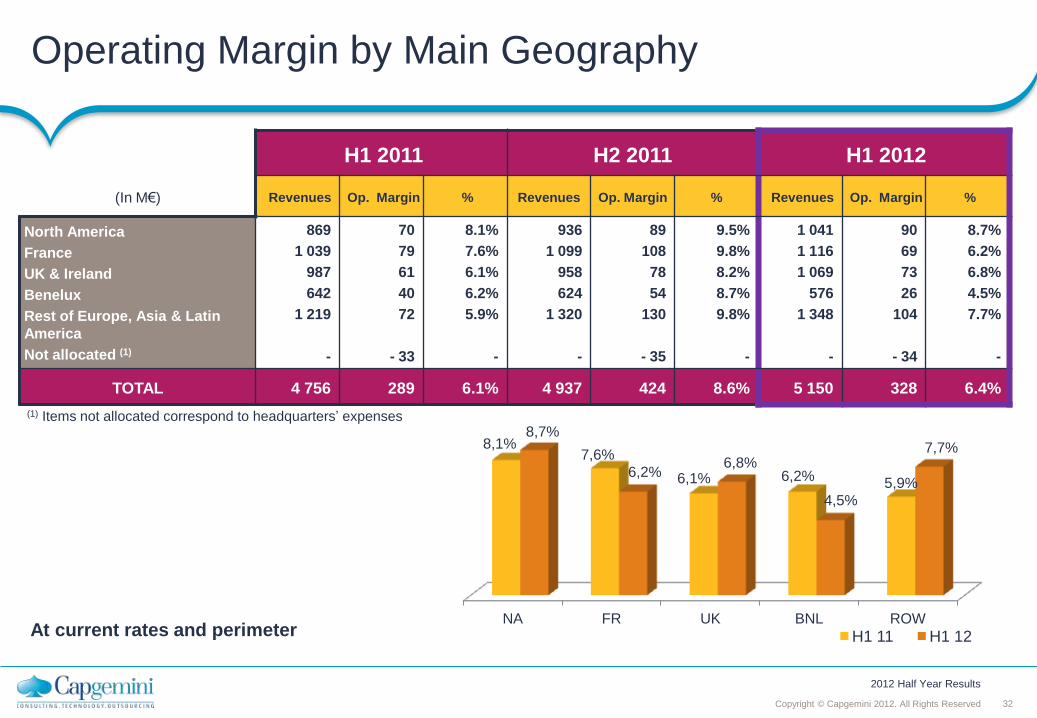
H1 2011 H2 2011 H1 2012
(In M€) Revenues Op. Margin % Revenues Op. Margin % Revenues Op. Margin %
North America
France
UK & Ireland
Benelux
Rest of Europe, Asia & Latin
America
Not allocated (1)
869
1 039
987
642
1 219
-
70
79
61
40
72
- 33
8.1%
7.6%
6.1%
6.2%
5.9%
-
936
1 099
958
624
1 320
-
89
108
78
54
130
- 35
9.5%
9.8%
8.2%
8.7%
9.8%
-
1 041
1 116
1 069
576
1 348
-
90
69
73
26
104
- 34
8.7%
6.2%
6.8%
4.5%
7.7%
-
TOTAL 4 756 289 6.1% 4 937 424 8.6% 5 150 328 6.4%
At current rates and perimeter
(1) Items not allocated correspond to headquarters’ expenses
Operating Margin by Main Geography
NA FR UK BNL ROW
8,1% 7,6%
6,1% 6,2% 5,9%
8,7%
6,2% 6,8%
4,5%
7,7%
H1 11 H1 12

2012 Half Year Results
33 Copyright © Capgemini 2012. All Rights Reserved
(in M€) H1 2011 H1 2012
Operating Margin 289 328
Other operating expenses - 49 - 91
of which Restructuring costs
Stock options and performance shares
-32 - 9
-75 - 7
Net financial expense - 51 - 49
Income tax expense - 70 - 55
Share of profit of associates - - 1
Non-controlling interests 8 11
Net Profit (Group share) 127 143
Normalized Net Profit (Group share) (*) 158 211
Earnings per share as of June 30 (non diluted) – in €
Normalized Net Profit per share at June 30 (non diluted) – in €
0.82
1.03
0.92
1.37
Net Profit Analysis
(*) Normalized net profit (Group share) equal Net profit (Group share) corrected for the impact of restructurings costs and amortization of
intangible assets acquired through business combination, net of tax.

2012 Half Year Results
34 Copyright © Capgemini 2012. All Rights Reserved
(in M€) H1 2011 H1 2012
Interest on bonds (29) (32)
Other interest expenses (10) (9)
Income from cash and cash equivalents 13 12
Net finance costs (26) (29)
Other financial income Other financial expenses
22 (47)
30 (50)
Net financial expense (51) (49)
Net Financial Expense

2012 Half Year Results
35 Copyright © Capgemini 2012. All Rights Reserved
(in M€) H1 2011 H1 2012
Current income tax (45) (56)
Tax payable on profit (23) (32)
Tax not based on taxable income (22) (24)
Deferred income tax (25) 1
Tax losses
• Net utilization of deferred tax assets on tax losses (30) (24)
France (26) (19)
Other regions (4) (5)
• Net reassessment of deferred tax assets on tax losses 18 13
Temporary differences and reassessments of deferred tax assets (13) 12
INCOME TAX EXPENSE (70) (55)
Effective tax rate 37.2% 29.6%
Income Tax Expense
2012 Half Year Results
36 Copyright © Capgemini 2012. All Rights Reserved
H1 2012
H1 2011 (in M€) Intangible
assets
Property, plant &
equipment Total
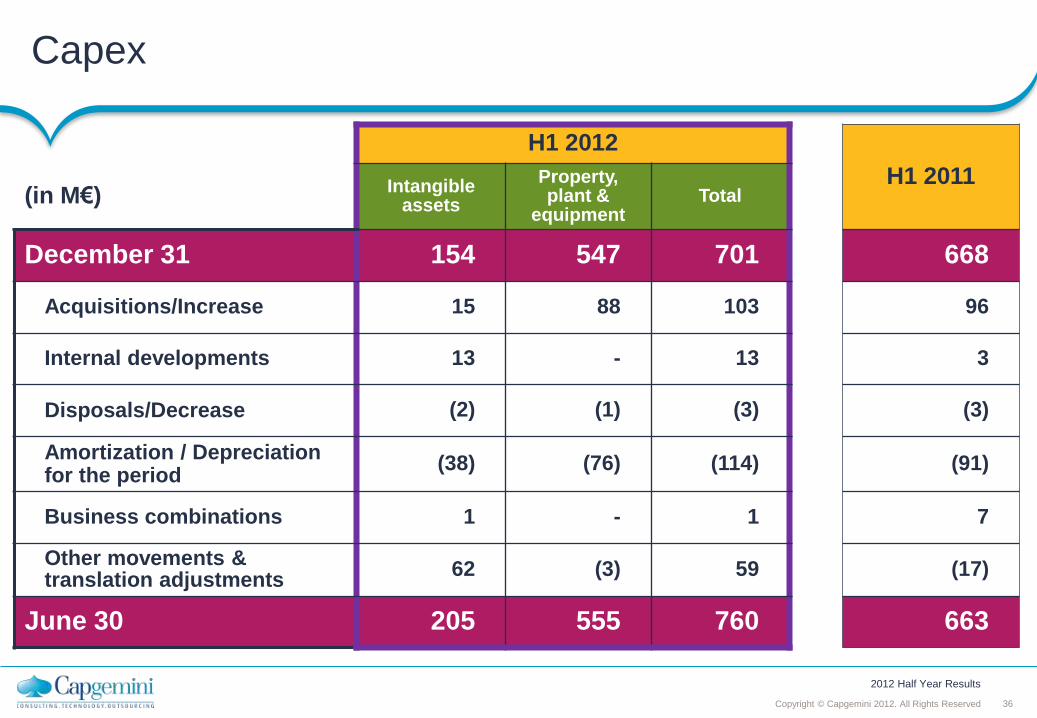
December 31 154 547 701 668
Acquisitions/Increase 15 88 103 96
Internal developments 13 - 13 3
Disposals/Decrease (2) (1) (3) (3)
Amortization / Depreciation for the period
(38) (76) (114) (91)
Business combinations 1 - 1 7
Other movements & translation adjustments
62 (3) 59 (17)
June 30 205 555 760 663
Capex

2012 Half Year Results
37 Copyright © Capgemini 2012. All Rights Reserved
289 164 77 -329 -39 -42 -607 -21 -68 -151 H1
2011
Compa-
rable
-104
Net Cash Evolution
-31 -32
Cash net of Debt
Opening
YtD Operat. margin
YtD Bonus
provision
Amorti- zation and
provisions
Bonus Payment For last
year
Payment of
Restruc- turing
Tax paid
Other working capital
evolution
Acqui- sitions
Cash Net of Debt Closing
Net interest
CAPEX, Net of
disposals
Increase in
Capital from minority
interests
Exchange rates diff.
Cash net of debt bef. investing
and financial activities
(in M€)
Dividends &
Treasury shares
Debt increase & others
1 063
68 454
328
182
84
336
72
84
289
21
101
145
50 149
17
-187M€ cash flows from operating
activities vs -487M€ in H1 2011
-309M€ free cash flows vs -576M€ in H1 2011 4 2
0
27

2012 Half Year Results
38 Copyright © Capgemini 2012. All Rights Reserved
Organic Free cash flow generation
Back to normal seasonality of FCF in H1 2012
-309 M€ in H1 2012,
vs -576 M€ in H1 2011,
and -319 M€ in H1 2010
-800
-600
-400
-200
0
200
400
600
800
1000
H1 2010 H2 2010 H1 2011 H2 2011 H1 2012

2012 Half Year Results
39 Copyright © Capgemini 2012. All Rights Reserved
One of the best revenue into collection conversion in recent years. DSO has been improving following action plans launched in H2 2011… without penalizing further our suppliers
H1 2008 H1 2009 H1 2010 H1 2011 H1 2012
Revenue
Conversion 110.7% 114.2% 106.3% 107.4% 112.8%
DSO 73 70 79 80 76
Supplier days 108 103 120 111 105

2012 Half Year Results
40 Copyright © Capgemini 2012. All Rights Reserved
Back up

2012 Half Year Results
41 Copyright © Capgemini 2012. All Rights Reserved
2 350
2 4062 378
2 559 2 565 2 585
1 800
2 000
2 200
2 400
2 600
Q1 11 Q2 11 Q3 11 Q4 11 Q1 12 Q2 12
Q1 2011 Q2 2011 H1 2011 Q3 2011 Q4 2011 H2 2011 FY 2011 Q1 2012 Q2 2012 H1 2012
In M€ (Published) 2 350 2 406 4 756 2 378 2 559 4 937 9 693 2 565 2 585 5 150
Sequential Current Growth 2.4 % - 1.2 % 7.6 % 0.3 % 0.8 % 4.3 %
Sequential Organic Growth 4.1 % - 4.3 % 6.2 % - 1.3 % 0.2 % 1.6 %
Year-on-Year Current Growth 9.2 % 7.4 % 8.3 %
Year-on-Year Organic Growth 4.3 % 0.4% 2.3%
(in M€)
Revenues Quarterly Evolution

2012 Half Year Results
42 Copyright © Capgemini 2012. All Rights Reserved
Current Current Organic
Q2 2011 Q1 2012 Q2 2012
Sequential Year on year Sequential Year on year
(in M€) Q2 12/
Q1 12
Q2 12/
Q2 11
Q2 12/
Q1 12
Q2 12/
Q2 11
North America 445 505 536 6.1% 20.2% 4.3% 7.2%
Europe and Asia
of which : 1 961 2 060 2 049 - 0.5% 4.5% - 0.9% - 1.2%
UK & Ireland 508 510 559 9.5% 9.9% 6.3% 0.9%
France 515 578 538 - 7.1% 4.5% - 7.1% - 4.3%
Benelux 319 298 278 - 6.9% - 12.9% - 6.9% - 13.0%
Southern Europe & Latin America
236 246 241 - 1.5% 2.2% 1.1% - 2.7%
Nordic 161 181 182 0.9% 13.7% 1.2% 11.8%
Germany & Central Europe
155 169 163 - 3.4% 5.0% -3.4% 4.8%
Asia Pacific 67 78 88 13.2% 32.5% 14.7% 21.5%
TOTAL 2 406 2 565 2 585 0.8% 7.4% 0.2% 0.4%
Q2 2012 Revenues by Geography

2012 Half Year Results
43 Copyright © Capgemini 2012. All Rights Reserved
Current Current Organic
H1 2011 H2 2011 H1 2012
Sequential Year on year Sequential Year on year
(in M€) H1 12 /
H2 11
H1 12 /
H1 11
H1 12 /
H2 11
H1 12 /
H1 11
North America 869 936 1 041 11.3% 19.7% 4.5% 9.7%
Europe and Asia
of which : 3 887 4 001 4 109 2.7% 5.7% 0.9% 0.6%
France 1 039 1 099 1 116 1.6% 7.4% 2.0% - 1.6%
UK & Ireland 987 958 1 069 11.6% 8.3% 5.8% 2.3%
Benelux 642 624 576 - 7.6% -10.3% - 7.7% - 10.4%
Southern Europe & Latin America
461 539 487 -9.7% 5.6% - 10.9% - 0.1%
Nordic 319 316 363 14.7% 14.0% 12.5% 12.4%
Germany & Central Europe
312 314 332 5.7% 6.2% 5.5% 5.9%
Asia Pacific 127 151 166 10.0% 31.0% 4.6% 19.8%
TOTAL 4 756 4 937 5 150 4.3% 8.3% 1.6% 2.3%
H1 2012 Revenues by Geography

2012 Half Year Results
44 Copyright © Capgemini 2012. All Rights Reserved
Q2 Revenues by Geography
At constant rates and perimeter
Q2 2011
6,3%12,4%
6,0%
21,5%
19,5%
21,8%
2,8%
9,7%
Benelux
North
America
UK
& Ireland
Nordic
Germany
& Central
Europe
France
Southern
Europe
& Latin
America
Asia
Pacific
7,1%10,7%
6,3%
21,6%
20,8%
20,8%
3,4%
9,3%
Q2 2012
Benelux
North
America
UK
& Ireland
Nordic
Germany
& Central
Europe
France
Southern
Europe
& Latin
America
Asia
Pacific

2012 Half Year Results
45 Copyright © Capgemini 2012. All Rights Reserved
H1 Revenues by Geography
7,1%11,2%
6,3%
20,8%
20,2%
21,7%
3,2%
9,5%
At constant rates and perimeter
Benelux
North
America
UK
& Ireland
Nordic
Germany
& Central
Europe
France
Southern
Europe
& Latin
America
Asia
Pacific
H1 2011
Benelux
North
America
UK
& Ireland
Nordic
Germany
& Central
Europe
France
Southern
Europe
& Latin
America
Asia
Pacific
6,4%12,8%
6,1%
20,8%
18,9%
22,5%
2,8%
9,7%
H1 2012

2012 Half Year Results
46 Copyright © Capgemini 2012. All Rights Reserved
H1 Revenues by Discipline
5,2%
40,3%39,3%
15,2%
At constant rates and perimeter
H1 2011
39,4%
15,5%
39,8%
5,3%
Consulting
Services
Technology
Services
Local
Professional
Services
Outsourcing
Services H1 2012
Consulting
Services
Technology
Services Local
Professional
Services
Outsourcing
Services

2012 Half Year Results
47 Copyright © Capgemini 2012. All Rights Reserved
10.9%
19.0%
6.2%
23.9%
9.0%
13.7%
Energy, Utilities &
Chemicals
Financial
Services
Others
Public Sector
Telecom,
Media &
Entertainment
Customer products,
retail, distribution &
transportation
H1 Revenues by Sector
At budget rates and constant perimeter
10.5%
20.6%
4.6%
24.7% 9.2%
17.6%
Energy, Utilities &
Chemicals
Financial
Services
Others
Public Sector
Telecom,
Media &
Entertainment
12.8%
17.3% Manufacturing
Customer products,
retail, distribution &
transportation
Manufacturing
H1 2011
H1 2012

2012 Half Year Results
48 Copyright © Capgemini 2012. All Rights Reserved
June 11 Sept 11 Dec 11 Mar 12 June 12 June 12 /
June 11
June 12 /
Dec. 11
Consulting Services 3 333 3 410 3 431 3 229 3 164 - 5.1% - 7.8%
Technology Services 52 096 53 050 54 304 53 441 53 498 2.7% - 1.5%
Outsourcing Services 39 252 41 156 42 124 44 008 44 524 13.4% 5.7%
Local Professional Services 19 295 19 511 19 553 19 575 19 549 1.3% 0.0%
TOTAL GROUP* 114 274 117 428 119 707 120 542 121 026 5.9% 1.1%
* including not classified headcount
Evolution of Headcount by Business

2012 Half Year Results
49 Copyright © Capgemini 2012. All Rights Reserved
Group Headcount by Geography
UK & IRELAND :
• Opening: 8 977
• Closing: 8 985
• Change in Person: +8
• Change in %: +0.1%
Southern Europe & Latin America:
• Opening: 16 499
• Closing: 16 603
• Change in Person: +104
• Change in %: +0.6%
FRANCE :
• Opening: 21 738
• Closing: 21 529
• Change in Person: -209
• Change in %: -1.0%
BENELUX :
• Opening: 10 391
• Closing: 9 832
• Change in Person: -559
• Change in %: -5.4%
ASIA PACIFIC :
• Opening: 39 097
• Closing: 40 478
• Change in Person: +1 381
• Change in %: +3.5%
CENTRAL EUROPE :
• Opening: 8 962
• Closing: 9 295
• Change in Person: +333
• Change in %: +3.7%
TOTAL GROUP:
Opening: 119 707 Closing: 121 026 D in P: +1 319 D in %: +1.1%
NORDIC :
• Opening: 4 538
• Closing: 4 518
• Change in Person: -20
• Change in %: -0.4%
NORTH AMERICA :
• Opening: 9 505
• Closing: 9 786
• Change in Person: +281
• Change in %: +3.0%

2012 Half Year Results
50 Copyright © Capgemini 2012. All Rights Reserved
H1 2011 H2 2011 H1 2012
(in M€) Revenues Op.
Margin % Revenues
Op.
Margin % Revenues
Op.
Margin %
North America 869 70 8.1% 936 89 9.5% 1 041 90 8.7%
France 1 039 79 7.6% 1 099 108 9.8% 1 116 69 6.2%
UK & Ireland 987 61 6.1% 958 78 8.2% 1 069 73 6.8%
Benelux 642 40 6.2% 624 54 8.7% 576 26 4.5%
Southern Europe & Latin America
461 3 0.7% 539 27 4.9% 487 5 1.0%
Nordic 319 19 5.8% 316 27 8.6% 363 26 7.2%
Germany & Central Europe
312 19 6.0% 314 24 7.7% 332 30 8.9%
Asia Pacific 127 31 N/A 151 52 N/A 166 43 N/A
Not allocated (1) - - 33 - - -35 - - -34 -
TOTAL 4 756 289 6.1% 4 937 424 8.6% 5 150 328 6.4%
(1) Items not allocated correspond to headquarters’ expenses
At current rates and perimeter
Operating Margin by Geography

2012 Half Year Results
51 Copyright © Capgemini 2012. All Rights Reserved
Operating Margin Analysis by Destination
(in M€) H1 2011 H2 2011 H1 2012
Revenues 4 756 4 937 5 150
Cost of services rendered - 3 679 - 3 746 - 4 011
% of Revenues 77.3% 75.9% 77.9%
Gross Margin 1 077 1 191 1 139
% of Revenues 22.7% 24.1% 22.1%
Selling Expenses - 378 - 368 - 403
% of Revenues 8.0% 7.5 % 7.8%
General & Administrative Expenses - 410 - 399 - 408
% of Revenues 8.6% 8.1% 7.9%
Operating Margin 289 424 328
% of Revenues 6.1% 8.6% 6.4%
At current rates and perimeter

2012 Half Year Results
52 Copyright © Capgemini 2012. All Rights Reserved
(in M€) FY 2010 H1 2011 H2 2011 FY 2011 H1 2012
Restructuring costs Of which :
(71) (32) (49) (81) (75)
Workforce reduction (44) (29) (45) (74) (69)
Real estate assets streamlining (19) (1) (3) (4) (5)
Rightshoring (8) (2) (1) (3) (1)
Integration costs related to acquired companies (11) (3) (6) (9) (4)
Acquisition-related costs (4) (4) (3) (7) (1)
Expenses relating to share subscriptions, share grants and stock options
(16) (9) (8) (17) (7)
Other operating income 6 - - - -
Other operating expense (2) (1) (3) (4) (4)
Other operating income and expense (98) (49) (69) (118) (91)
Other Operating Income and Expense

2012 Half Year Results
53 Copyright © Capgemini 2012. All Rights Reserved
(In M€) H1 2011 H2 2011 H1 2012
Profit for the period Depreciation, amortization and impairment of fixed assets Net charges to provisions Gains and losses on disposals of assets Net finance costs Income tax expense Other non-cash items
119 92
(15) 7
26 70
4
270 96
(18) 6
39 31 16
132 114 (16)
2 29 55 23
Cash flows from operations before net finance costs and income tax Income tax paid Change in restructuring debt Changes in operating working capital
303
(42)
(7) (741)
440
(62)
6 452
339
(84)
5 (447)
Operating cash flows Capital expenditure (net of proceeds) Net investments Dividends paid Net proceeds/payments relating to treasury shares transactions Translation, perimeter changes & other
(487) (68)
(104) (154)
3 (84)
836 (87)
(450) -
(10) (4)
(187) (101)
(4) (154)
5 14
Change in net cash and cash equivalents (894) 285 (427)
Opening net cash and cash equivalents 1 063 169 454
Closing net cash and cash equivalents 169 454 27
Net Cash Evolution

2012 Half Year Results
54 Copyright © Capgemini 2012. All Rights Reserved
ASSETS Dec. 31, 2011
June 30, 2012 EQUITY & LIABILITIES Dec. 31,
2011 June 30,
2012
Equity (attributable to owners of the company) Non-controlling interests
4 256
27
4 072
39
Goodwill 3 768 3 762 Total equity 4 283 4 111
Intangible assets 154 205 Long-term borrowings 1 135 1 133
Property, plant & equipment 547 555 Deferred taxes 183 207
Deferred taxes 1 020 1 096 Provisions for pensions and other post-employment benefits 1 099 1 362
Other non-current assets 119 111 Non-current provisions 15 19
Other non-current liabilities 322 338
Total non-current assets 5 608 5 729 Total non-current liabilities 2 754 3 059
Accounts & notes receivable 2 685 2 959 Short-term borrowings and bank overdrafts 702 219
Income tax receivable 55 70 Accounts and notes payable 2 340 2 214
Other receivables 370 400 Advances from customers and billed in advance 661 664
Cash management assets 73 74 Current provisions 48 49
Cash and cash equivalents 2 223 1 310 Income tax payables 89 70
Other payables 137 156
Total current assets 5 406 4 813 Total current liabilities 3 977 3 372
Total Assets 11 014 10 542 Total Equity & Liabilities 11 014 10 542
(in M€)
Balance Sheet

2012 Half Year Results
55 Copyright © Capgemini 2012. All Rights Reserved
(in M€) Equity (attributable
to owners of the Company)
Non-controlling interests
Total Equity
Total equity as of January 1, 2012 4 256 27 4 283
Dividends paid out for 2011 (154) - (154)
Valuation of stock options and performance shares grants 7 - 7
Treasury shares 5 - 5
Put CPM-Braxis and change in percentage of interest (30) 25 (5)
Income and expenses recognized in equity of which :
Actuarial gains & losses on defined benefit plans Remeasurement of hedging derivatives Deferred tax related to items recognized in equity Exchange differences on translating foreign operations
(155)
(249) (10)
64 40
(2)
0 0 0
(2)
(157)
(249) (10)
64 38
Profit for the period 143 (11) 132
Total equity as of June 30, 2012 4 072 39 4 111
Equity

2012 Half Year Results
56 Copyright © Capgemini 2012. All Rights Reserved
Commitments given
• Non cancelable leases (mainly offices, vehicles, computers)
€ 823M
• Other commitments:
• Covenants on OCEANE bonds and syndicated credit facilities Compliant
• Limited financial guarantees granted to customers € 925M
• Bank guarantees granted to customers € 72M
• Other commitments € 104M
• Parent performance and/or financial guarantees provided in various large clients contracts
Off Balance Sheet Commitments as of June 30, 2012:
Off Balance Sheet Commitments

2012 Half Year Results
57 Copyright © Capgemini 2012. All Rights Reserved
Charge-out Rates (onshore)
Consulting Services Technology Services onshore
Local Professional Services
(in €)
Q1 Q2 Q2 Q4
2011 2012
Q3 Q1
At constant perimeter Q1 Q2 Q2 Q4
2011 2012
Q3 Q1
Q1 Q2 Q2 Q4
2011 2012
Q3 Q1
615629
600
631
609
622
500
600
700
479
487485
498490 492
300
400
500
1169 11791153
11861149 1160
300
400
500
600
700
800
900
1000
1100
1200
1300

2012 Half Year Results
58 Copyright © Capgemini 2012. All Rights Reserved
Offshore Leverage
0%
10%
20%
30%
40%
50%
60%
70%
80%
90%
100%
CS APPS1 APPS2 Infra Sogeti BPO Group Total (*)
5,0%
61,4%
20,3%
43,7%
11,1%
90,5%
38,6%
6,5%
60,8%
21,4%
45,6%
13,2%
93,3%
39,7%
January 12 June 12
Offshore penetration per SBU (billable headcount)
(*) Group Total includes Emerging Markets

2012 Half Year Results
59 Copyright © Capgemini 2012. All Rights Reserved
Labor Cost Evolution Onshore
H1 11 Salary increase
Pyramid effect
FX impact Perimeter Volumes Others H1 12
2 899
84 - 2
65
2 708
- 91 68
67

2012 Half Year Results
60 Copyright © Capgemini 2012. All Rights Reserved
Labor Cost Evolution Offshore
H1 11 Salary increase
Pyramid effect FX impact Volumes Others H1 12
18
250
- 10
- 14
30
274
0

The information contained in this presentation is proprietary.
© 2012 Capgemini. All rights reserved.
www.capgemini.com
About Capgemini
With more than 120,000 people in 40 countries, Capgemini is one
of the world's foremost providers of consulting, technology and
outsourcing services. The Group reported 2011 global revenues
of EUR 9.7 billion.
Together with its clients, Capgemini creates and delivers
business and technology solutions that fit their needs and drive
the results they want. A deeply multicultural organization,
Capgemini has developed its own way of working, the
Collaborative Business ExperienceTM, and draws on Rightshore ®,
its worldwide delivery model.
Rightshore® is a trademark belonging to Capgemini