h2s loss through nalophan bags: contributions of...
TRANSCRIPT

Research ArticleH
2S Loss through Nalophanƒ Bags: Contributions of
Adsorption and Diffusion
Lidia Eusebio, Laura Capelli, and Selena Sironi
Department of Chemistry, Materials and Chemical Engineering “Giulio Natta”, Politecnico di Milano,Piazza Leonardo da Vinci 32, 20133 Milano, Italy
Correspondence should be addressed to Selena Sironi; [email protected]
Received 8 March 2017; Revised 18 April 2017; Accepted 23 April 2017; Published 27 June 2017
Academic Editor: Ki-Hyun Kim
Copyright © 2017 Lidia Eusebio et al. This is an open access article distributed under the Creative Commons Attribution License,which permits unrestricted use, distribution, and reproduction in any medium, provided the original work is properly cited.
Hydrogen-sulfide (H2S) is a molecule of small dimensions typically present in the odor emissions from different plants. TheEuropean Standard EN 13725:2003 set amaximum storage time allowed of 30 hours, during which the sampling bag has tomaintainthe mixture of odorants with minimal changes. This study investigates the H2S losses through Nalophan bags and it shows thatnonnegligible losses of H2S can be observed. The percent H2S loss after 30 hrs with respect to the initial concentration is equal to33% ± 3% at a relative humidity of 20% and equal to 22% ± 1% at a relative humidity of 60%.The average quantity of adsorbed H2Sat 30 h is equal to 2.17 105 gH2S/gNalophan at a storage humidity of 20% and equal to 1.79 105 gH2S/gNalophan at a storage humidity of 60%.The diffusion coefficients of H2S through Nalophan, for these two humidity conditions tested, are comparable (i.e., 7.5 10−12m2/secat 20% humidity and 6.6 10−12m2/sec at 60% humidity).
1. Introduction
Although odors do not have a direct effect on human health,they are considered one of the main causes of discomfortfor the population living in areas impacted by odor emis-sions. Nowadays, olfactory pollution has become a seriousenvironmental concern because it may be the cause of phys-iological stress to the population [1]. Concerning olfactorynuisance, different European countries have recently adoptedspecific regulations. The standard methodology for odorconcentration measurement is a sensorial technique, that is,dynamic olfactometry [2], which is commonly applied fortesting odors for environmental management purposes [3].This technique is based on the sensation caused by an odoroussample directly on a panel of human assessors [4].
Performing olfactometric analyses on site presents somedifficulties. To overcome these problems, the odorous pol-lutants are collected and stored in appropriate containersuntil they are analyzed in an olfactometric laboratory [4–6]. In order to regulate the quality of the olfactometricanalysis, the European Standard on dynamic olfactometry [2]defines the requirements for the materials used for samplingequipment.The requirements determined by the EN13725 for
the olfactometry materials are as follows: being odorless andbeing able to minimize the physical or chemical interactionbetween sample components and sampling materials andhaving low permeability in order to minimize sample lossescaused by diffusion and smooth surface.
The materials allowed by EN13725 for sample containers(i.e., bags) are as follows: tetrafluoroethylene hexafluoropro-pylene copolymer (FEP); Tedlar� (polyvinyl fluoride, PVF),and Nalophan (polyethylene terephthalate, PET). Moreover,European Standard set a maximum storage time allowed,during which the sampling bag has to maintain the mixtureof odorants with minimal changes.
Since the publication of the Standard in 2003, severalstudies have been carried out in order to test the character-istics of the materials listed in the EN 13725 [2] and to verifytheir suitability for olfactometric measurements. In Table 1literature studies are reported investigating losses of odorousmolecules through sampling bags [1, 5–36].
More in detail, in Table 1, beside the author and year, thepolymer film studied, the thickness of the film, the pollutanttaken into account and the detection system adopted arereported.
Hindawie Scientific World JournalVolume 2017, Article ID 9690704, 15 pageshttps://doi.org/10.1155/2017/9690704

2 The Scientific World Journal
Table1:Schemeo
fthe
studies
related
tothep
ollutant
lossthroug
hsamplingbag.
Reference
number
Author
and
year
Polymeric
Film
Thickn
ess
[𝜇m]
Chem
icalcompo
und
Detectio
nSyste
m
[1]
Sironi
etal.,
2014
Nalop
han
20NH3
GC
[5]
Y.-H
.Kim
andK.-H
.Kim,2012
PEA
n.d.
Benzene,toluene,sty
rene,p-xylene,methylethylketone,m
ethylisobu
tylketon
e,iso
butylalcoh
ol,butylacetate,acetaldehyde,propion
aldehyde,butyraldehyde,
isovaleraldehyde,valeraldehyde
GC
MS
[6]
Laor
etal.,
2010
Tedlar
n.d.
Odo
rsem
itted
from
mun
icipalsewage,aeratio
nbasin
,sludge,livestock
manure,
coffee
DO
Nalop
han
20
[7]
Akd
enizet
al.,2011
Tedlar
n.d.
NH3,C
H4,N2O,H2S,totalsulfurd
ioxide
pulse
dflu
orescencea
nalyzer,
chem
iluminescencea
nalyzer,GC
IRFlexFo
iln.d.
[8]
Bakh
tari,
2014
Nalop
han
50Be
nzene,ozon
e,H2S
DO
Tedlar
50Teflo
n50
[9]
Begh
iand
Guillo
t,2006
Tedlar
50Methano
l,ethano
l,aceton
e,n-prop
anol,n
-hexane,dichloroethane,tric
hloroethane,
methylisobu
tylketon
e,toluene,bu
tylacetate
GC
Teflo
n50
FlexFo
il75
[10]
Begh
iand
Guillo
t,2008
Nalop
han
20Ac
eton
e,n-prop
anol,ethanol,n
-hexane,1,2
-dichloroethane,trichloroethane,
methylisobu
tylketon
e,toluene,bu
tylacetate,ethylbenzene
GC
Tedlar
50
[11]
Boeker
etal.,
2014
Nalop
han
n.d.
Butylamine,ethylamine,carbon
disulfide,dim
ethylsulfid
e,bu
tylacetate,ethyl
acetate,n-bu
tyrateacetate,dichloroethane,chloroform,dichlorom
ethane,
2-heptanon
e,methylisobu
tylketon
e,ethylm
ethylketon
e,aceton
e,n-hexylacetate,
𝛼-ion
one,lim
onene,𝛼-p
inene,1,2
,3,4-te
traidron
aphtene,ethylbenzene,toluene,
skatole,indo
le,methano
l,p-cresol,pheno
l,n-hexano
l,n-bu
tano
l,ethano
l,𝛼-h
exyl
cinn
amaldehyde,furfural,hexanal
GC
MS
NaloSafe
n.d.
Nalob
arn.d.
Tedlar
n.d.
[12]
Bokowa,2012
Tedlar
n.d.
2-Methylbutane,pentane,2,2-dimethylbutane,2-methylpentane,cyclopentane,
3-methylpentane,1-hexene,hexane,2,4-dim
ethylpentane,m
ethylcyclopentane,
3-methyl-1-hexene,3-methyl-1,3-pentadiene,2-methylhexane,2,3-dimethyl
pentane,cyclo
hexane,3-m
ethylhexane,benzene,cyclo
hexene,heptane,
2,5-dimethylhexane,methylcyclohexane,ethylcyclo
pentane,2-methylpentane,
3-methylpentane,2,3,5-tr
imetilesano
,t-1,4-dim
ethylcyclohexane,toluene,octane,
1,1-dim
ethylcyclohexane,t-1,2-dim
ethylhexane,c-1,4
-dim
ethylcyclohexane,propyl
cyclo
pentane,c-1,2-dimethylcyclohexane,2
+4-methyloctane,3-methyloctane,
ethylbenzene,n
onane,m
+p-xylene,3,7-dimethyl-1-octene,o-xylene,cum
ene,
prop
ylbenzene,dean,1,3,5-tr
imethylbenzene,1,2,4-tr
imethylbenzene,p-cym
ene,
1,2,3-tr
imethylbenzene,und
ecane,do
decane,trid
ecane,tetradecane
GC
MS

The Scientific World Journal 3
Table1:Con
tinued.
Reference
number
Author
and
year
Polymeric
Film
Thickn
ess
[𝜇m]
Chem
icalcompo
und
Detectio
nSyste
m
[13]
Cario
uand
Guillo
t,2006
Tedlar
502-Prop
anolo,2-bu
tano
ne,toluene
GC
[14]
Eusebioetal.,
2016
Nalop
han
20𝜇m
H2S
specificH2Ssensors
[15]
Guillo
tand
Begh
i,2008
Nalop
han
20
H2S,H2O
GC
Tedlar,
50Teflo
n,50
FlexFo
il75
[16]
Hansenetal.,
2011
Tedlar,
50Ca
rboxylicacids,ph
enols,indo
les,sulfu
rcom
poun
dsGC
MS
Nalop
han
20
[17]
Joetal.,2012
PEA
n.d.
H2S,methanethiol,carbon
disulfide,SO2,dim
ethylsulfid
e,dimethyld
isulfide
GC
Tedlar
n.d.
[18]
Kim,200
6Tedlar
n.d.
H2S,methanethiol,dimethylsulfid
e,dimethyld
isulfide
GC
Polyester
n.d.
[19]
Kim
etal.,
2012
PEA,
50Be
nzene,toluene,p-xylene,styrene,m
ethylethylketone,m
ethylisobu
tylketon
e,bu
tylacetate,isobu
tylalco
hol
GC
MS
Tedlar
50
[20]
Kozieletal.,
2005
Tedlar,
50Ac
eticacid,propion
icacid,isobu
tyric
acid,butyricacid,isovaleric
acid,valericacid,
hexano
icacid,p-cresol,indo
le,4-ethylpheno
l,2-am
inoacetoph
enon
eGC
MS
Teflo
n,50
foil
125
Melinex(PET
)15
[21]
Leetal.,2013
Tedlar
n.d.
H2S,methanethiol,ethanethiol,dimethylsulfid
e,tert-butanethiol,ethylmethyl
sulfide,1-butanethiol,dim
ethyld
isulfide,diethyldisulfide,dim
ethyltris
ulfid
eGC
Mylar
n.d.
Nalop
han
n.d.
[22]
Leetal.2015
Tedlar
50Hydrogensulfide,m
ethanethiol,ethanethiol,dimethylsulfid
e,tert-butanethiol,
ethylm
ethylsulfid
e,1-b
utanethiol,dim
ethyld
isulfide,diethyldisulfide,dim
ethyl
trisu
lfide
GC
Mylar
25Nalop
han
25
[23]
Mochalsk
iet
al.,2009
Nalop
han,
20
H2S,methanethiol,ethanethiol,carbon
ylsulfide,dim
ethylsulfid
e,carbon
disulfide
GC
MS
Tedlar
transparent,
50
Tedlar
black,
25Teflo
n,n.d.
FlexFo
iln.d.

4 The Scientific World JournalTa
ble1:Con
tinued.
Reference
number
Author
and
year
Polymeric
Film
Thickn
ess
[𝜇m]
Chem
icalcompo
und
Detectio
nSyste
m
[24]
Mochalsk
iet
al.,2013
Tedlar
50
n-Bu
tane,n
-pentane,n
-hexane,n-octane,n
-decane,iso
butane,3-m
ethylp
entane,
2-bu
tene
EandZ,
2-penteneE
andZ,
1-hexene,methylcyclopentane,a-pinene,
(+)-3-carene,p-cym
ene,D-limon
ene,eucalyptol,benzene,toluene,p-xylene,
o-xylene,acetone,2-butanon
e,2-pentanon
e,4-heptanon
e,2-bu
teno
ne,propanal,
2-methylpropanal,bu
tanal,hexanal,octanal,2-methyl-2
-propenal,furan,
2-methyl
furan,
2,5-dimethylfuran,thiop
hene,3-m
ethylthiop
hene,m
ethylacetate,ethyl
acetate,n-prop
ylacetate,methylm
ethacrylate,dimethylselenide,ethylether,
pyrim
idine,aceton
itrile,2-m
ethylp
entane,4-m
ethylh
eptane,isoprene,
ethylbenzene,dim
ethylsulfid
e,2-methyl-1-pentene,n
-butylacetate,2,4-dimethyl
heptane,2,4-dimethyl-1-heptene,4-m
ethyloctane,3-methylfuran,m
ethylpropyl
sulfide
GC
MS
Kynar
50.8
Flexfilm
76
[25]
Parker
etal.,
2010
Tedlar
n.d.
p-Cr
esol,acetic
acid,propion
icacid,isobu
tyric
acid,butyricacid,isovaleric
acid,
valeric
acid,hexanoica
cid
DO/G
C-MS
[26]
Saizetal.,
2011
Polyethylene
n.d.
Dyn
amites
GC
MS
HPL
C
[27]
Sironi
etal.,
2014
Nalop
han
20NH3
GC
[28]
Sironi
etal.,
2014
Nalop
han
20NH3
GC
[29]
Sulyok
etal.,
2002
Silco
steel
cylin
der
n.d.
Methylm
ercaptan,ethylmercaptan,D
imethylsulfid
e,2-Prop
ylmercaptan,
1-Propylm
ercaptan,2-Butylmercaptan,1-Butylmercaptan
GC
Tedlar
n.d.
[30]
Sulyok
etal.,
2001
Silco
steel
cylin
der
n.d.
Methylm
ercaptan,ethylmercaptan,dim
ethylsulfid
e,ethylm
ethylsulfid
e,2-prop
ylmercaptan,1-propylm
ercaptan,2-butylmercaptan,diethylsulfide,
1-butylmercaptan
GC
Tedlar
50Tedlar
black/cle
arlayered
50
[31]
Trabue
etal.,
2006
Tedlar
n.d.
Agriculturalodo
rants,aceticacid,propano
icacid,2-m
ethylpropano
icacid,butanoic
acid,3-m
ethylbutanoica
cid,pentanoica
cid,4-methylpentano
icacid,hexanoica
cid,
heptanoica
cid,ph
enol,4-m
ethylpheno
l,4-ethylpheno
l,indo
le,3-methylin
dole,
Volatile
fatty
acid,pheno
l,4-methylpheno
l,4-ethylpheno
l,indo
le,and
3-methylin
dole
GC
MS
[32]
Van
Harreveld,
2003
Nalop
han
20
Tobacco
DO
Cali-5-Bo
ndcoated
Nalop
han
131
[33]
VanDurme
and
Werbrou
ck,
2015
Nalop
han
20𝜇m
Japanese
Indo
orAirStandard
mix
GC
MS
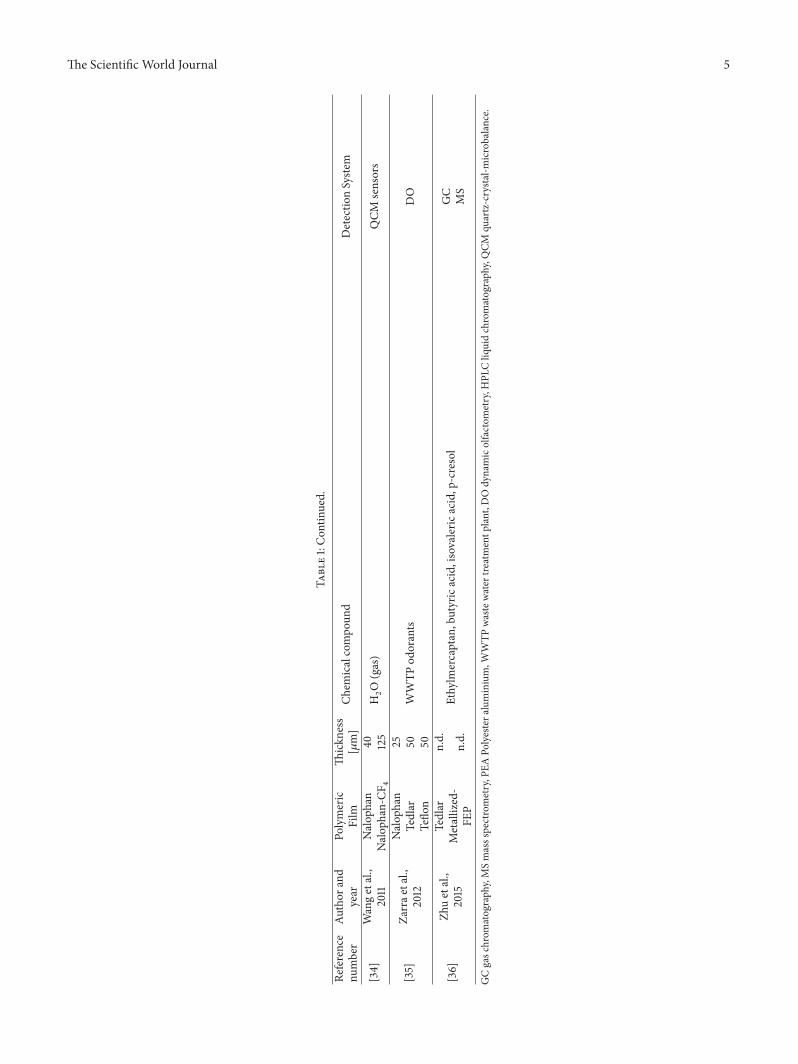
The Scientific World Journal 5
Table1:Con
tinued.
Reference
number
Author
and
year
Polymeric
Film
Thickn
ess
[𝜇m]
Chem
icalcompo
und
Detectio
nSyste
m
[34]
Wangetal.,
2011
Nalop
han
40H2O(gas)
QCM
sensors
Nalop
han-CF4
125
[35]
Zarrae
tal.,
2012
Nalop
han
25WWTP
odorants
DO
Tedlar
50Teflo
n50
[36]
Zhuetal.,
2015
Tedlar
n.d.
Ethylm
ercaptan,butyricacid,isovaleric
acid,p-cresol
GC
MS
Metallized-
FEP
n.d.
GCgasc
hrom
atograph
y,MSmassspectrometry,P
EAPo
lyestera
luminium,W
WTP
wastewater
treatmentp
lant,D
Odynamicolfactom
etry,H
PLCliq
uidchromatograph
y,QCM
quartz-crysta
l-microbalance.

6 The Scientific World Journal
The results of the studies reported in Table 1 underlinethat the chemical pollutants diffused through the polymericfilm are mainly small molecules, like ammonia (NH3) andH2S.
Nalophan is generally the most used material for themanufacturing of sampling bags for olfactometric analyses,due to its inert properties and cost-effectiveness. Despitethese advantages, it is known in literature that Nalophanallows the diffusion of specific compounds, such as water [15].Water can diffuse quickly through the Nalophan polymericfilm because of its structure [15]. The results of the studiesreported in Table 1 showed that the chemical compoundsthat diffuse through the Nalophan film are water, NH3, andH2S [1, 9, 10, 15, 27]; the last two compounds diffuse easilybecause these molecules have dimensions similar to water[1, 9, 10, 15, 27].
H2S and NH3 are typically odorous pollutants present inthe emissions from several plants such as solid waste andwaste water treatment.
In this paper, the attention was focused on H2S, a malo-dorous compound with smell similar to rotten eggs. H2S isdetected by human olfaction at very low concentrations—about 1 ppb [37–39]—and it is typically found in the emis-sions from different plants, like industry [30], agriculture[16, 31], waste water treatment [7], and waste treatment [21].
Generally, the articles present in literature (Table 1) focusthe attention mainly on the H2S loss by determining the H2Srecovery in the sampling bag.
The study of the contribution of pollutant losses, such asdiffusion and adsorption, is not easy because the diffusionthrough the polymeric film is influenced by the nature of thepolymer as well as by the nature of the diffusing pollutant[1, 40].
More in detail, the polymer characteristics that influencethe diffusion processes are as follows: the chemical natureof the polymer, its crystalline structure and orientation, thefree volume, the molecular cohesion, the relative humidity,temperature, hydrogen bonding, polarity, solubility parame-ter, and solvent size and shape [40].
As reported by Klopffer and Flaconneche in 2001 [41], thepolymer structure plays an important role in the determina-tion of the transport phenomena through the polymeric film.
It is well known in literature that transport phenom-ena of small molecules through an amorphous polymerare governed by mechanisms of adsorption and diffusion[40]. Transport phenomena can be decomposed into fivesuccessive stages (Figure 3) [40, 41]: (i) the diffusion throughthe boundary layer of the side corresponding to the higherpartial pressure (upstream side); (ii) the adsorption of the gas(by chemical affinity or by solubility) on the polymer; (iii) thediffusion of the gas inside the polymer’s membrane; (iv) thedesorption of the gas at the side of lower partial pressure; and(v) the diffusion through the limit layer of the downstreamside.
Only few studies in literature [1, 14, 27, 28] have facedthe problem of diffusion through the sampling bags bycalculating the diffusion coefficient of the inspected chem-ical compound. Moreover, in most studies, the amount ofchemical compound lost due to adsorption on the polymeric
Figure 1: Nalophan sampling bag, capacity 6 liters.
film has been neglected. Adsorption can be neglected whenhigh concentrations are considered (e.g., 50000 ppm NH3by Sironi et al. (2014) [1, 27, 28]), whereas for medium-lowconcentrations (e.g., in the range of ppb to few ppm) theeffect of adsorption becomes significant. In this study, boththe effects of diffusion through the polyethylene terephthalate(PET, Nalophan) film and the adsorption on the film areinvestigated. The experiments described in this paper aim toinvestigate the relative contributions of the two phenomenacausing H2S loss in Nalophan bags, that is, adsorption anddiffusion. The evaluations were carried out by calculatingthe amount of H2S adsorbed in the Nalophan film and thediffusion coefficient 𝐷 relevant to this material. Finally, theinfluence of physical parameter like relative humidity (RH)on both the diffusion coefficient and the adsorption wasevaluated.
2. Materials and Methods
2.1. Materials. The sampling bags studied with capacity of 6liters are prepared from a tubular film of Nalophan suppliedbyTilmmanns S.p.A. and shown in Figure 1.Thepolymer filmconsists of a 20-𝜇m thick one-layer foil.
The H2S decay over time was evaluated by measuring theH2S concentration inside the bag over time bymeans of a highperformanceminiature sensor able to detect H2S at ppb level.More in detail, the sensor used for the H2S concentrationmeasurement is a CairClip apparatus, developed byCairpol, aFrench start-up (Ales Engineer School of Mines), which con-sists in amperometric detection with a dynamic air samplingsystem, a special filter, and a high sensitive electronic circuitcontaining a data logger [42]. The instrument was calibratedby the manufacturer and it has a life-cycle of one year. Theaccuracy of this instrument declared by the manufactureris 10 ppb, in a range between 30 and 1000 ppb of H2S andmercaptans.
All the test samples were prepared by filling the Nalophanbags with a gaseousmixture of 800 ppb𝑉 ofH2S in air, definedas the “test mixture” in the paper. The samples were obtainedby withdrawing the H2S from a certified H2S gas cylinder(SAPIO technical gas, Milano, Italy) into Nalophan bags witha volume of 6 liters and a surface of 2580 cm2.
One aspect that had to be considered for the designof the experiment is that the CairClip has steel parts thatmay interact with the H2S and reduce its concentration,thereby affecting the measurements of the H2S concentrationdecay through the Nalophan, which is the aim of this paper.Therefore, in order to avoid undesired interactions of the

The Scientific World Journal 7
Cairpol inthe bag�lled with
Cairpol in empty bag
Preparing bagwith de�nedtest mixture
Storage atcontrolledhumidity andtemperature
Concentrationmeasurements
Cairpol inthe bag�lled with
Test with bag Test with bag having Nalophan �lmsheet inside
Nalophan �lm sheet
Cairpolin emptybag
Nalophan�lm sheet
H2S
H2SH2S
H2S
H2SH2S
H2S �owH2S �ow
Figure 2: Scheme of the method adopted.
CairClip sensor with the H2S during the sample storageperiod, the concentration measurements were carried out bymoving the gaseousmixture contained in the storage bag intoanother identical empty bag containing the CairClip sensor(Figure 2). Because of the short time of the measurement,the adsorption/diffusion effect in this bag is assumed to benegligible. In order to evaluate the H2S concentration decayover time, this procedure had to be repeated for differenttime intervals. A new bag had to be prepared for eachtested interval and then its contents transferred to the bagcontaining the measurement apparatus after the desired timeinterval (Figure 2).
TheH2S concentration after each tested time interval wasthen compared to the initial H2S concentration in the testmixture (800 ppb) in order to evaluate the H2S loss over time.
During storage, external physical parameters like temper-ature (i.e., 23∘C) and relative humidity (i.e., RH% equal to20 and 60, resp.) were kept under control using a climaticchamber (Chamber GHUMY by Fratelli Galli, Milano, Italy).
2.2.Methods. In order to evaluate the contribution of adsorp-tion and the diffusion phenomena into the Nalophan bags,several tests had to be performed, and three replications ofeach condition and time were tested, following the scheme inFigure 2.
After a first test using a bag with a volume of 6 litersand a surface of 2580 cm2 (in the following defined as “B-no film”), other tests were repeated using bags with thesame geometrical characteristics (i.e., volume of 6 litersand a surface of 2580 cm2), in which sheet of film of thesame material (i.e., a 20𝜇m thick Nalophan sheet) wasinserted. Three different tests were performed by changingthe dimensions of the sheet of film inserted inside the bag.This way, besides the “B-no film” with no film in it, threedifferent types of bags were prepared:
(i) Nalophan bag with volume of 6 L and surface of2580 cm2 containing a sheet of film of 1900 cm2 (inthe following defined as “B-film 1900”).
(ii) Nalophan bag with volume of 6 L and surface of2580 cm2 containing a sheet of film of 2580 cm2 (inthe following defined as “B-film 2580”).
(iii) Nalophan bag with volume of 6 L and surface of2580 cm2 containing a sheet of film of 3520 cm2 (inthe following defined as “B-film 3520”).
The idea of inserting the sheets of Nalophan of differentdimensions inside identical bags had the aim of evaluatingthe contribution of adsorption of the H2S in the Nalophanfilm, which is expected to increase with the surface of theNalophan film the H2S is in contact with.

8 The Scientific World Journal
Upstream side
Downstream side
Boundarylayer
Boundarylayer
External volume (Vout)Internal volume (VB)
SB
CB C0
jN
zN
Figure 3: Schematization of diffusion through the thin film of the bag.
Table 2: Experimental conditions.The bag tested was without any film inside (B-no film) and with the film inside.The surface of the internalfilm sheet was equal to 1900 cm2 (B-film 1900), 2580 cm2 (B-film 2580), and 3520 cm2 (B-film 3520) respectively.
Test code Bag capacity [L] Bag surface [cm2] Film sheet surface [cm2]B-no film 6 2580 No film insideB-film 1900 6 2580 1900B-film 2580 6 2580 2580B-film 3520 6 2580 3520
Table 2 reports the experimental conditions tested.The tests were conducted by measuring the H2S concen-
tration at different storage time intervals, as explained in theprevious paragraph. The time intervals tested were from 0 to30 hrs, the latter being the maximum storage time allowedby the reference standard EN 13725:2003. All measurements,reported in Table 2, were repeated three times each.
The test temperature of the samples was fixed at 23∘C.Therole of humidity on the H2S concentration decay inside thebag was evaluated by storing the bags at different externalhumidity values, of 20% and 60%, respectively.
A suitable procedure had to be adopted in order to nor-malize the Nalophan films tests in terms of initial conditionsof water absorbed. In fact, Nalophan is proven to be waterpermeable [15], and thus the water adsorption in the film isconnected to the external environmental conditions. For this
reason, in order to normalize the water content of the testedNalophan films, all bags were stored for 12 hours at the testconditions using a climatic chamber before the beginning ofthe tests.
This procedure allows obtaining repeatable results byreducing the measurement errors related to the state ofswelling of the polymer matrix.
The comparison of the H2S residual concentration insidethe bag after the tested storage time with the initial H2Sconcentration in the test mixture allowed the evaluation ofthe H2S loss over time. As already mentioned, the aim ofthis paper was not only the quantification of the H2S lossover time but also the evaluation of the relative contributionof adsorption and diffusion to this loss. H2S adsorption wasevaluated using (12) to (14) (see § Calculations), whereasdiffusion was calculated based on Fick’s law. To calculate

The Scientific World Journal 9
the diffusion coefficient 𝐷 of H2S through Nalophan, (15) to(17) were used (see § Calculations). The measurements wereperformed at different times and the diffusion coefficient 𝐷was averaged over 30 hours.
2.3. Calculations. Themodel used to determine the H2S loss,due to both adsorption and diffusion, starts from the methoddeveloped in Sironi et al. 2014 [1] by adapting this for H2S.More in detail, the novelty of this work is to separate thetwo contributions on pollutants loss from the sampling bag:adsorption on polymeric matrix and diffusion through thefilm.
The diffusion phenomenon through a polymeric film canbe described by Fick’s law. Accordingly the specificmolar flowis defined as
𝑗 = −𝐷𝜕𝐶𝜕𝑥 , (1)
where
(i) 𝑗 is the specific molar flow (mol/m2/sec),(ii) 𝐷 is the diffusion coefficient of the compound through
the film (m2/sec),(iii) 𝐶 is the concentration of the diffusing compound
(mol/m3),(iv) 𝑥 is the differential thickness of the polymeric film of
the bag.
The thickness of polymeric film of the bag can therefore beexpressed as
∫𝑧0
𝑑𝑥 = 𝑧, (2)
where 𝑧 is the thickness (m) of the polymeric film of the bag.Referring to Figure 3, which schematizes the diffusion
phenomenon through the thin film that constitutes thesampling bag, it is possible to define the following:
(i) 𝑆𝐵 is the surface of the polymeric film of the bag (m2).(ii) 𝑍𝐵 is the thickness of the polymeric film of the bag
(m).(iii) 𝐶𝐵 is the concentration in the inside volume (mol/
m3).(iv) 𝐶0 is the concentration outside the film (mol/m3), and
for a single bag it is generally considered negligible(𝐶0 = 0).
(v) 𝑗 is the specificmolar flow through the polymeric filmof the bag (mol/m2/sec), assuming in first approxima-tion 𝑗 constant along the film (𝑥).
By integrating (1) in 𝑑𝑥 between 0 and 𝑧𝐵, the specific molarflow 𝑗 can be expressed as
𝑗 = −𝐷𝐶0 − 𝐶𝐵𝑧𝐵 , (3)
where 𝑗 is relevant to an infinitesimal portion of the exchangesurface 𝑑𝑆.
Assuming that the internal molar concentration 𝐶𝐵 ishomogeneous inside the whole internal volume 𝑉𝐵 and alsothe external concentration 𝐶0 is constant inside the externalvolume, then the global flow 𝐽 through the exchange surface𝑆𝐵 can be calculated by integrating as follows:
𝐽 = ∫𝑆𝐵0
𝑗 𝑑𝑆, (4)
𝐽 = 𝑆𝐵𝑗. (5)
Combining (3) with (5), the molar flow through the surfacecan be expressed as
𝜕𝑀𝐵𝜕𝑡 = −
𝜕𝐶𝐵𝑉𝐵𝜕𝑡 = −
𝑆𝐵𝐷𝑧𝐵 (𝐶𝐵 − 𝐶0) . (6)
If the external concentration𝐶0 is assumed to be equal to zero(𝐶0 = 0), which is the case if the bag is placed in a neutralenvironment (where the presence of H2S may be considerednegligible), (6) can be rewritten as
−𝜕𝐶𝐵𝑉𝐵𝜕𝑡 = −𝑆𝐵𝐷𝑧𝐵 𝐶𝐵. (7)
According to this model, the concentration decay over timeturns out to be a function of the surface area (𝑆𝐵), the volumeof the sampled gas𝑉𝐵, the film thickness (𝑧𝐵), the time (𝑡), thediffusion coefficient (𝐷) that depends on the characteristicsof the material, and the concentration gradient through thepolymeric barrier (Δ𝐶).
The boundary conditions considered for the integrationof (7) are
𝐶𝐵 = 𝐶 for 𝑡 = 𝑡∗,𝐶𝐵 = 𝐶in for 𝑡 = 0. (8)
The integration of (7) allows computing the concentrationtrend over time:
ln( 𝐶𝐶in) = −𝑆𝐵𝐷𝑉𝐵𝑧𝐵 𝑡,
𝐶𝐶in = 𝑒
−(𝑆𝐵𝐷/𝑉𝐵𝑧𝐵)𝑡.(9)
The H2S loss (percent) through the bag over time can beexpressed as
H2Sloss% = (1 − 𝐶𝑡𝑖𝐶in) ∗ 100, (10)
where 𝐶𝑡𝑖 is the concentration measured at time 𝑡𝑖 and 𝐶in isthe initial concentration.
The loss of H2S is due both to adsorption in the Nalophanand to diffusion through the bag walls.
The H2S loss due to these phenomena can be calculatedas the difference between the initial amount of H2S (H2Sin)and the amount measured at the time 𝑡𝑖 (H2S𝑡𝑖):
H2Sloss (𝜇g) = H2Sin (𝜇g) −H2S𝑡𝑖 (𝜇g) . (11)

10 The Scientific World Journal
In order to evaluate the relative contributions of the twophenomena (adsorption and diffusion) to the H2S loss insidethe Nalophan bag, the following system has to be solved:
H2Sloss_1 (𝜇g) = 𝑎 ∗ 𝑆𝐵 + 𝑦,H2Sloss_2 (𝜇g) = 𝑎 ∗ 𝑆𝐵 + 𝑎 ∗ 𝑆film + 𝑦,
(12)
where(i) H2Sloss_1 is the amount of H2S loss at time 𝑡𝑖 (𝜇g)
measured for the simple Nalophan bag,(ii) H2Sloss_2 is the amount of H2S loss at time 𝑡𝑖 (𝜇g)
measured for the Nalophan bag with the Nalophansheets inserted,
(iii) 𝑎 is the contribution of the adsorbed H2S (𝜇g/m2),(iv) 𝑦 is the contribution of the diffused H2S (𝜇g),(v) 𝑆𝐵 is surface area of the bag (m2),(vi) 𝑆film is surface area of the sheet of film inserted in the
bag (m2).The first equation of the system refers to the test conditionin which the bag has no additional film inserted in it. On thecontrary, the second equation refers to the bags containingthe sheets of Nalophan film. Moreover, it is important tonotice that using the same thickness of the film (i.e., 20𝜇m)the data are expressed in terms of surface unit. Therefore, thedata obtained are directly correlated to the data expressed interms of mass unit.
The adsorbed amount per unit of surface (H2Sadsorbed/m2)
can be obtained by subtracting the contribution of thediffusion (i.e., 𝑦) from the amount of H2S losses at time 𝑡𝑖(i.e., H2Sloss (𝜇g)), according to (12):
H2Sadsorbedm2= H2Sloss (𝜇g) − 𝑦𝑆𝐵 + 𝑆film . (13)
The adsorbed amount (H2Sadsorbed) related to the consideredsurface can be obtained by multiplying H2Sadsorbed/m
2 by theinner film surface (i.e., 𝑆film):
H2Sadsorbed = H2Sadsorbedm2𝑆film. (14)
The diffused amount (i.e., H2Sdiff ) was calculated as thedifference between the H2S amount losses (H2Sloss) at time𝑡𝑖 and the adsorbed amount:
H2Sdiff = H2Sloss −H2Sadsorbed. (15)
The diffusion coefficient 𝐷𝑡𝑖 for each time interval 𝑡𝑖 wascalculated according to the following equation:
𝐷𝑡𝑖 = −𝑉𝐵𝑧𝐵𝑆𝐵𝑡𝑖 ln(H2SdiffH2Sin) , (16)
where 𝑡𝑖 is the time interval and H2Sdiff is the concentrationdiffused at time 𝑡𝑖.
The diffusion coefficient of H2S through Nalophan wasfinally calculated as the average of the different values of 𝐷𝑡𝑖weighted on the corresponding storage time 𝑡𝑖:
𝐷 = ∑𝑖𝐷𝑡𝑖𝑡𝑖∑𝑖 𝑡𝑖 . (17)
3. Results and Discussion
As previouslymentioned, themain objective of this studywasthe estimation of the relative contribution of the two phe-nomena (i.e., adsorption and diffusion) that are responsiblefor the H2S concentration decay inside Nalophan bags usedfor olfactometric sampling.
Table 3 shows the ratio 𝐶𝑡𝑖/𝐶in, where 𝐶𝑡𝑖 is the H2Sconcentration measured at different time intervals (𝑡𝑖) nor-malized to the initial concentration (𝐶in), and the percentloss of H2S (%) with respect to the initial concentration.The storage temperature was fixed at 23∘C and the relativehumidity was 20% and 60%, respectively. Table 3 reportsthe results obtained for the simple Nalophan bag (“B-nofilm”) and the other three bags prepared by inserting sheetsof Nalophan of different dimensions inside the bags, thatis, 1900 cm2 (“B-film 1900”), 2580 cm2 (“B-film 2580”), and3520 cm2 (“B-film 3520”), respectively, as described in theMethods.
The percent loss of H2S (%) (Table 3) inside the bag withrespect to the initial concentration over time was calculatedaccording to (10).TheH2S concentration decay is due to boththe adsorption into the Nalophan (i.e., both the bag itself andthe inserted film sheet) and the diffusion through the bagwalls.
The percent loss of H2S (%) from the simple bag that doesnot contain the extra Nalophan film sheet in it (“B-no film”)after 30 hr turns out to be equal to about 33% ± 3% at a storagehumidity of 20% and equal to 22% ± 1% at a storage humidityof 60%. This trend is coherent with other data reported inthe scientific literature dealing with the same subject. As anexample, a study by Akdeniz et al. (2011) [7], also dealing withH2S losses through polymeric films (Tedlar and Flex Foil),reports losses of about 20% after 36 hours.
Moreover, it is possible to observe for the single bag howthe data show that the trends of the H2S losses (%) are littlebit higher decreasing the storage relative humidity.This is dueto the presence of water caused by the humidity gradient, asalready observed in Sironi et al. (2014a, b) [1, 27].
The data reported in Table 3 show also an increase ofthe H2S losses (%) increasing the surface of the polymericfilm sheet inserted in the bag. The H2S percent loss (%), ata storage humidity of 20%, after 30 hr turns out to be equalto 47% for the bag containing the film sheet with a surface of1900 cm2, increasing up to 71% for the bag containing the filmsheet with a surface of 3520 cm2. The same trend is observedat a storage humidity of 60%: the H2S percent loss (%) after30 hr turns out to be equal to 46% for the bag containing thefilm sheet with a surface of 1900 cm2, increasing up to 63% forthe bag containing the film sheet with a surface of 3520 cm2.
As said above, the H2S losses (%) inside the bag withrespect to the initial concentration are affected by twocontributions: adsorption into the Nalophan and diffusionthrough the Nalophan bag walls. In order to evaluate thesetwo contributions separately, the H2S ratio adsorbed into theNalophan film was evaluated as the ratio between H2Sadsorbed(estimated according to (14)) and the initial concentration(H2Sin). Figures 4 and 5 report the adsorbed H2S (%) at

The Scientific World Journal 11
Table 3: Experimental data relevant to the H2S loss over time in a Nalophan bag stored at temperature of 23∘C and humidity of 20% and 60%.The bag tested was without any film inside (B-no film) and with the film inside. The surface of the internal film sheet was equal to 1900 cm2(B-film 1900), 2580 cm2 (B-film 2580), and 3520 cm2 (B-film 3520), respectively. The data reported are the average of the results from threedifferent tests performed at the same conditions.
Time [hr] 𝑇23∘C RH% 20 𝑇23∘C RH% 60𝐶𝑡𝑖/𝐶in %H2S losses 𝐶𝑡𝑖/𝐶in %H2S losses
B-no film3 0.92 ± 0.04 8% ± 4% 0.96 ± 0.02 4% ± 2%24 0.77 ± 0.02 23% ± 2% 0.80 ± 0.004 20% ± 0.4%30 0.67 ± 0.03 33% ± 3% 0.78 ± 0.011 22% ± 1.1
B-film 19003 0.89 ± 0.01 11% ± 1% 0.94 ± 0.02 6% ± 2%24 0.65 ± 0.01 35% ± 1% 0.60 ± 0.045 40% ± 4.5%30 0.53 ± 0.03 47% ± 3% 0.54 ± 0.051 46% ± 5.1%
B-film 25803 0.89 ± 0.02 11% ± 2% 0.87 ± 0.02 13% ± 2%24 0.54 ± 0.01 46% ± 1% 0.53 ± 0.015 47% ± 1.5%30 0.39 ± 0.002 61% ± 0.2% 0.47 ± 0.016 53% ± 1.6%
B-film 35203 0.84 ± 0.04 16% ± 4% 0.86 ± 0.02 14% ± 2%24 0.53 ± 0.03 47% ± 3% 0.44 ± 0.017 56% ± 1.7%30 0.28 ± 0.01 71% ± 1% 0.37 ± 0.020 63% ± 2%
3%
13% 15%
3%
21% 20%
7%
24%
34%
0
10
20
30
40
50
60
70
80
3 24 30Time (hrs)
B-�lm 1900B-�lm 2580B-�lm 3520
T = 23∘C RH = 20%
H2S
adso
rbed
(%)
Figure 4: Adsorbed H2S (%) at specific time intervals at a storagetemperature of 23∘C and humidity of 20%. The bag tested was withthe film sheets inside.The surface of the internal film sheet was equalto 1900 cm2 (B-film 1900), 2580 cm2 (B-film 2580), and 3520 cm2(B-film 3520), respectively. The data reported are the average of theresults from three different tests performed at the same conditions.
specific time intervals at a storage temperature of 23∘C anda humidity of 20% and 60%, respectively.
As it is possible to observe in Figure 4 and in Figure 5,the ratio of adsorbed H2S (%) increases by increasing theinner film sheet surface. The adsorbed H2S (%) at a storagehumidity of 20% (Figure 4) after 30 hr turns out to be equalto
(i) about 15% for the bag containing the film sheet with asurface of 1900 cm2 (“B-film 1900”),
2%
12% 11%6%
18% 16%
7%
25% 24%
3 24 30Time (hrs)
0
10
20
30
40
50
60
70
80
B-�lm 1900B-�lm 2580B-�lm 3520
T = 23∘C RH = 60%
H2S
adso
rbed
(%)
Figure 5: Adsorbed H2S (%) at specific time intervals at storagetemperature of 23∘C and humidity of 60%. The bag tested was withthe film sheets inside.The surface of the internal film sheet was equalto 1900 cm2 (B-film 1900), 2580 cm2 (B-film 2580), and 3520 cm2(B-film 3520), respectively. The data reported are the average of theresults from three different tests performed at the same conditions.
(ii) about 20% for the bag containing the film sheet witha surface of 2580 cm2 (“B-film 2580”),
(iii) about 34% for the bag containing the film sheet witha surface of 3520 cm2 (“B-film 3520”).
The adsorbedH2S (%) at a storage humidity of 60% (Figure 5)after 30 hr turns out to be equal to
(i) about 11% for the bag containing the film sheet with asurface of 1900 cm2 (“B-film 1900”),

12 The Scientific World Journal
(ii) about 16% for the bag containing the film sheet witha surface of 2580 cm2 (“B-film 2580”),
(iii) about 24% for the bag containing the film sheet witha surface of 3520 cm2 (“B-film 3520”).
The data reported above show a weak increase of the ratioof adsorbed H2S (%) for the bag stored at low humidity (i.e.,20%). The Nalophan film is made with PET (polyethyleneterephthalate) that is known from literature to be water per-meable [15].Therefore, when storing the bag at high humidity(i.e., 60%), the amount of water that can be adsorbed onthe film is greater compared to the storage condition at lowhumidity (i.e., 20%). At a temperature of 23∘C and relativehumidity of 20% the partial pressure of water is equal to4mmHg, whereas at a temperature of 23∘C and relativehumidity of 60% the partial pressure of water is equal to13mmHg.Therefore, in this second condition, it is likely thatthe water is adsorbed on the polymer matrix instead of theH2S (competitive adsorption).
Figures 6 and 7 illustrate the amount of H2S in terms ofcumulative losses (𝜇g) and the two contributions, that is, onone hand the H2S adsorbed on the polymeric film and on theother hand the H2S diffused trough the bag walls. The resultsare shown in function of the surface area of theNalophan filmsheet inserted inside the test bags at a storage humidity of 20%and 60%, respectively.
As expected, the amount ofH2S that is adsorbed increasesby increasing the surface of the Nalophan film sheet insertedinside the bag. Also, the contribution of diffusion remainsalmost constant for the two values of relative humidity tested(i.e., RH 20% and 60%, resp.). This aspect was expectedbecause the film sheet inserted has no internal concentrationgradient (Δ𝐶) (see Fick law (7)).
Moreover, it is possible to observe that diffusion is pre-dominant compared to adsorption, although the latter is notnegligible.The only exceptions are observed at a temperatureof 23∘C and a relative humidity of 20% in the bag containingthe Nalophan film sheet with a surface of 3520 cm2 (“B-film3520”) (Figure 6), since in these conditions the contributionof diffusion is comparable to that of adsorption.
The averaged data of the adsorbed amount per surfaceunit (H2Sadsorbed/m
2) in 𝜇g/m2 (see (12)) at specific times (i.e.,3 hr, 24 hr, and 30 hr) are reported in Table 4.
It is possible to observe (Table 4) that the results at 24hours and 30 hours relevant to both the storage conditionstested present comparable values of H2Sadsorbed/m
2. At 3 hr,the value of H2Sadsorbed/m
2 is lower.The averaged values rele-vant to 24 and 30 hr of H2Sadsorbed/m
2 are equal to 5.8𝜇g/m2(which corresponds to a ratio H2Sadsorbed (g)/gNalophan equal to2.17 105 gH2S/gNalophan) at a relative humidity of 20% and to4.8 𝜇g/m2 at a relative humidity of 60% (which correspondsto a ratio H2Sadsorbed (g)/gNalophan equal to 1.79 105 gH2S/gNalophan), respectively. The value of H2Sadsorbed/g wasobtained by combining the value of H2Sadsorbed/m2 with thethickness of the film, which is equal to 20 𝜇m, and the densityof amorphous PET, which is equal to 1.335 g/cm3 [43].
As already observed, at a storage humidity of 20% theamount of adsorbed H2S is higher than the adsorbed amount
0.00
1.00
2.00
3.00
4.00
5.00
6.00
0.19 0.258 0.352
Di�used H2S-30 hrsAdsorbed H2S-30 hrs
Inner Film (m2)
Cumulative H2S loss-30 hrs
H2S
(�휇g)
5.00 ± 0.07
4.43 ± 0.04
3.37 ± 0.20 2.39 ± 0.041.47 ± 0.25
1.07 ± 0.08
2.61 ± 0.032.96 ± 0.32.30 ± 0.11
Figure 6:Theamount ofH2S in terms of cumulative losses, diffusionlosses, and adsorption losses related to the surface of the inner filmat a storage temperature of 23∘C and humidity of 20%. The datareported are the average of the results from three different testsperformed at the same conditions.
0.00
1.00
2.00
3.00
4.00
5.00
6.00
0.19 0.258 0.352
Di�used H2S-30 hrsAdsorbed H2S-30 hrs
Inner Film (m2)
Cumulative H2S loss-30 hrs
H2S
(�휇g)
4.33 ± 0.19
3.89 ± 0.123.51 ± 0.39
1.64 ± 0.081.19 ± 0.06
0.85 ± 0.17
2.70 ± 0.112.69 ± 0.062.66 ± 0.23
Figure 7:The amount ofH2S in terms of cumulative losses, diffusionlosses, and adsorption losses related to the surface of the inner filmat a storage temperature of 23∘C and humidity of 60%. The datareported are the average of the results from three different tests.
at the storage humidity of 60%. This may be due to thefact that to a relative humidity of 60% corresponds a higheramount of water, given that the water can compete with theH2S in the adsorption on the polymeric film. Therefore, it ispossible to assert that the adsorption of H2S on the polymericfilm is influenced by the storage humidity.
Moreover, the data in Table 4 show that after threehours of storage the polymeric film is not yet saturated.The steady state conditions, at which the polymer film iscompletely saturated, are reached at 24 hours.The steady state

The Scientific World Journal 13
Table 4: Averaged data of the amount of H2S adsorbed per surface unit (H2Sadsorbed/m2). The bag tested was without any film inside (B-nofilm) andwith the film inside.The surface of the internal film sheet was equal to 1900 cm2 (B- film 1900), 2580 cm2 (B- film 2580), and 3520 cm2(B- film 3520), respectively. The data reported are the average of the results from three different tests performed at the same conditions.
RH% 20 RH% 603 hrs 24 hrs 30 hrs 3 hrs 24 hrs 30 hrs
H2Sadsorbed/m2 [𝜇g/m2]B-film 1900 1.11 ± 0.12 4.73 ± 0.19 5.65 ± 0.45 0.74 ± 0.35 4.98 ± 0.78 4.48 ± 0.88B-film 2580 0.95 ± 0.26 5.75 ± 0.07 6.94 ± 0.08 1.62 ± 0.29 4.95 ± 0.15 4.62 ± 0.23B-film 3520 1.38 ± 0.39 4.87 ± 0.3 6.80 ± 0.12 1.38 ± 0.27 4.97 ± 0.27 4.65 ± 0.30
Table 5: Diffusion coefficient ofH2S over time in aNalophan bag stored at a temperature of 23∘C and a humidity of 20% and 60%, respectively.The bag tested was without any film inside (B-no film) and with the film inside. The surface of the internal film sheet was equal to 1900 cm2(B-film 1900), 2580 cm2 (B-film 2580), and 3520 cm2 (B-film 3520), respectively.
Time [hr] 𝑇23∘C RH% 20 𝑇23∘C RH% 60𝐶diff/𝐶0 𝐷𝑡𝑖 (m2/sec) 𝐶diff/𝐶0 𝐷𝑡𝑖 (m2/sec)
B-no film
24 5% 1.61𝐸 − 11 12% 1.15𝐸 − 1124 5% 1.62𝐸 − 11 12% 1.16𝐸 − 1124 5% 1.60𝐸 − 11 12% 1.16𝐸 − 1130 12% 9.06𝐸 − 12 12% 9.21𝐸 − 1230 12% 9.14𝐸 − 12 12% 9.27𝐸 − 1230 12% 8.96𝐸 − 12 12% 9.29𝐸 − 12
B-film 1900
24 22% 8.07𝐸 − 12 25% 7.42𝐸 − 1224 22% 8.05𝐸 − 12 30% 6.41𝐸 − 1224 21% 8.35𝐸 − 12 27% 6.96𝐸 − 1230 31% 5.02𝐸 − 12 33% 4.82𝐸 − 1230 31% 5.00𝐸 − 12 38% 4.18𝐸 − 1230 34% 4.65𝐸 − 12 33% 4.78𝐸 − 12
B-film 2580
24 26% 7.29𝐸 − 12 30% 6.47𝐸 − 1224 25% 7.39𝐸 − 12 29% 6.66𝐸 − 1224 25% 7.48𝐸 − 12 28% 6.76𝐸 − 1230 37% 4.33𝐸 − 12 37% 4.29𝐸 − 1230 43% 3.63𝐸 − 12 38% 4.19𝐸 − 1230 43% 3.63𝐸 − 12 36% 4.38𝐸 − 12
B-film 3520
24 24% 7.64𝐸 − 12 30% 6.42𝐸 − 1224 22% 8.10𝐸 − 12 32% 6.20𝐸 − 1224 22% 8.05𝐸 − 12 31% 6.29𝐸 − 1230 38% 4.21𝐸 − 12 39% 4.10𝐸 − 1230 37% 4.28𝐸 − 12 40% 3.94𝐸 − 1230 37% 4.28𝐸 − 12 39% 4.04𝐸 − 12
is considered reached when the sorption amount of H2S doesnot vary with time in analogies with Fick law [41]. Therefore,in order to calculate the diffusion coefficient (𝐷) only the dataacquired at 24 hours and 30 hours were used. The diffusioncoefficient was evaluated according to (16).
Table 5 reports the diffusion coefficient 𝐷𝑡𝑖 for each timeinterval 𝑡𝑖 at a storage temperature of 23∘C and a humidity of20% and 60%, respectively.
The diffusion coefficient of H2S (𝐷) through Nalophanis finally calculated as the average of the different values of𝐷𝑡𝑖 (Table 5) weighted on the corresponding storage time 𝑡𝑖according to (17).
The resulting value for 𝐷, at a storage humidity of 20%,is equal to 7.5 10−12m2/sec with a standard deviation equal to1.2 10−14m2/sec.
The resulting value for 𝐷, at a storage humidity of 60%,is equal to 6.6 10−12m2/sec with a standard deviation equal to7.9 10−15m2/sec.
The resulting values for 𝐷 obtained at two differentstorage conditions (i.e., humidity of 20% and of 60%., resp.)present the same order of magnitude.
4. Conclusions
The H2S losses from the Nalophan bag always turned outto be significant. The H2S loss after 30 hr was equal to 33%at a relative humidity of 20% and equal to 22% at a relativehumidity of 60%.
The average value of H2Sadsorbed/m2 turns out to be equal
to 5.8 𝜇g/m2 at a storage humidity of 20% and equal to4.8 𝜇g/m2 at a storage humidity of 60%.
The contribution of the adsorption phenomenon, underthe test conditions evaluated, is less significant than the dif-fusion, though not negligible. When increasing the surface ofthe film sheet inserted in the bag (i.e., test with “B-film 3520”at a humidity of 20%) then the contribution of adsorption

14 The Scientific World Journal
to the H2S loss inside the bag becomes comparable with thecontribution of diffusion. Therefore, in the case of medium-low concentrations as it happens for those tests (from few ppbto few ppm), an increase of the polymeric surface producesan increase in the H2S loss due to the adsorption on thepolymeric film. As a consequence, in order to reduce theadsorption phenomena on the polymeric film when storinggases like H2S at medium-low concentrations (i.e., in a rangeof ppb to few ppm), it is better to reduce the contact surfaceexposed to the gas using small sampling bags and storingthe bag at a high relative humidity (i.e., RH% equal to60%). During sampling of H2S, in order to reduce the odorlosses, special care should be taken when the expected H2Sconcentration is medium or low (e.g., in the range of ppb tofew ppm) because the adsorption phenomena on the polymerfilm in this case are not negligible.
The diffusion coefficients of H2S through Nalophan, forthese two humidity conditions tested, are comparable (i.e.,7.5 10−12m2/sec at 20% humidity and 6.6 10−12m2/sec at 60%humidity).
Evaluating the two contributions of H2S loss (i.e., adsorp-tion and diffusion) is important to choose the best samplingstrategy (i.e., the choice of the bag material), as well as themost proper storage time and conditions.
In order to reduce the diffusion phenomena through thebag, it is possible to use polyethylene terephthalate (i.e., com-mercial named Nalophan) coupled with foils. Nevertheless,this choice does not solve the problems linked to the loss byadsorption of H2S on the polymeric matrix.
Conflicts of Interest
The authors declare that there are no conflicts of interestregarding the publication of this paper.
References
[1] S. Sironi, L. Eusebio, L. Capelli, E. Boiardi, R. D. Rosso, and J.Guillot, “Ammonia diffusion phenomena through nalophan�bags used for olfactometric analyses,” Journal of EnvironmentalProtection, vol. 05, no. 11, pp. 949–961, 2014.
[2] CEN, “EN13725Air Quality—Determination of Odour Con-centration by Dynamic Olfactometry. Comite “Europe” en deNormalisation (CEN), Brussels, Belgium, 2003”.
[3] T. J. Schulz and A. P. Van Harreveld, “International movestowards standardisation of odourmeasurement using olfactom-etry,”Water Science and Technology, vol. 34, no. 3-4, pp. 541–547,1996.
[4] L. Capelli, S. Sironi, R. Del Rosso, P. Centola, and S. Bonati,“Improvement of olfactometric measurement accuracy andrepeatability by optimization of panel selection procedures,”Water Science and Technology, vol. 61, no. 5, pp. 1267–1278, 2010.
[5] Y.-H. Kim and K.-H. Kim, “Experimental approach to assesssorptive loss properties of volatile organic compounds in thesampling bag system,” Journal of Separation Science, vol. 35, no.21, pp. 2914–2921, 2012.
[6] Y. Laor, Y. Ozer, U. Ravid, A.Hanan, and P.Orenstein, “Method-ological aspects of sample collection for dynamic olfactometry,”Chemical Engineering Transactions, vol. 23, pp. 55–60, 2010.
[7] N. Akdeniz, K. A. Janni, L. D. Jacobson, and B. P. Hetchler,“Comparison of Gas Sampling Bags to Temporarily Store Hy-drogen Sulfide, Ammonia, and Greenhouse Gases,” Transac-tions of the ASABE, vol. 54, no. 2, pp. 653–661, 2011.
[8] A. Bakhtari, “Managing odour sample degradation throughOn-site olfactometery and proper sample transportation andstorage,” Chemical Engineering Transactions, vol. 40, pp. 163–168, 2014.
[9] S. Beghi and J.-M. Guillot, “Sample water removal method involatile organic compound analysis based on diffusion throughpoly(vinyl fluoride) film,” Journal of Chromatography A, vol.1127, no. 1-2, pp. 1–5, 2006.
[10] S. Beghi and J.-M. Guillot, “Use of poly(ethylene terephtalate)film bag to sample and remove humidity from atmospherecontaining volatile organic compounds,” Journal of Chromatog-raphy A, vol. 1183, no. 1-2, pp. 1–5, 2008.
[11] P. Boeker, J. Leppert, and P. Shulze Lammers, “Comparison ofodorant losses at the, ppb-level from sampling bags of Nalo-phane� and Tedlar� and from adsorption tubes,” ChemicalEngineering Transactions, vol. 40, pp. 157–162, 2014.
[12] A. H. Bokowa, “Odour assessment: Determining the opti-mum temperature and time for Tedlar sampling bag pre-conditioning,”Water Science and Technology, vol. 66, no. 8, pp.1806–1811, 2012.
[13] S. Cariou and J.-M. Guillot, “Double-layer Tedlar bags: a meansto limit humidity evolution of air samples and to dry humid airsamples,” Analytical and Bioanalytical Chemistry, vol. 384, no.2, pp. 468–474, 2006.
[14] L. Eusebio, E. Davoli, L. Capelli, R. Del Rosso, and S. Sironi,“Temperature effect on H2S diffusion through nalophan�,”Chemical Engineering Transactions, vol. 54, pp. 313–318, 2016.
[15] J.-M. Guillot and S. Beghi, “Permeability to water vapour andhydrogen sulphide of some sampling bags recommended by EN13725,” Chemical Engineering Transactions, vol. 15, pp. 79–86,2008.
[16] M. J. Hansen, A. P. S. Adamsen, A. Feilberg, and K. E. N.Jonassen, “Stability of odorants from pig production in sam-pling bags for olfactometry,” Journal of Environmental Quality,vol. 40, no. 4, pp. 1096–1102, 2011.
[17] S.-H. Jo, K.-H. Kim, Z.-H. Shon, and D. Parker, “Identificationof control parameters for the sulfur gas storability with bagsampling methods,”Analytica Chimica Acta, vol. 738, pp. 51–58,2012.
[18] K.-H. Kim, “A study of sorptive loss patterns for reduced sulfurcompounds in the use of the bag sampling method,” Environ-mental Monitoring and Assessment, vol. 123, no. 1–3, pp. 259–269, 2006.
[19] Y.-H. Kim, K.-H. Kim, S.-H. Jo, E.-C. Jeon, J. R. Sohn, and D.B. Parker, “Comparison of storage stability of odorous VOCsin polyester aluminum and polyvinyl fluoride Tedlar bags,”Analytica Chimica Acta, vol. 712, pp. 162–167, 2012.
[20] J. A. Koziel, J. P. Spinhirne, J. D. Lloyd, D. B. Parker, D. W.Wright, and F. W. Kuhrt, “Evaluation of sample recovery ofmalodorous livestock gases from air sampling bags, solid-phasemicroextraction fibers, Tenax TA sorbent tubes, and samplingcanisters,” Journal of the Air & Waste Management Association,vol. 55, no. 8, pp. 1147–1157, 2005.
[21] H. Le, E. C. Sivret, G. Parcsi, and R. M. Stuetz, “Stability ofVolatile Sulfur Compounds (VSCS) in sampling bags - Impactof temperature,”Water Science and Technology, vol. 68, no. 8, pp.1880–1887, 2013.

The Scientific World Journal 15
[22] H. V. Le, E. C. Sivret, G. Parcsi, and R. M. Stuetz, “Impact ofstorage conditions on the stability of volatile sulfur compoundsin sampling bags,” Journal of Environmental Quality, vol. 44, no.5, pp. 1523–1529, 2015.
[23] P. Mochalski, B. Wzorek, I. Sliwka, and A. Amann, “Suitabilityof different polymer bags for storage of volatile sulphur com-pounds relevant to breath analysis,” Journal of ChromatographyB: Analytical Technologies in the Biomedical and Life Sciences,vol. 877, no. 3, pp. 189–196, 2009.
[24] P. Mochalski, J. King, K. Unterkofler, and A. Amann, “Stabilityof selected volatile breath constituents in Tedlar, Kynar andFlexfilm sampling bags,” Analyst, vol. 138, no. 5, pp. 1405–1418,2013.
[25] D. B. Parker, Z. L. Perschbacher-Buser, N. A. Cole, and J.A. Koziel, “Recovery of agricultural odors and odorous com-pounds from polyvinyl fluoride film bags,” Sensors, vol. 10, no.9, pp. 8536–8552, 2010.
[26] J. Saiz, J.-L. Ferrando, J.-C. Atoche, M. Torre, and C. Garcıa-Ruiz, “Study of losses of volatile compounds from dynamites.Investigation of cross-contamination between dynamites storedin polyethylene bags,” Forensic Science International, vol. 211, no.1-3, pp. 27–33, 2011.
[27] S. Sironi, L. Eusebio, L. Capelli, E. Boiardi, and R. Del Rosso,“Odour sample diffusion through double Nalophan� bags,”Chemical Engineering Transactions, vol. 40, pp. 169–174, 2014.
[28] S. Sironi, L. Eusebio, L. Dentoni, L. Capelli, and R. D. Rosso,“Ammonia diffusion through Nalophan bags,” Water Scienceand Technology, vol. 69, no. 3, pp. 486–494, 2014.
[29] M. Sulyok, C. Haberhauer-Troyer, and E. Rosenberg, “Obser-vation of sorptive losses of volatile sulfur compounds duringnatural gas sampling,” Journal of Chromatography A, vol. 946,no. 1-2, pp. 301–305, 2002.
[30] M. Sulyok, C. Haberhauer-Troyer, E. Rosenberg, and M.Grasserbauer, “Investigation of the stability of selected volatilesulfur compounds in different sampling containers,” Journal ofChromatography A, vol. 917, no. 1-2, pp. 367–374, 2001.
[31] S. L. Trabue, J. C. Anhalt, and J. A. Zahn, “Bias of tedlarbags in the measurement of agricultural odorants,” Journal ofEnvironmental Quality, vol. 35, no. 5, pp. 1668–1677, 2006.
[32] A. P. Van Harreveld, “Odor concentration decay and stability ingas sampling bags,” Journal of the Air and Waste ManagementAssociation, vol. 53, no. 1, pp. 51–60, 2003.
[33] J. Van Durme and B. Werbrouck, “Phase ratio variationapproach for the study of partitioning behavior of volatileorganic compounds in polymer sample bags: Nalophan casestudy,”Environmental Science andPollutionResearch, vol. 22, no.14, pp. 11067–11075, 2015.
[34] C. Wang, P.-C. Lai, S. H. Syu, and J. Leu, “Effects of CF4 plasmatreatment on the moisture uptake, diffusion, and WVTR ofpoly(ethylene terephthalate) flexible films,” Surface and Coat-ings Technology, vol. 206, no. 2-3, pp. 318–324, 2011.
[35] T. Zarra, M. Reiser, V. Naddeo, V. Belgiorno, andM. Kranert, “Acomparative and critical evaluation of different sampling mate-rials in the measurement of odour concentration by dynamicolfactometry,” Chemical Engineering Transactions, vol. 30, pp.307–312, 2012.
[36] W. Zhu, J. A. Koziel, L. Cai, D. Wright, and F. Kuhrt, “Testingodorants recovery from a novel metallized fluorinated ethylenepropylene gas sampling bag,” Journal of the Air and WasteManagement Association, vol. 65, no. 12, pp. 1434–1445, 2015.
[37] L. Eusebio, L. Capelli, and S. Sironi, “Electronic Nose Test-ing Procedure for the Definition of Minimum Performance
Requirements for Environmental Odor Monitoring,” Sensors,vol. 16, no. 9, pp. 1548–1565, 2016.
[38] Y. Hoshika, T. Imamura, G. Muto, L. J. Van Gemert, J. A. Don,and J. I. Walpot, “International comparison of odor thresholdvalues of several odorants in Japan and in the Netherlands,”Environmental Research, vol. 61, no. 1, pp. 78–83, 1993.
[39] “Reinhaltung der Luft,” Nachrichten aus Chemie und Technik,vol. 8, no. 23, pp. 355-355, 1960.
[40] J. Crank and G. S. Park, Diffusion in Polymers, Academic Press,London and New York, 1968.
[41] M. H. Klopffer and B. Flaconneche, “Transport Properties ofGases in Polymers: Bibliographic Review,” Oil Gas Science andTechnology, vol. 56, pp. 223–244, 2001.
[42] O. Zaouak, A. Ben Daoud, M. Fages, J.-L. Fanloand, and B.Auberta, “High Performance Cost Effective Miniature Sensorfor Continuous Network Monitoring of H2S,” Chemical Engi-neering Transactions, vol. 30, pp. 325–330, 2012.
[43] A. B. Thompson and D. W. Woods, “Density of amorphouspolyethylene terephthalate,” Nature, vol. 176, no. 4471, pp. 78-79, 1955.

Submit your manuscripts athttps://www.hindawi.com
Hindawi Publishing Corporationhttp://www.hindawi.com Volume 2014
Inorganic ChemistryInternational Journal of
Hindawi Publishing Corporation http://www.hindawi.com Volume 201
International Journal ofInternational Journal ofPhotoenergy
Hindawi Publishing Corporationhttp://www.hindawi.com Volume 2014
Carbohydrate Chemistry
International Journal ofInternational Journal of
Hindawi Publishing Corporationhttp://www.hindawi.com Volume 2014
Journal of
Chemistry
Hindawi Publishing Corporationhttp://www.hindawi.com Volume 2014
Advances in
Physical Chemistry
Hindawi Publishing Corporationhttp://www.hindawi.com
Analytical Methods in Chemistry
Journal of
Volume 2014
Bioinorganic Chemistry and ApplicationsHindawi Publishing Corporationhttp://www.hindawi.com Volume 2014
SpectroscopyInternational Journal of
Hindawi Publishing Corporationhttp://www.hindawi.com Volume 2014
The Scientific World JournalHindawi Publishing Corporation http://www.hindawi.com Volume 2014
Medicinal ChemistryInternational Journal of
Hindawi Publishing Corporationhttp://www.hindawi.com Volume 2014
Chromatography Research International
Hindawi Publishing Corporationhttp://www.hindawi.com Volume 2014
Applied ChemistryJournal of
Hindawi Publishing Corporationhttp://www.hindawi.com Volume 2014
Hindawi Publishing Corporationhttp://www.hindawi.com Volume 2014
Theoretical ChemistryJournal of
Hindawi Publishing Corporationhttp://www.hindawi.com Volume 2014
Journal of
Spectroscopy
Analytical ChemistryInternational Journal of
Hindawi Publishing Corporationhttp://www.hindawi.com Volume 2014
Journal of
Hindawi Publishing Corporationhttp://www.hindawi.com Volume 2014
Quantum Chemistry
Hindawi Publishing Corporationhttp://www.hindawi.com Volume 2014
Organic Chemistry International
ElectrochemistryInternational Journal of
Hindawi Publishing Corporation http://www.hindawi.com Volume 2014
Hindawi Publishing Corporationhttp://www.hindawi.com Volume 2014
CatalystsJournal of