h3: laying out large directed graphs in 3d hyperbolic space tamara munzner, stanford university
TRANSCRIPT

H3: Laying Out Large Directed Graphs in
3D Hyperbolic Space
Tamara Munzner, Stanford University

Introduction
• They present the H3 layout technique for drawing large directed graphs as node-link diagrams in 3D hyperbolic space.
• They impose a hierarchy on the graph by using domain-specific knowledge to find an appropriate spanning tree.
• Their placement decisions are based only on the spanning tree, but they support selective drawing of nontree links to show the general graph structure.
Introduction
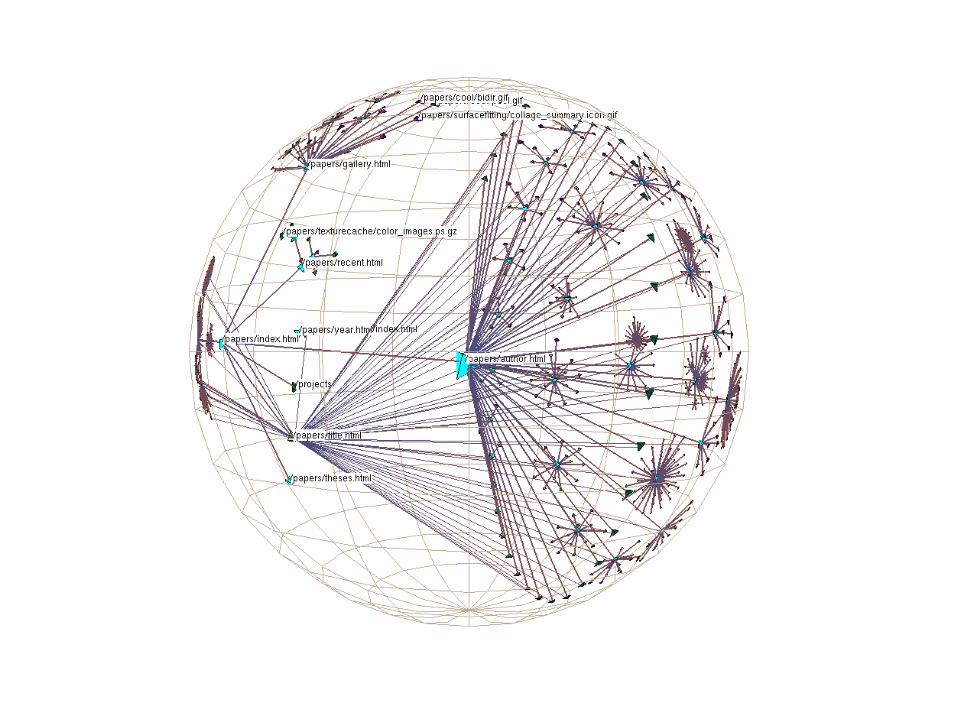
• In hyperbolic space, circumference and area increase exponentially instead of geometrically.
• We see an example of a hierarchical graph drawn in 3D hyperbolic space in Figure 1.

Related Work
• 2D Graph and Tree Drawing– The field of graph drawing has developed some effectiv
e solutions for handling relatively small graphs.
– Several systems devoted to Web visualization draw on the techniques of graph drawing and use abstract node-link diagrams in two dimensions.
– The early Webmap system constructs a spanning tree of the documents visited in a browsing session.

Related Work
• 3D Graph Drawing– The 2 dimensional landscape of the SGI fsn filesystem
viewer employed a very concrete metaphor where documents are represented as building-like structures which rise above a ground plane.
• 3D Tree Drawing– The cone tree system from Xerox PARC introduced on
e of the most influential techniques in 3D tree drawing.
• Focus+Context Techniques

Layout
• The H3 layout scheme consists of two parts:– first find an appropriate spanning tree from an input
graph– then determine a position in space for each element of
that tree in space
• Trees from Graphs– The choice of spanning tree is fundamental in shaping
the visualization of the graph.– We can construct a spanning tree based only on the link
structure of the graph.
Trees from Graphs
• We discuss examples in three domains: – Directory structure of a Unix file system
– Hyperlink structure of the Web
– Function call graphs

Tree Layout• In traditional cone trees nodes are laid out on a circle:
– the circumference of the disc at the bottom of the cone
• In the H3 algorithm we lay them out on a hemisphere:– a spherical cap which covers the cone mouth
• The algorithm requires two passes:– a bottom-up pass to determine the radius of the hemispheres– a top-down pass to lay out the child nodes on the surface of
their parental hemisphere


Tree Layout
• Bottom-up pass: – We know the radius of each of the child hemispheres a
nd must determine how large of a hemisphere to allocate for the parent hemisphere.
• Top-down pass: – We know at every level the radius of the parent hemisp
here but must decide how to lay out the children on its surface.

Sphere Packing• Their circles are of variable size, and they are
interested in a hemisphere as opposed to sphere.– Must be fast and repeatable.
• Their solution is to lay out the discs in concentric bands centered along the pole normal to the sphere at infinity.
• We sort the child discs by the size of their hemispheres. • This number, which is recursively calculated in the first
bottom-up pass, depends on the total number of their descendants, not just their first-generation children.


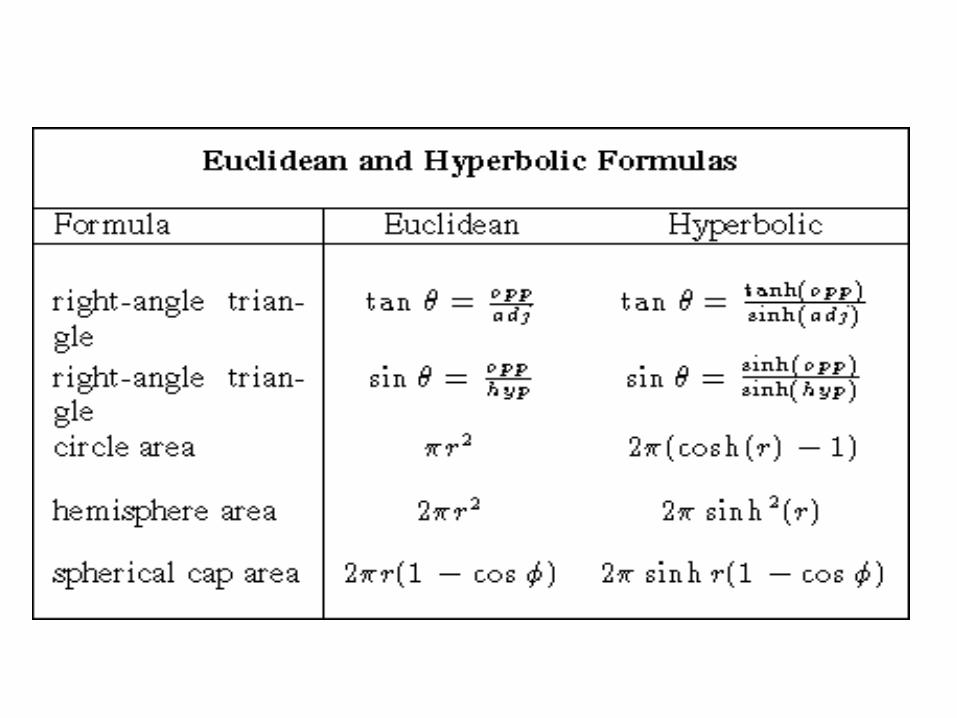
Hyperbolic Space
• Projection– There are two standard projections which map all
of hyperbolic space into a ball in euclidean space. • projective model• conformal ball model
– The 2D hyperbolic browser developed at Xerox PARC uses the conformal ball model.
– They use the projective model in our implementation.
Hyperbolic Space
– Transformations in the 3D projective model can be expressed as 4 x 4 matrices.
– The mapping from projective to conformal coordinates is straightforward.
Implementation
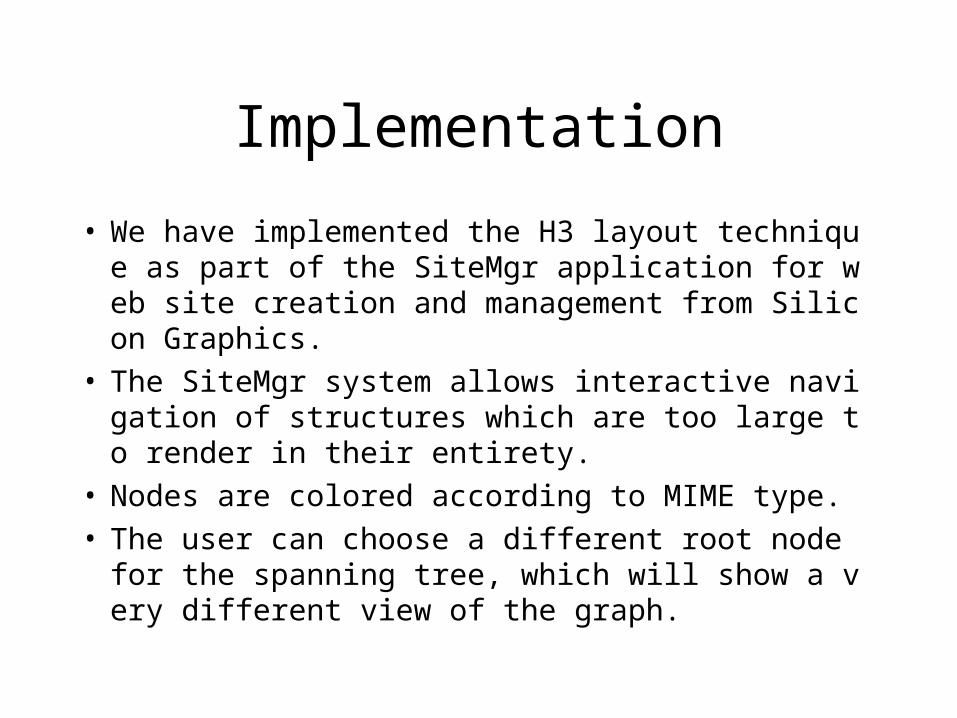
• We have implemented the H3 layout technique as part of the SiteMgr application for web site creation and management from Silicon Graphics.
• The SiteMgr system allows interactive navigation of structures which are too large to render in their entirety.
• Nodes are colored according to MIME type.• The user can choose a different root node for the spann
ing tree, which will show a very different view of the graph.

Implementation
• The SiteMgr system was designed and tuned for web site visualization.
• It is possible to import graphs into the hyperbolic viewer that were created from other kinds of data.

Analysis
• The H3 layout technique can easily handle thousands of nodes and has been tested on graphs of over 20,000 nodes.
• Hyperbolic methods are very effective at providing global overviews and displaying many nodes at once.
• We can categorize the drawn nodes into three classes:– main/labelled, peripherial, and fringe.

Analysis
• What we call peripheral nodes are small but still distinguishable as individual entities upon close inspection.
• Fringe nodes are not individually distinguishable, but their aggregate presence or absence shows significant structure of far-away parts of the graph.
• Another big advantage of moving from a 2D tree to a 3D graph is the ability to see non-tree links in context.

Future Work
• They would like to consider additional heuristics for finding reasonable spanning trees.
• They are also interested in alternative arrangements of child nodes on parental hemispheres.

Conclusion
• We have presented a new layout technique for visualizing very large directed graphs in 3D hyperbolic space.
• We compute a variation of a cone tree layout based on a spanning tree, and only draw nontree links for selected nodes on demand.

Appendix A: Layout Derivation
• The H3 layout method operates in two passes:– in the bottom-up pass we find an approximate radius fo
r each hemisphere.
– in the top-down pass we place children on the surface of their parent hemisphere.
• In this Appendix we present a detailed derivation of the radius rp of a parental hemisphere and the triple ( rp , , ) needed to place a child hemisphere on the surface of that parental hemisphere.

• Bottom-up pass:– We compute a target surface area Hp of a hemisphere at
level p by summing the areas of the disks at the bottom of the child hemispheres at level p+1.
– So euclidean radius rp would be
– The parent-child relationship is
22 pp rHA
2/pHA

• When we use the hyperbolic area formula , the hyperbolic radius of the parental hemisphere is
• The parent-child relationship becomes

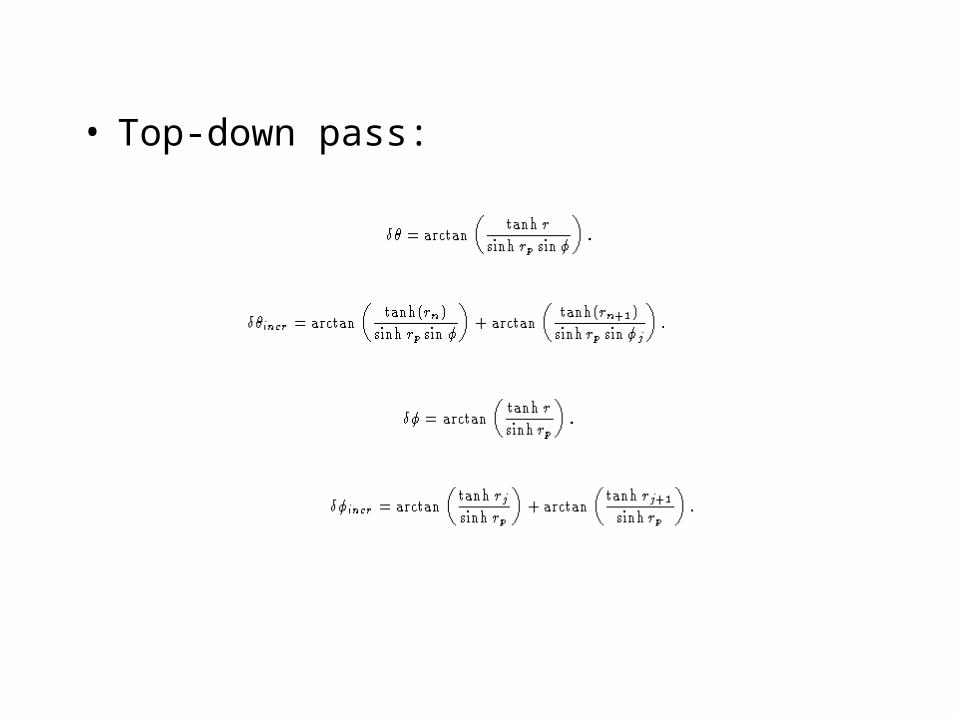
• Top-down pass: