habitat availability for amur tiger and amur leopard under changing climate and disturbance regimes...
TRANSCRIPT

Habitat Availability for Amur Tiger and Amur Leopard under
Changing Climate and Disturbance Regimes
PI: Hank Shugart (UVA)Co-Is: Tatiana Loboda (UMD), Guoqing
Sun (UMD), Dale Miquelle (WCS) Collaborators: Nancy Sherman (UVA), Mark Hebblewhite (UM), Zhiyu Zhang
(UMD)

Introduction

The Russian Far East (RFE)
WaterTree dominatedShrub dominatedHerbaceous cover dominatedHuman dominatedBarren and sparsely vegetated
Aggregated classes of the MODIS land cover product (MOD12Q1)
2000 0 2000 4000 km
Russia
Mongolia
China
Japan
N. Korea
S. Korea
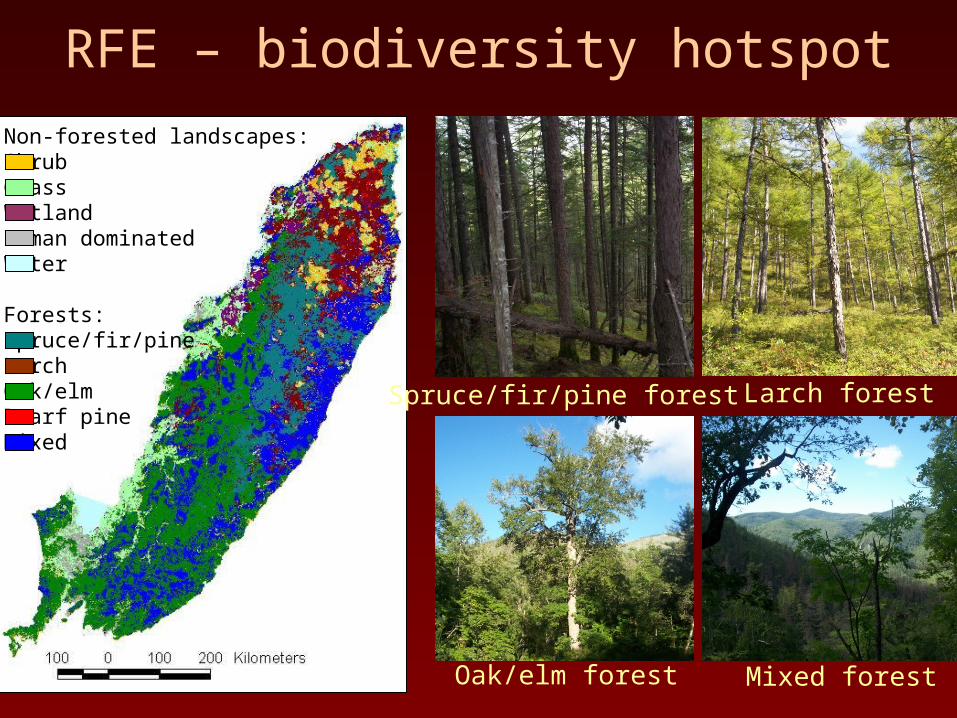
RFE – biodiversity hotspotNon-forested landscapes:Shrub GrassWetlandHuman dominatedWater
Forests:Spruce/fir/pineLarchOak/elmDwarf pineMixed
Spruce/fir/pine forest Larch forest
Oak/elm forest Mixed forest

RFE – home to critically endangered large carnivores
Amur tiger (Panthera tigris altaica)
Amur leopard (Panthera pardus orientalis)
Photo: Wildlife Conservation Society (WCS)

Climate Change Impact
Climate change
Human activity Natural processes
Disturbance Vegetation
Wildland fire

Project Components
Habitat Availability and Quality
VegetationVegetationUVA team
DisturbanceDisturbanceUMD team
Habitat SuitabilityHabitat SuitabilityWCS team

New results and developments

Modeling
Units: probability * 1000
Cumulative Annual Fire Occurrence Probability in the Amur Tiger Habitat in the Russian Far East
Improved landscape-level fire representation within the FAR EAST vegetation model
• Input fire data (2001-2008):• MODIS active fire detections (MOD/MYD14)• MODIS-based regional burned area product (Loboda et al., 2007)
• Methodology• Regression tree based “forest” of monthly trees
• Products (gridded 1 km)• Monthly mean fire probability• Cumulative annual fire probability

Mean Monthly Fire Occurrence Probability in the Russian Far East
April July October
Units: probability * 1000
Spring and fall fire occurrence:• linked to human activity or presence• reaches nearly 20% in areas of high population density or agricultural land use
Summer fire occurrence:• linked to distribution of dark coniferous forests and previously disturbed sites• on average lower probability of fire occurrence

Disturbance: reference dataset
Landsat-based high/moderate resolution (30m) database of disturbances in the RFE:
• covers 1972 – 2002
• time stamps (in broad categories)
• type of disturbance (logging, burn)

Disturbance: historical mappingMapping previous disturbances from present day distribution of land cover types:
• 46 MODIS-based metrics for decision tree (min, max, mean JJA, mean JF) from 2008:
• BRDF corrected surface reflectance (7 bands)• LST (day and night)• VI (NDVI, NBR)
• Masked out Human dominated landscapes (cropland,
cropland mosaic, urban) using MCD12Q1

Observed classes
mature tree
disturbance total %
total (pix)
Omission %
Predicted classes
mature tree 90.96 4.49 12.73 1837 9.04
disturbance 9.04 95.71 87.27 12592 4.29
total 100 100 100
total (pix) 1405 13024 14429
Commission % 30.43 1.01
Overall Accuracy = 95.2457%
Kappa Coefficient = 0.7622
Accuracy Assessment for Aggregated Classes

Accuracy Assessment for Full Classification
Class Omission % Commission %
ENF 6.5 31.0
DNF 27.1 47.9
MF 7.0 11.2
DBF 11.4 27.1
burn70 100.0 0.0
burn80 44.4 31.8
burn90 10.3 22.6
burn00 31.1 23.7
log80 78.6 53.9
log90 100.0 0.0
log00 100.0 0.0
Overall Accuracy = (10767/14427) 74.6309%
Kappa Coefficient = 0.6021

Habitat Suitability• Input data:
– snow track surveys for tiger and prey species collected in February-March 2005 (Stephens, 2006)
– GIS and RS data sources• SRTM DEM
• MODIS NPP (MOD17A2)
• MODIS snow cover (MOD10A2)
• Vegetation communities (GIS map)
• Proximity to various features (roads, protected areas, settlements)
• Etc
• Methodology: applied Resource Selection Functions (Boyce and McDonald 1999, Manly et al. 2002) to develop spatial predictions of the probability of use for the different prey and tigers using a used-unused sampling design.
• Tiger habitat rank also includes prey use of the habitat

Habitat Suitability: prey
Probability of species presence
0 1
Boar Moose Musk deer
Red deer
Roe deer
Sika deer

Habitat Suitability: tiger &
leopard
Amur Tiger
Amur Leopard
Probability of species presence
0
1 Probability of species presence
0
1

Integration of the components for final
assessment

Fire Danger ∑(ROI, PFB, FWI)
Fire Intensity∑(PFB, FWI)
Post Fire HR
ROI12 months
PFB3 seasons
FWIdaily
Pre FireHR
vegetation recovery
HR deer
HR boar
HR moose
HR tiger
11 succession stages
fullHR
mean
Habitat Fragmentation
Habitat ConversionPost Fire HR – Pre Fire HR
matrix
Post Fire Habitat Potential
3 X 3window
Stage HR
Tiger Risk5 seasons
VegetationStages
matrixFire Threat
UMD
UVAWCS
Climate Change Scenarios

Next steps
• Select a representative GCM– Resolution– Consistency of projections– Extreme events
• Integrated runs of all model components within the Fire Threat Modeling framework– Present – Future under A2 and B1 SRES projections

Acknowledgements
• NASA Earth System Science Fellowship
• NASA Interdisciplinary Science Program grant 06-IDS06-93: “Evaluation of Habitat Availability for Large Carnivores under a Changing Climate and Disturbance Regime: The Amur Tiger and Amur Leopard Case Study”