habitat fragmentation in forests affects relatedness -
TRANSCRIPT
Habitat fragmentation in forests affects relatedness andspatial genetic structure of a native rodent, Rattus lutreolus
HELEN C. STEPHENS,1,2* CHRISTINA SCHMUKI,2,3 CHRISTOPHER P. BURRIDGE4
AND JULIANNE M. O’REILLY-WAPSTRA1,2
1School of Plant Science, University of Tasmania, Private Bag 55, Hobart, Tas. 7001, Australia (Email:[email protected]), 2Cooperative Research Centre for Forestry, 3Tasmanian Institute ofAgriculture, University of Tasmania, and 4School of Zoology, University of Tasmania, Hobart,Tasmania, Australia
Abstract Habitat fragmentation can have a range of negative demographic and genetic impacts on disturbedpopulations. Dispersal barriers can be created, reducing gene flow and increasing population differentiation andinbreeding in isolated habitat remnants. Aggregated retention is a form of forestry that retains patches of forests asisolated island or connected edge patches, with the aim of ‘lifeboating’ species and processes, retaining structuralfeatures and improving connectivity. Swamp rats (Rattus lutreolus) are a cover-dependent species that are sensitiveto habitat removal. We examined the effects of aggregated retention forestry and forestry roads in native wetEucalyptus forests on swamp rat gene flow and population genetic structure. We characterized neighbourhood sizein unlogged forest to provide a natural state for comparison, and examined population structure at a range of spatialscales, which provided context for our findings. Tests of pairwise relatedness indicated significant differentiationbetween island and edge populations in aggregated retention sites, and across roads in unlogged sites. Spatialautocorrelation suggested a neighbourhood size of 42–55 m and revealed male-biased dispersal. We found nogenetic isolation by geographical distance at larger (>2.3 km) scales and populations were all significantlydifferentiated. Our results suggest that removal of mature forest creates barriers for swamp rat dispersal. Inparticular, roads may have long-term impacts, while harvesting of native forests is likely to create only short-termdispersal barriers at the local scale, depending on the rate of regeneration.
Key words: aggregated retention, gene flow, genetic diversity, microsatellite, road.
INTRODUCTION
The modification and loss of native habitat due toanthropogenic practices such as forestry are recog-nized as major threats to populations, species andecological processes worldwide (WCMC 1992). Frag-mentation of forest can reduce the quantity andquality of habitat for forest-dependent species, disruptnatural processes and impede animal movementbetween suitable habitat (Saunders et al. 1991;Zanette et al. 2000; Siitonen 2001; Lancaster et al.2011). Impeded movement of individuals and theirgenes can have a range of demographic and geneticimpacts, including increased genetic differentiationbetween populations, reduced genetic variation withinpopulations and altered within-fragment populationstructure (Frankham et al. 2002; Stow & Sunnucks2004a,b). These impacts are more likely to be experi-enced when retained habitat fragments are smaller andmore isolated, and, if dispersal and recolonization ofpatches remain impeded, population or species
extinction may result (Frankham et al. 2002; Brad-shaw & Marquet 2003).
Current forest harvest practices such as clear-fellingand burning of residue changes mature, connected andstructurally complex landscapes into patchwork land-scapes with large areas of exposed, often inhospitableland that may be difficult to traverse, particularly byspecies that have limited dispersal capabilities or obli-gately inhabit mature intact forest (Sekercioglu et al.2002; Brouat et al. 2003; Henle et al. 2004; Schmukiet al. 2006; Bentley 2008). An alternative harvestingpractice to clear-felling is retention forestry (alsotermed variable retention, green-tree retention), whichwas developed with the aims of retaining structuralcomplexity at the local scale, providing ‘lifeboats’ forspecies, and providing connectivity within productionforest landscapes (Franklin et al. 1997; Gustafssonet al. 2012). While there is a general consensus thatvariable retention harvesting is beneficial for speciesrichness and abundance compared to clear-felling,levels of success vary among species and taxa (Rosen-vald & Lohmus 2008). Aggregated retention (ARN) isa form of retention forestry that retains patches ofunlogged forest alongside the harvested edge (bounded
*Corresponding author.Accepted for publication September 2012.
Austral Ecology (2013) ••, ••–••
bs_bs_banner
© 2013 The Authors doi:10.1111/aec.12001Austral Ecology © 2013 Ecological Society of Australia

by unlogged forest) and/or as ‘islands’ (isolated withinthe harvested matrix). The objectives of ARN are toincrease connectivity within the landscape by reducingdistances between forested patches, and to retain struc-tural complexity during subsequent regrowth. Aggre-gated retention has been adopted in many systemsworldwide (see reviews by Rosenvald & Lohmus 2008;Gustafsson et al. 2012). However, there have been fewstudies on the impact of ARN on ground mammals(Sullivan & Sullivan 2001; Klenner & Sullivan 2003;Gitzen et al. 2007; Sullivan et al. 2008), particularly inthe Southern Hemisphere systems (Lindenmayer et al.2010;Stephens et al. 2012), and to our knowledge therehave been no published studies on the genetic implica-tions of this practice.
The swamp rat (Rattus lutreolus Thomas 1882) is asmall (~110 g), mostly nocturnal rodent with a dietpredominantly consisting of leaf and stem material,but also fungi, insects and seeds (Watts & Braithwaite1978; Driessen 1987; Norton 1987a). Breeding occursover spring–summer (September to March), withfemales raising one or more litters of three to six young(Green 1967), and longevity is 1–2 years, with a typicalgeneration time of 1 year. Swamp rats are a wide-spread, relatively common species across Tasmania(Norton 1987a), but are restricted to habitats withdense cover (Fox & Monamy 2007), and are rarelyfound in cleared areas (Norton 1987b; Monamy1995). Despite being a common species, there havebeen few population studies and little is known of theirdispersal capabilities or population structure. Swamprats have been previously documented in ARNunlogged areas (islands and edges), but very rarely inthe harvested matrix (Stephens et al. 2012). Our anec-dotal (capture-mark-recapure, CMR) evidence sug-gests that swamp rats may rarely move across theharvested matrix (one crossing from 88 recaptures inARN) or other cleared areas such as roads (six cross-ings from 96 recaptures in unlogged sites with roads),although these observations may not be repeatedacross generations, or result in gene flow (i.e. thereproductive success of dispersing individuals).
In this study we examined and compared geneticdiversity and population structure of swamp rats inARN and unlogged sites.We hypothesized that geneticdiversity would be reduced within ARN sites relative tounlogged sites and expected that island populationswould exhibit higher levels of genetic relatedness com-pared to populations in contiguous forest. Roads havebeen shown to pose a barrier for dispersal in manysmall mammal species, including narrow, unpavedroads or seldom used roads (Barnett et al. 1978;Swihart & Slade 1984; Rico et al. 2007; McGregoret al. 2008), and our own anecdotal evidence suggeststhat swamp rats are reluctant to cross roads.Therefore,we also hypothesized that roads within unlogged siteswould present barriers to dispersal in this species, and
hence similarly affect population genetic variation. Toassist in the interpretation of our localized populationanalyses, we also examined structuring at broader geo-graphical scales, involving spatial comparisons amongARN and unlogged forest replicates.
METHODS
Study site and sampling
Our study was conducted in native old growth wet Eucalyptusforests and recently harvested sites in State Forest in tworegions of southern Tasmania, Australia: the Styx (42.81°S,146.65°E) and Huon (43.11°S, 146.76°E) Valleys (Fig. 1).The current molecular study contributes to a larger investi-gation of the impact of different forestry practices on theabundance of two sympatric native rodents that occupy dif-ferent habitat niches, swamp rats (R. lutreolus) and long-tailed mice (Pseudomys higginsi). Detailed background on thetreatments, study sites and trapping protocol are provided inStephens et al. (2012). We focused our genetic study onswamp rats as they appeared largely restricted to unloggedhabitat, while long-tailed mice were equally abundant inunlogged and harvested areas.
In this genetic study we collected data from four replicatesof two different forestry treatments: aggregated retention sites(ARN; Fig. 2a) and unlogged native forest sites (UNL;Fig. 2b). Within ARN, trapping was conducted in threehabitat types: the harvested matrix (ARN-Harvest), ‘island’aggregates (isolated patches surrounded by the harvestedmatrix; ARN-Island) or ‘edge’ aggregates (patches of forestconnected to the surrounding forest;ARN-Edge).Aggregatedretention sites were harvested in 2005/2006, with regenera-tion burning occurring in 2007. Multiple island aggregates of0.6–2.6 ha were typically retained, except in one site whereonly one large island aggregate of 3.3 ha was retained. Thedistance between ARN islands and forested edges is typically80–150 m (Scott et al. 2011). All UNL retained old growthforest elements, including mature trees, and had been leftrelatively undisturbed from harvesting practices for more than70 years.Three UNL had unpaved roads bisecting them.Thefourth UNL site was in contiguous forest. In each site,54 trapswere set for three nights in a configuration of nine plots withsix traps each. In UNL, the nine plots were randomly allocatedacross the site. InARN, three plots were set in each of the threehabitat types: ARN-Harvest, ARN-Island and ARN-Edge.Each site was trapped for three nights in the post-dispersalwinter period from May to July 2009 (3–4 years post-harvest)and again in winter 2010 (April to July;3888 total trap nights),with additional trapping in ARN (1152 trap nights) inNovember/December 2009 (at the start of the breedingseason) to increase sample sizes. Additional trapping wasconducted in one UNL site, UNL-H1, in October 2010 (714trap nights).
DNA extraction
An ear tissue sample was collected from each newly encoun-tered swamp rat (n = 181) using a 2-mm biopsy punch.
2 H. C. STEPHENS ET AL.
© 2013 The Authorsdoi:10.1111/aec.12001Austral Ecology © 2013 Ecological Society of Australia

Samples were stored at room temperature in 100% ethanol.DNA was extracted from the tissue samples using GenCatchGenomic DNA Extraction Kits following the tissue protocol(Epoch Biolabs Inc.).
Genetic marker selection
To date, microsatellite markers had not been developed forswamp rats. Therefore, we tested 17 microsatellite markersthat had been developed or tested on other Rattus species(Table 1). Thirteen loci originated from Rattus fuscipes greyiiand had undergone testing for cross-species amplification onone R. lutreolus individual (Hinten et al. 2007). The remain-ing four loci originated from consensus Rattus sequences(Serikawa et al. 1992) and were previously tested onR. fuscipes (Hewitson 1997; Lindenmayer & Peakall 2000).We tested for cross-species amplification and polymorphismof all 17 loci on 12 swamp rats. Readily scorable markerswhich exhibited polymorphism were then genotyped for allindividuals.
Microsatellite PCR and scoring
The forward primer of each locus was labelled with a fluo-rescent dye using 6-FAM, VIC, NED or PET. The 5′ end of
reverse primers was modified to read ‘GTTT’ followingBrownstein et al. (1996). Multiplexes of four to six loci perreaction (Table 1) were amplified using QIAGEN MultiplexPCR Kits. PCR amplifications were carried out in 10-mLreactions containing DNA template (3.4–49.6 ng mL-1),0.05 mM primer mix (Table 1) and 1¥ QIAGEN MultiplexPCR Master Mix (containing 3 mM MgCl2). The loci wereamplified using a modified version of the thermal cyclingprotocol recommended by QIAGEN; an initial activationstep of 15 min at 95°C was followed by a three-step cycle(repeated 35 times) of denaturation (94°C for 30 s), anneal-ing (57°C for 90 s) and extension (72°C for 60 s). The laststep was a final extension of 60°C for 30 min. Fragmentanalysis was performed by the Australian Genome ResearchFacility on an AB3730, using LIZ500 size standard.Scoring was performed using Genemapper ver. 3.7 (AppliedBiosystems).
Hardy–Weinberg Equilibrium and GenotypicDisequilibrium
To ensure the suitability of loci for population studies ofswamp rats, we tested each site population for deviationsfrom Hardy–Weinberg Equilibrium and Genotypic Disequi-librium in GENEPOP (web ver. 4.1.10; Raymond & Rousset
Fig. 1. Location of study sites in the Huon and Styx Valleys in southern Tasmania.There are four replicates of each treatment,two in each region. The site codes correspond to the treatment (aggregated retention, ARN_; unlogged native forest, UNL_),region (Huon, H; Styx, S) and replicate within that treatment and region (1 or 2).
SWAMP RAT GENE FLOW IN FRAGMENTED FORESTS 3
© 2013 The Authors doi:10.1111/aec.12001Austral Ecology © 2013 Ecological Society of Australia

Fig. 2. Examples of the trapping design used in (a) aggregated retention (ARN) and (b) unlogged (UNL) sites. Each rectanglerepresents a trapping plot of six trap stations.The numbers next to each plot represent the number of individuals captured in thatplot. Typically, nine plots were used per site. In ARN (e.g. ARN-S1), three plots were set in each of the three habitat types, asdepicted by the different shaded boxes: Edges (dark), Islands (medium) and Harvested matrix (white). In this UNL site,UNL-H1, nine plots were set for the genetic study (dark boxes) and eight addition plots (dotted boxes) were set for a separatestudy, but samples were collected and used in this study.
4 H. C. STEPHENS ET AL.
© 2013 The Authorsdoi:10.1111/aec.12001Austral Ecology © 2013 Ecological Society of Australia

1995) and calculated expected and observed heterozygositiesin GenAlex 6.41 (Peakall & Smouse 2006). Multiple com-parisons used sequential Bonferroni corrections to determinestatistical significance, with an a of 0.05.
Genetic diversity and explanatory variables
For each site, the following genetic diversity variables werecalculated: the fixation index, FIS, representing the correla-tion of alleles within an individual relative to the subpopula-tion within which it occurs (FSTAT 2.9.3; Goudet 1995);allelic richness (AR; FSTAT 2.9.3); genotypic diversity (GD;GenoDive 1.1, Meirmans & Van Tienderen 2004); observed(HO) and expected (HE) heterozygosity (GenAlex 6.41); andaverage relatedness (R) among all individuals within the site(GenAlex 6.41; PopTools 3.2, Hood 2010;Table 2).To inves-tigate the influence of treatment (ARN vs. UNL) and region(Huon vs. Styx) on genetic diversity, we ran generalizedlinear models with the response variables FIS, AR, R and GDusing PROC GLM in SAS (SAS Institute Inc. 2008).
Genetic structure
To test whether spatial population structuring could be con-founded by temporal genetic variation, samples were dividedby year of capture. Some individuals were captured in both2009 and 2010 and were included in both groups. Withineach site, the two temporal samples were tested for differen-tiation using exact tests of genic (allele) frequencies, and bycalculating FST in GENEPOP 4.1.10.
To investigate spatial genetic structure and neighbourhoodsize of swamp rats in continuous (UNL) habitat, spatialautocorrelation analyses were completed in GenAlex 6.41using 999 permutations and trap station location data. Sepa-rate analyses of males and females were also conducted forsite UNL-H1 (n = 62) but not UNL-S2 (n = 21), owing tosample size. Mantel tests in GENEPOP 4.0.10 were used totest for genetic isolation by geographical distance amongsites, based on the logarithm of geographical distance andFST/(1 - FST) (Rousset 1997).
To investigate the potential of cleared areas (harvestedmatrix and roads) as barriers to dispersal, we tested whether
Table 1. Locus characteristics for swamp rats, Rattus lutreolus, in southern Tasmanian wet Eucalyptus forests
LocusSourcespecies
Primer5′ end of reverse primer
appended to read GTTT†
Primerconcentration
(mM)Multiplex
group
Sizerange(bp)
No. ofalleles HWE HE HO
FGA Rattus‡ F: CGTGTGGAAATACTTACAAGCAR: CTGCAGACTGATTTGCTCATAA
0.025 4B 95–129 14 <0.001* 0.453 0.456
PLANH Rattus‡ F: GGGATCTTGCCAAGGTGAR: CGGCTTCTGAATGTATTGGA
0.050 4B 134–142 5 0.053 0.601 0.579
RfgCT2B R.f. greyii§ F: CCTTTGGCTCCTGCACCCCAR: GTGCCAGGGAGCGTGGGCT
0.100 4B 307–312 6 <0.001* 0.430 0.326
RfgCTGT1B R.f. greyii§ F: AGGGGATCTAGGGCCTTCTGCAR: TCCACGACATGATGCTCTGTTACAA
0.200 2A 360–408 19 0.508 0.566 0.610
RfgD1 R.f. greyii§ F: ATGATGGTGAGGGCCACGCR: TTGAAACCAACTTCGAGGCAGA
0.050 2A 129–171 16 0.115 0.818 0.883
RfgG3 R.f. greyii§ F: TGCTCCTTTCCCTGGGCGAR: TCTTTGTGCGGCCCTTTCAT
0.050 2A 203–253 28 0.019 0.853 0.864
RfgL3 R.f. greyii§ F: GGCAATGCCTACACTCGTGCTTTR: TCCCAAGCCTGTGGCGAT
0.050 3B 205–237 12 0.022 0.645 0.688
RfgL5 R.f. greyii§ F: TGCCCTCTTCTGGCCATGTTR: TGTTTCCCTCTGTGTATTAAGGGCT
0.050 3B 116–132 7 0.048 0.716 0.697
RfgM8 R.f. greyii§ F: CAAGAAAATTGGGTGTGGGAGGR: GCATCTTGCTATGGTGGTACACAG
0.050 4B 263–299 7 0.580 0.539 0.624
RfgO3 R.f. greyii§ F: GCAGGCACTGCATTGCACGR: ATCCCCCACCCATCACAGG
0.050 3B 383–443 34 0.002* 0.866 0.828
RfgO6 R.f. greyii§ F: TGTGCTGAAAATTCTTTTTTGAGTTTR: GCTTTCTGGGTGGCCTGCTT
0.050 3B 301–309 5 0.379 0.121 0.129
CPB¶ Rattus‡ F: GGTGCTAGTAGACAATAAGATAGATR: TTCATGAGTTTTCACTGTTTGC
0.300 (3B) – – – – –
CRYG¶ Rattus‡ F: CCCAGAAATATGTATTTTTACAAGCR: GCCAGAGCTATGTAGAGAGACC
0.050 (3B) – – – – –
RfgC3¶ R.f. greyii§ F: GTTCAGTAGCTGTGTGGGGCCAR: CAGCTGCCAAAAGTGCCCC
0.050 (2A) – – – – –
RfgCTG1H¶ R.f. greyii§ F: GGCTCCAAGCACCACCGGGR: AGCTCAGCAGTATGCCCTTGGGA
0.050 (1) – – – – –
RfgG4¶ R.f. greyii§ F: CCATGTATCCCTGGCTGGCCR: CTTCGACATGCAAGGCACCAA
0.050 (1) – – – – –
RfgW6¶ R.f. greyii§ F: GCGCCTGACGAGGAGTCTCTTR: CAAGACCATGTCTTCAAAAAAGTAGCA
0.050 (4) – – – – –
Seventeen loci from other Rattus species were tested for cross-species amplification and polymorphism.The size range (bp), number of alleles, probability of deviationfrom Hardy–Weinberg equilibrium (HWE, Bonferroni adjusted, values shown for the lowest site P-value), and expected (HE) and observed (HO) heterozygosity areshown for the 11 successfully amplified and scored loci. *Indicates a significant deviation from HWE, attributable to one site, UNL-H1. †Brownstein et al. (1996).‡Serikawa et al. (1992), Lindenmayer and Peakall (2000). §Hinten et al. (2007). ¶Loci did not amplify reliably and were not used in further analyses.
SWAMP RAT GENE FLOW IN FRAGMENTED FORESTS 5
© 2013 The Authors doi:10.1111/aec.12001Austral Ecology © 2013 Ecological Society of Australia

pairwise relatedness differed between individuals (i) occupy-ing different habitat types within ARN and (ii) separated byroads in three UNL sites, using the Queller and Goodnightcoefficient (Queller & Goodnight 1989) in GenAlex 6.41. Ineach ARN site, pairwise relatedness was calculated based oncomparisons among individuals within, but not between,each ARN island and each ARN edge plot (a spatially distinctgroup of traps, as described earlier), and within UNL sites wecalculated the pairwise relatedness for individuals within sub-populations (‘same’ side of road) and between subpopula-tions (‘different’ side of road). The relatedness values fromeach site were tested within each site, and also pooled oversites for each treatment (i.e. ARN or UNL), with averagestested in PopTools 3.2. Average and resample functions wereused to generate real and randomized mean relatednessvalues, respectively, and the Monte Carlo function calculated1000 randomized relatedness differences and the number ofrandomized relatedness differences that was greater than thereal relatedness difference.
At larger spatial scales, genetic differentiation between allpairs of site populations (ARN and UNL) was tested usingexact tests of genic (allelic) frequencies in GENEPOP 4.1.10, with Fisher’s method used to combine P-values acrossloci. Population structuring was also quantified via the cal-culation of FST and G″ST for all sites and within Huon andStyx regions separately using GenoDive 2.0b22. STRUC-TURE 2.3.3 (Pritchard et al. 2000) was used to test for thepresence of population structuring without requiring the apriori assignment of individuals to populations.This programassigns individuals to a number of populations (K) probabi-listically using a Bayesian Markov chain Monte Carlo(MCMC) algorithm. The parameters used were admixedancestry and correlated allele frequencies with no a prioripopulation source assumed, and burn-in and run lengths of100 000 each. Given that each of the eight sites couldrepresent a distinct population, we ran K = 1 to K = 8(10 iterations per K) plus three additional K (9, 10, 11), asrecommended by Evanno et al. (2005), to test for any crypticstructuring. The optimal value of K was estimated using thedelta K value based on the second order rate of change inLn (P(X|K) (Evanno et al. 2005), calculated in STRUC-TURE HARVESTER (Earl & vonHoldt 2012).We tested forfurther differentiation within the initial clusters identified as
advocated by Evanno et al. (2005), using the methods asdescribed above, with a reduction in number of K tested asK = number of collection sites in cluster + 3. Plots werecreated using mean proportional membership (over 10 runs)to each cluster as calculated in CLUMPP 1.1.2 (Jakobsson& Rosenberg 2007) and visualized in DISTRUCT 1.1(Rosenberg 2004).
RESULTS
Over two trapping seasons, 181 swamp rats weresampled from eight sites. All samples yielded reliablegenotypes, with only three individuals missing geno-types, and only at a single locus. Genotyping alsorevealed two samples were likely recaptures of indivi-duals that had lost their identification tags from theprevious season, as their genotypes were identical andevidence of the initial ear biopsy injury remained.There-fore, we used 179 individuals in this study: 69 from fourARN sites and 110 from four UNL sites (Table 2).
Microsatellite characteristics
Eleven of the 17 microsatellite loci showed reliablePCR amplification, were polymorphic, and producedgenotypes usually consistent with Hardy–Weinbergand linkage equilibrium (Table 1). While three locishowed deviation from Hardy–Weinberg equilibriumat one site (UNL-H1), this is probably evidence for theWahlund effect (i.e. the ‘site’ actually comprised mul-tiple populations), and hence these loci were retainedfor analyses. Of the six excluded loci, five either did notPCR amplify reliably or produced problematicco-amplified products, and one locus showed signifi-cant heterozygote deficit (RfgC3). All 11 successfulmicrosatellite loci were used in testing genetic diversityand population structure.
Table 2. Genetic diversity estimates for Rattus lutreolus in unlogged forest (UNL) and aggregated retention (ARN) sites in tworegions of Tasmanian State Forest: the Huon (H) and Styx (S) Valleys (see Fig. 1 for map locations)
Site type Region Site code n FIS AR R GD HE HO
ARN Huon ARN-H1 25 0.017 5.12 0.186 0.929 0.626 0.647ARN Huon ARN-H2 14 -0.013 5.71 0.087 0.960 0.560 0.571ARN Styx ARN-S1 20 0.021 5.45 0.118 0.900 0.601 0.618ARN Styx ARN-S2 10 -0.002 4.75 0.121 0.950 0.573 0.591UNL Huon UNL-H1 62 0.071 5.55 0.063 0.984 0.654 0.613UNL Huon UNL-H2 14 0.051 5.19 0.111 0.929 0.593 0.584UNL Styx UNL-S1 13 0.010 4.71 0.115 0.923 0.591 0.608UNL Styx UNL-S2 21 -0.012 4.09 0.129 0.952 0.608 0.630
The number of individuals (n), fixation index (FIS), allelic richness (AR), relatedness (R), genotypic diversity (GD), andexpected (HE) and observed (HO) heterozygosity are shown for each site population. Bold text indicates a significant within-siteeffect.
6 H. C. STEPHENS ET AL.
© 2013 The Authorsdoi:10.1111/aec.12001Austral Ecology © 2013 Ecological Society of Australia

Influence of treatment on genetic diversity
There were no significant differences between theHuon and Styx for FIS (F1,6 = 1.88, P = 0.220), AR(F1,6 = 2.08, P = 0.199), R (F1,6 = 0.11, P = 0.748) andGD (F1,6 = 1.12, P = 0.330).There were no significantdifferences between UNL and ARN for R (F1,6 = 1.42,P = 0.278), AR (F1,6 = 0.07, P = 0.801) and GD(F1,6 = 0.52, P = 0.496). FIS was significantly higher inUNL (0.038 � 0.011 SE) than in ARN (-0.003 �0.011 SE; F1,6 = 6.84, P = 0.040), which is most likelydriven by the Wahlund effect seen in UNL-H1(Table 2).
Genetic structure
Exact tests and FST calculations revealed no temporalpopulation differentiation within sites (FST < 0.007,
P > 0.16 for all). Therefore, any differentiation withinsites is attributable to spatial effects. Spatial autocor-relation analyses from the two UNL sites with largestsample sizes showed that genotypes were moresimilar over shorter distances and indicated neigh-bourhood sizes of approximately 40–60 m (Fig. 3a,b).At a finer scale, spatial autocorrelation usingincreasing first-distance-bin r-values (Peakall et al.2003) showed relatedness was significantly higher thanexpected up to 42 m in UNL-S2 (r = 0.091, P =0.001) and up to 55 m in UNL-H1 (r = 0.034, P =0.001; Fig. 4a,b). In UNL-H1, the analysis wasrepeated separately for females (n = 36) and males(n = 26); females showed a neighbourhood size of56 m (r = 0.072, P = 0.001; Figs 3c,4c), whereasmales showed no significant change in relatedness overdistances up to 600 m (the maximum range of com-parisons for males; Fig. 3d).
–0.08
0.00
0.08
0.16
40 140 240 340 440
rDistance classes (m)
(a)
–0.04
0.00
0.04
0.08
50 150 250 650550450350
50 150 250 650550450350
r
Distance classes (m)
(b)
0
0.06
0.12
r
Distance classes (m)
(c)
0
0.06
0.12
r
Distance classes (m)
(d)
–0.06
–0.0650 150 250 650550450350
Fig. 3. Spatial autocorrelograms for swamp rats in unlogged native forest sites at the site scale in (a) UNL-S2, (b) UNL-H1for all individuals, (c) UNL-H1 females and (d) UNL-H1 males.When r is above or below the confidence intervals, relatednessis significantly higher or lower than one might expect by chance. Solid lines, autocorrelation coefficient (r, �SE); broken lines,upper and lower confidence intervals.
SWAMP RAT GENE FLOW IN FRAGMENTED FORESTS 7
© 2013 The Authors doi:10.1111/aec.12001Austral Ecology © 2013 Ecological Society of Australia

Overall, individuals were more closely related withinARN-Islands (R = 0.045) than in ARN-Edges (R =0.038; P < 0.001). When we looked at each site indi-vidually, this was confirmed in two sites, ARN-H1(P < 0.001) and ARN-H2 (P < 0.001), but not forARN-S1 (P > 0.05) orARN-S2 (P > 0.05).These lattertwo sites had very small sample sizes for ARN-Islands(n = 3 and n = 2, respectively). Overall, individualsshowed significantly higher relatedness with other indi-viduals on their side of the road in UNL sites(R = -0.007) compared to those on the other side(R = -0.035; P < 0.001). This was also confirmedduring analysis of individual sites (P < 0.001 for allsites).
At larger spatial scales, exact tests using allele fre-quencies showed significant differentiation for all pair-wise population comparisons (c2 > 50, P < 0.001 forall comparisons). Population structuring among allsites was quantified as FST = 0.048 (P < 0.001) and
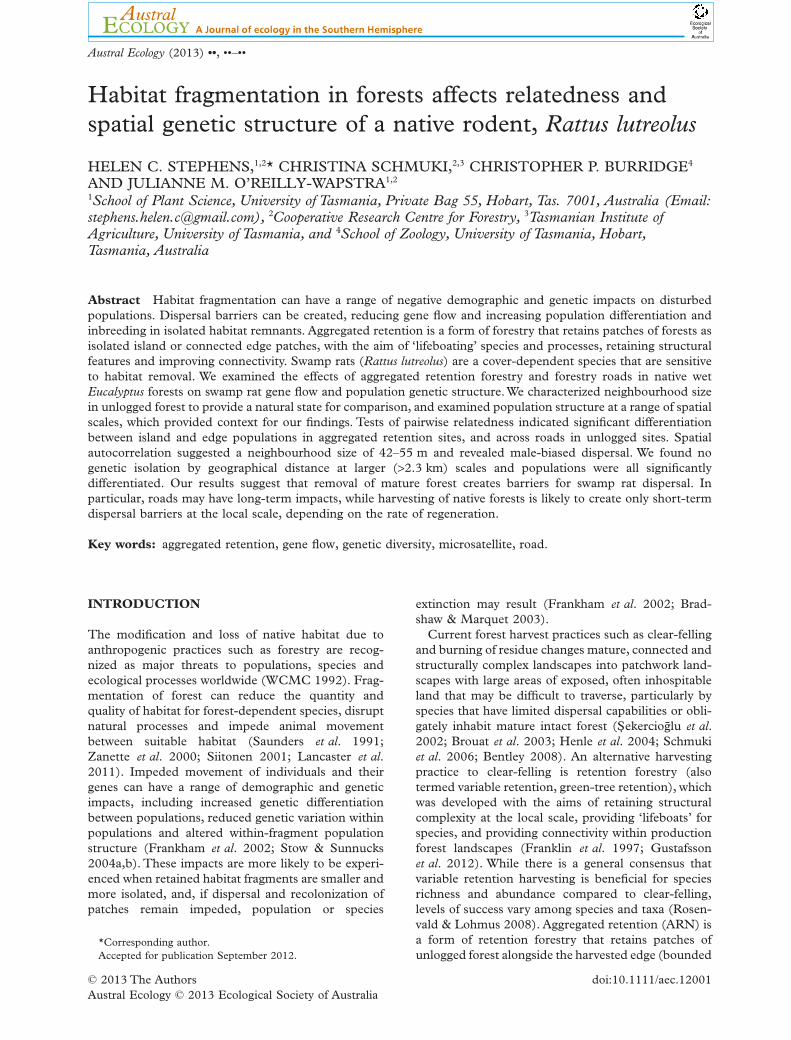
G�ST = 0.145 (P < 0.001), and were similar for theHuon (FST = 0.051, P < 0.001; G�ST = 0.176, P <0.001) and Styx (FST = 0.031, P < 0.001; G�ST =0.108, P < 0.001) regions. There was no evidence ofisolation by distance with respect to sites across theentire study range (P = 0.270), nor within regions(Styx, P = 0.136; Huon, P = 0.963) or when separatingthe sexes (female, P = 0.306; male, P = 0.121).STRUCTURE analysis did not reveal any crypticpopulation structuring among individuals within thesesites, but also failed to resolve the majority of sites.Theoptimal number of clusters (K) was two using the deltaK method, with UNL-H1 distinguished from the othersites (Fig. 5a). When we separated UNL-H1 from therest of the data and reran STRUCTURE analysis onthe seven site cluster, the Evanno method returned anoptimal K = 2.The two clusters were: (i) the two UNLsites and one ARN site in the Styx region (UNL-S1,UNL-S2, ARN-S1), and (ii) the three sites remaining
0.000
0.080
0.160
r
Distance classes (m)
(a)
0.000
0.040
0.080
r
Distance classes (m)
(b)
0.000
0.080
0.160
r
Distance classes (m)
(c)
20 25 30 35 40 45 50 55 60 65 70
20 25 30 35 40 45 50 55 60 65 70
25 30 35 40 45 50 55 60 65 70
–0.080
–0.040
–0.080
Fig. 4. Autocorrelation for increasing first distance classes in unlogged sites, indicating higher relatedness up to (a) 45 m inUNL-S2, (b) 55 m in UNL-H1 for all individuals and (c) 56 m for UNL-H1 females only. �, autocorrelation coefficient (r,�SE); , upper and lower confidence intervals.
8 H. C. STEPHENS ET AL.
© 2013 The Authorsdoi:10.1111/aec.12001Austral Ecology © 2013 Ecological Society of Australia
in the Huon region and one ARN Styx site (ARN-S2;Fig. 5b).
DISCUSSION
Local fragmentation due to forest harvestingand roads leads to increased relatedness
Comparisons within sites indicated that harvestedareas, comprising either regenerating forest orunsealed roads, represented a significant barrier toswamp rat dispersal, as relatedness was significantlyhigher among individuals that were separated fromother individuals by harvested areas or roads. In ARN,higher relatedness in ARN-Islands compared to ARN-Edges indicated that even within a few generations(three to five in our study) there are genetic impacts ofbarriers to gene flow.The higher levels of relatedness inthe ARN-Islands were likely to represent a higher pro-portion of close relatives remaining in the forestedislands, rather than a product of individuals matingwith close kin by choice, as other mammals haveshown avoidance of reproduction between close kin inisolated patches (Banks et al. 2005). Swamp rats preferhabitats with dense vegetation cover (Fox & Monamy2007; Stephens et al. 2012), and individuals may beunwilling to disperse through the harvested matrix.During our broader study we only witnessed one emi-
gration event across a harvested matrix (between twoislands), and the genetic data indicated that gene flow(movement and reproduction, as opposed to justmovement) was low in ARN. Not all ARN islands werepopulated by swamp rats, and previous work hasshown no relationship between retained island size andpresence or abundance of small mammals (Linden-mayer et al. 2010; Stephens et al. 2012). This suggeststhat swamp rats were not recolonizing islands despitethe provision of suitable habitat within these islands(Stephens et al. 2012).
The results of this study are consistent with obser-vations from a closely related species in the southeastof mainland Australia, R. fuscipes, when it was sub-jected to experimental population reduction within afragmented landscape over 24 months (Peakall &Lindenmayer 2006). Most R. fuscipes populationswithin fragments showed some population recovery,but new individuals within remnant habitats were pre-dominantly provided by offspring from residual indi-viduals rather than immigrants, highlighting thenegative impact dispersal barriers can present. Theimportance of continuous habitat connection is sup-ported by other studies of R. fuscipes, where movementbetween habitat patches connected by habitat corri-dors was observed (Macqueen et al. 2008; Holland &Bennett 2011).
While negative impacts of ARN on the populationgenetics of swamp rats were apparent, it should be
(a)
(b)
Fig. 5. Estimated population genetic structure from STRUCTURE analyses for (a) all individuals from eight sites, assumingclusters K = 2, and (b) individuals from the larger cluster in (a), assuming K = 2. No prior population data were included in theanalyses. Each individual is represented by a thin vertical line divided into K colours that represent an individual’s membershipin K clusters. Thick black lines separate individuals collected from different sites. The order of sites in this graph is based ongeographical location and distance (see Fig. 1). From left to right on this graph, Huon sites are ordered from south-east tonorth-west and Styx sites are ordered from south-west to north-east.
SWAMP RAT GENE FLOW IN FRAGMENTED FORESTS 9
© 2013 The Authors doi:10.1111/aec.12001Austral Ecology © 2013 Ecological Society of Australia

considered that ARN practices maintained higherabundance of swamp rats than the previously domi-nant harvesting practice of clear-felling (Stephenset al. 2012). These results have been documented forother forest specialists (Baker et al. 2009; Lencinaset al. 2009; Pinzon et al. 2012), including smallmammals in other systems (Klenner & Sullivan 2009;Lindenmayer et al. 2010). Sullivan and Sullivan(2001), for example, examined the effects of differentretention systems on small mammals 1–4 years post-harvest.They found that a late successional forest volespecies showed higher abundance and recruitment inharvested sites with retained forest patches comparedto clear-felled sites, although still at lower numbersthan in unlogged forest. Sullivan et al. (2008) contin-ued monitoring, and, from 5–8 years post-harvest,abundances declined in partial harvest sites comparedto unlogged forest, presumably because of a continuedreduction in optimal habitat conditions. However, thegenerally rapid regeneration of the ARN harvestedmatrix in wet Eucalyptus forests may provide sufficientcover for swamp rats to disperse through or recolonizewithin a relatively short time frame (Fox 1982; Catling1986). This suggests that the duration of any negativepopulation genetic effects of ARN forestry will beshorter than in land use practices that remove suitablehabitat across larger temporal (e.g. agriculture, roads)or spatial (e.g. clear-felling) scales.
The inability of swamp rats to disperse acrosscleared forest was perhaps best illustrated by thegenetic impact of roads through UNL sites. Individu-als on the same side of the road (<10 m wide) showedsignificantly higher relatedness than individuals onopposite sides. In addition, the deviations from Hardy–Weinberg equilibrium observed in UNL-H1 may havealso reflected a road-mediated Wahlund effect. Large,frequently used roads have been shown to representbarriers to movement for various taxa (Rondinini &Doncaster 2002; Koivula &Vermeulen 2005; Schmukiet al. 2006), although narrow and unpaved roads canalso impede movement (Oxley et al. 1974; Swihart &Slade 1984; Merriam et al. 1989). Small mammalshave also shown an aversion to the road surface itself,regardless of traffic noise or density (Rico et al. 2007;Ford & Fahrig 2008; McGregor et al. 2008). At two ofour UNL sites, the roads were effectively unused andended within a few hundred metres of the nearest trapstation, such that movement around the end of theroad would have only been in the order of 500 m. Inaddition to the genetic results for swamp rats, therewas limited evidence for road crossing from CMR(H.C. Stephens, unpubl. data, 2008–2010).
Roads represent a significant dispersal barrier, andmay be a longer-term and more serious issue forswamp rat gene flow. While the impacts of roads onbehaviour, resource accessibility and demography havebeen documented previously for various taxa (see
reviews by Trombulak & Frissell 2000; Balkenhol &Waits 2009), they have been given lower priority inproduction forests in favour of studies on the impactsof the harvested areas (Lindenmayer & Franklin 1997;Niemelä 1999; Schmiegelow & Monkkonen 2002;Fisher & Wilkinson 2005). Interestingly, the impact ofroads in this study may also, in part, explain the reluc-tance of swamp rats to move out of ARN islands. Theareas immediately surrounding islands (and edges ofthe harvested area) are firebreaks, which are widetracks (10 m), compacted and cleared to preventburning of unlogged forest, and to allow vehicle accessto the harvested matrix (Scott et al. 2012). These fire-breaks are analogous to unpaved roads and, because ofthe soil compaction from heavy vehicle use duringharvesting, restrict vegetation regeneration (Hindrumet al. 2012). Hence, swamp rats may have been reluc-tant to disperse across these firebreaks between theislands and the harvested areas, even if the latter isproviding sufficient cover (Fox 1982).
In our study, the results suggested that roads mayhave a longer-term impact than ARN harvesting. Thelatter practice may even be viewed as a transitionalstate that retains some structural and vegetation cover.The lack of any structural (e.g. logs), ground or over-storey cover on roads may be a limiting factor for thedispersal of cover-dependent ground mammals, whichare at higher risk of predation in open areas and there-fore less likely to leave dense cover (Kotler et al. 1991).Even on narrow, unpaved and infrequently used roads,impeded gene flow was evident for swamp rats.Despite a relatively small area of habitat loss, the effectof fragmentation caused by roads is high and forestmanagers may need to consider rehabilitation ofunused roads as a mitigation measure.
Swamp rats have small neighbourhood size andshow significant genetic differentiation at largerspatial scales
The neighbourhood size of swamp rats in unloggedwet forests was estimated at 42–55 m. Using CMRdata, Norton (1987a) estimated slightly larger homerange sizes (55–78 m) for swamp rats living in differenthabitat types, while Barnett et al. (1978) observedsmaller average range of 42 m in plantation forests.These estimates provide us with information on homerange size, effectively an area an animal might movewithin, but they do not reveal successful reproductionand thus a transfer of genes. Our neighbourhood sizeestimates were based on the multilocus genotypes ofsurviving individuals across a range of geographicaldistances in the landscape. These small neighbour-hood sizes may provide an insight into the lack ofdispersal seen among islands and edges in ARN sites.The distances between ARN islands and forested
10 H. C. STEPHENS ET AL.
© 2013 The Authorsdoi:10.1111/aec.12001Austral Ecology © 2013 Ecological Society of Australia
edges is typically 80–150 m, to allow safe harvestingpractices while still providing influence (e.g. seed dis-persal, leaf litter) from the surrounding forest (Scottet al. 2011). However, these are further than the usualdistances swamp rats will travel in UNL sites and mayexplain their reluctance to move between the patches,particularly with the intervening ‘hostile’ matrix. Asmall neighbourhood size may also help to explain thelack of differences at the site scale between ARN andUNL for the genetic diversity variables (FIS, AR, R,GD), as these values were calculated from all individu-als in a site, ranging from 12 to 49 ha. Alternatively,the lack of difference may have reflected the short timeacross which populations have been impacted at ARNsites (two to five generations), and a longer time maybe required for impacts on overall genetic variation tobecome manifested.
When we examined males and females separately (inUNL-H1), females showed a neighbourhood size of55 m, while males showed no change in relatednessover the existing range of distances, implying that dis-persal is male-biased (Banks & Peakall 2012). This isreflected in our anecdotal evidence that most crossingsacross cleared land (harvested forest or roads) were bymales (six of seven crossings), despite a female-biasedsex ratio indicating more females were in residence (97males: 152 females; Stephens et al. 2012). Male-biaseddispersal is common in many other mammal speciesand is often attributed to inbreeding avoidance or pre-venting resource competition among relatives (Cock-burn et al. 1985; Paplinska et al. 2009; Holland &Bennett 2011). Male-biased dispersal in fragmentedlandscapes may require individuals to move furtherdistances than they would need to in continuoushabitat in order to find suitable mates and habitat(Sumner 2005).
While the spatial autocorrelation analyses did notreveal a limit to neighbourhood size for males, disper-sal appears limited at some point, as there was signifi-cant genetic differentiation between all sites, someseparated by as little as 2.3 km, and there was noevidence for increasing genetic isolation of sites withgeographical distance among sites, either across theentire study range, within regions or within sexes.Thecomparatively lower level of genetic structuring sug-gested by the STRUCTURE analysis appears consist-ent with previous simulation studies examining thepower of this approach (Waples & Gaggiotti 2006), asthe distinct populations identified seem to reflect theirsample sizes. Similarly, Peakall and Lindenmayer(2006) found significant differentiation betweenR. fuscipes populations in forest fragments despiteoften short geographical distances (<1 km) separatingthem. Although our sites were not necessarily locatedin distinct fragments, the study area is a productionforest and as such our sites are part of a landscapemosaic of unlogged forest, regenerating native forest,
plantations of native and non-native species, plus smalland large, used and disused logging roads.Therefore, itis unsurprising that, combined with our knowledge ofsmall neighbourhood sizes and habitat preferences,swamp rat populations were genetically distinct over arelatively small geographical distance.
ACKNOWLEDGEMENTS
We would like to thank the many people who helpedwith fieldwork, especially Diane Stephens and HughFitzgerald.Thank you to Adam Smolenski (UTAS) forhis laboratory training; Kerri Spicer and BernardPlumpton (FT) for their invaluable planning advice;Sue Baker, Brad Potts, Rebecca Jones and AdamMcKiernan for their helpful comments on the manu-script; and Sam Wood for preparing the landscapemap. Thank you to the W. V. Scott Charitable Trust,CRC for Forestry, Forestry Tasmania and HolsworthWildlife Research Endowment for their financialsupport. All work was completed under the Universityof Tasmania Animal Ethics Approval permits A10504and the Department of Primary Industries and Water,Parks and Wildlife permits FA09075 and FA10047,and with permission from Forestry Tasmania toconduct mammal trapping in State Forest.
REFERENCES
Baker S. C., Grove S. J., Forster L., Bonham K. J. & Bashford D.(2009) Short-term responses of ground-active beetles toalternative silvicultural systems in the Warra SilviculturalSystems Trial, Tasmania, Australia. For. Ecol. Manage. 258,444–59.
Balkenhol N. & Waits L. P. (2009) Molecular road ecology:exploring the potential of genetics for investigating transpor-tation impacts on wildlife. Mol. Ecol. 18, 4151–64.
Banks S. C. & Peakall R. O. D. (2012) Genetic spatial autocor-relation can readily detect sex-biased dispersal. Mol. Ecol.21, 2092–105.
Banks S. C., Ward S. J., Lindenmayer D. B., Finlayson G. R.,Lawson S. J. & Taylor A. C. (2005) The effects of habitatfragmentation on the social kin structure and mating systemof the agile antechinus, Antechinus agilis. Mol. Ecol. 14,1789–801.
Barnett J. L., How R. A. & Humphreys W. F. (1978) Use ofhabitat components by small mammals in eastern Australia.Aust. J. Ecol. 3, 277–85.
Bentley J. M. (2008) Role of movement, interremnant dispersaland edge effects in determining sensitivity to habitat frag-mentation in two forest-dependent rodents. Austral Ecol. 33,184–96.
Bradshaw G. A. & Marquet P. A. (2003) How Landscapes Change:Human Disturbance and Ecosystem Fragmentation in theAmericas. Springer-Verlag, Berlin, Heidelberg.
Brouat C., Sennedot F., Audiot P., Leblois R. & Rasplus J. Y.(2003) Fine-scale genetic structure of two carabid specieswith contrasted levels of habitat specialization. Mol.Ecol. 12,1731–45.
SWAMP RAT GENE FLOW IN FRAGMENTED FORESTS 11
© 2013 The Authors doi:10.1111/aec.12001Austral Ecology © 2013 Ecological Society of Australia

Brownstein M. J., Carpten J. D. & Smith J. R. (1996) Modulationof non-templated nucleotide addition by tag DNA polymer-ase: primer modifications that facilitate genotyping. Biotech-niques 20, 1004–10.
Catling P. C. (1986) Rattus lutreolus, coloniser of heathland afterfire in the absence of Pseudomys species. Aust.Wildl. Res. 13,127–39.
Cockburn A., Scott M. P. & Scotts D. J. (1985) Inbreedingavoidance and male-biased natal dispersal in Antechinus spp.(Marsupialia, Dasyuridae). Anim. Behav. 33, 908–15.
Driessen M. M. (1987) A comparative dietary study of twonative, sympatric murids: Pseudomys higginsi (Trouessart)and Rattus lutreolus velutinus (Thomas) by faecal analysis.Honours Thesis, University of Tasmania, Hobart, Australia.
Earl D. & vonHoldt B. (2012) STRUCTURE HARVESTER: awebsite and program for visualizing STRUCTURE outputand implementing the Evanno method. Conserv. Genet.Resour. 4, 359–61.
Evanno G., Regnaut S. & Goudet J. (2005) Detecting thenumber of clusters of individuals using the software struc-ture: a simulation study. Mol. Ecol. 14, 2611–20.
Fisher J.T. & Wilkinson L. (2005) The response of mammals toforest fire and timber harvest in the North American borealforest. Mamm. Rev. 35, 51–81.
Ford A. T. & Fahrig L. (2008) Movement patterns of easternchipmunks (Tamias striatus) near roads. J. Mammal. 89,895–903.
Fox B. J. (1982) Fire and mammalian secondary succession in anAustralian coastal heath. Ecology 63, 1332–41.
Fox B. J. & Monamy V. (2007) A review of habitat selection bythe swamp rat, Rattus lutreolus (Rodentia: Muridae). AustralEcol. 32, 837–49.
Frankham R., Ballou J. D. & Briscoe D. A. (2002) Introductionto Conservation Genetics. Cambridge University Press,Cambridge.
Franklin J. F., Berg D. R., Thornburgh D. A. & Tappeiner J. C.(1997) Alternative silvicultural approaches to timber har-vesting: variable retention harvest systems. In: Creating aForestry for the 21st Century: The Science of Ecosystem Man-agement (eds K. A. Kohm & J. F. Franklin) pp. 111–39.Island Press, Washington, D.C./Cevelo.
Gitzen R. A., West S. D., Maguire C. C., Manning T. & HalpernC. B. (2007) Response of terrestrial small mammals tovarying amounts and patterns of green-tree retention inPacific Northwest forests. For. Ecol. Manage. 251, 142–55.
Goudet J. (1995) FSTAT (Version 1.2): a computer program tocalculate F-statistics. J. Hered. 86, 485–6.
Green R. H. (1967) The murids and small dasyurids in Tasma-nia: parts 1 and 2. Rec. QueenVic. Mus. 28, 1–19.
Gustafsson L., Baker S. C., Bauhus J. et al. (2012) Retentionforestry to maintain multifunctional forests: a worldperspective. Bioscience 62, 633–45.
Henle K., Davies K. F., Kleyer M., Margules C. & Settele J.(2004) Predictors of species sensitivity to fragmentation.Biodivers. Conserv. 13, 207–51.
Hewitson H. (1997) The genetic consequences of habitat frag-mentation on the Bush Rat (Rattus fuscipes) in a pine plan-tation near Tumut, NSW. Hons Thesis, Australian NationalUniversity, Canberra, Australia.
Hindrum L., Hovenden M. J., Neyland M. G. & Baker S. C.(2012) The effects of mechanical disturbance and burnintensity on the floristic composition of two-year old aggre-gated retention coupes in Tasmanian wet eucalypt forests.For. Ecol. Manage. 279, 55–65.
Hinten G. N., Rossetto M. & Baverstock P. R. (2007) Newmicrosatellite markers for the bush rat, Rattus fuscipes greyii:characterization and cross-species amplification. Mol. Ecol.Notes 7, 1254–7.
Holland G. J. & Bennett A. F. (2011) Recolonization of forestfragments by a native rodent following experimental‘extinctions’. Austral Ecol. 36, 521–9.
Hood G. M. (2010) PopTools version 3.2.5. [Cited 16 Septem-ber 2012.] Available from URL: http://www.poptools.org
Jakobsson M. & Rosenberg N. A. (2007) CLUMPP: a clustermatching and permutation program for dealing with labelswitching and multimodality in analysis of populationstructure. Bioinformatics 23, 1801–6.
Klenner W. & Sullivan T. P. (2003) Partial and clear-cut harvest-ing of high-elevation spruce-fir forests: implications forsmall mammal communities. Can. J. For. Res. 33, 2283–96.
Klenner W. & Sullivan T. P. (2009) Partial and clearcut harvest-ing of dry Douglas-fir forests: implications for smallmammal communities. For. Ecol. Manage. 257, 1078–86.
Koivula M. & Vermeulen H. (2005) Highways and forest frag-mentation – effects on carabid beetles (Coleoptera,Carabidae). Landsc. Ecol. 20, 911–26.
Kotler B. P., Brown J. S. & Hasson O. (1991) Factors affectinggerbil foraging behavior and rates of owl predation. Ecology72, 2249–60.
Lancaster M. L., Taylor A. C., Cooper S. J. B. & Carthew S. M.(2011) Limited ecological connectivity of an arboreal mar-supial across a forest/plantation landscape despite apparentresilience to fragmentation. Mol. Ecol. 20, 2258–71.
Lencinas M. V., Pastur G. M., Gallo E. & Cellini J. M. (2009)Alternative silvicultural practices with variable retentionimprove bird conservation in managed South Patagonianforests. For. Ecol. Manage. 258, 472–80.
Lindenmayer D. & Peakall R. (2000) The Tumut experiment –integrating demographic and genetic studies to unravel frag-mentation effects: a case study of the native bush rat. In:Genetics, Demography and Viability of Fragmented Populations(eds G. Young & G. M. Clarke) pp. 173–201. CambridgeUniversity Press, Cambridge.
Lindenmayer D. B. & Franklin J. F. (1997) Managing standstructure as part of ecologically sustainable forest manage-ment in Australian mountain ash forests. Conserv. Biol. 11,1053–68.
Lindenmayer D. B., Knight E., McBurney L., Michael D. &Banks S. C. (2010) Small mammals and retention islands:an experimental study of animal response to alternativelogging practices. For. Ecol. Manage. 260, 2070–8.
McGregor R. L., Bender D. J. & Fahrig L. (2008) Do smallmammals avoid roads because of the traffic? J.Appl.Ecol. 45,117–23.
Macqueen P. E., Nicholls J. A., Hazlitt S. L. & Goldizen A. W.(2008) Gene flow among native bush rat, Rattus fuscipes(Rodentia: Muridae), populations in the fragmented sub-tropical forests of south-east Queensland. Austral Ecol. 33,585–93.
Meirmans P. G. & VanTienderen P. H. (2004) GENOTYPE andGENODIVE: two programs for the analysis of genetic diver-sity of asexual organisms. Mol. Ecol. Notes 4, 792–4.
Merriam G., Kozakiewicz M., Tsuchiya E. & Hawley K. (1989)Barriers as boundaries for metapopulations and demes ofPeromyscus leucopus in farm landscapes. Landsc. Ecol. 2, 227–35.
Monamy V. (1995) Population dynamics of, and habitat useby, Australian native rodents in wet sclerophyll forest,
12 H. C. STEPHENS ET AL.
© 2013 The Authorsdoi:10.1111/aec.12001Austral Ecology © 2013 Ecological Society of Australia
Tasmania. 1. Rattus lutreolus velutinus (Rodentia: Muridae).Wildl. Res. 22, 647–60.
Niemelä J. (1999) Management in relation to disturbance in theboreal forest. For. Ecol. Manage. 115, 127–34.
Norton T. W. (1987a) The ecology of small mammals in north-eastern Tasmania. 1. Rattus lutreolus velutinus. Aust. Wildl.Res. 14, 415–33.
Norton T. W. (1987b) The effect of trap placement on trappingsuccess of Rattus lutreolus velutinus (Thomas) (Muridae,Rodentia) in northeast Tasmania. Aust.Wildl. Res. 14, 305–10.
Oxley D. J., Fenton M. B. & Carmody G. R. (1974) The effectsof roads on populations of small mammals. J.Appl. Ecol. 11,51–9.
Paplinska J. Z., Eldridge M. D. B., Cooper D.W., Temple-SmithP. D. M. & Renfree M. B. (2009) Use of genetic methods toestablish male-biased dispersal in a cryptic mammal, theswamp wallaby (Wallabia bicolor). Aust. J. Zool. 57, 65–72.
Peakall R. & Lindenmayer D. (2006) Genetic insights into popu-lation recovery following experimental perturbation in afragmented landscape. Biol. Conserv. 132, 520–32.
Peakall R., Ruibal M. & Lindenmayer D. B. (2003) Spatialautocorrelation analysis offers new insights into gene flow inthe Australian bush rat, Rattus fuscipes. Evolution 57, 1182–95.
Peakall R. & Smouse P. E. (2006) GENALEX 6: genetic analysisin Excel. Population genetic software for teaching andresearch. Mol. Ecol. Notes 6, 288–95.
Pinzon J., Spence J. R. & Langor D. W. (2012) Responses ofground-dwelling spiders (Araneae) to variable retention har-vesting practices in the boreal forest. For. Ecol. Manage. 266,42–53.
Pritchard J. K., Stephens M. & Donnelly P. (2000) Inference ofpopulation structure using multilocus genotype data. Genet-ics 155, 945–59.
Queller D. C. & Goodnight K. F. (1989) Estimating relatednessusing genetic-markers. Evolution 43, 258–75.
Raymond M. & Rousset F. (1995) GENEPOP (version 1.2):population genetics software for exact tests andecumenicism. J. Hered. 86, 248–9.
Rico A., Kindlmann P. & Sedlacek F. (2007) Barrier effects ofroads on movements of small mammals. Folia Zool. 56,1–12.
Rondinini C. & Doncaster C. P. (2002) Roads as barriers tomovement for hedgehogs. Funct. Ecol. 16, 504–9.
Rosenberg N. A. (2004) DISTRUCT: a program for the graphi-cal display of population structure. Mol. Ecol. Notes 4,137–8.
Rosenvald R. & Lohmus A. (2008) For what, when, and where isgreen-tree retention better than clear-cutting? A review ofthe biodiversity aspects. For. Ecol. Manage. 255, 1–15.
Rousset F. (1997) Genetic differentiation and estimation of geneflow from F-statistics under isolation by distance. Genetics145, 1219–28.
SAS Institute Inc. (2008) SAS 9.2. SAS Institute, Cary.Saunders D. A., Hobbs R. J. & Margules C. R. (1991) Biological
consequences of ecosystem fragmentation – a review.Conserv. Biol. 5, 18–32.
Schmiegelow F. K. A. & Monkkonen M. (2002) Habitat loss andfragmentation in dynamic landscapes: avian perspectivesfrom the boreal forest. Ecol. Appl. 12, 375–89.
Schmuki C., Vorburger C., Runciman D., Maceachern S. &Sunnucks P. (2006) When log-dwellers meet loggers:impacts of forest fragmentation on two endemic log-dwelling beetles in southeastern Australia. Mol. Ecol. 15,1481–92.
Scott R. E., Neyland M. G. & Baker S. C. (2011) VariableRetention Manual. Division of Forest Research and Devel-opment, Technical Report 5/2011. Forestry Tasmania,Hobart.
Scott R. E., Neyland M. G., McElwee D. J. & Baker S. C. (2012)Burning outcomes following aggregated retention harvest-ing in old-growth wet eucalypt forests. For. Ecol. Manage.276, 165–73.
Sekercioglu Ç. H., Ehrlich P. R., Daily G. C., Aygen D., Goe-hring D. & Sandí R. F. (2002) Disappearance of insectivo-rous birds from tropical forest fragments. Proc. Natl Acad.Sci. USA 99, 263–7.
Serikawa T., Kuramoto T., Hilbert P. et al. (1992) Rat gene-mapping using PCR-analyzed microsatellites. Genetics 131,701–21.
Siitonen J. (2001) Forest management, coarse woody debris andsaproxylic organisms: Fennoscandian boreal forests as anexample. Ecol. Bull. 49, 11–41.
Stephens H. C., Baker S. C., Potts B. M., Munks S. A., StephensD. & O’Reilly-Wapstra J. M. (2012) Short-term responses ofnative rodents to aggregated retention in old growth wetEucalyptus forests. For. Ecol. Manage. 267, 18–27.
Stow A. J. & Sunnucks P. (2004a) High mate and site fidelity inCunningham’s skinks (Egernia cunninghami) in natural andfragmented habitat. Mol. Ecol. 13, 419–30.
Stow A. J. & Sunnucks P. (2004b) Inbreeding avoidance inCunningham’s skinks (Egernia cunninghami) in natural andfragmented habitat. Mol. Ecol. 13, 443–7.
Sullivan T. P. & Sullivan D. S. (2001) Influence of variableretention harvests on forest ecosystems. II. Diversity andpopulation dynamics of small mammals. J. Appl. Ecol. 38,1234–52.
Sullivan T. P., Sullivan D. S. & Lindgren P. M. F. (2008) Influ-ence of variable retention harvests on forest ecosystems:plant and mammal responses up to 8 years post-harvest. For.Ecol. Manage. 254, 239–54.
Sumner J. (2005) Decreased relatedness between male pricklyforest skinks (Gnypetoscincus queenslandiae) in habitatfragments. Conserv. Genet. 6, 333–40.
Swihart R. K. & Slade N. A. (1984) Road crossing in Sigmodonhispidus and Microtus ochrogaster. J. Mammal. 65, 357–60.
Trombulak S. C. & Frissell C. A. (2000) Review of ecologicaleffects of roads on terrestrial and aquatic communities.Conserv. Biol. 14, 18–30.
Waples R. S. & Gaggiotti O. (2006) Invited review: What is apopulation? An empirical evaluation of some geneticmethods for identifying the number of gene pools and theirdegree of connectivity. Mol. Ecol. 15, 1419–39.
Watts C. H. S. & Braithwaite R. W. (1978) The diet of Rattuslutreolus and five other rodents in southern Victoria. Aust.Wildl. Res. 5, 47–57.
WCMC (1992) Global Biodiversity: Status of the Earth’s LivingResources. Chapman & Hall, London.
Zanette L., Doyle P. & Tremont S. M. (2000) Food shortage insmall fragments: evidence from an area-sensitive passerine.Ecology 81, 1654–66.
SWAMP RAT GENE FLOW IN FRAGMENTED FORESTS 13
© 2013 The Authors doi:10.1111/aec.12001Austral Ecology © 2013 Ecological Society of Australia