habitat suitability i dex models: least tern
TRANSCRIPT

SK361. U54no. 8210.103
BIOLOGICAL REPORT 82(10.103)AUGUST 1985
HABITAT SUITABILITY I DEX MODELS:LEAST TERN
_Ei~h and Wildlife Service
•. Department of the Interior

Thi sis one of ,the fi rst reports to be published in the ne.w "Bf 0' ogi calReport ll series. This technical r~port series, published by the Researchand Development branch of'the V.S. Fish and Wildlife Service. replacesthe IIFWS/OBSlIseries published from 1976 to September 1984. The Biological Report series is design,ed for the rapid pub' teat ton of reports withan application orientation. and it continues the focus of the FWS/OBSseries on resource management issues and fish and wildlife needs.

MODEL EVALUATION FORM
Habitat models are designed for a wide variety of planning applications where habitat information is an important consideration in thedecision process. However, it is impossible to develop a model thatperforms equally well in all situations. Assistance from users andresearchers is an important part of the model improvement process. Eachmodel is published i ndi vt dua l ly to facilitate updating and reprinting asnew information becomes available. User feedback on model performancewill assist in improving habitat models for future applications. Pleasecomplete this form following application or review of the model. Feelfree to include additional information that may be of use to either amodel developer or model user . We also would appreciate information onmodel testing, modification, and application, as well as copies of modifiedmodels or test results. Please return this form to:
Habitat Evaluation Procedures GroupU.S. Fish and Wildlife Service2627 Redwing Road, Creekside OneFort Collins, CO 80526-2899
Thank you for your assistance.
Species . _GeographicLocation ------ - - - --- - - - - -
Habitat or Cover Type(s) _
Type of Application: Impact Analysis Management Action AnalysisBaseline Other --- - - - ----- ------- - - - - - - - - - --Variables Measured or Evaluated
Was the species information useful and accurate? Yes No
If not, what corrections or improvements are needed?--- - - - - ---

Were the variables and curves clearly defined and useful? Yes No
If not, how were or could they be improved? __
Were the techniques suggested for collection of field data:Appropriate? Yes NoClearly defined? Yes NoEasily applied? Yes No
If not, what other data collection techniques are needed?
Were the model equations logical? Yes NoAppropriate? Yes No
How were or could they be improved?
Other suggestions for modification or improvement (attach curves,equations, graphs, or other appropriate information)
Additional references or information that should be included in the model:
Model Evaluator or Reviewer Date----------------------- ------------Agency _
Address ---------------------------------------------------------
Telephone Number Comm: FTS-------------------- ----------

Biological Report 82(10.103)August 1985
HABITAT SUITABILITY INDEX MODELS: LEAST TERN
by
Raymond G. CarrekerHabitat Evaluation Procedures GroupWestern Energy and Land Use Team
U.S. Fish and Wildlife Service2627 Redwing Road
Fort Collins t CO 80526-2899
Western Energy and Land Use TeamDivision of Biological Services
Research and DevelopmentFish and Wildlife Service
U.S. Department of the InteriorWashington t DC 20240

This report should be cited as:
Carreker, R. G. 1985. Habitat suitability index models: Least tern. U.S.Fish Wild1. Servo 8io1. Rep. 82(10.103). 29 pp.

PREFACE
This document is part of the Habitat Suitability Index (HSI) Model Series[Biological Report 82(10)] which provides habitat information useful for impactassessment and habitat management. Several types of habitat information areprovided. The Habitat Use Information Section is largely constrained to thosedata that can be used to derive quantitative relationships between key environmental variables and habitat suitability. This information provides thefoundation for the HSI model and may be useful in the development of othermodels more appropriate to specific assessment or evaluation needs.
The HSI Model Section documents the habitat model and includes informationpertinent to its application. The model synthesizes the habitat use information into a framework appropriate for field application and is scaled toproduce an index value between 0.0 (unsuitable habitat) and 1.0 (optimumhabitat). The HSI Model Section includes information about the geographicrange and seasonal application of the model. its current verification status.and a list of the model variables with recommended measurement techniques foreach variable.
The model is a formalized synthesis of biological and habitat informationpublished in the scientific literature and may include unpublished informationreflecting the opinions of identified experts. Habitat information aboutwil dl ife speci es frequently is represented by scattered data sets co11ectedduri ng different seasons and years and from different sites throughout therange of a speci es. The model presents thi s broad data base ina formal.logical. and simplified manner. The assumptions necessary for organizing andsynthesizing the species-habitat information into the model are discussed.The model should be regarded as a hypothesis of species-habitat relationshipsand not as a statement of proven cause and effect relationships. The modelmay have merit in planning wildlife habitat research studies about a species.as well as in providing an estimate of the relative suitability of habitat forthat speci es. User feedback concerni ng model improvements and other suggestions that may increase the utility and effectiveness of this habitat-basedapproach to fish and wildlife planning are encouraged. Please send suggestionsto:
Habitat Evaluation Procedures GroupWestern Energy and Land Use TeamU.S. Fish and Wildlife Service2627 Redwing RoadFt. Collins. CO 80526-2899
iii

iv

CONTENTS
Page
PREFACE iiiACKNOWLEDGMENTS vi
HABITAT USE INFORMATION 1Genera 1 1Food 1Water 2Cover 2Reproduct ion 3Interspersion and Composition...................................... 6Special Considerations............................................. 7
HABITAT SUITABILITY INDEX (HSI) MODEL .. 9Model Applicability................................................ 9Model Description.................................................. 11Application of the Model........................................... 17
SOURCES OF OTHER MODELS 23
REFERENCES 23
v

ACKNOWLEDGMENTS
I thank Jonathan L. Atwood, Jean H. Schulenberg, and Bruce C. Thompsonfor reviewing and critiquing earlier drafts of the least tern HSI model. Thecomments and suggestions of these individuals have added to the quality ofthis model, and their time and contributions are gratefully acknowledged. Ialso thank Michael L. Peterson, Robert F. Soots, Jr., and Bruce C. Thompsonfor their contribution to the formulation of the substrate composition variableused in the model. Louis R. Bevier, contractor with the California Departmentof Fish and Game, Sacramento, Robert F. Soots, Jr., and Bruce C. Thompsonprovided photographs of least tern nesting habitat included in the model andtheir contributions are appreciated. Finally, I thank Milton S. Rutstein,National Oceanic and Atmospheric Administration, National Ocean Service,Rockville, MD, and Robert D. Jarrett and Garnett P. Williams, U.S. GeologicalSurvey, Denver Federal Center, Denver, CO, for providing literature andconsultation on habitat flooding.
Word processing was provided by Elizabeth Graf, Carolyn Gulzow and DoraIbarra. The cover was illustrated by Jennifer Shoemaker. Kay Lindgrenassisted with the literature search and document acquisition for this project.
vi

LEAST TERN (Sterna antillarum)
HABITAT USE INFORMATION
General
The least tern (Sterna antillarum) breeds along coastal and freshwaterhabitats of North, Central, and South America and the Caribbean Islands(American Ornithologists' Union 1983). Three subspecies breed in the continental United States. The eastern least tern (S. a. antillarum) breeds along theAtlantic-Gulf coast from the southern tip of Texas (American Ornithologists'Union 1983) to southern Maine (Hunter 1975). The interior least tern (S. a.athalassos) breeds sporadically along the major tributaries of the MississippiRiver drainage basin (Ducey 1981) and the Rio Grande (Downing 1980). TheCalifornia least tern (S. a. browni) breeds from southern Baja California,Mexico, north to the San- Francisco Bay (California Least Tern Recovery Team1980). Least terns seen along the southern Colorado River and Salton Sea areaof southern California may be wanderers from the mexicanus subspecies of thenearby Gulf of California (Wilbur 1974). No breeding populations of thissubspecies in the continental United States were cited in the literature.
Breeding habitat is generally characterized as open sand, soil, or driedmud in the proximity of a lagoon, estuary, or river (Hardy 1957; Craig 1971;Massey 1971). The least tern has suffered a significant loss of nesting andfeeding habitat from human activities, including recreational use and habitatmodification due to development (Wilbur 1974; Buckley and Buckley 1976;California Least Tern Recovery Team 1980; Ducey 1981).
Food
Least terns consume small fish that swim near the surface (Tomkins 1959).The method of hunting consists of hovering and diving from a height of "a fewfeet" (Hardy 1957:50) to 10 m (Moseley 1976) above the surface. Least ternsalso skim the water for surface-dwelling prey (Bent 1921; Oberholser 1974) andfeed on insects on land (Bent 1921; McDaniel and McDaniel 1963; Schulenberget al. 1980). However, feeding over land is considered rare for least terns(Moseley 1976).
Least terns employ an opportunistic foraging strategy (Atwood and Minsky1983) and probably exploit any fish species within a certain size range(Mose1ey 1976). The stomach contents of 49 1east terns co11 ected in NewJersey, Florida, and Louisiana consisted of 43.1% silver anchovy (Engrauliseurystole), 6.8% menhaden (Brevoortia tyrannus), 6.3% mummichogs (Fundulusheteroclitus), 5.0% Crustacea, 1.1% silversides (Menidia spp.),' and 37.7%unidentified items (McAtee and Beal 1912).
1

Species of fish dropped or discarded by adults in nesting colonies appearto correlate roughly with species actually consumed (Ha s sey and Atwood 1980;Atwood and Kelly 1984). In California, northern anchovy (Engraulis mordax)usually was the most commonly dropped fish followed by topsmelt (Atherinopsaffinis), jacksmelt (Atherinopsis californiensis), and deepbody or sloughanchovies (Anchoa compressa,~. delicatissima) (Atwood and Kelly 1984). InMississippi, Hays (1980) found Gulf menhaden (Brevoortia patronus) and bayanchovy (Anchoa mitchilli) most frequently dropped at a least tern colony. Inaddition to these two species, emerald sleeper (Erotelis smaragdus) and roughsilverside (Membras martinica) were dropped at colony sites in Texas (B. C.Thompson, Texas Parks and Wildlife Department, Austin; letter dated 9 August1984). Burroughs (1966) found sand lance (Ammodytes spp.), herring (Clupeaspp.), and hake (Urophycis spp.) dropped in least tern colonies inMassachusetts. Hardy (1957) found dropped river shiner (Notropis blennius) onthe lower Ohio River and determined this species to be the dominant food ofleast terns in that area. Schulenberg et al. (1980) collected plains killifish(Fundulus kansae) most often at colony sites in Kansas.
Fish 2.5 to 7.5 cm long were caught and eaten by adult least terns andfed to young in Kansas (Schulenberg et al. 1980). Moseley (1976) found thatadult bi rds in North Carol ina ate fi sh 5 to 8 cm long and fed newly-hatchedchicks fish 2 to 4 cm long. In California, adult terns fed on fish from 4 to9 cm long (Massey 1974) and seemed barely able to swallow northern anchovies9.5 to 10 cm long, and surfperches (Embiotocidae) 2 cm deep vertically (Masseyand Atwood 1980). Ei ghty-four percent of fi sh eaten duri ng courtshi p were< 5 cm long with 50% between 2.5 and 5 cm. Dropped fish collected inCalifornia terneries ranged from 3.5 to 9.5 cm long. Chicks < 10 days of agewere fed fish < 2.5 cm, whereas chicks older than 10 days and fledglings werefed a broad range of sizes (Massey and Atwood 1980). Massey and Atwood (1981a)concluded that suitable fish for young chicks were nonspiny species < 1.5 cmlong. Atwood and Kelly (1984) considered spiny fish and fish with a bodydepth or rotundity diameter> 1.5 cm as generally unsuitable food items foradult least terns.
Water
No information on least tern drinking water requirements was found in theliterature. Food and cover requirements associated with water are discussedunder the appropriate sections.
Cover
Adult least terns require no cover during the breeding season. Areas usedfor mating, nesting, and feeding young have been described as bare (Jerniganet al. 1978). Massey and Atwood (1982) described a night roosting site as awide stretch of sandy beach.
2

Least tern chicks abandon the nest within a few days after hatching(Massey 1974). Parent birds tend to lead the chicks toward the colony'speriphery (Akers 1975) into more heavily vegetated areas (Moseley 1976).Chicks can wander widely within and outside of the colony (Massey 1974; Akers1975). Chicks use sparse vegetation and water deposited debris for shade andprotection (Hardy 1957; Jernigan et al , 1978; Minsky et al . 1984; Schulenbergand Ptacek 1984).
Reproduction
Least terns generally nest on a flat, un vegetated substrate near a goodfeeding area (Portnoy 1977) (Fig. la), but also can nest successfully on lesscharacteristic sites (Figs. lb and lc). Least terns in marine environmentsnest on islands, peninsulas, beaches, sandbars, and isolated sandpits (Moseley1976), usually between the high tide line and the area of dune formation(Akers 1975; Hunter 1975; Dorr 1976; Blodget 1978). Most inland least ternnesting occurs along the larger rivers with broad expanses and braided waterchannels (Ducey 1981), specifically on saltflats and sandbars that becomeexposed during periods of low water (Stiles 1939; Hardy 1957; Schulenberg andSchulenberg 1982). However, nests also are found in salt marshes (Parmeleeet al. 1969) and along lakes (Schulenberg et al. 1980).
Least terns scrape out shallow nests on unconsolidated substrates such assand, soil, shell, or gravel. Least terns in North Carol ina (Jernigan et al.1978) and in New York (Gochfeld 1983) preferred a coarse sand-shell substrate.Craig (1971) stated that a sand-shell mix provided the best background for thecryptically colored eggs and chicks of least terns in California. Areas ofsand-pebble substrate that provide camouflage (Burroughs 1966) are alsopreferred as nesting sites by least terns (Hardy 1957).
Successful tern colonies have been found on fine-grained substrates(Wycoff 1950; Hays 1980). However, studies in California (Swickard 1972),Oklahoma (Grover and Knopf 1982), Texas (Thompson and Slack 1982), and Kansas(Schulenberg and Ptacek 1984) have associated high egg loss during heavy rainswith the poor water permeability of finer grained substrates. Finer materialsalso are more prone to wind-drifting (Downing 1980; Gochfeld 1983), which candestroy eggs (Burroughs 1966) and possibly young (Ganier 1930). Soots andParnell (1975) found that shell material helped stabilize nesting substrate inNorth Carolina. When little or no shell was present, winds caused erosion andshifting sand dunes. On a saltflat in California, least terns apparentlyavoided nesting on sites containing high amounts of silt and clay (Minskyet a1. 1984).
Least tern nesting habitat is generally characterized as ephemeral(Gochfeld 1983), being represented vegetatively by pioneering plant speciesthat are low-growing, scattered, or form dispersed clumps (Jernigan et al.1978; Thompson and Slack 1982). Total vegetation cover rarely exceeded 20% atcolony sites in California (Craig 1971), Kansas (Schulenberg et al. 1980), andTexas (Thompson and Slack 1982). In New York, most nesting sites werein areas of 5 to 25% cover, although sites with> 20% cover were seldomoccupied (Gochfeld 1983). Nest sites in North Carolina (Jernigan et al. 1978)and Nebraska (Faanes 1983) were generally located in areas of < 10% cover.
3

Figure lao Preferred least ternnesting habitat consists offlat, open, unconsolidatedsites such as this NorthCarolina coast beach (photoby R. F. Soots, Jr.).
Figure lb. Least terns cannest in topographicallydiverse upland habitat. Someleast tern s in sout her nCalifornia nest on flat areasbetween 2 m high sand dunes(photo by L. R. Bevier).
Figure lc . Established lea sttern colonies can persist inareas of encroaching vegetation and human di sturbancesuch as this site on a TexasGulf coast isla nd (photo byB. C. Thompson ).
Figure 1. Examples of least tern nesting habitat in marine environments.
4

Jernigan et al. (1978) reported that vegetation height ranged from 0 to 40 cmwith a mean of 7 cm in natural sites. Least terns in Kansas nested among 0.6to 0.9 m tall plants when more favorable habitat was flooded (Schulenberg andSchulenberg 1981). Nests in Mississippi tended to be located among sparsevegetation more often than on open beach (Jackson 1976). Other authors (Akers1975; Blodget 1978; Grover and Knopf 1982) have noted that least terns tend tonest in close proximity to debris. Occasionally, least tern colonies arefound in relatively densely vegetated areas, although some workers attributethis to possible site tenacity (i .e., the tendency of birds to return to thesame site year after year) (Downing 1973; Jernigan et al. 1978; Thompson andSlack 1982; Gochfeld 1983) or a response to habitat loss (Moseley 1976) ratherthan preferential habitat selection. Other authors have stated that leastterns move to new habi tat when vegetation encroachment occurs (Wycoff 1960;Downi ng 1973; Buckley and Buckley 1980). Vegetation encroachment on sandbarnesting habitat is a major cause of habitat loss for least terns in theinterior (Ducey 1981).
By nature of their close proximity to water, least tern colonies areoften threatened by inundation. Flooding by high tides and stream flows canbe a major cause of reproductive failure for the least tern (Paige 1968;Blodget 1978; Loftin and Thomson 1979; Ducey 1981; Grover and Knopf 1982;Faanes 1983; Schulenberg and Ptacek 1984). Least terns in marine environmentsoften avoid inundation by selecting the more elevated portions of a breedingsite (Akers 1975; Thompson and Slack 1982; Gochfeld 1983), such as lumps andridges as opposed to flats (Jernigan et al. 1978). Loftin and Thomson (1979)concl uded that nests elevated "a few i nche s" by transplanting an automobil etire over them would stand a better chance of survival from high water. Leastterns also can escape flooding by avoiding narrow beaches and by nesting somedistance from the high tide line (Gochfeld 1983). Least terns in Long Island,New York avoided beaches < 10 m wide above the high tide line. Similarly,least tern nests in riverine environments often are situated on less vulnerablesites. At a colony site on the lower Ohio River, most nests were located onaccumulations of gravel and usually were located well back from the water(Hardy 1957). Wycoff (1960) also noted least terns nesting on relativelyhigher ridges of gravelly mud in Nebraska. Least terns inhabiting riversystems can delay reproduction until after the period of peak river flooding,when suitable nesting sites become available (Bent 1921; Ganier 1930; Stiles1939; Hardy 1957; Wycoff 1960).
Predation also can be a major cause of nesting failure (Paige 1968; Akers1975; Blodget 1978; Massey and Atwood 1979). The presence of predators canprevent least terns from nesting (Massey 1971) and cause them to abandonprevi ously occupi ed sites (Massey and Atwood 1981a). Barri ers to mammalianpredators include fencing (Massey 1971; Minsky 1980) and the isolation of acolony site by water (Hardy 1957; Swickard 1972, 1974; Faanes 1983). Landinand Soots (1977) noted that dredged materi a 1 deposits that were used fornesting allowed access to colonies at low tide when located too close to themainland. They also found that islands> 8 ha were rarely used becausepredators could inhabit them year-round. Dredge-spoil islands that lack densevegetat i on and are not located adjacent to 1arge marshes are 1ess 1ike ly tosupport mammalian predators than are naturally occurring barrier islands(Soots and Parnell 1975). Some terrestrial predators on least tern
5

eggs and chicks include Norway rats (Rattus norvegicus), house cats (Feliscatus), skunks (Mustelidae) (Massey and Atwood 1979), foxes (Vulpes fulva)(Minsky 1980), and coyotes (Canis latrans) (Grover and Knopf 1982). Leasttern eggs and chicks also are preyed on by many avian species. Clumps ofvegetat i on or debri s used as cover by chi cks can provi de 1itt1e protectionfrom avian predation (Jenks-Jay 1982). In Massachusetts, however, the erectionof wood and metal shelters provided protection from avian predators (Jenks-Jay1982). Clay roofing tiles were used to provide hiding places for chicks frompredatory birds in California (Massey and Atwood 1979). Avian predatorsinclude several species of raptors, gulls, and corvids.
Interspersion and Composition
Least terns hunt in shallow water areas such as nearshore ocean (Collinset al. 1979; Atwood and Minsky 1983), estuaries, lagoons (Wilbur 1974), rivers,streams, lakes, ponds (Hardy 1957), channels (Collins et al. 1979; Atwood andMinsky 1983), and canals (Fisk 1975). In marine environments, offshore foraging can occur in areas of floating seaweed that provide conditions normallyfound only in shallow water areas (e.g., minimum surface chop and small fishnear the surface) (Massey and Atwood 1979). The movements of prey speciestend to make specific foraging localities difficult to delimit (Massey andAtwood 1981a; Atwood and Minsky 1983).
In North Carolina, Jernigan et al. (1978) found that colony sites were inthe vicinity of shallow, open water and tidal marshes with ample food supplies.In California, Atwood and Minsky (1983) observed that foraging activities wereconsistently high in nearshore ocean waters near major river mouths, possiblyas a result of ecological conditions such as water depth, salinity, or nutrientsupply that favored concentrations of prey species. Massey and Atwood (1980)noted that 75 to 90% of observed feeding activity during courtship, incubation,and feedi ng of young occurred in the nearshore ocean. Along ri vers, shallowwater areas formed by meanders or alterations in current flow are favorablesites for nesting and are the areas most frequently fished (Hardy 1957). Of49 species of dropped fish listed by Atwood and Kelly (1984) in California,all primarily inhabited shallow water areas.
Least tern colonies need to be located close to feeding areas (i .e.,extensive areas of shallow water) (Craig 1971). An ideal nesting substratewill not attract nor support breeding pairs if suitable feeding conditions arenot present within a reasonable distance (California Least Tern Recovery Team1980). Coastal least terns commonly breed in close proximity to shallow waterareas such as nearshore ocean (Collins et al. 1979; Massey and Atwood 1980),estuaries (Massey 1971; Dorr 1976), and bays (Erwin 1978; Thompson 1982). InNorth Carolina, Jernigan et al. (1978) found all of 61 observed colonieswithin 250 m of a large expanse of shallow water. Least terns in Nebraskagenera lly foraged wi thi n 100 m of nest sites (Faanes 1983). Although 1eastterns in Kansas occasionally flew 3.2 to 4.8 km from colony sites to feed,birds usually foraged within 1.6 km of colony sites (J. H. Schulenberg,contractor with Kansas Fish and Game Commission, Pratt; pers. comm.). InCalifornia, most foraging occurred within 3.2 km of nesting sites (Atwood andMinsky 1983). Massey and Atwood (1980) saw many birds foraging 6.4 km or more
6

from the co1ony; however, bi rds found forag i ng fa rther than 4 km from thenesting site were suspected to be nonbreeders (Massey and Atwood 1981a). InMississippi, Hays (1980) noted that although least terns commonly fished inshallow water, they also foraged in deeper water 4.8 to 8 km from shore in theGulf of Mexico.
Least terns use a variety of aquatic habitats when available. Leastterns in the interior have been seen foraging in rivers, lakes, ponds, sloughs,and borrow pits (Ganier 1930). Similarly, the least terns in a colony on theSan Gabriel River in California were seen foraging in the river, at the mouthof the river, in a marina, in a flood control canal, in a marsh, and offshore(Massey and Atwood 1979). After fledging, terns in California shifted toquiet, shallow areas such as freshwater lakes and ponds, flood controlchannels, and saltmarsh channels where the young appeared to be perfectingtheir foraging skills (Massey and Atwood 1980; Atwood and Minsky 1983). Theauthors suggested that such areas were critical to the survival of fledglings,and were therefore of major importance to the reproductive biology of theleast tern. The authors further suggested that disturbance of nearshore oceanareas and river systems within 3.2 to 4.8 km of active nesting sites should beavoided, and that freshwater habitat within 8 km of the coast as well as saltmarshes should be assessed for use by least terns.
Special Considerations
Nesting sites generally are characterized as unstable areas created andmaintained by tidal action or flooding. Due to the sometimes transitorynature of nesting habitat, least terns have been described as having stronggroup adherence and weak site tenacity, which may aid in discovering recentlycreated habitat (McNicholl 1975). In some cases, however, site tenacity can bea more important determinant of site selection than the physical characteristics of an area (Gochfeld 1983; J. L. Atwood, Department of Biology,University of California, Los Angeles; unpubl.). Least tern colonies candisplay high site fidelity by continuing to use an area year after year for aslong as the site remains suitable (Burger 1984), including marginal siteswhere successful reproduction has occurred previously (Massey and Atwood1979). In New Jersey, colony sites were abandoned only when predation, humandisturbance, or vegetation encroachment reached intolerable levels (Burger1984). Terns returned to and nested at sites where colonies were completelywiped out the previous year when such sites had been in use for several years.Year-to-year fidelity has been documented for least terns in California byAtwood (unpubl .), who also found that least terns tended to nest in the generalvicinity of their natal colonies. Of 190 banded birds studied, approximately50% nested within 25 km of where they were hatched, and over 80% nested within50 km of their natal site.
Least tern nesting and feeding habitat has undergone a significantdecrease as a result of beach erosion (Downing 1973) and various human activities such as recreational use of beaches (Gochfeld 1983), the development ofbeach homes (Chambers 1908) and marinas (Massey and Atwood 1980), dam construction (Ducey 1981), channel deepening (Downing 1980), and agricultural drawdown(Schulenburg and Ptacek 1984). Least terns partially compensate for the loss
7

of natural habitat by successfully nesting in marginal areas quite unlikeformer sites (Craig 1971; Massey and Atwood 1979)t although reproductivesuccess in such areas often can be reduced (Atwood t pers. comm.). InCalifornia, least terns historically nested on beaches near the mouths ofmajor rivers, bays, and estuaries (Massey and Atwood 1981a). Due to displacement, birds also now nest in areas such as mudflats and landfill sites backfrom the ocean (Craig 1971; Massey 1974; California Least Tern Recovery Team1980). On the Atlantic-Gulf coast, least terns commonly nest on dredge anddevelopment spoil (Downing 1973; Soots and Parnell 1975; Buckley 1978) and onflat rooftops (Downing 1973; Fisk 1975, 1978a, b). Least terns also have beenreported nesting on dredge material (Moser 1940; Wycoff 1950) and sandpits(Swanson 1956; Wycoff 1960) near rivers and lakes in the interior. Otherunnatural nesting areas used by least terns include airports (Anderson 1972;Atwood et al. 1979), old parking lots (Texas Waterbird Society 1982; Gochfeld1983), road shoulders (Texas Waterbird Society 1982), and cultivated fields(Nugent 1974).
Human-related disturbance to least tern colonies occurs in the form offoot traffic, pets, off-road vehicles (Dorr 1976; Blodget 1978), and livestock(Schulenberg and Ptacek 1984). Least terns can successfully nest close tohuman activity if the nest itself is not disturbed (Craig 1971; Thompson1982). Brubeck et al. (1981) found a colony of least terns within 5 m of aheavily traveled highway in Texas, and Davis (1968) noted that the dailypassing of a train approximately 3 m away from a colony in California did notdisplace incubating birds. Where human disturbance to the nests is a problem,fenci ng has been shown in some cases to be an effective means of protectingcolonies (Blodget 1978; Massey and Atwood 1979, 1981a). Protection providedby fencing allowed least tern colonies in Massachusetts to become accustomedto vehicles and people (Blodget 1978). Fencing of a colony of three leasttern nests in California resulted in an increase to 35 nesting pairs duringthe same year t and 80 to 95 pairs the following year (Massey and Atwood 1979).
Least tern nesting habitat can be enhanced by the improvement of marginalsites. In California, Swickard (1974) found that poorly drained and camoufl aged substrates such as sa ltfl ats could be improved by the addi t i on ofhighly disturbed and displaced sand. Schulenberg and Schulenberg (1982)reported similar results for least tern nesting habitat in Kansas. Swickard(19-72) also stressed the importance of vegetation removal, which must berepeated periodically to prevent encroachment (Downing 1973; Massey and Atwood1979; Schulenberg and Ptacek 1984).
The size of'least tern colonies can range from a few to several hundrednesting pairs, and a colony can be divided into subcolonies (Massey 1974).The loss of nesting habitat can either lead to a decrease in colony size(Varza 1975) or complete abandonment of a site (Burger 1984). Erwin (1977)suggested that, because least terns frequently shift nesting sites, a largeramount of habitat than is being used at a given time should be protected inorder to accomodate future needs.
The California and interior subspecies of the least tern are listed asendangered (California Least Tern Recovery Team 1980; U.S. Fish and WildlifeService 1985a). All three subspecies are designated as national species ofspecial emphasis (U.S. Fish and Wildlife Service 1985b).
8
HABITAT SUITABILITY INDEX (HSI) MODEL
Model Applicability
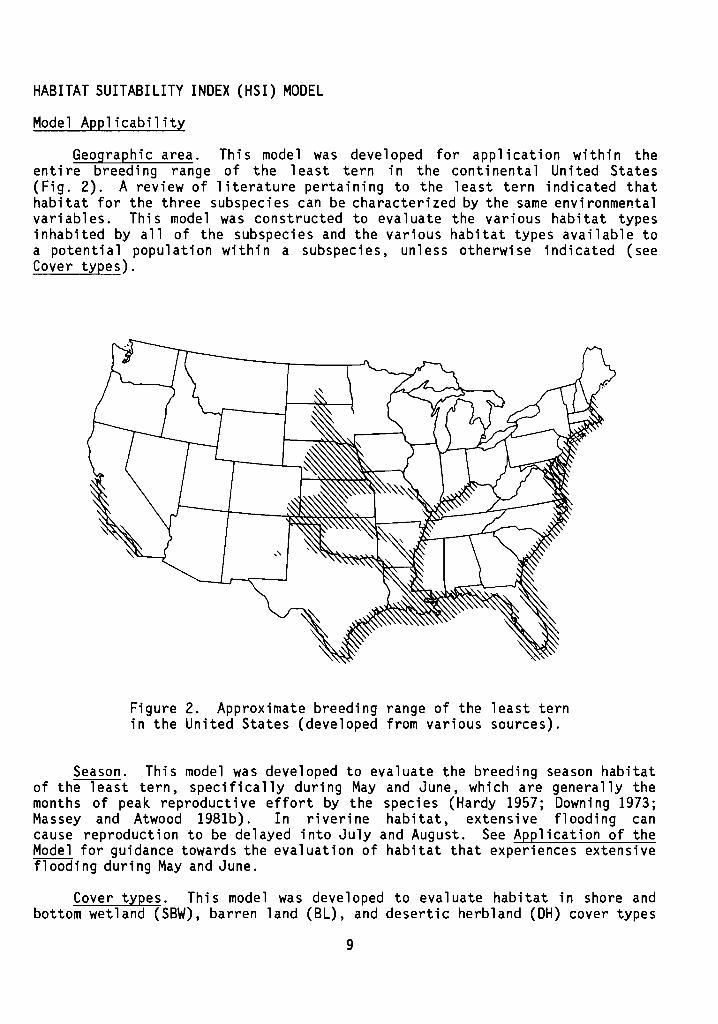
Geographic area. This model was developed for application within theentire breeding range of the least tern in the continental United States(Fig. 2). A review of literature pertaining to the least tern indicated thathabitat for the three subspecies can be characterized by the same environme~tal
variables. This model was constructed to evaluate the various habitat typesinhabited by all of the subspecies and the various habitat types available toa potential population within a subspecies, unless otherwise indicated (seeCover types).
Figure 2. Approximate breeding range of the least ternin the United States (developed from various sources).
Season. This model was developed to evaluate the breeding season habitatof the least tern, specifically during May and June, which are generally themonths of peak reproductive effort by the species (Hardy 1957; Downing 1973;Massey and Atwood 1981b). In riverine habitat, extensive flooding cancause reproduction to be delayed into July and August. See Application of theModel for guidance towards the evaluation of habitat that experiences extensiveflooding during May and June.
Cover types. This model was developed to evaluate habitat in shore andbottom wetland (SBW), barren land (Bl), and desertic herbland (DH) cover types
9

(u.s. Fish and Wildlife Service 1981), and marine (M), estuarine (E), riverine(R), lacustrine (L), and palustrine (P) aquatic systems (Cowardin et al.1979). This model also is applicable to unnatural areas of unconsolidatedsubstrate such as dredge material and sandpits, that may simulate naturalsubstrate. Highly unnatural areas such as rooftops, airports, and roads arenot considered acceptable areas for evaluation using this model.
It is believed that least terns require large expanses of relativelyshallow water for foraging. However, a wide variety of aquatic habitats cancontain fish of suitable size for least terns. Due to the opportunisticforaging behavior of least terns, it is assumed that potential least ternforaging habitat is any open body or channel of water, natural or constructed,known to contain or suspected of containing fish < 10 cm long that swim nearthe surface.
Minimum habitat area. Minimum habitat area is defined as the mt mmumamount of contiguous habitat that is required before a species will live andreproduce in an area. The larger least tern colonies typically are found onbroad, open nesting sites. However, small or narrow sites of adequate suitability also support some nests. The minimum area to be evaluated is left tothe discretion of the user of this model. Some examples of least tern colonieson limited and restricted area sites are presented in Table 1. The relationship between aquatic habitat area and suitability is discussed under Foodcomponent.
Table 1. Examples of least tern colony sizes on limited andrestricted area sites.
Subspecies Area # of nests Reference
S. a. antillarum 5 m 6 Hunter (1975)wide beach
S. a. antillarum 64.2 m x 18.3 m 300 Anderson (1977)island
S. a. athalassos 38.1 m x 22.9 m 6 Wycoff (1950)island
S. a. athalassos 91. 5 m x 20.1 m 6 Schulenberg andsandbar Schulenberg
(1982)
S. a. browni 99 m x 122 m 140-160 Massey andfenced enclosure Atwood (1981)
S. a. browni 24.4 m x 54.9 m 34 Swi ckard (1974)area of improvedsubstrate
10

Verification level. Previous drafts of this model were critiqued byJonathan L. Atwood, Jean H. Schulenberg, and Bruce C. Thompson. Comments fromthese reviewers have been incorporated into the current model. Michael L.Peterson, Robert F. Soots, Jr., and Bruce C. Thompson assisted in the construction of the substrate textural triangle used in the model.
Model Description
Overvi ew. The 1east tern habitat model considers the abil ity of thehabitat to meet the food and nesting needs of the species as an indication ofovera 11 breedi ng season habitat sui tabil i ty. The 1i terature i ndi cates thatsite tenacity plays a major role in least tern habitat use. Due to thisbehavioral trait, least terns may often nest in areas of relatively low suitabil ity, as defined by this model. It is not recommended that this model beused to determine the value of sites with existing breeding populations ofleast terns or sites with a history of breeding activity within the past 5years. This recommendation is made because occupancy can be a function of sitetenacity in addition to, and possibly irrespective of, the physical habitatparameters addressed by thi s model. Due to the threatened and endangeredstatus of the 1east tern throughout its range, habitats wi th a hi story ofsupporting populations of breeding least terns within the past 5 years shouldbe assumed to have high value even if the model indicates low suitability.However, thi s model can be used to assess sui tabil ity and, subsequently,identify those habitat parameters that can limit the reproductive potential ofan existing breeding population. With the distinction between habitat valueand habitat suitability in mind, the model can be used as a tool formanagement.
The following sections provide a written documentation of the logic andassumptions used to interpret the habitat information for the least tern andto explain and justify the variables and equations used in the HSI model.Specifically, these sections identify variables that are used in the model,define and justify the suitability levels of each variable, and describe theassumed relationships between variables.
Food component. Least tern food requirements are related to the abundanceand accessibility of small fish. Least terns feed on a variety of small fishspecies. A discussion of some fish species and size classes commonly foragedby least terns was presented under Food, the habitats used for foraging werediscussed under Interspersion and C~sition, and the assumptions concerning1east tern foragi ng habi tat were di scussed under Cover types. The user ofthis model should use this information and, possibly, the advice of a fisheriesauthority, as gui des to the determi nat i on of what aquatic habi tats can beconsidered as foraging habitat.
Least terns will not use an optimum nesting site if the surrounding areadoes not contain adequate food resources. It is therefore important that theava il abi 1i ty of food resources be addressed. Thi s model does not di rect lymeasure the availability of fish. As an alternative, it is assumed that asuitable nesting habitat in close proximity to abundant and/or diverse aquatichabitat is a desirable nesting site for least terns. The maximum distancethat breeding birds will fly to forage is not known. However, because of the
11

care required by the progeny, it is probable that parent birds will not fly asfar as nonbreeding birds during the incubation and chick-rearing period. Itis assumed in this model that an area composed of ~ 50% water within theaverage maximum flight distance from the potential nesting habitat will provideoptimum foraging habitat area (Fig. 3). This is based on the assumption thata nesting habitat that borders an expansive aquatic system (e.g., the ocean ora large river and floodplain) will provide a potential nesting population withample foraging habitat. It is assumed that the average maximum flight distancefor coastal least terns is 3.2 km , based on the observations of Atwood andMinsky (1983) in California. It also is assumed the average maximum flightdi stance for i nteri or 1east terns is 1.6 km , based on the observations ofSchulenberg (pers. comm.) in Kansas. If breeding least terns behave differently in other areas, these distances should be modified accordingly.
1.0....:>..... 0.8V)
x0.6(l)
"'0C.....~ 0.4.,...r-.,...
0.2.0to+oJ.,...~ 0.0V)
a 25 50 75 100
Percent aquatic area
Figure 3. The relationship between the percent of the area within theaverage maximum flight distance from the potential nesting habitat thatis aquatic habitat and the suitability index value for least tern food.
Least terns use and, at times, depend on a variety of foraging habitats.It is assumed that an area that contains a diversity of aquatic habitat typeswill be: (1) more productive than less diverse areas; (2) more likely tocontinue to provide food during the incubation and chick-rearing period if oneof the aquatic habitat types fails to provide sufficient food supplies; and(3) able to adequately accommodate any possible change in foraging habitat useas the breeding season progresses. Habitat with two or more disparate aquaticsystems (M, E, R, L, and P) within the average maximum flight distance isassumed to provide optimum diversity. However, a single, diverse aquaticsystem such as an estuary (E) or large riverine floodplain (P) can also behighly productive. Therefore, it is assumed that an area composed of a singleaquatic system will provide optimum diversity of foraging habitat when it
12

I
- f-
l-
I-
1.0N>...... 0.8V)
><Q) 0.6-cs::......
~ 0.4'r-
'r-.0 0.2rc:l
+.J'r-;=, 0.0V)
o 1 2+
Number of disparateaquatic wetlands
Figure 4. The relationship between the number of disparate aquaticwetlands within the average maximum flight distance from the potentialnesting habitat and the suitability index value for least tern food.
contains two or more disparate aquatic (i .e., flooded) wetlands (Cowardinet al. 1979, Table 4) within the average maximum fl ight distance from thepotent i a1 nesting habitat (Fi g. 4). Again, thi s di stance should be modifi edif breeding least terns are known to concentrate their feeding activity withina different radial distance. The user is referred to Cowardin et al. (1979)as a guide for the designation and delineation of aquatic systems and aquaticwetlands.
The formulation of SIV1 and SIV2 was based on the assumption that leastterns prefer to nest in areas containing extensive areas of water and diverseaquatic habitat. The assumption that extensive and diverse aquatic habitatbenefits least tern populations is based on the facts that: (1) most largepopulations are found along the coast, particularly in the vicinity of inlets;and (2) interior populations of least terns have declined drastically (Ducey1981) concurrent with a significant decrease in aquatic habitat (i.e., arealextent and, correspondingly, diversity) throughout much of their range(Williams 1978a; Burke and Robinson 1979; Schulenberg and Ptacek 1984).
13

The suitability index value for food (SIF) is assumed to be a function ofthe areal extent of surface water and diversity of foraging habitat within theaverage maximum flight distance from the potental nesting habitat. Therelationship between suitability values calculated using Figures 3 and 4 isillustrated in Equation 1. SIV1 is weighted to reflect the assumed greaterrelative significance of the quantity of foraging habitat.
SIF - 2(SIV1) + SIV2- 3 (1)
Reproduction component. Reproductive (i .e., nesting) habitat suitabilityfor the least tern is related to a combination of several factors; percentvegetat i on cover, average hei ght of vegetation cover, type of substrate,suscept i bi 1i ty to fl oodi ng, and the amount of predation and human-relateddisturbance. The first three variables are presented in the followingdi scuss ions. The 1atter "two factors are addressed under App1i cat i on of theMode 1.
Dense, tall vegetation on a potential nesting site can provide cover orconvenient perches for predators. Least terns generally nest in areas ofsparse vegetation and usually will not nest in areas with> 20% vegetationcover or in areas of tall vegetation. In some cases, sparse vegetation isnecessary to protect chicks from exposure to the sun and predators. However,least terns commonly nest successfully in habitats with no vegetation and thussuch habitats are considered to be highly suitable. It is assumed thathabitats with vegetation between 0% and 15% coverage provide optimum coversuitability (Fig. 5a), and in habitats with 0% vegetation other materials suchas water-deposited debris can serve the same purpose as vegetation. It alsois assumed that an area will have no suitability as nesting habitat whenvegetat i on exceeds 25% coverage. When percent vegetation cover is < 15% or> 25%, the suitability index for vegetation cover (SIC) is assumed to bedetermined solely by SIV3 (Fig. 5a).
When percent vegetation cover is ~ 15% and ~ 25%, suitability isdetermined by an assumed synergistic relationship between percent vegetationcover and the average height of vegetation (Fig. 5b). In such cases, it isassumed that an area has no suitability as potential nesting habitat when theaverage hei ght of vegetation i s ~ 40 cm. When percent vegetation cover is~ 15% and ~ 25%, the SIC is assumed to equal the value obtained usingEquation 2.
SIC = (SIV3 x SIV4)1/2
14
(2)

Fig. 5a. Fig. 5b.1.0 I 1.0........
(V) o::;t:> :>>-< 0.8 - >-< 0.8V'> V'>
X XClJ 0.6 ClJ 0.6-0 -0c c
>-< >-<
e-, 0.4 ~ 0.4...., ....,..........
0.2 .....0.2..0. ..0.
ta ta...., ....,..... .....::::l 0.0 ::::l 0.0V'> V'>
a 25 50 75 100 a 10 20 30 40+ (cm)a 3.9 7.9 11.9 15.7+{in)
Percent herbaceous and Average height of herbaceousshrub canopy cover and shrub canopy
Figure 5. The relationships between vegetation cover and thesuitability index values for least tern reproduction.
Least terns generally nest on unconsolidated substrate. Nesting successoften is influenced by the type of substrate used. Figure 6 ranks the variousmixtures of possible substrates of least tern nesting habitat. The bold lineswithin the triangle were delineated by a soil scientist (M. L. Peterson, U.S.Soil Conservation Service, Greeley, CO; unpubl.) and divide the triangle intothree areas based on perculation characteristics. The upper right area of thetri angl e represents we ll-dra i ned substrate, the lower 1eft area representspoorly drained substrate, and the area between these two represents moderatelywell-drained substrate. Superimposed on the three areas are six shaded categories which were delineated by biologists (R. F. Soots, Department of theArmy, Board of Engineers for Rivers and Harbors, For-t Belvoir, VA; pers.comm.; Thompson, pers. comm.) familiar with the requirements of least ternswith respect to nesting substrate. These categori es represent three classesof nesting substrate described as excellent, good, and poor. The triangle isused to evaluate substrate samples obtained from the potential nesting habitat.The triangle is read in the following manner: (1) locate the percentages ofsand, fragmentary material, and silt/clay on their respective sides of thetriangle; (2) follow the percentages inward on the triangle parallel with thelabeled percentage lines; and (3) the shaded portion in which the threepercentages intercept is the quality class into which the sample falls. Eachquality class is assigned a corresponding suitability value (SIV5). ThesUitability values derived from the triangle are based on the following assumptions: (1) the presence of sandy areas is a proximate factor controlling nestsite selection; (2) the presence of fragmentary material (e.g., pebbles,
15

100%Sand
60 5057%
% Silt/Clay
QUALITY OF NESTING SUBSTRATE
_ - excellent, SIV5 = 1.0
- good, SIV 5 = 0.8
o - poor, SIV5 = 0.2
100%Fragmentarymaterial
Figure 6. The relationship between substrate composition and thesuitability index value for least tern reproduction.
16

grave 1, shell, cora 1) enhances dra i nage of the nest site and stabi 1i zes thesubstrate; (3) large amounts of silt and clay inhibit drainage; (4) leastterns prefer not to nest on substrate composed almost entirely of fragmentarymaterial; and (5) consolidated substrate has no suitability for nesting.
The suitability index value for reproduction (SIR) is assumed to equalthe lower of the values obtained from an evaluation of vegetation cover (SIC)and substrate composition (SIV5).
HSI determination. Habitat suitability for the least tern is determinedby the quality of foraging habitat (SIF) and the quality of nesting habitat(SIR). The HSI for the least tern is equal to the lower of these two values.
Application of the Model
Application procedure. This model was designed to address the majorhabitat variables that affect the occupancy of potential nesting sites byleast terns throughout their range, as indicated by the literature. Due tothe wi de di stri but i on of the 1ea st tern, different subspeci es or differentpotential populations within a subspecies may not be affected by all habitatvariables included in the model. Consequently, the user should apply onlythose variables and procedures that pertain to the geographic area underevaluation. The following methodology is recommended for determining whencertain variables apply and how they should be implemented:
SIV1 and SIV2
SIV3 and SIV4
SIV5
Apply to all areas. It is recommended that an averagemaximum flight distance of 3.2 km be used in marinehabitats and 1.6 km in inland habitats.
Apply to all areas.
Applies to the following:
(1) Areas that are dominated by a silt/clay substrateand experience frequent and/or torrential precipitation during May and June. The assumption isthat potential nest sites would be threatened bywashout.
(2) Areas that are dominated by a sand substrate andexperience frequent high winds during May andJune. The assumption is that potential nest siteswould be threatened by an unstable substrate.
(3) Areas that are dominated by a fragmentary materialsubstrate. The assumption is that such areaswould be unattractive to nesting least terns.
If the area of evaluation does not fall into either ofthe three categories listed above, SIV5 can be excludedas a variable in the model.
17

Predation and human disturbance, variables not included in this model,can significantly influence the suitability of potential nesting habitat. Atthis time, no recommendations can be made for measuring and quantifying thesevariables. If significant predation and human disturbance occur on a potentialnest i ng site, thi s model may not provide an accurate measure of breedi nghabitat suitability. The literature shows that these categories of disturbancecan be partially or totally controlled by various management techniques (seeReproduction and Special Considerations). This model can be used to identifyareas that are more promising candidates for the implementation of managementefforts. It should be realized, however, that the control of predation oftenis quite difficult and many times unsuccessful (B. W. Massey, contractor withU.S. Fish and Wildlife Service, Laguna Niguel, CA; letter dated 17 July 1984).
The periodic processes of inundation, erosion, and deposition associatedwith fl ood di sturbances are generally necessary for the estab1i shment andperpetuation of least tern nesting habitat. However, such occurrences duringthe nesting period eliminate potential breeding habitat and are a direct causeof mortality for existing breeding populations (i .e., nests). The threat offlooding as a direct result of precipitation can be mitigated by the composition of the substrate (SIV5). Protection from flooding by high tides or highstream flows, however, can be assumed only if the habitat is located at ahigher elevation than the floodwater. It is assumed in this model that onlyhabitat that is at a higher elevation than a prescribed floodwater elevationhas potential as nesting habitat. Habitat that is at a lower elevation thanthe prescribed floodwater elevation is assumed to have a high probability ofinundation during the nesting period and, therefore, has no suitability asnesting habitat. The following methodology is recommended for selecting thatport i on of the habi tat that has a low probabi 1i ty of i nundat ion duri ng thenesting period.
In marine systems, potential least tern nesting habitat is subject toinundation by variations in sea level. Records of sea-level variations basedon tide stations located throughout the nesting range of the least tern in theUnited States are maintained by the National Ocean Service (Hicks et al.1983). It is recommended that the mean high water (MHW) tidal datum (Hicks1984) be used to represent the floodwater elevation. The mean high water line(MHWL) is used to represent the interface of the land with the water surfaceat the elevation of MHW. Habitat that is located at a lower elevation thanthe MHWL is presumed to have a higher probability of inundation than habitatlocated at a higher elevation than the MHWL. Consequently, only habitat at ahigher elevation than the MHWL should be considered and evaluated as potentialnesting habitat. The designated MHWL should correspond to the highest singleelevation recorded for the combined months of May and June, based on the tidestation(s) in closest proximity to the area under evaluation (National Oceanicand Atmospheric Administration 1984). Information on the MHWL can be obtainedby contacting:
Tidal Datum SectionNOAA/National Ocean Service6001 Executive BoulevardRockville, MO 20852(301) 443-8467
18

In riverine systems, potential least tern nesting habitat is subject toinundation by periodic increases in stream discharge. Each river presents aunique hydrologic problem due to site-specific geomorphology and lateral inflow
,conditions. Therefore, when attempting to determine the floodwater elevation,users of this model are strongly urged to consult with professionals who arefamiliar with streamflow conditions in the area under evaluation. Many riversystems display irregular flood frequencies, making a concrete definition of aflood regime difficult, if not impossible. The objective is to determine anddelineate that portion of the habitat that is least likely to be floodedduring the months of May and June.
A determination of the potential nesting habitat1s spatial relationship tothe floodplain should first be made. A floodplain is defined as that portionof the ri ver drainage that is inundated duri ng a flood (Wi 11 i ams 1978b). Afloodplain can be subdivided into an inactive floodplain (i .e., terrace) andan active floodplain (i .e., floodplain). An inactive floodplain is rarelyinundated resulting in an insignificant amount of erosion and deposition. Anactive floodplain is that portion of the floodplain where significant amountsof erosion and deposition have occurred in the recent past (e.g., 10 years).Some river reaches do not have an active floodplain. If a potential site isdetermined to lie wholly within the inactive floodplain, it can be assumed thatthe probability of inundation is so low that 100% of the area has potential asnesting habitat. If all or part of the habitat lies within the active floodplain, however, the floodwater elevation should be determined. Since theintensity and time of flooding can be subject to wide variations within andamong years, it is recommended that a mean river stage elevation for thecombined months of May and June be used to represent the average elevation offlood waters during the nesting period. This elevation would then be designated as the floodwater elevation for May and June. Gaging stations (wheremaintained) record the river stage discharge data used for obtaining thefloodwater elevation. This information can be obtained from several agencieswhich participate in the National Flood Insurance Program. These include theFederal Emergency Management Agency, U.S. Army Corps of Engineers, U.S.Geological Survey, U.S. Soil Conservation Service, U.S. Bureau of Reclamation,and State water resources agencies. Information also may be available atprivate consulting firms. In ungaged areas, the user must determine thefeasibility of extrapolating river stage discharge data from a gaged site. Ifextrapolation is judged to be infeasible, the user is advised to attempt toestimate which fraction of the habitat has a high probabil ity of floodingduring May and June. The designated area should then be omitted when identifying cover types of potential nesting habitat.
In riverine systems that experience extensive flooding during May andJune, least terns may occasionally nest on whatever nonflooded habitat that isavailable. However, nonflooded habitat during May and June is often covered bydense vegetation due to the lack of frequent flooding that controls vegetationencroachment. For management purposes, potential nesting habitat during Mayand June can be deli neated using the procedure di scussed above. Methods ofnesting site improvement discussed under Reproduction and SpecialConsiderations can then be implemented on the delineated habitat in order toincrease the suitability of the potential nesting habitat during May and Junewhen least terns are prepared to reproduce.
19

Least terns also can delay reproduction until suitable nesting habitat isexposed by receding floodwater. In areas where delayed reproduction is knownto occur on a regular basis, or in areas where little or no potential nestinghabitat is exposed during May and June, potential nesting habitat can bedelineated using the procedure discussed previously. In these areas, however,a mean river stage elevation for the months of July and August should be used.This alternate method of evaluation is recommended for areas where least ternsmust delay reproduction into the summer months because it is believed thathabitat should be assessed during the period of potential use. However, theuser should be aware that, in some cases, potential foraging habitat can beless suitable for least terns during summer months when some aquatic habitatmay dry up (Downing 1980).
It is recommended that the model be applied in the following manner:
1. Delineate the potential nesting habitat and evaluate its suitability(SIR) using SIV3, SIV4, and SIV5. For management purposes, specialemphasis should be given to island habitat that is less subject tomammalian predation and human disturbance.
2. Using a map or aerial photograph, delineate the average maximumflight distance zone around the perimeter of the potential nestinghabitat. On expansive areas of potential nesting habitat, radialdistances equal to the average maximum flight distance should bedelineated from random points within the habitat. Delineate covertypes of all aquatic habitat within the average maximum fl ightdistance that can be considered as foraging habitat (seeCover types). The map or photograph should accurately representaquat ic conditions as they occur duri ng May and June or July andAugust. This is crucial for an accurate evaluation of a riverinesystem with an active floodplain.
3. Determine the total aquatic area (SIV1) and number of disparateaquatic systems or wetlands (SIV2) that constitute foraging habitatwithin the average maximum flight distance zone. Determine thesuitability of foraging habitat (SIF) based on SIV1 and SIV2.
If an evaluation of a particular aquatic habitat is desired, potentialnesting habitats within the average maximum flight distance of the aquatichabitat should be located. The above procedure should then be applied to thepotential nesting habitats. Using this method, the aquatic habitat's relativecontribution to the overall reproductive habitat can be determined.
Summary of model variables. The relationships between habitat variables,life requisites, cover types. and the HSI value are summarized in Figure 7.Figure 8 provides variable definitions and suggested measurement techniques(Hays et al. 1981).
20

Hab i tat va riab Ie Life requisites Cover types
N......
Percent of the total area ,within the average maximumfl ight distance from the potentialnesting habitat that is aquatic
Number of disparate aquatic I
wetlands within the averagemaximum fl ight distance fromthe potential nesting habitat
Percent herbaceous and Ishrub canopy cover
Average height of herbaceous Iand shrub canopy
Substrate composition
[
Ma r ine IEs tua r i neFood -------------- Rive r in~ ---------- HS I
LacustrinePalustrine ----
[ Shore and BottomJReproduction Wetland HSI
Barren LandDesertic Herbland
Figure 7. Relationships between habitat variables, life requisites, cover types,and the HSI for the least tern.

Variable (definition)
Percent of the total area withinthe average maximum flightdistance from the potentialnesting habitat that is aquatic.
Number of disparate aquaticwetlands within the averagemaximum flight distancefrom the potential nestinghabitat.
Percent herbaceous and shrubcanopy cover [the percent ofthe ground surface that isshaded by a vertical projection of nonwoody vegetationand woody vegetation < 5 m(16.4 ft) tall].
Average height of herbaceousand shrub canopy [the averageheight from the ground surfaceto the dominant height stratumof the herbaceous or shrub(woody vegetation < 5 m tall)canopy].
Substrate composition (therelative proportions of sand,fragmentary material, andsilt/clay in the substrate).
Cover types
M,E,R,L,P
M,E,R,L,P
SBW,DH,BL
SBW,DH,BL
SBW,DH,BL
Suggested techniques
Remote sensing,mapping
Remote sensing,mapping
Remote sensing,line intercept
Line intercept,graduated rod
Sieve and hydrometeranalysis (AmericanSociety for Testingand Materials 1967)
Figure 8. Definitions of variables and suggested measurement techniques.
22

Model assumptions. This model was developed with information obtainedfrom the published literature and communications with professional biologistsfamiliar with the species and its habitat requirements. It attempts toidentify those physical parameters assumed most important in explaining habitatpotential, and then attempts to combine those parameters into simple algorithmsthat yield an index value between 0.0 and 1.0. The major assumptions in thismodel are:
1. Overall reproductive habitat quality can be assessed by evaluatingnesting and foraging habitat quality.
2. Reproductive habitat quality is equal to the lower of the liferequisite values. The lower life requisite value is assumed to bethe major limiting factor for reproductive potential.
3. The quantity and diversity of aquatic habitat are used as surrogatemeasures of food abundance. This is based on: (a) the assumptionthat the abundance and availability of small fish is directly relatedto these two variables; (b) the suggestion in the literature thatleast terns prefer abundant and diverse foraging habitat; and (c) theabsence of quantitative data that would establish a relationshipbetween fish biomass and least tern abundance.
SOURCES OF OTHER MODELS
Gochfeld (1983) developed a quantitative model of least tern nest sitesuitability in Long Island, New York. He examined site quality based on widthof sites above the high tide line, slope, substrate, and vegetation cover, andsite availability based on proximity to potential human disturbance and extentof off-road vehicle tracks. Qual ity and disturbance criteria were assignedscores of excellent, good, fair, or poor. The quality and disturbance scoreswere multiplied to obtain a composite habitat suitability score for each site.The composite score was used to classify sites as highly suitable, moderatelysuitable, or poor. It was found that 98% of colonies were on sites that hadbeen graded excellent or good quality and that 48% of colonies were on sitesmore or less free from human disturbance. Least terns nested on 67% of thehighly suitable sites and 17% of the poorly suited sites. Site tenacity wasbelieved to be at least as important as physical habitat characteristics indetermining occupancy.
Gochfeld's model was constructed based on data collected over a two yearperiod in Long Island. His model can be considered to be specific to thatarea, and may provide more accurate results for habitat in Long Island thanwould the HSI model in this document. The HSI model was constructed from datacollected throughout the breeding range of the least tern in the United Statesand is assumed to provide a general index of breeding habitat suitabilitythroughout the range of the species.
23

REFERENCES
Akers, J. W. 1975. The least tern in Virginia: breeding biology and population distribution. M.A. Thesis, Coll. William and Mary, Williamsburg,VA. 75 pp.
American Ornithologists' Union. 1983. Check-list of North American birds.6th ed. American Ornithologists' Union (Washington, D.C.). 877 pp.
American Society for Testing and Materials. 1967. Standard method forgrain-size analysis of soils. Am. Soc. for Testing and Materials 67:203-214.
Anderson, B. H. 1972. Some uncommon avian records for central Florida.Florida Nat. 45(6):192.
Anderson, J. M. 1977. Managing nongame wildlife on private lands. Trans. N.Am. Wildl. Nat. Res. Conf. 42:286-293.
Atwood, J. L., and P. R. Kelly. 1984. Fish dropped on breeding colonies asindicators of least tern food habits. Wilson Bull. 96(1):34-47.
Atwood, J. L., and D. E. Minsky. 1983. Least tern foraging ecology at threemajor California breeding colonies. Western Birds 14(2):57-72.
Atwood, J. L., R.' A. Erickson, P. R. Kelly, and P. Unitt. 1979. Californialeast tern census and nesting survey, 1978. Endangered Wildlife Program,E-W-2, Nongame Wildl. Invest., California Dept. Fish Game, Job V-2.13,Job Final Report (July 1979). v. p.
Bent, A. C. 1921. Life histories of North American gulls and terns. U.S.Natl. Mus. Bull. 113. v.p.
Blodget, B. G. 1978. The effect of off-road vehicles on least terns andother shorebirds. M.S. Thesis, Univ. Massachusetts, Amherst. 79 pp.
Brubeck, M. V., B. C. Thompson, and R. D. Slack. 1981. The effects oftrapping, banding, and patagial tagging on the parental behavior of leastterns in Texas. Colonial Waterbirds 4:54-60.
Buckley, F. G. 1978. Colony site selection by colonial waterbirds in coastalNew Jersey. Proc. Colonial Waterbird Group Conf. 2:17-26.
Buckley, P. A., and F. G. Buckley. 1976. Guidelines for the protection andmanagement of colonial nesting water birds. U.S. Natl. Park Serv.,Boston, MA. 54 pp.
. 1980. Population and colony-site trends of Long Island water---...,........,----:-----::--
birds for 5 years in the mid-1970's. Trans. Linnean Soc. 9:23-56.
Burger, J. 1984. Colony stability in least terns. Condor 86(1):61-67.
24

Burke, T. D., and J. W. Robinson. 1979. River structure modifications toprovide habitat diversity. Pages 556-561 in The mitigation symposium.U.S. For. Servo Gen. Tech. Rep. RM-65, pp. 556-561.
Burroughs, R. C. 1966. A study of the breeding biology of least terns onNantucket Island. M.S. Thesis, Univ. Massachusetts, Amherst. 87 pp.
California least Tern Recovery Team. 1980. California least tern recoveryplan. U.S. Fish Wildl. Serv., Reg. 1, Portland, OR. 58 pp.
Chambers, W. L. 1908. The present status of the least tern in southernCalifornia. Condor 10(6):237.
Collins, C. T., K. E. Bender, and D. D. Rypka. 1979. Report on the feedingand nesting habits of the California least tern in the Santa Ana Rivermarsh area, Orange County, California. U.S. Army Corps Eng., Los AngelesDistrict (DACW09-78-C-008). 30 pp.
Cowardin, L. M., V. Carter, F. C. Golet, andE. T. LaRoe. 1979. Classification of wetlands and deepwater habitats of the United States. U.S. FishWildl. Serv., FWS/OBS-79/31. 103 pp.
Craig, A. M. 1971. Survey of California least tern nesting sites.California Dept. Fish Game, Special Wildl. Invest., Proj. W-54-R-4, FinalReport, Job II -5.1. 7 pp.
Davis, M. E. 1968. Nesting behavior of the least tern (Sterna albifrons).M.S. Thesis, Univ. California, Los Angeles. 72 pp.
Dorr, D. K. 1976. Least tern, Sterna albifrons, nesting habitat in Maine andits relevance to the Critical Areas Program. Maine State Planning OfficeReport 11. 21 pp.
Downing, R. L. 1973. A preliminary nesting survey of least terns and blackskimmers in the east. Am. Birds 27(6):946-949.
_____~~~~. 1980. Survey of interior least tern nesting populations. Am.Birds 34(2):209-211.
Ducey, J. E. 1981. Interior least tern (Sterna antillarum athalassos).Unpubl. report prepared for U.S. Fish Wildl. Serv., Pierre, SD. 56 pp.
Erwi n , R. M. 1977 . Popul at i on and co 1ony site dynami cs in selectedMassachusetts waterbirds. Proc. Colonial Waterbird Group Conf. 1:19-25.
. 1978. Coloniality in terns: the role of social feeding.------C~o-n~d-or~80·(2):211-215.
Faanes, C. A. 1983. Aspects of the nesting ecology of least terns and pipingplovers in central Nebraska. Prairie Nat. 15(4):145-154.
Fisk, E. J. 1975. Least tern: beleagured, opportunistic, and roof-nesting.Am. Birds 29(1):15-16.
25

1978a. Roof-nesting terns, skimmers, and plovers in Florida.Florida Field Nat. 6(1):1-22.
__-=-:-----,--=-_. 1978b. The growi ng use of roofs by nesting terns.Bird-Banding 49(2):134-141.
Ganier, A. F. 1930. Breeding of the least tern on the Mississippi River.Wilson Bull. 42(2):103-107.
Gochfeld, M. 1983. Colony site selection by least terns: physical attributesof sites. Colonial Waterbirds 6:205-213.
Grover, P. B., and F. L. Knopf. 1982. Habitat requirements and breedingsuccess of charadriiform birds nesting at Salt Plains National WildlifeRefuge, Oklahoma. J. Field Ornithol. 53(2):139-148.
Hardy, J. W. 1957. The least tern in the Mississippi Valley. Publ. Mus.Michigan State Univ. Biol. Ser. 1(1):1-60.
Hays, M. B. 1980. Breeding biology of the least tern, Sterna albifrons, onthe Gulf Coast of Mississippi. M.S. Thesis, Mississippi State Univ.,State College. 69 pp.
Hays, R. L., C. Summers, and W. Seitz. 1981. Estimating wildlife habitatvariables. U.S. Fish Wildl. Servo FWS/OBS-81/47. 111 pp.
Hicks, S. D. 1984. Tide and current glossary. Natl. Oceanic Atmos. Admin.,Natl. Ocean Servo 28 pp.
Hicks, S. D., H. A. Debaugh, Jr., and L. E. Hickman, Jr. 1983. Sea levelvariations for the United States 1855-1980. Natl. Oceanic Atmos. Admin.,Natl. Ocean Servo 170 pp.
Hunter, M. L., Jr. 1975. Least tern breeding range extension in Maine. Auk92(1):143-144.
Jackson, J. A. 1976. Some aspects of the nesting ecology of least terns onthe Mississippi Gulf Coast. Miss. Kite 6(2):25-35.
Jenks-Jay, N. 1982. Chick shelters decrease avian predation in least terncolonies on Nantucket Island, Massachusetts. J. Field Ornithol.53(1):58-60.
Jernigan, L. R., J. Parnell, and T. Quay. 1978. Nesting habitats and breedingpopulations of the least tern (Sterna albifrons antillarum) in NorthCarolina. Natl. Oceanic Atmos. Admin., Sea Grant Publ. UNC-SG-78-07.39 pp.
Landin, M. C., and R. F. Soots. 1977.islands: a national perspective.1: 62-72.
Colonial bird use of dredged materialProc. Colonial Waterbird Group Conf.
26

Loftin, R. W., and A. L. Thomson. 1979. An artificial nest structure forleast terns. Bird-Banding 50(2):163-164.
Massey, B. W. 1971.California Dept.22 pp.
A breeding study of the California least tern, 1971.Fish Game, Wildl. Manage. Branch Admin. Rep. 71-9.
1974. Breeding biology of the California least tern. Proc.Linnean. Soc. NY. 72:1-24.
Massey, B. W., and J. L. Atwood. 1979. Application of ecological informationto habitat management for the California least tern. Prog. Rep. 1, U.S.Fish Wildl. Serv., Laguna Niguel, CA. v.p.
1980. Application of ecological information to habitatmanagement for the California least tern. Prog. Rep. 2, U.S. Fish Wildl.Serv., Laguna Niguel, CA. V.p.
1981a. Application of ecological information to habitatmanagement for the California least tern. Prog. Rep. 3, U.S. Fish Wildl.Serv., Laguna Niguel, CA. v.p.
________~~. 1981b. Second-wave nesting of the California least tern: agecomposition and reproductive success. Auk 98(3):596-605.
1982. Application of ecological information to habitatmanagement for the California least tern. Prog. Rep. 4, U.S. Fish Wildl.Serv., Laguna Niguel, CA. v.p.
McAtee, W. L., and F. E. L. Beal. 1912.rapacious birds in relation to man.497. 30 pp.
Some common game, aquatic, andU.S. Dept. Agric. Farmer's Bull.
McDaniel, B., and S. McDaniel. 1963. Feeding of least terns over land. Auk80(4):544.
McNicholl, M. K. 1975. Larid site tenacity and group adherence in relationto habitat. Auk 92(1):98-104.
Minsky, D. 1980. Preventing fox predation at a least tern colony with anelectric fence. J. Field Ornithol. 51(2):180-181.
Minsky, D., K. Keane, and A. White. 1984. A study of the breeding biology ofthe California least tern at Camp Pendleton, season of 1983. Nat. Res.Office, Camp Pendleton, CA. 53 pp.
Moseley, L. J. 1976. Behavior and communication in the least tern (Sternaalbifrons). Ph.D. Diss., Univ. North Carolina, Chapel Hill. 164 pp.
Moser, R. A. 1940. The piping plover and least tern in Omaha. Nebraska BirdReview 8(2):92-94.
27

National Oceanic and Atmospheric Administration. 1984. Index of tidestations: United States of America and miscellaneous other locations.Natl. Oceanic Atmos. Admin., Natl. Ocean Servo Draft report. 140 pp.
Nugent, P. 1974. Least terns in a cantaloupe patch. Chat 38(3):72.
Oberholser, H. C. 1974. The bird life of Texas. Vol. I. Univ. Texas Press,Austin. 530 pp.
Paige, B. B. 1968. The least tern in man's world. Florida Nat. 41:14-16.
Parmelee, D. F., M. D. Schwilling, and H. A. Stephens. 1969. Charadriiformbirds of Cheyenne Bottoms, Part II. Kansas Ornithol. Soc. Bull.20(3):17-24.
Portnoy, J. W. 1977. Nesting colonies of seabirds and wading birds - coastalLouisiana, Mississippi, and Alabama. U.S. Fish Wildl. Serv.,FWS/OBS-77/07. 102 pp.
Schulenberg, E., and J. Schulenberg. 1981. Distribution and ecology of thelittle tern in Kansas. Kansas Fish Game Comm. Nongame Wildl. Proj.76 pp.
Schulenberg, E., J. Schulenberg, and M. Schulenberg.ecological study of the least tern in Kansas.Nongame Wil dl. Proj. 110 pp.
1980. Distribution andKansas Fish Game Comm.
Schulenberg, J. H., and M. B. Ptacek. 1984. Status of the interior leasttern in Kansas. Am. Birds 38(6):975-981.
Schulenberg, J. H., and M. B. Schulenberg. 1982. Status of the interiorleast tern in Kansas. Kansas Fish Game Comm. Nongame Wildl. Proj.70 pp.
Soots, R. F., Jr., and J. F. Parnell. 1975. Ecological succession of breedingbirds in relation to plant succession on dredge islands in North Carolinaestuaries. North Carolina Sea Grant Publ. UNC-SG-75-27, Raleigh.91 pp.
Stiles, B. F. 1939. The least tern in Iowa. Iowa Bird Life 9:19-23.
Swanson, K. S. 1956. Least tern nests near Aurora. Nebraska Bird Rev.24(2):25.
Swickard, D. K. 1972. Status of the least tern at Camp Pendleton, California.California Birds 3(3):49-58.
1974. An evaluation of two artificial least tern nestingsites. California Fish Game 60(2):88-90.
Texas Waterbird Society. 1982. An atlas and census of Texas waterbirdcolonies 1973-1980. Texas Waterbird Soc. 358 pp.
28

Thompson, B. C. 1982. Distribution, colony characteristics, and populationstatus of least terns breeding on the Texas coast. Ph.D. Diss., TexasA&M Un i v ., CollegeStat ion. 124 PP.
Thompson, B. C., and R. D. Slack. 1982. Physical aspects of colony selectionby least terns on the Texas coast. Colonial Waterbirds 5:161-168.
Tomkins, 1. R. 1959. Life history notes on the least tern. Wilson Bull.71(4):313-322.
U.S. Fish and Wildlife Service. 1981. Standards for the development ofhabi tat suitabi 1ity index models. ESM 103. U.S. Fi sh Wi 1dl. Serv., Div.Ecol. Servo n.p .
. 1985a. Endangered and threatened wildlife and plants; Interior----=-----=-population of the least tern determined to be endangered. Fed. Register50(102):21,784-21,792.
__--;:::-;:;:...,..-;:;:-~--=-. 1985b. National species of special emphasis. Fed. Register50(89):19492.
Varza, D. 1975. The neglected tern. Underwater Nat. 9(2):12-14, 32.
Wnbur, S. R. 1974. The literature of the California least tern. U.S. Bur.Sport Fish. Wildl. Spec. Sci. Rep. Wildl. 175. 18 pp.
Williams, G. P. 1978a. The case of the shrinking channels - the North Platteand Platte Rivers in Nebraska. U.S. Dept. Int., Geol. Surv. Circ. 781.48 pp.
1978b. Bank-full discharge of rivers. Water Resour. Res.14(6): 114·1-1154.
Wycoff, R. S. 1950. (Untitled). Nebraska Bird Rev. 18(3):50-51.
______ . 1960. The least tern. Nebraska Bird Rev. 28(3):39-42.
29

502n·,nlREPORT DOCUMENTATION 11. REPORT NO. 12.
PAGE Biological Report 82 (10.103)3. Reclpl.nt's Acc....on No.
.. Tltl. and Subtltl.
Habitat Suitability Index Models: Least Tern5. R.port Oat.
August 1985..7. Autt!or(s)
Raymond G. Carrekera. Performln. O,.anlzatlon R.pt. No.
10. Project/Task/Work Unit No.
11. ContrKt(C) 01' Grant(G) No.
(C)
(G)
t--- ---:------------,-,- - .----:=-----~;_____;__;_;_-=_---_+_-----------__l9. Performl"lli Orpnllatlon Nama and Add....s Wes tern Energy and Land Use Team
U.S. Fish and Wildlife ServiceDrake Creekside Building One2627 Redwing RoadFort Collins, CO 80526-2899
12. Sponsorln. OrpnlZlltion Nam. and Addr... Wes tern Energy and Land Use Team 13. Type of R.port & P.rlod Cov.red
Division of Biological ServicesResearch and DevelopmentFish and Wildlife Service 1..
DeDartment of the Interior Washinato I. DC 2024015. Suppl.m.ntaryNot.s The Biological Report series was initiated in October 1984 to replace the
FWS/OBS series published since 1976. The report number assigned to this model followsconsecutively from the Habitat Suitability Index models published as FWS/OBS-82/10._, nownumbered as Bioloaical Report 82110. l .
1.. AbatrKt (Umlt: 200 _rdS)
A review and synthesis of existing information were used to develop a HabitatSuitability Index (HSI) model for the least tern (Sterna antillarum). The modelconsolidates habitat use information into a framework appropriate for fieldapplication, and is scaled to produce an index between 0.0 (unsuitable habitat)and 1.0 (optimum habitat). HSI models are designed to be used with HabitatEvaluation Procedures previously developed by the U.S. Fish and Wildlife Service.
17. Document Analysis a. Descriptors
BirdsWi 1dl ifeHabi tabi 1ityMathematical models
b. Identlflers/Open·Ended T.rms
Least ternSterna antillarumHabitat suitability
c. COSATI FI.,d/Group
II. Availability Stat.m.nt
Release unlimited
19. Security CIa.. (This R.port)
Unclassified20. Sacurl~ Class rr:hls Pa••)
Unclassitied
21. No. of Pa••s
2922. Price
OPTIONAL FORM 272 (4-77)(Formerly NTIs-35)Oepartment of Commerce

......,- . .. ..~
""
* Headquarters , 0lvI5 10n Of Biolog icalservices . Wasn,ngton . DC
)( Eastern Energy and Land Use TeamLeerown. WV
* Naloonal Coastal Ecosystems TeamSlide ll LA
• Western Energy aM LaM Use TeamFI ccu.ns. CO
• Locat ions of RegIonal Ollices
UGION 1Rqiunlll DirectorO.S. Fish lind Wildlife ServiceUoyd Five Hundred Building, Suite 1692500N.E. Multnomah StreetPortland, Oregon 97232
REGION 4Regional DirectorU.S. Fish and Wildlife ServiceRichard B. Russell Building75 Spring Street, S.W.Atlanta, Georgia 30303
,,I__r----
6!,-----L, J_1, : ,---
I ,I
REGION 2Regional DirectorU.S. Fish and Wildlife ServiceP.O. Box 1306Albuquerque, New Mexico 87103
REGION SRegional DirectorU.S. Fish and Wildlife ServiceOne Gateway CenterNewton Comer, Massachusetts 02158
REGION 7Regional DirectorU.S. Fish and Wildlife Service10II E. Tudor RoadAnchorage, Alaska 99503
,."
REGION 3Regional DirectorU.S. Fish and Wildlife ServiceFederal Building, Fort SnellingTwin Cities, Minnesota 5SIII
REGION 6Regional DirectorU.S. Fish and Wildlife ServiceP.O. Box 25486Denver Federal CenterDenver, Colorado 80225

DEPARTMENT OF THE INTERIORu.s. FISH AND WILDLIFE SERVICE
As the Nation's principal conservation asency, the Department of the Interior has responsibility for most of our .nationally owned public lands and natural resources. This includesfosterins the wisest use of our land and water resources, protecting our fish and wildlife,preserving th.environmental and cultural'values of our national parks and historical places,and providing for the enjoyment of life throulh outdoor recreation. The Department assesses our energy and mineral resources and works to assure that their development is inthe best interests of all our people. The Department also has a major responsibility forAmerican Indian reservation communities and for people who live in island territories underU.S. administration.