habitat suitability index models: eastern … suitability index models: eastern wild turkey.. ,\....
TRANSCRIPT

BIOLOGICAL REPORT 82(10.106)AUGUST 1985
HABITAT SUITABILITY INDEX MODELS:EASTERN WILD TURKEY
.. ,\ .I.\
Fish and Wildlife Service
). Department of the InteriorSK361. U54no . 8210 .106

This is one of the first reports to be published in the new "BiologicalReport" series. This technical report series, published by the Researchand Development branch of the U.S. Fish and Wildlife Service, replacesthe "FWS/OBS" series published from 1976 to September 1984. The Biological Report series is designed for the rapid publication of reports withan application orientation, and it continues the focus of the FWS/OBSseries on resource management issues and fish and wildlife needs.
MODEL EVALUATION FORM
Habitat models are designed for a wide variety of planning applications where habitat information is an important consideration in thedecision process. However, it is impossible to develop a model thatperforms equally well in all situations. Assistance from users andresearchers is an important part of the mode 1 improvement process. Eachmodel is published individually to facilitate updating and reprinting asnew information becomes available. User feedback on model performancewill assist in improving habitat models for future applications. Pleasecomplete this form following application or review of the model. Feelfree to include additional information that may be of use to either amodel developer or model user. We also would appreciate information onmodel testing, modification, and application, as well as copies of modifiedmodels or test results. Please return this form to:
Habitat Evaluation Procedures GroupU.S. Fish and Wildlife Service2627 Redwing Road, Creekside OneFort Collins, CO 80526-2899
Thank you for your assistance.
Speci es
Habitat or Cover Type(s)
GeographicLocation
Management Action AnalysisType of Application: Impact AnalysisBaseline Other -------------------------
Variables Measured or Evaluated
Was the species information useful and accurate? Yes No
If not, what corrections or improvements are needed?-----------

Were the variables and curves clearly defined and useful? Yes No
If not, how were or could they be improved?
Were the techniques suggested for collection of field data:Appropriate? Yes NoClearly defined? Yes NoEasily applied? Yes No
If not, what other data collection techniques are needed?
Were the model equations logical? Yes NoAppropriate? Yes No
How were or could they be improved?
Other suggestions for modification or improvement (attach curves,equations, graphs, or other appropriate information)
Additional references or information that should be included in the model:
Model Evaluator or Reviewer Date------------Agency _
Address
Telephone Number Comm:----------- FTS

Biological Report 82(10.106)August 1985
HABITAT SUITABILITY INDEX MODELS: EASTERN WILD TURKEY
by
Richard L. SchroederHabitat Evaluation Procedures GroupWestern Energy and Land Use Team
U.S. Fish and Wildlife ServiceDrake Creekside Building One
2627 Redwing RoadFort Collins, CO 80526-2899
Western Energy and Land Use TeamDivision of Biological Services
Research and DevelopmentFish and Wildlife Service
U.S. Department of the InteriorWashington, DC 20240

This report should be cited as:
Schroeder, R. L. 1985. Habitat suitability index models: Eastern wildturkey. U.S. Fish Wildl. Servo Biol. Rep. 82(10.106). 33 pp.
PREFACE
This document is part of the Habitat Suitability Index (HSI) Model Series[Biological Report 82(10)J which provides habitat information useful for impactassessment and habi tat management. Several types of habitat i nformati on areprovided. The Habitat Use Information Section is largely constrained to thosedata that can be used to derive quantitative relationships between key environmental variables and habitat suitability. This information provides thefoundat i on for the HSI model and may be useful in the development of othermodels more appropriate to specific assessment or evaluation needs.
The HSI Model Section documents the habitat model and includes informationpertinent to its application. The model synthesizes the habitat use information into a framework. appropriate for field application and is scaled toproduce an index value between 0.0 (unsuitable habitat) and 1.0 (optimumhabitat). The HSI Model Section includes information about the geographicrange and seasonal application of the model, its current verification status,and a list of the model variables with recommended measurement techniques foreach variable.
The model is a formalized synthesis of biological and habitat informationpublished in the scientific literature and may include unpublished informationreflecting the opinions of identified experts. Habitat information aboutwildl ife species frequently is represented by scattered data sets collectedduring different seasons and years and from different sites throughout therange of a speci es , The model presents thi s broad data base ina formal,logical, and simplified manner. The assumptions necessary for organizing andsynthesi zi ng the speci es-habitat i nformat ion into the model are di scussed.The model shoul d be regarded as a hypothesi s of speci e s-hab t tat re 1at i onshipsand not as a statement of proven cause and effect re 1at i onshi ps. The mode 1may have merit in planning wildlife habitat research studies about a species,as well as in providing an estimate of the relative quality of habitat forthat species. User feedback concerning model improvements and other suggestions that may increase the utility and effectiveness of this habitat-basedapproach to fish and wildlife planning are encouraged. Please send suggestionsto:
Habitat Evaluation Procedures GroupWestern Energy and Land Use TeamU.S. Fish and Wildlife Service2627 Redwing RoadFt. Collins, CO 80526-2899
iii

iv
CONTENTS
Page
PREFACE iiiACKNOWLEDGMENTS vi
HABITAT USE INFORMATION 1Genera 1 1Food 1Water 3Cover 4Reproduct ion 5Interspersion and Composition..................................... 7Special Considerations............................................ 8
HABITAT SUITABILITY INDEX (HSI) MODEL.................................. 9Model Applicability 9Model Description................................................. 10Application of the Model.......................................... 23
SOURCES OF OTHER MODELS 28
REFERENCES 28
v

ACKNOWLEDGMENTS
William M. Healy, George A. Hurst, John B. Lewis, Terry W. Little,Will i am E. Porter, and Dan W. Speake are gratefully acknowl edged for thei rreview of this habitat model. The cover of this model was illustrated byJennifer Shoemaker. Word processing was provided by Carolyn Gulzow and DoraIbarra.
vi

EASTERN WILD TURKEY (Meleagris gallopavo sylvestris)
HABITAT USE INFORMATION
General
Eastern wild turkeys (Meleagris gallopavo sylvestris) occupy a wide rangeof habitats (Dickson et al. 1978; Bailey et al. 1981), with diversifiedhabitats providing optimum conditions (Bailey and Rinnell 1968; Bailey et al.1981). Bottomland hardwood forests in association with upland forests, fields,and pastures is the preferred turkey range in the Southeast (G. A. Hurst,Department of Wildlife and Fisheries, Mississippi State University, MississippiState; letter dated December 3, 1984). Clearings and savannas scatteredthroughout the forest provide important brood-reari ng, feedi ng, and dustingsites (Bailey et al. 1981). Preferred habitat in forested regions of theagricultural midwest consists of equal amounts of forest and open pastures orcropland, with abundant edge between these habitats (Little 1980; W. F. Porter,College of Environmental Science and Forestry, State University of New York,Newcomb; letter dated December 18, 1984).
Eastern wild turkeys are residents in 34 states, from the southern tip ofMaine west to southwestern Minnesota, south through eastern Nebraska to eastTexas, and across the southern states, excluding Florida (Bailey 1980).
Food
Eastern wild turk.eys are opportunistic omnivores (Bailey and Rinnell1968) and their diet reflects the types of plant and animal foods that areavailable (Dalke et al. 1942). The average annual food intake of the turkeyconsists of 90% plant and 10% animal material (Korschgen 1967). Principalplant food groups in the diet include mast, fruits, seeds, greens, and agricultural crops. Analysis of the contents of 524 turkey stomachs from Virginiarevealed over 354 species of plants, representing 80 families (Mosby andHandley 1943). Turkeys also eat a wide variety of animal matter (Korschgen1967) .
Acorns are an important staple food and comprise an average of 17% of theyear-round diet by volume, and 32% of the fall and winter diet (Korschgen1967). Acorns were eaten year round in Missouri, with monthly volumes rangingfrom a trace in July to 73.3% of the January diet. Acorns comprised one-halfto two-thirds of the fall, winter, and spring foods of the eastern wild turkeyin Pennsylvania (Kozicky 1942 cited by Korschgen 1967). A variety of oakspecies (Quercus spp.) should be maintained to avoid acorn crop failures, andto help stabilize both food supplies and wildlife populations that use acorns
1

(Christisen and Korschgen 1955). Mast failures in Georgia and Alabama did notaffect turkey survival due to the general availability of alternate foodsources (Markley 1967). Turkeys in Louisiana had high population densities insome habitats where oaks were scarce (Dickson et al. 1978). Turkeys in thisarea obtained green forage from winter crops or from areas that were burned inthe winter, as well as mast from species other than oaks.
Grass leaves and seeds are important foods and are consumed mostfrequently duri ng wi nter and spri ng (Korschgen 1967). Turkeys in Mi ssouriused a wide variety of foods; optimum management practices provide for establishing and maintaining diversified habitats within their annual range(Korschgen 1973). Food produced in forest openi ngs and open woodl ands wasused extensively by turkeys. Flowering dogwood (Cornus florida), black gum(Nyssa syl vat i ca), wil d cherry (Prunus serot ina), hackberry (CeltisoCCTdentalis), and similar trees add diversity to the food supply and improveturkey habitat.
Food was not believed to be a limiting factor for turkeys in West Virginia(Bailey and Rinnell 1968) or in the Georgia and Alabama portion of their range(Mark"ley 1967). However, Davis (1976) noted that food can be a limitingfactor in areas wi th 1arge pure stands of pi ne (Pi nus spp.). I n an Alabamastudy area dominated by young pine plantations, food was provided primarily byother forest types (Kennamer et al. 1980). Food also may be lacking duringwinters in the upper Mississippi Valley portion of the wild turkey's range(Porter et al. 1980). Home range size and habitat use are influenced by theavailable food resources, with winter food needs exerting the greatest impact(Lewis and Kurzejeski 1984).
The food habits of eastern wild turkeys vary throughout the year (Baileyand Rinnell 1968). Fruits of virtually all plant species are taken in season.Spring foods in Missouri were. obtained from the following plant types(percentages are volume measurements): trees (mostly oaks), 53.6%; farmcrops, 16.6%; forbs, 13.4%; native grasses, 3.9%; shrubs, 3.7%; sedges (Carexspp.), 3.1%; and vines, 0.8% (Korschgen 1973). Animal foods and plant gallsprovi ded the remainder of the spri ng foods. Green herbaceous growth fromwheat (Triticum aestivum), rye (Secale cereale), and alfalfa (Medicago sativa)was an important spring food source in another Missouri study (Ellis and Lewis1967). In West Virginia, grass is important all year, but especially in earlyspring when turkeys apparently subsist on it (Bailey and Rinnell 1968).Wheat, rye, and other similar green vegetation provides important turkeyforage in late winter and early spring (Hurst, unpubl.).
Insects are important summer foods for young turkey poults (Bailey andRinnell 1968; Hurst and Stringer 1975). In Mississippi, poults 3 to 7 daysold consumed 79% animal food and 21% plant food (Hurst and Stringer 1975).The percentage of animal foods consumed declined steadily as poults got older,and animal foods accounted for only 13% of the diet at 22 to 38 days of age.Insects made up over 80% of the animal foods consumed. Summer foods ofjuvenile turkeys in Alabama included 61.5% grasses (mostly seeds) and 15.5%grasshoppers (Orthoptera), by volume (Hamri ck and Davi s 1972). Animal foodswere more abundant in forest openings and other areas with abundant herbaceousgrowth, than in forested habi tats (Bl ackburn et a 1. 1975; Hurst and Stri nger1975; Martin and McGinnes 1975). Forest clearings in Virginia contained 25
2
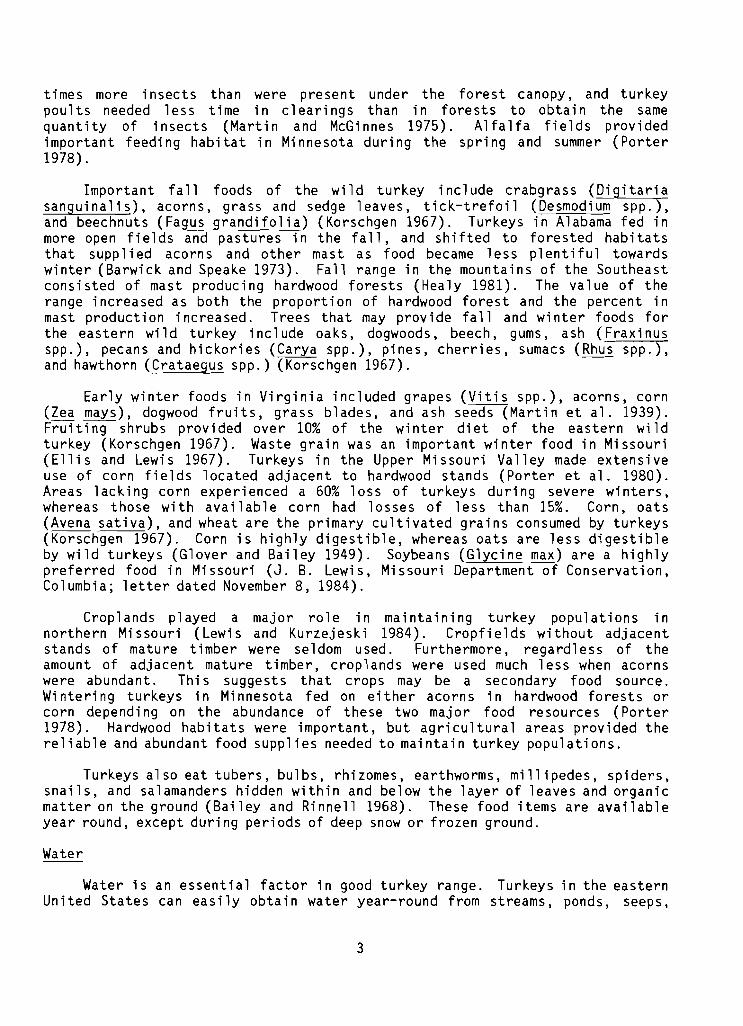
times more insects than were present under the forest canopy, and turkeypoults needed less time in clearings than in forests to obtain the samequantity of insects (Martin and McGinnes 1975). Alfalfa fields providedimportant feeding habitat in Minnesota during the spring and summer (Porter1978).
Important fall foods of the wild turkey include crabgrass (Digitariasanguinalis), acorns, grass and sedge leaves, tick-trefoil (Desmodium spp.),and beechnuts (Fagus grandifolia) (Korschgen 1967). Turkeys in Alabama fed inmore open fi e1ds and pastures in the fall, and shi fted to forested habi tatsthat supplied acorns and other mast as food became less plentiful towardswinter (Barwick and Speake 1973). Fall range in the mountains of the Southeastconsisted of mast producing hardwood forests (Healy 1981). The value of therange increased as both the proportion of hardwood forest and the percent inmast production increased. Trees that may provide fall and winter foods forthe eastern wild turkey include oaks, dogwoods, beech, gums, ash (Fraxinusspp.), pecans and hickories (Carya spp.), pines, cherries, sumacs (Rhus spp.),and hawthorn (Crataegus spp.) (Korschgen 1967). ----
Early winter foods in Virginia included grapes (Vitis spp.), acorns, corn(Zea mays), dogwood fruits, grass blades, and ash seeds (Martin et al. 1939).Frui t i ng shrubs provi ded over 10% of the wi nter di et of the eastern wi 1dturkey (Korschgen 1967). Waste grain was an important winter food in Missouri(Ellis and Lewis 1967). Turkeys in the Upper Missouri Valley made extensiveuse of corn fields located adjacent to hardwood stands (Porter et al. 1980).Areas 1ack i ng corn experi enced a 60% loss of turkeys duri ng severe wi nters,whereas those with available corn had losses of less than 15%. Corn, oats(Avena sativa), and wheat are the primary cultivated grains consumed by turkeys(Korschgen 1967). Corn is highly digestible, whereas oats are less digestibleby wild turkeys (Glover and Bailey 1949). Soybeans (Glycine max) are a highlypreferred food in Missouri (J. B. Lewis, Missouri Departmentof Conservation,Columbia; letter dated November 8, 1984).
Croplands played a major role in maintaining turkey populations innorthern Missouri (Lewis and Kurzejeski 1984). Cropfields without adjacentstands of mature timber were seldom used. Furthermore, regardless of theamount of adjacent mature timber, croplands were used much less when acornswere abundant. Thi s suggests that crops may be a secondary food source.Wi nteri ng turkeys in Mi nnesota fed on ei ther acorns in hardwood forests orcorn dependi ng on the abundance of these two major food resources (Porter1978). Hardwood habitats were important, but agricultural areas provided thereliable and abundant food supplies needed to maintain turkey populations.
Turkeys also eat tubers, bulbs, rhizomes, earthworms, millipedes, spiders,snails, and salamanders hidden within and below the layer of leaves and organicmatter on the ground (Bailey and Rinnell 1968). These food items are availableyear round, except during periods of deep snow or frozen ground.
Water
Water is an essential factor in good turkey range. Turkeys in the easternUnited States can easily obtain water year-round from streams, ponds, seeps,
3

or depressions in the ground (Korschgen 1967). Water was apparently notrequired in early brood ranges in the mountains of the Southeast, because hensand broods could obtain adequate amounts of water from their food (Healy1981). The presence of a free water source also was not an important factorin brood habitat selection in Minnesota (Porter 1980).
Cover
Wi ld turkeys use forested habitats for cover throughout the year, andspend a large amount of time loafing and feeding in open areas (Porter,unpub1.). A mi xture of forests and open 1ands may provide habi tat that isequal or superior to extensive forested areas (Little 1980; Hecklau et al.1982). Turkeys appear to prefer woodlands that are open and mature (Lindzey1967; Markley 1967), possibly because such habitats allow the turkey to useits keen eyesight to detect predators and increase its chances for escape andsurvival (Lindzey 1967). Dense, brushy areas are used for escape cover, butsuch areas are not preferred for normal activities. Favored travel areas in aGeorgia study had scant ground cover and good eye-level visibility (Eichholzand Marchinton 1976). Areas with dense briars or saplings were not used fortravel. Forested stands composed of one or only a few tree species (especiallyconifers) provide poor turkey habitat (Bailey and Rinnell 1968). Preferredforaging cover for hens with young consists of fields or open forests wherethe herbaceous vegetation is high enough to provide concealment and sparseenough to allow easy movement.
Ideal turkey range in Alabama was described as follows by Davis (1976:22):
lilt is generally agreed that ideal wild turkey range in Alabamaconsists of a minimum of 5,000 acres of a multi-aged, mixed, pinehardwood forest, interspersed with ample meadow or grassy openings.Ideal range should also have a relatively open understory, consisting of shrubs, vines, saplings and small trees, a high percentageof which are dogwood and other food-producing types such as plums,mayhaws, and muscadines. Openings may account for as much as 25-30percent of the total acreage, provided these are several in numberand are well di stributed throughout the forested habitat. Idealrange is well watered with springs, small streams, ponds, or riversand consists of the usual mixture of hardwood forest tree species,including a number of different kinds of oak s ."
Habitats providing poor turkey range include large acreages of even-aged,short rotation pine plantations, intensive agricultural areas (particularlyrow crops), and areas with either dense human populations or high levels ofhuman activity (Davis 1976).
Winter was a time of stress for wild turkeys in Vermont, and some flocksthat normally wintered in northern hardwoods sought dense conifers duringperiods of extreme cold (Bortner and Bennett 1980). Winter roost sites inPennsylvania were not different from adjacent forest stands, and forests witha balance of age classes that provide adequate food would likely provideadequate winter roost sites (Tzilkowski 1971).
4
Turkeys in southeastern Mi nnesota had di ffi cu1 ty movi ng in snow thatexceeded 25.0 cm in depth (Porter 1977), and prolonged periods of deep snow inthis region can be a limiting factor for turkeys (Porter et a1. 1980). Severewi nter weather with deep snows and a poor food supply caused hi gh wi ntermortality of turkeys in West Virginia (Glover 1948). Although snow may causesome mortality, the highest turkey populations and largest broods in WestVi rgi ni a often occurred in areas that recei ved the greatest snowfall (Bail eyand Rinne11 1968). Turkeys in another West Virginia study area tended to seekareas with the least amount of snow, for ease of feeding (Healy 1977). Feedingsites in cherry (Prunus spp.)-map1e (Acer spp.) forests were characterized byseeps, southern exposures, and sawtimber stands with a high proportion of wildcherry.
Turkeys in the Upper Mississippi Valley were frequently restricted bysnow in winter to less than 10% of their normal range (Porter et al. 1980).Spring seeps, important winter food source areas in the eastern United States,are uncommon in the Upper Mississippi Valley and mast production is oftenpoor. Areas with corn available through winter tended to provide enough highquality food to mitigate the effects of severe winters.
Turkey dusting sites are frequently in the dry residue of rotted logs, anthills, newly tilled soils, or other bare soil areas (Bailey and Rinne11 1968).
Reproduction
Turkeys nest on the ground in areas concealed by fairly dense brush,vines, deep grass, or fallen tree tops (Williams 1981). Hay fields, fencerows, and utility rights-of-way provide important nest sites in denselyforested areas. Nests in the Southeast were found mostly in or near openings(Hillestad 1973; Speake et a1. 1975), and large forested areas lacking openingsprovided poor nesting habitats (Davis 1976).
Thirty-seven percent of the nests in an Alabama study were on power linerights-of-way, although this cover type comprised only 0.6% of the study area(Everett 1982). Turkeys avoided nesting in the rights-of-way when the averagevegetation height was less than 25.0 cm during the first year these areas weremowed. Nests were placed in the rights-of-way in the second and third yearsafter mowing, when the vegetation consisted of mixed herbaceous growth and lowshrubs with heights from 1 to 2 m. Such vegetation conditions were preferrednest sites wherever they occurred, and provided 73% of all nest sites locatedin the study area.
Vegetation around nests in the mountains of the Southeast usually providedhens with a wide view of the surroundings, yet still provided concealing cover(Healy 1981). Ground cover less than 25.0 cm tall was usually sparse, whilecover 25.0 to 50.0 cm tall was provided by brush, vines, slash or fallen logs.Woody understory greater than 50.0 cm tall and 1ess than 2.5 cm dbh wasfrequently moderately dense. Preferred foraging cover for hens with youngappears to be that which is tall enough to conceal the young for the six weeksafter hatching, but short enough to allow females enough visibility to detectdistant predators (Porter, unpubl.). Healy (1981) concluded that all commonforest types in the Southeast could provide suitable nesting habitat.
5
Striped skunks (Mephitis mephitis), raccoons (Procyon lotor), and opossums(Didelphis marsupia1is) accounted for approximately two-thirds of nest predation in Alabama (Davis 1976). Logging, mowing, or haying may cause nestabandonment, or may cri pp1e or kill the hen. I n another Alabama study,raccoons, feral dogs, and opossums were the three most significant nestpredators (Speake 1980).
The essential feature of turkey brood habitat is adequate herbaceousvegetation (Healy and Nenno 1983), and the lack of high quality brood rearinghabitat may be a 1imiting factor for turkeys in some areas (Hillestad andSpeake 1970). The presence of high quality brood rearing habitat increasesthe rate of turkey poult survi va1 (Davi s 1976). In an Alabama study area,only 2% of the forest habitat contained openings, and it appeared that thisabsence of adequate brood range was a limiting factor for this turkey population (Everett 1982).
Broods in West Virginia preferred forest understories with abundantherbaceous growth and avoi ded stands with a dense woody understory (Pybus1977). Broods preferred forests with basal areas between 9 and 18 m2/ha andavoided forests with basal areas exceeding 23 m2/ha (Pack et a1. 1980).Coniferous forest types received little or no brood use.
Early brood range in the mountainous regions of the Southeast is characteri zed by abundant, low growi ng herbaceous cover, wi th few overstory trees(Healy 1981). The biomass of herbaceous vegetation is more important than thespecies composition. Sparse herbaceous understories, 9.0 to 23.0 cm tall and100 to 460 kg/ha dry weight, typi ca1 of many oak forests, di d not provi deenough seeds or insects for pou1 t feedi ng. Lush orchardgrass (Dactyl i sglomerata) stands, 78.0 cm tall and 3,380 kg/ha dry weight, provided anabundance of insects, but were too dense for foraging poults to move through.
Healy (1978) estimated that the best habitat for young broods in theSoutheast consisted of a complete cover of forbs and grasses, 40.0 to 70.0 cmtall, with a biomass of 600 to 3,000 kg/ha dry weight. This vegetationstructure provides food for both hens and poults, cover for poults, and allowshens to see over the top of the vegetation while remaining concealed. Thistype of vegetation is abundant in fields, and also occurs in mesic forests.Interspersion of trees and openings allows broods to escape predators and toselect a suitable microclimate within a short distance. As an alternative tobiomass measurements, Healy (W. M. Healy, U.S. Forest Service, Ho1dworth Hall,University of Massachusetts, Amherst; pers. comm.) recommended the followingto describe ideal early brood range: (1) 60 to 100% total vegetative cover(woody and herbaceous) in the understory; (2) vegetation heights from 20.0 to60.0 cm; and (3) at least one-half the vegetation comprised of herbaceousgrowth.
Forest clearings should be managed for young poults (less than one monthold) due to the poults' high mortality rates, small home ranges, specializedfood habits, and narrow habitat requirements compared to older poults andadults (Healy and Nenno 1983). Brood range for older poults can be providedby a 1arger vari ety of habitat types. 01 der poults can utili ze most forestopenings, including those that were too dense for young poults (Healy 1981).
6
Good brood habitat in Mississippi was thought to consist of poorly managed(unimproved) pastures (Owen 1976 cited by Hurst 1978) which provided an abundance of insect and plant food, and cover in the form of clumps of woodyvegetation (Hurst 1978). Savannah-like old fields appear to provide betterhabitat for turkey poults than intensively managed agricultural clearings(Nenno and Lindzey 1979). The benefits of the savannah-like fields include:(1) an increased vari ety of invertebrate foods; (2) a greater vari ety andabundance of plant foods; (3) a vegetation structure that allows easier poultmovements; (4) favorable microclimates; (5) increased edge; and (6) protectionprovided by the partial canopy cover. Tree canopy cover ranging from 30 to60% allows for adequate herbaceous growth, and is a preferred brood habitat.
Females with broods in Minnesota spent as much as half of their daytimehours in crop and hay fields (Porter 1978). Corn fields provided loafing andescape cover for hens, whereas broods spent most of their time in alfalfafields.
Reclaimed surface mines in Pennsylvania can provide useful brood habitat,depending on vegetation density and corresponding insect abundance (Andersonand Samuel 1980). Grain drill planting of cover crops in such areas providedgreater mobility for poults than hydroseeding which resulted in matted vegetation. Poults used the row spaces in grain drilled areas for stalking invertebrates. The poults also had less contact with morning dew in these areas,which reduced the amount of required brood time with the hen.
Interspersion and Composition
An interspersion of grassy, permanent forest openings, along with theedges they create, enhances brood production of turkeys (81 ackburn et a1.1975). Different authors have reported varying requirements for the percentageof openings needed for good wild turkey range. Latham (1958) stated that atleast 10% of the total range should be in openings for satisfactory populations, and that clearings should be spaced so a hen need not travel more than1.6 to 3.2 km to find one. Speake et al. (1975) recommended that spring andsummer turkey habitat in the Southeast should include 12 to 25% of the area inwell-di spersed openi ngs. Poults ina Mi nnesota study area used about 29.0 hafor a weekly brood range (Porter 1980). Four or five such blocks of optimalbrood habitat per 10.0 km", or 1.8 km radius, appeared to satisfy summerhabitat needs of broods. This corresponds to a habitat with 11.6 to 14.5% ofthe area meeting brood needs.
The interspersion of hardwood forests and agricultural lands is animportant feature in providing favorable turkey habitat in the Upper Midwest(Porter 1978). Thriving turkey populations exist in Missouri in areas of 50%forest cover, with well-interspersed open land and alternate winter foods fortimes of low mast production (Ellis and Lewis 1967). Lewis and Kurzejeski(1984) suggested that optimal habitat in Missouri is approached in areas witha 50:50 mix of mast-producing forests and open lands. Of the 50% open lands,they suggested that at least 20% should be row crops, 45% pasture, and 25% oldfields. Recent studies of turkeys in Iowa also have suggested that a 50:50ratio of forests to open lands is better than extensive forests (Little 1980).
7
Iowa has reintroduced turkeys into such areas and subsequent populationdensities are among the highest reported for the eastern wild turkey. Fewforest stands in these areas exceed 400 ha in size, and most are smaller andscattered. The area has abundant edge between forest 1ands and crop andpasturelands, which provides access to insects for broods and waste grain forwinter food. Turkeys also occur on dairy lands in New York where most woodlotsare less than 101 ha in size (Bailey and Rinnell 1968). Turkeys in a Minnesotastudy survived and reproduced in areas with as little as 12% forest cover(Hecklau et al. 1982).
Turkeys did not readily use the centers of 12.2 to 24.3 ha fields inTennessee and Michigan, unless a peninsula of trees penetrated the field toprovide travel cover (Lewis 1964). Turkeys in Virginia were not observed inthe interior of a 24.3 ha clearcut, although they did use the edges (Raybourne1968). Turkeys crossed clearcuts less than 137 to 183 m in width, but onlytraveled 46 to 69 minto clearcuts greater than 274 m in width. Clearcutsgreater than 183 m in width may restrict turkey movements to the edge of thearea.
The annual and seasonal range sizes of wild turkeys are related to habitatquality (Everett 1982). Turkeys on poor ranges must move greater distances tomeet their needs than turkeys on better quality habitat. Turkey range sizesand movements are di ctated by the food supply (Korschgen 1967). The annua1ranges of males and females in Missouri were 448 ha and 553 ha, respectively(Ellis and Lewis 1967). In Alabama, male turkeys had an annual range of1,631 ha, and females had an annual range of 1,439 ha (Everett 1982). Averageseasonal range sizes in the Southeast were smallest for hens with broods(111 ha) and largest for hens in the fall and winter (430 ha) (Speake et al.1975). Winter ranges of most turkeys in a Minnesota study were less than25 ha due to the restri ct ions caused by snow cover (Porter 1977). Speakeet al. (1969) estimated that the requirements of a self-sustaining populationof turkeys could probably be met in an area of 3,240 to 4,050 ha. Lewis andKurzejeski (1984) suggested that a minimum of 750 ha of habitat is required inMissouri to insure high turkey population densities. Turkeys were introducedinto Presque Isle State Park in Pennsylvania, which has a high level of humanuse (Wunz 1971). Turkeys restri cted thei r movements to 81 ha of very denseunderstory. Wunz (1971) concluded that as little as 203 ha may be adequatefor establishing turkeys in forested areas with dense human populations.
In New York, hens (older than 1 year) moved an average of 5.5 km fromwinter range to nest sites, and an average of 1.9 km from nest sites to broodrearing areas (Eaton et al. 1976). Large improved pastures, roads, and largecropland clearings acted as barriers to turkey movements in Georgia (Eichholzand Marchinton 1976).
Special Considerations
Wild turkeys have a low tolerance of continuous and varied human activities (Davis 1976). Turkey populations may decline due to habitat lossesassociated with urbanization, highway and reservoir construction, expanded rowcrop farming, and conversion of large areas to short rotation, even-aged, pure
8

pine plantations. Turkey abundance usually is inversely correlated with humanabundance (Bailey and Rinnell 1968). However, there is a wide variation inwariness of humans among different turkey populations, depending on huntingpressure and other disturbance level s (Wright and Speake 1975). Humans areless of a disturbance factor where turkey hunting does not occur (Bailey andRinnell 1968). Turkey populations in Louisiana were significantly lower inareas where it was believed that poaching was a problem (Dickson et al. 1978).Human densities in Minnesota as high as 15 people/km 2 did not appear to affectsurvi va1 and reproduction of transplanted turkeys duri ng thei r fi rst year(Hecklau et al. 1982).
Turkeys in a Kentucky study avoided a large area that was used by off-roadvehicles (Wright and Speake 1975). Turkeys also avoided areas within 1,000 mof a new foot trail which was used by about 125 people/week, whereas similaradjacent habitats without trails were consistently used by turkeys. Areaswithin 1,000 m of a campground also were avoided by foraging turkeys. Turkeystolerated routine agricultural operations and were seen feeding in a largefield where a tractor was working at a distance of 500 m.
Forestry practices exert a strong i nfl uence on turkey numbers (Markley1967). Extensive clear-cutting may make areas unsuitable for turkeys. Hardwood removal and conversion to short rotation pine plantations also have anegative effect on turkeys.
Controlled burning of forests in the Southeast may be used to produce agreater abundance and diversity of accessible food items (Davis 1976). Burnedtracts of loblolly pine (P. taeda) - shortleaf pine (P. echinata) forestprovided either more insects or more available insects than areas that werenot burned for 4 years (Hurst 1978). Burned areas were more open and allowedease of movement for poults. Unburned areas (s 3 years since burning) providednest habitat, escape, and brood cover, and an abundance of dewberries (Rubustrivialis). However, both burned and unburned tracts in this forest type werenot as good for brood habitat as pastures and fields.
HABITAT SUITABILITY INDEX (HSI) MODEL
Model Applicability
Geographi c area. Thi s model was developed for app1i cat i on wi thi n theentire range of the eastern wild turkey. Current range maps for the easternwild turkey were not found in the literature. Users near the periphery of therange of the eastern wild turkey should consult local authorities to confirmthe appropriateness of applying this model.
Season. This model was developed to evaluate the year round habitatneeds of the eastern wild turkey.
9

Cover types. This model was developed to evaluate habitat qual ity inDeciduous Forested Wetland (DFW), Evergreen Forest (EF), Deciduous Forest(OF), Evergreen Tree Savanna (ETS), Deci duous Tree Savanna (DTS), EvergreenShrubland (ES), Deciduous Shrubland (OS), Evergreen Shrub Savanna (ESS),Deciduous Shrub Savanna (DSS), Grassland (G), Forbland (F), Pasture and Hayland(P/H), and Cropland (C) areas (terminology follows that of U.S. Fish andWildlife Service 1981).
Minimum habitat area. Minimum habitat area is defined as the minimumamount of contiguous habitat that is required before a species will occupy anarea. Based on annual range sizes reported in the literature, it is assumedthat a minimum of 900 ha of habitat must exi st or the HSI for eastern wi ldturkeys will equal zero.
Verification level. This model represents several hypotheses ofspecies-habitat relationships and does not reflect proven cause and effectrelationships. Previous drafts of this model were reviewed by William M.Healy, U.S. Forest Service, Northeastern Forest Experiment Station, Amherst,MA; George A. Hurst, Dept. of Wildlife and Fisheries, Mississippi StateUniversity, Mississippi State; John B. Lewis, Missouri Dept. of Conservation,Columbia; Terry W. Little, Iowa Conservation Commission, Des Moines; William E.Porter, State University of New York, Newcomb Campus, Newcomb; and Dan W.Speake, Alabama Cooperative Wildlife Research Unit, Auburn. Improvements andmodi fi cat ions suggested by these revi ewers have been incorporated into thi smodel, and are cited as personal communications, where appropriate.
Model Description
Overview. The year-round habitat needs of eastern wi ld turkeys can beprovi ded by a vari ety of di fferent cover types. The summer food and broodhabitat requirements are provided in areas containing herbaceous vegetation ofthe proper height and density, in proximity to protective woody cover. Suchareas provide abundant insect and plant foods for poults and adequate coverfor hens with poults. Coniferous cover types are generally avoided during thesummer.
Habitats with a variety of food sources provide potentially optimum foodvalues during fall, winter, and spring. Eastern wild turkeys prefer areaswith a diversity of food-producing trees and shrubs. Agricultural crops,especially corn and soybeans, also provide an important winter food source.
The cover needs of the adult turkey are provided in mature hardwoodforests with relatively open understories. It is assumed that nest sites willbe present if food and cover are adequate, and that water will not be a limiting factor due to its widespread availability throughout the range of theeastern wild turkey. The following sections provide written documentation ofthe 1ogi c and assumptions used to interpret the habi tat i nformat i on for theeastern wild turkey in order to explain the variables that are used in the HSImodel. Specifically, these sections identify important habitat variables,describe suitability levels of the variables, and describe the relationshipsbetween variables.
10
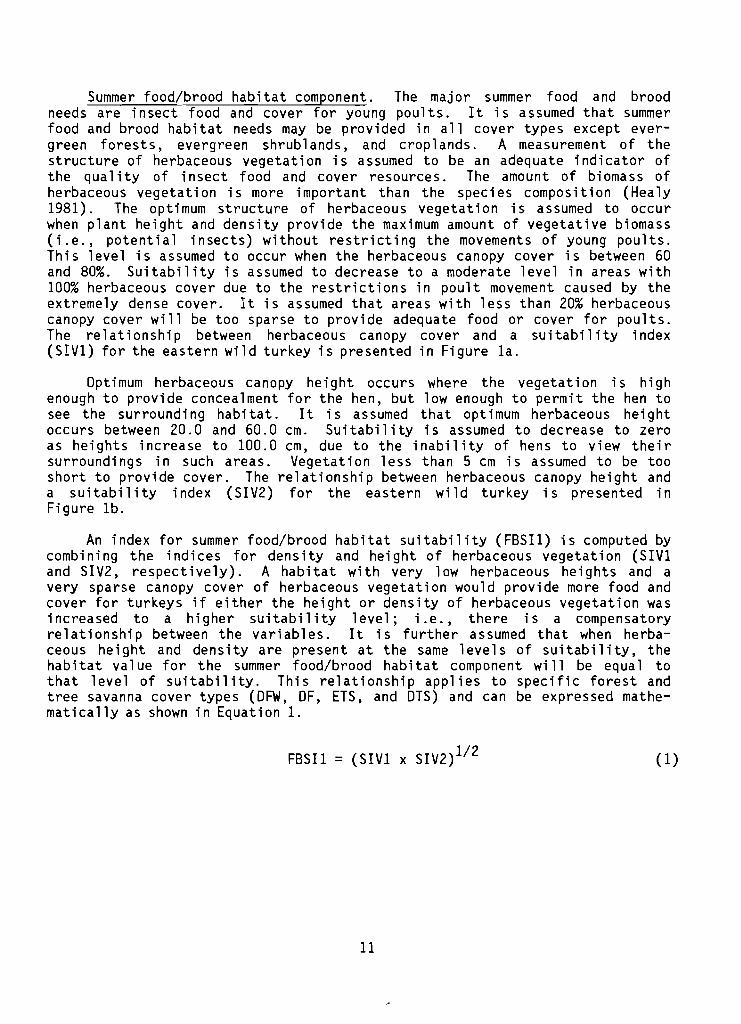
Summer food/brood habitat component. The major summer food and broodneeds are insect food and cover for young poults. It is assumed that summerfood and brood habitat needs may be provided in all cover types except evergreen forests, evergreen shrub1ands, and crop 1ands. A measurement of thestructure of herbaceous vegetation is assumed to be an adequate indicator ofthe qual ity of insect food and cover resources. The amount of biomass ofherbaceous vegetation is more important than the species composition (Healy1981). The optimum structure of herbaceous vegetation is assumed to occurwhen plant height and density provide the maximum amount of vegetative biomass(i .e., potential insects) without restricting the movements of young poults.This level is assumed to occur when the herbaceous canopy cover is between 60and 80%. Suitability is assumed to decrease to a moderate level in areas with100% herbaceous cover due to the restrictions in poult movement caused by theextremely dense cover. It is assumed that areas with less than 20% herbaceouscanopy cover will be too sparse to provide adequate food or cover for poults.The relationship between herbaceous canopy cover and a suitability index(SIV1) for the eastern wild turkey is presented in Figure 1a.
Optimum herbaceous canopy height occurs where the vegetation is highenough to provide concealment for the hen, but low enough to permit the hen tosee the surrounding habitat. It is assumed that optimum herbaceous heightoccurs between 20.0 and 60.0 cm. Suitability is assumed to decrease to zeroas heights increase to 100.0 cm, due to the inability of hens to view theirsurroundi ngs in such areas. Vegetation 1ess than 5 cm is assumed to be tooshort to provide cover. The relationship between herbaceous canopy height anda suitability index (SIV2) for the eastern wild turkey is presented inFigure lb.
An index for summer food/brood habitat suitability (FBSI1) is computed bycombining the indices for density and height of herbaceous vegetation (SIV1and SIV2, respectively). A habitat with very low herbaceous heights and avery sparse canopy cover of herbaceous vegetation would provide more food andcover for turkeys if either the height or density of herbaceous vegetation wasincreased to a higher suitability level; i.e., there is a compensatoryrelationship between the variables. It is further assumed that when herbaceous height and density are present at the same levels of suitability, thehabi tat va1ue for the summer food/brood habi tat component wi 11 be equa1 tothat level of sut t ab t l l ty . This relationship applies to specific forest andtree savanna cover types (OFW, OF, ETS, and OTS) and can be expressed mathematically as shown in Equation 1.
FBSI1 = (SIV1 x SIV2)1/2
11
(1)

Fig. 1a Fig. 1b
1.0 1.0..--l N::::- ::::-...... ......VI 0.8 VI 0.8x xQ) 0.6 Q)
0.6"0 "0s::: s:::...... ......>, 0.4 >, 0.4 -oj-) oj-)...... ......
......
..0 0.2 ..0 0.2co co+-' +-'...... ......~ ~
VI 0.0 VI 0.00 25 50 75 100 0 50 100+ cmPercent herbaceous canopy 0 19.7 39.4+ inches
cover Average height of herbaceouscanopy (summer)
Distance to forest or treesavanna cover types
Figure 1. The relationships between habitat variables used to evaluatesummer food and brood habitat and the suitability indices for thevariables.
12

The suitability of herbaceous vegetation for hens and broods is affectedby the proximity of forest cover that can be used for escape and protection.It is assumed that escape cover will not be a limiting factor in forested ortree savanna cover types. I n herbaceous domi nated cover types (e. g., grassland, forbland, and pasture and hayland), it is assumed that optimum suitabilities will exist when a tree dominated cover type is within 61 m. It also isassumed that herbaceous areas more than 122 m from forest cover wi 11 not beused by turkeys. These estimates are based on data from Lewis (1964) andRaybourne (1968) on turkey use of openings. Turkeys will move greaterdistances away from forest cover in cover types that provide overhead cover(Porter, unpubl.). It is assumed that in shrub dominated cover types(shrublands and shrub savannas) optimum suitabilities will exist when a treedominated cover type is within 100 m, and that shrub dominated areas fartherthan 400 m from forest cover will be unsuitable. The relationships betweenthe distances from herbaceous or shrub cover types and a suitability index arepresented in Figure 1c.
The value of the summer food/brood habitat component (FBSI2) in specificshrub and herbaceous dominated cover types is equal to the value determinedfor herbaceous height and density, directly modified by the value related tothe proximity of forest cover. The suitability of the herbaceous growth insuch areas will be directlY lowered as the distance to forest cover increases.
Tllfs re!at fonsllfp applies to specific shrub end nerbeceous cover types (aS,ESS, DSS, G, F, and P/H) and can be expressed mathematically as shown inEquation 2.
FBSI2 = (SIV1 x SIV2)1/2 x SIV3 ( 2)
Fall/winter/spring food component. Eastern wild turkeys are omnivorousopportunists (Bailey and Rinnell 1968) and the best management would provide adiversity of habitats within their annual range (Korschgen 1973). Fall,winter, and spring foods are provided in forests, shrublands, and croplandsand include hard mast, seeds, and soft mast produced by trees and shrubs, aswell as agricultural crops, especially corn or soybeans. Acorns are animportant food source in many areas, but are not essential, because othertrees may provide alternate foods. The specific trees used as food sourceswill vary across the range of the eastern wild turkey. Food producing speciesinclude, but are not limited to, oaks, dogwoods, beech, gums, ash, pecans,hickories, pines, wild cherry, hackberry, sumac, and hawthorn.
For purposes of this model, hard mast trees are assumed to include speciessuch as oaks, hickories, pecan, beech, and pine. Soft mast trees includespecies such as gums, ash, wild cherry, hackberry, sumac, and hawthorn. Forspecific applications of this model, it is suggested that users define a listof both hard and soft mast producing trees for the particular geographicregion of the application.
13

The amount of acorn mast produced in a forest varies from year to year,from species to species, and from tree to tree of the same species (Shaw1971). The number of acorns produced per tree increases in a linear relationship with increased tree diameter (Goodrum et al. 1971; Shaw 1971). Althoughacorn production is positively correlated with individual tree diameters,overall acorn production in forest stands is influenced by canopy conditionsand shading. Shaded trees produce less mast than trees grown in open s~ands.
The exact structural forest conditions that must exist to maximize hard mastproduction have not been reported in the literature.
McQuilkin and Musbach (1977) conducted a 14-year study of pin oak (Q.pa 1ustri s) acorn product i on on both fl ooded and unflooded sites in Mi ssouri .Their data indicated that mast production on plots with trees mostly 27.9 cmdbh or larger was 85% higher than on plots with most trees less than 25.4 cmdbh. On nonflooded plots, which would be most representative of typicalturkey habitat, there were no statistically significant differences in acornproduction on plots with low, medium, or high stocking rates. Low stockingrate plots had basal areas of 9.2 m2/ha, medium plots had basal areas of13.8 m2/ha, and high plots had basal areas of 17.2 to 20.7 m2/ha.
The low stocking rate in McQuilkin and Musbach's (1977) study is aboutequal to the lower 1imits of upland hardwood stands that are termed understocked by the U.S. Forest Service (Gingrich 1971). The stocking chart fromGingrich (1971:66) was used to estimate the minimum numbers of trees ofspecific size classes that are required to reach the lower limit of understocked stands. It is assumed that forests with tree densities below thislevel will show reduced hard mast production. Using the stocking chart, itcan be determi ned that, for 25.4 cm di ameter trees, 235 or more trees per haare needed to be at the lower limit of understocked stands. For trees 38.1 cmin diameter, 124 or more are needed per ha to reach the minimum stockinglevel. The relationships between the number of trees of various diameterclasses and suitability indices (SIV4) for the eastern wild turkey are shownin Fi gure 2a. It shoul d be noted that SIV4 is compri sed of two measuredhabi tat vari abl es: average dbh of hard mast trees that are greater than25.4 cm dbh; and number of hard mast trees/ha that are greater than 25.4 cmdbh.
It is assumed that total forest hard mast production will not increase attree densities above those shown as maximum in Figure 2a. This is based onthe assumption that although there wi 11 be more trees in such stands, theamount of mast produced per tree wi 11 be lower due to shadi ng and, thus,overall mast production will be the same. This assumption is supported by thestudy of McQuilken and Musbach (1977), which showed no difference in acornproduction at low, medium, and high stocking conditions. Although the preceding mast relationships were developed using data from oaks, it is assumed thatthe basic relationships will apply to all trees that produce hard mast.
In general, soft mast produci ng trees begi n to produce mast at small ertree di ameters than hard mast trees. Therefore, it is assumed that a measureof dbh is not needed for soft mast trees. A measurement of tree canopy closureof soft mast trees is assumed to provide an indirect measure of food abundance.
14
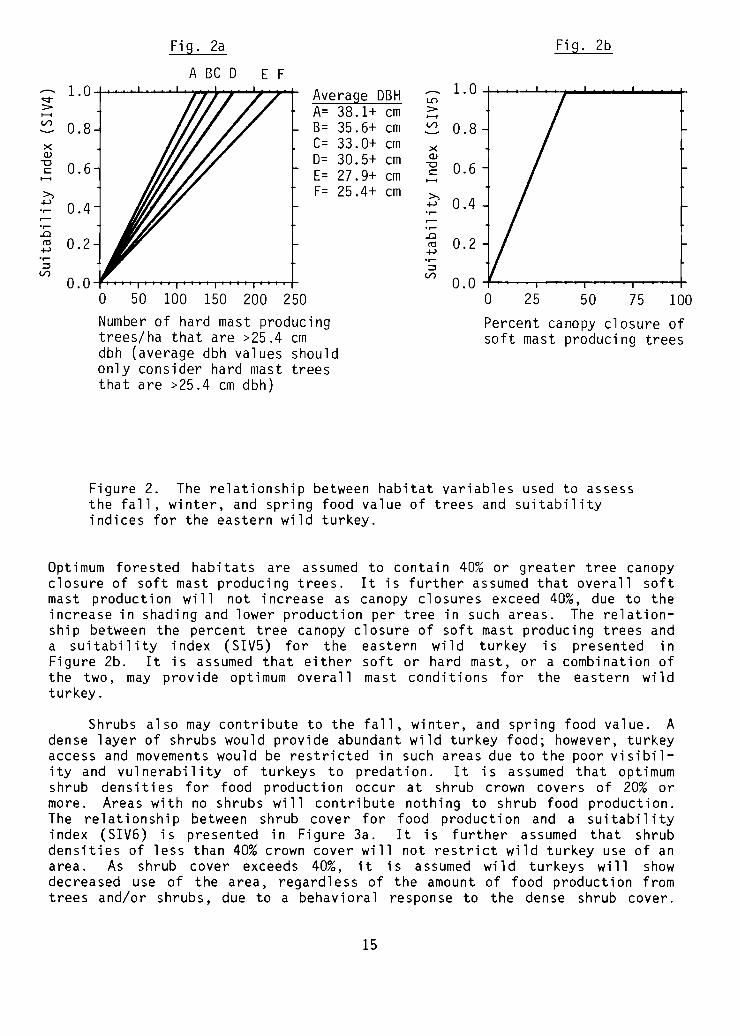
Fig. 2a Fig. 2b
A BC 0 E F1.0 Average DBH 1.0
q- L("):> A= 38.1+ em :>....... .......V> 0.8 B= 35.6+ em V> 0.8x C= 33.0+ em xQ) 0= 30.5+ em Q)
"'0 0.6 "'0 0.6I:: E= 27.9+ em I::....... .......>, F= 25.4+ em >,+J 0.4 +J 0.4
..0 ..0n:::l 0.2 n:::l 0.2+J +J
~ ~V> V>
0.0 0.00 50 100 150 200 250 0 25 50 75 100Number of hard mast producing Percent canopy closure oftrees/ha that are >25.4 em soft mast producing treesdbh (average dbh values shouldonly consider hard mast treesthat are >25.4 em dbh)
Figure 2. The relationship between habitat variables used to assessthe fall, winter, and spring food value of trees and suitabilityindices for the eastern wild turkey.
Optimum forested habitats are assumed to contain 40% or greater tree canopyclosure of soft mast producing trees. It is further assumed that overall softmast production will not increase as canopy closures exceed 40%, due to theincrease in shading and lower production per tree in such areas. The relationship between the percent tree canopy closure of soft mast producing trees anda suitability index (SIV5) for the eastern wild turkey is presented inFigure 2b. It is assumed that either soft or hard mast, or a combination ofthe two, may provide optimum overall mast conditions for the eastern wildturkey.
Shrubs also may contribute to the fall, winter, and spring food value. Adense layer of shrubs would provide abundant wild turkey food; however, turkeyaccess and movements would be restricted in such areas due to the poor visibility and vulnerability of turkeys to predation. It is assumed that optimumshrub dens it i es for food production occur at shrub crown covers of 20% ormore. Areas with no shrubs will contribute nothing to shrub food production.The relationship between shrub cover for food production and a suitabilityindex (SIV6) is presented in Figure 3a. It is further assumed that shrubdensities of less than 40% crown cover will not restrict wild turkey use of anarea. As shrub cover exceeds 40%, it is assumed wil d turkeys will showdecreased use of the area, regardless of the amount of food production fromtrees and/or shrubs, due to a behavi ora 1 response to the dense shrub cover.
15

Fig. 3a Fig. 3b
1.0 1.0\D r-,:::- :::-..... .....(/') 0.8
(/') 0.8..........
x xQ) Q)
"'0 0.6 "'0 0.6t: t:..... .....>, >,
0.4..... 0.4 ............... .......c 0.2
..c0.2n::l n::l..... .......... .....
:::l :::l(/') 0.0 (/')
0.00 25 50 75 100
0 25 50 75 100Percent shrub crown cover
Percent shrub(food production) crown cover(behavioral)
Fig. 3c
co 1.0:::-.....(/') 0.8..........
xQ)
"'0 0.6t:.....>,..... 0.4.....
.....
..c0.2n::l..........
:::l(/') 0.0
0 25 50 75 100
Percent of shrub crown covercomprised of soft mastproducing shrubs
Figure 3. The relationship between habitat variables used to assessthe fall, winter, and spring food value of shrubs and sUitabilityindices for the eastern wild turkey.
16
Areas with shrub coverage of 80% or greater are assumed to be totally unsuitable for turkeys. The relationship between shrub cover related to the turkey'sbehavioral response and a suitability index (SIV7) is presented in Figure 3b.It is assumed that the best shrub conditions exist when 100% of the shrubsproduce soft mast, and that low suitabilities will still be provided in areaswith a lack of soft fruit producing shrubs, due to the turkey's use of othershrub plant parts for food. The relationship between the amount of soft fruitproducing shrubs and a suitability index (SIV8) is presented in Figure 3c.
The fa 11, wi nter, spri ng food value (FWSSIl) in forest and tree savannacover types is equal to the combined values of tree and shrub mast, modifiedby overall shrub density. Tree mast may be provided by either soft or hardmast species, and it is assumed that tree mast and shrub mast are equal invalue. Excessive shrub densities will detract from the value of all mastresources. These relationships can be expressed mathematically, as shown inEquation 3, for DFW, EF, DF, ETS, and DTS.
FWSSII = (SIV4 + SIV5) + (SIV6 x SIV8)2 x SIV7 (3)
Note: When the sum of SIV4 + SIV5 exceeds 1.0, itshould be reduced to 1.0 before computing FWSSI1.
The fall, winter, spring food value (FWSSI2) in shrub cover types isequal to the amount of food producing shrubs, modified by overall shrub densityand the distance to forest cover. Shrubs alone are assumed to be able toprovide up to one-half of the total fall, winter, and spring food value. Thisrelationship can be expressed mathematically, as shown in Equation 4, for ES,DS, ESS, and DSS.
FWSSI2 = (SIV6 x SIV8) x SIV7 x SIV32
(4 )
Croplands may provide high quality fall, winter, and spring food for theeastern wild turkey, especially in the western and northern portions of theturkey's range. Corn and soybeans are highly preferred, while other grainsare somewhat less valuable food sources. Crops other than corn, soybeans, andother grains are assumed to provide no food value. The relationship of thetype of crop to a suitability index (SIV9) is presented in Figure 4a. Theoverwinter management of croplands will have a significant effect on theamount of crop food potentially available to turkeys. A direct measure ofwaste crop availability requires considerable field time and there is a largeamount of variability in such measurements (Frederick et al. 1984). Therefore,a general approach is taken in this model to assess overwinter crop availability. Optimum conditions are assumed to exist in areas where more than 5% ofthe crop remains unharvested through the winter. Areas with the crop harvested
17

in the fall, but plowed in the spring, will have moderate suitability. Croplands with a fall harvest and fall plowing will have no SUitability, due tothe lack of waste crops. The relationship between the overwinter managementof croplands and a suitability index (SIVI0) is presented in Figure 4b. Theobjective in assessing croplands is to determine the actual amount of wastegrain available. Users with specific information on waste grain abundance maywish to revise these variables to fit their local data. An additional factoraffecting the useability of croplands is the proximity to forest cover. Thisrelationship in croplands is assumed to be the same as that described forherbaceous cover types in Figure lc for summer food/brood habitat. The overallfall, winter, spring food value (FWSSI3) in croplands is equal to the valuefor the type of crop, directly modified by the type of overwinter managementand distance to forest cover. This relationship can be expressed mathematically, as shown in Equation 5, for croplands.
O"l1.0
::-......(/)
0.8xQJ
"C 0.6c:......
~ 0.4......0<0 0.2of...>.....~
(/)
0.0
FWSSI3 = SIV9 x SIVI0 x SIV3
Fig. 4a
f-
- '-
ABC
Type of crop
A) corn or soybeansB) other gra insC) other crops
Figure 4. The relationships between habitat variables used to assessthe fall, winter, and spring food value of crops and suitabilityindices for the eastern wild turkey.
18
(5 )

Cover component. The cover needs of the eastern wild turkey are providedby mature deciduous, and mature mixed evergreen and deciduous, forests.Turkeys prefer forests with mostly open understories, and understory densityis considered in this model by the shrub cover variables in the fall, winter,spring food component. It is assumed that roost sites will be adequate inareas that provide cover, as described in the following paragraphs.
Thi s model assumes that optimum cover condi t ions for the eastern wi 1dturkey exist in areas with ~ 50% tree canopy cover ..Habitats with less than10% tree canopy cover are assumed to be unsuitable for turkeys because of thesmall amount of cover they will provide. The relationship between tree canopycover and a suitability index (SIV11) for the eastern wild turkey is presentedin Figure Sa. It shoul d be noted that the di st ri but i on and i nterspers ion' offorest cover is assessed by the variable presented in Figure 1c.
Eastern wild turkeys prefer mature or old growth forests due to both thestructural characteristics and food production in such habitats. Saplingforests provide poor overhead cover and are frequently too dense at ground1eve 1 for turkeys. The di ameter of overstory trees provides an i ndi rectassessment of forest maturity, and it is assumed that optimal habitats containoverstory trees that average 30.5 cm dbh (Lewis, unpubl.). All trees areassumed to have some value for eastern wil d turkeys; however, suitabil i ty isassumed to decrease to a very low level as the average size of overstory treesdecreases to 12.7 cm dbh or less (Lewis, unpubl.). The relationship betweenoverstory tree diameter and a suitability index (SIV12) for the eastern wildturkey is presented in Figure 5b.
Turkeys utilize both deciduous and evergreen forests, but deciduousforest types are preferred. It is assumed that habitats with less than 30% ofthe canopy comprised of evergreens will be optimal. Forests that are entirelyevergreen will have low suitability for eastern wild turkeys. The relationshipbetween the amount of evergreens in the tree canopy and a sui tabi 1i ty index(SIV13) for the eastern wild turkey is presented in Figure 5c. A total lackof evergreen trees in the northern portions of the range of the eastern wildturkey may indicate less than optimum suitabilities, especially during severewinters when conifers are used for cover. Users in these geographic areasshould consider this possibility prior to applying this model.
The overall cover value (CSI) for eastern wild turkeys in forested covertypes is a function of tree canopy closure, the percent evergreen trees, andforest maturity (i.e., dbh). The cover value is assumed to be optimal onlywhen suitability values for all three variables are optimal. The cover valueis assumed to be lowered in direct proportion to low values for any of thevariables. This relationship can be expressed mathematically, as shown inEquation 6, for DFW, OF, EF, DTS, and ETS.
CSI = SIV11 x SIV12 x SIV13
19
(6)

Figure 5. The relationships between habitat variables used to assessthe cover value of trees and suitability indices for the eastern wildturkey.
20

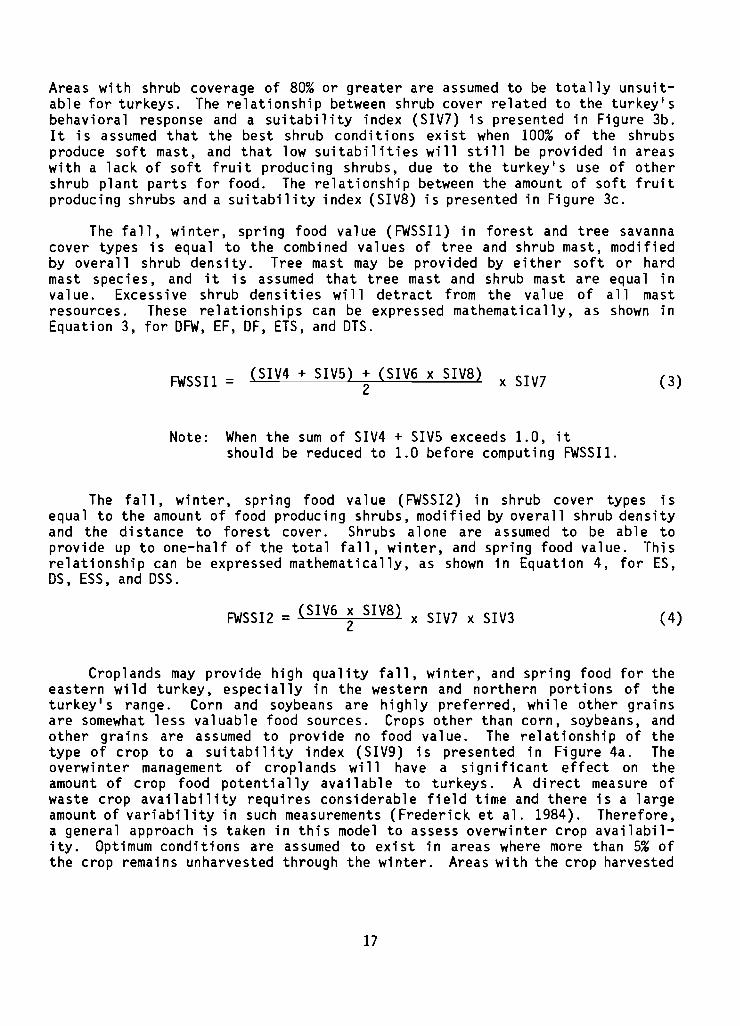
Composition component. Optimal habitats for the eastern wild turkey mustprovide the proper mix of life requisites. A relatively small area is requiredto meet the summer food/brood needs of the turkey. Severa 1 authors haveestimated the amount of area needed in openings to support turkey broods.Latham (1958) recommended 10% openings, Speake et al. (1975) suggest a needfor 12 to 25% openings, and Porter's (1980) data correspond to a need forabout 14.5% openings. Based on the average of these percentages, it is assumedthat optimal turkey habitats should contain at least 15% of the area in summerfood/brood habitat. It is assumed that, in optimal habitats, the balance ofthe area, or 85%, should provide fall, winter, and spring food. Turkeys areprimari ly forest bi rds, but several recent studi es have shown that they mayattain dense populations in areas with an even mix of forest cover and openlands. Turkeys in Minnesota survived in areas with only 12% forest cover(Hecklau et al. 1982). This model assumes that in ideal habitats, 50% or moreof the area should provide optimal levels of cover. Habitats with less than10% of the area providing cover are assumed to be unsuitable. The relationships between the variables used to assess habitat composition and suitabilityindices (SIV14, SIV15, and SIV16) for the eastern wild turkey are presented inFigure 6.
This habitat model is structured in a flexible manner, such that variouscombinations of cover type conditions may exist to provide the optimal mix oflife requisites. For example, assuming that the appropriate habitat variables(VI through V13) are optimum, the model would rate either of the followingcover type mixes as optimum:
1. 85% forest cover, 15% pasture
2. 50% forest cover, 35% cropland, 15% pasture
HSI determination. The overall value of a habitat for eastern wildturkeys is a funct i on of the qua1i ty, quant i ty , and i nterspers i on of 1iferequisites. Interspersion is considered by the habitat variable (V3) thatmeasures the di stance from open areas to forest cover. Several steps must befollowed to determine the quality and quantity of life requisites for theturkey, as follows:
1. Determine suitability index (SI) values for each variable in theappropriate cover type by entering the field data into the appropriate SI graphs.
2. Calculate life requisite values in each cover type by using the SIvalues in the appropriate equations.
3. Determine the relative area (%) of each cover type used by turkeyswithin the study area, as follows:
Relative area (%) for cover type A = ~~~:lo:r~~v~~ ; lYe A x 100cover types used bythe turkey
21
Fig. 6a Fig. 6b
100755025a
t' 0.4
LO......:>~ 0.8
x~ 0.6t:......
:.a 0.2to
oj..>.....
20+15105a
0.2
1. a -+---...................,L._........~_+-_-+-
t' 0.4
'd"......:>~ 0.8
x~ 0.6t:......
.....
.....
..0to
oj..>.....
Percent of area providingequivalent optimum summerfood/brood habitat
Percent of area providingequivalent optimum fall,winter, spring food
Figure 6. The relationships between the variables used to assesshabitat composition and suitability indices for the eastern wildturkey.
22
4. Multiply the life requisite values for each cover type by therelative area (%) of that cover type, and sum these products foreach life requisite.
5. To determine the overall life requisite values, enter the value fromstep 4 for each life requisite into the appropriate SI graph(Fig. 6a-c). The resulting index values are the overall liferequisite values.
6. The HSl for the entire study area is equal to the lowest of theoverall life requisite values.
Application of the Model
Summary of model variables. Fourteen habitat variables and three composition variables are used in this model to determine life requisite values forthe eastern wild turkey. The relationship between habitat variables, liferequisites, cover types, and the HSl for the turkey are illustrated inFigure 7. The spec ifi c trees that provi de food for the eastern wi 1d turkeyvary across the geographic range of the turkey. It is suggested that usersdevelop a specific list of both hard and soft mast producing trees for use inFigure 2a and 2b.
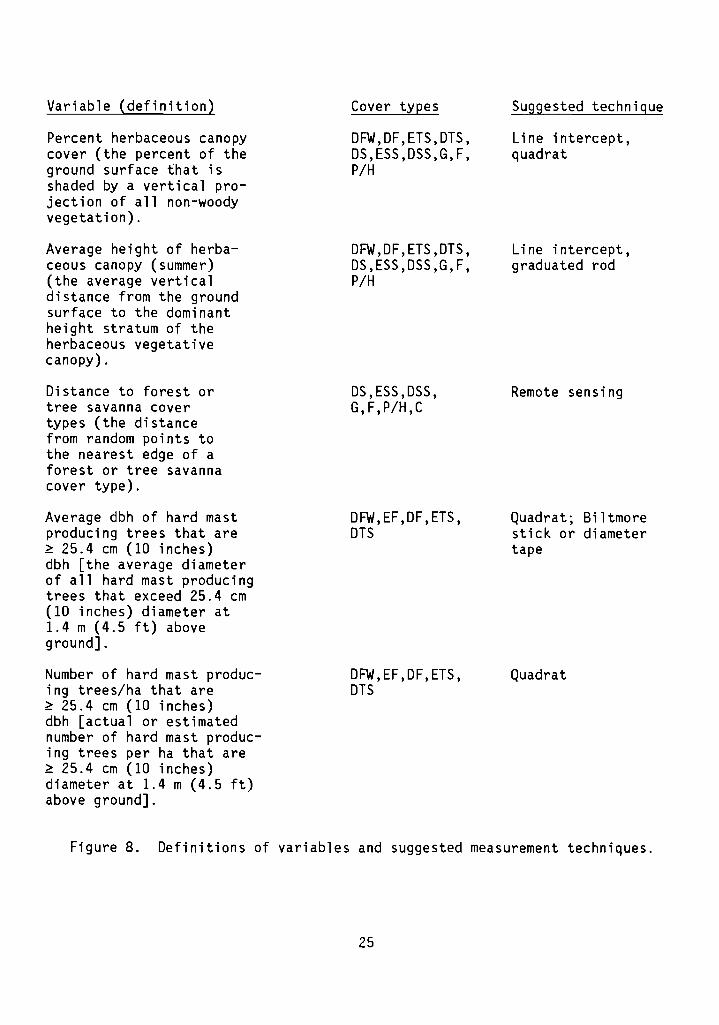
Definitions of variables and suggested measurements techniques (Hayset al. 1981) are provided in Figure 8.
Model assumptions. Despite the abundance of information and researchthat has been gathered concerning the eastern wild turkey, their specifichabitat requirements are not well understood (Bailey and Rinnel 1968; Kennameret al. 1980; Little 1980; Hurst 1981). Numerous assumptions were made in thetransformation of the published habitat information on eastern wild turkeys tothe suitability index relationships and formulas used in this model. Themajor assumptions in the model are listed below.
1. The habitat variables and life requisite relationships apply to theentire geographic range of the eastern wild turkey.
2. Water is not a limiting factor.
3. Nest sites will be present if fall, winter, and spring food, cover,and summer food! brood needs are met.
4. Optimal fall, winter, and spring food values may be provided bycrops alone, by the combined value of crops and mast from trees andshrubs, or by the combined value of mast from trees and shrubs.
5. The relationships for hard mast were developed using data from oaks.It is assumed that these relationships apply to all hard mastproducing trees.
23

Habitat variable Li fe regu i site Cover tYpes
Percent herbaceous canopy cover IIoo::--------Summer food/brood DFW,DF,ETS,DTS--
Average height of herbaceous------'~ habitatcanopy (summer) ~
Distance to forest or tree Summer food/brood DS,ESS,DSS, Isavanna cover types habitat G,F,P/H
Average dbh of hard mast produc-~ing trees that are 225.4 cm dbh
Number of hard mast producingtrees/ha that are ~ 25.4 cm dbh ~----------~/ Fal I, winter,
_____ /' foodPercent canopy closure of soft
mast producing trees
Percent sh rub crown cove r i
sp ri ng DFW, EF, DF, ETS,DTS--
I HSI
N~
Percent of shrub crown cover r Fal I, winter, spring ES,DS,ESS,DSS Icomprised of soft mast foodproducing shrubs
Type of crop IOverwinter crop management ------- Fall, winter, spring C I
foodDistance to a tree dominated -----
cover type
Percent tree canopy cover I Cover DFW,EF,DF,ETS,DTSAverage dbh of overstory trees
Percent of forest canopycomp r i sed of eve rg reens ------
Figure 7. Relationships between habitat variables, life requisites,cover types, and the HSI for the eastern wild turkey.
Variable (definition)
Percent herbaceous canopycover (the percent of theground surface that isshaded by a vertical projection of all non-woodyvegetation).
Average height of herbaceous canopy (summer)(the average verticaldistance from the groundsurface to the dominantheight stratum of theherbaceous vegetativecanopy) .
Distance to forest ortree savanna covertypes (the distancefrom random points tothe nearest edge of aforest or tree savannacover type).
Average dbh of hard mastproducing trees that are~ 25.4 cm (10 inches)dbh [the average diameterof all hard mast producingtrees that exceed 25.4 cm(10 inches) diameter at1.4 m (4.5 ft) aboveground].
Number of hard mast producing trees/ha that are~ 25.4 cm (10 inches)dbh [actual or estimatednumber of hard mast producing trees per ha that are~ 25.4 cm (10 inches)diameter at 1.4 m (4.5 ft)above ground].
Cover types
DFW,DF,ETS,DTS,DS,ESS,DSS,G,F,P/H
DFW,DF,ETS,DTS,DS,ESS,DSS,G,F,P/H
DS,ESS,DSS,G,F,P/H,C
DFW,EF,DF,ETS,DTS
DFW,EF,DF,ETS,DTS
Suggested technique
Line intercept,quadrat
Line intercept,graduated rod
Remote sensing
Quadrat; Biltmorestick or diametertape
Quadrat
Figure 8. Definitions of variables and suggested measurement techniques.
25

Variable (definition)
Percent canopy closure ofsoft mast producing trees[the percent of theground surface that isshaded by the verticalprojection of the canopiesof trees that produce seedsencased in a pulpy mass(e.g., cherry, hawthorn,etc.)].
Percent shrub crowncover [the percent ofthe ground surfacethat is shaded by avertical projectionof the canopies ofwoody vegetation~ 5.0 m (16.4 ft) tall].
Percent of shrub crowncover comprised of softmast producing shrubs(the relative percentof the amount of softmast producing shrubscompared to all shrubs,based on crown cover).
Type of crop (thepresent or last cropgrown. Categories are:corn or soybeans; othergrains; and other crops).
Overwinter crop management (an evaluation ofthe winter availabilityof agricultural cropsbased on management.Categories are: > 5% ofcrop left unharvested;1 to 5% of crop leftunharvested; cropharvested, spring plowed;crop harvested, fallplowed) .
Cover types
DFW, EF,OF, ETS,DTS
DFW,EF,DF,ETS,DTS,ES,DS,ESS,DSS
DFW,EF,DF,ETS,DTS,ES,DS,ESS,DSS
C
C
Figure 8. (continued).
26
Suggested technique
Line intercept
Line intercept,quadrat
Line intercept,quadrat
Observation, localdata
Observation, localdata
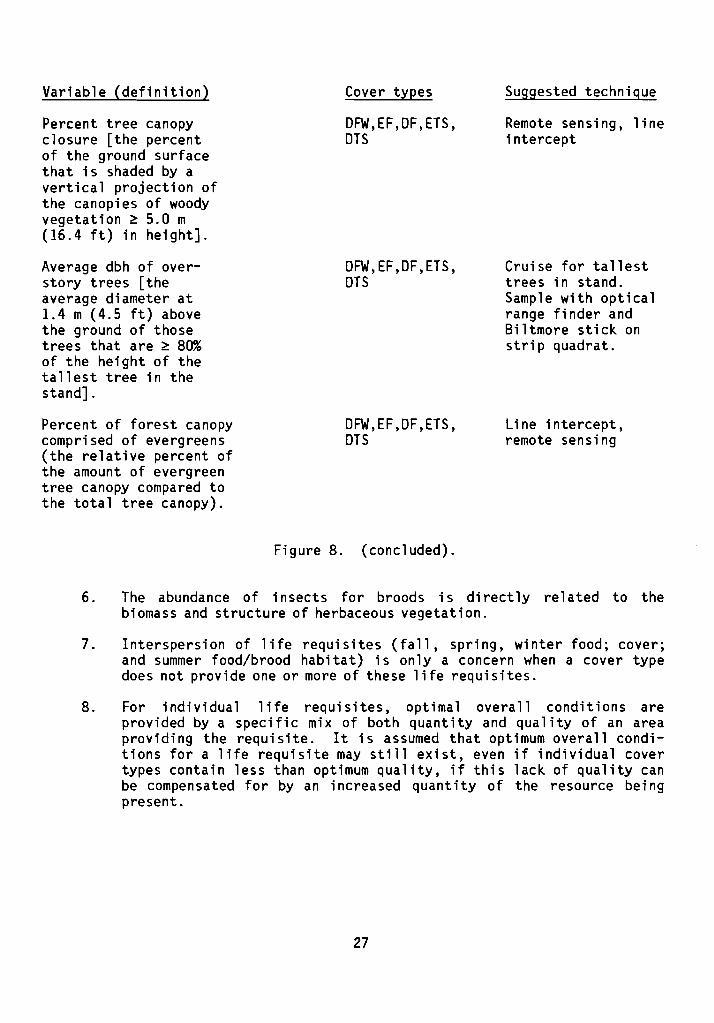
Variable (definition)
Percent tree canopyclosure [the percentof the ground surfacethat is shaded by avertical projection ofthe canopies of woodyvegetation ~ 5.0 m(16.4 ft) in height].
Average dbh of overstory trees [theaverage diameter at1.4 m (4.5 ft) abovethe ground of thosetrees that are ~ 80%of the height of thetallest tree in thestand].
Percent of forest canopycomprised of evergreens(the relative percent ofthe amount of evergreentree canopy compared tothe total tree canopy).
Cover types
DFW,EF,DF,ETS,DTS
DFW,EF,DF,ETS,DTS
DFW,EF,DF,ETS,DTS
Figure 8. (concluded).
Suggested technique
Remote sensing, lineintercept
Cruise for tallesttrees in stand.Sample with opticalrange finder andBiltmore stick onstrip quadrat.
Li ne intercept,remote sensing
6. The abundance of insects for broods is directly related to thebiomass and structure of herbaceous vegetation.
7. Interspersion of life requisites (fall, spring, winter food; cover;and summer food/brood habitat) is only a concern when a cover typedoes not provide one or more of these life requisites.
8. For individual life requisites, optimal overall conditions areprovided by a specific mix of both quantity and quality of an areaproviding the requisite. It is assumed that optimum overall conditions for a life requisite may still exist, even if individual covertypes contain less than optimum quality, if this lack of quality canbe compensated for by an increased quantity of the resource beingpresent.
27

SOURCES OF OTHER MODELS
Williamson and Koeln (1980) developed a linear additive model to defineareas of different habitat suitability for wild turkeys in forested areas ofVirginia. Seven habitat factors are used in the model, with each factor givena value depending on its condition, and also given a relative weighting factorin comparison to other factors. The value of a particular forest stand isequal to the sum of all habitat factors. The seven habitat factors are: mastspecies diversity; proximity to permanent water; proximity to forest openings;mast availability; competition; forest contiguity; and proximity to roostsi tes.
Armbruster and Lewis (1980) developed an additive habitat model foreastern wild turkeys in central Missouri. The model assesses various habitatcharacteristics in bottomland hardwoods, upland hardwoods, old fields, pasturesand hayl ands, and croplands, and determi nes a numerica 1 value for each ofthese cover types. The model does not provide a method to determine a singlevalue for a composite of several different cover types. Habitat characteristics in this model include: tree species; number of food plant species;habitat edge; grazing pressure; tree size class and canopy closure; nestingcover; crop practices; and distances between cover types.
REFERENCES
Anderson, R. J., and D. E. Samuel.mines as wild turkey brood range.
1980. Evaluation of reclaimed surfaceProc. Wild Turkey Symp. 4:186-202.
Armbruster, M. J., and J. B. Lewis. 1980. Eastern wild turkey. Pages 27-41in T. S. Baskett, D. A. Darrow, D. L. Hallett, M. J. Armbruster, J. A.Ellis, B. F. Sparrowe, and P. A. Korte. A handbook for terrestrialhabitat evaluation in central Missouri. U.S. Fish Wildl. Servo Res.Publ. 133.
Bailey, R. W. 1980. The wild turkey status and outlook in 1979. Proc. WildTurkey Symp. 4:1-9.
Bailey, R. W., and K. T. Rinnell. 1968. History and management of the wildturkey in West Virginia. West Virginia Dept. Nat. Res., Div. Game FishBull. 6. 59 pp.
Bailey, R. W., J. R. Davis, J. E. Frampton, J. V. Gwynn, and J. Shugars.1981. Habitat requirements of the wild turkey in the southeast Piedmont.Pages 14-23 in P. T. Bromley and R. L. Carlton, eds. Proc. of the Symp.:Habi tat Requi rements and Habi tat Management for the Wild Turkey in theSoutheast, Richmond, Virginia.
Barwick, L. H., and D. W. Speake. 1973. Seasonal movements and activities ofwild turkey gobblers in Alabama. Pages 125-133 in G. C. Sanderson andH. C. Schultz, eds. Wild turkey management, current problems andprograms. Missouri Chapt. Wildl. Soc. and Univ. Missouri Press, Columbia.
28

Blackburn, W. E., J. P. Kirk, and J. E. Kennamer. 1975. Availability andutilization of summer foods by eastern wild turkey broods in Lee County,Alabama. Proc. Wild Turkey Symp. 3:86-107.
Bortner, J. B., and J. W. Bennett. 1980. Observations of wild turkey winterrange at Snake Mountain, Vermont. Trans. Northeastern Sect. Wildl. Soc.37:243-248.
Christisen, D. M., and L. J. Korschgen. 1955. Acorn yields and wildlifeusage in Missouri. Trans. N. Am. Wildl. Conf. 20:337-357.
Dalke, P. D., W. K. Clark, Jr., and L. J. Korschgen. 1942. Food habit trendsof the wild turkey in Missouri as determined by dropping analysis. J.Wildl. Manage. 6(3):237-243.
Davis, J. R. 1976. Management for Alabama wild turkeys. Alabama Dept.Conserv. Spec. Rep. 5. 130 pp.
Dickson, J. G., C. D. Adams, and S. H. Hanley. ~978. Response of turkeypopulations to habitat variables in Louisiana. Wildl. Soc. Bull.6(3):163-166.
Eaton, S. W., F. M. Evans, J. W. Glidden, and B. D. Penrod. 1976. Annualrange of wil d turkeys in southwestern New York. New York Fi sh Game J.23(1):20-33.
Eichholz, N. F., and R. L. Marchinton. 1976. Dispersal and adjustment tohabitat of restocked wild turkeys in Georgia. Proc. Southeastern Assoc.Game Fish Commissioners 29:373-378.
Ellis, J. E., and J. B. Lewis. 1967. Mobility and annual range of wildturkeys in Missouri. J. Wildl. Manage. 31(3):568-581.
Everett, D. D., Jr. 1982. Factors limiting populations of wild turkeys onstate wildlife management areas in north Alabama. Ph.D. Diss., AuburnUniv., Alabama. 135 pp.
Frederick, R. B., E. E. Klaas, G. A. Baldassarre, and K. E. Reinecke. 1984.A method for sampling waste corn. J. Wildl. Manage. 48(1):298-303.
Gingrich, S. F. 1971. Stocking, growth, and yield of oak stands. Proc. OakSymp. 1:65-73.
Glover, F. A. 1948. Winter activities of wild turkey in West Virginia. J.Wildl. Manage. 12(4):416-427.
Glover, F. A., and R. W. Bailey. 1949. Wild turkey foods in West Virginia.J. Wildl. Manage. 13(3):255-265.
Goodrum, P. D., V. H. Reid, and C. E. Boyd. 1971. Acorn yields, characteristics, and management criteria of oaks for wildlife. J. Wildl. Manage.35(3):520-532.
29
Hamrick, W. J., and J. R. Davis. 1972. Summer food items of juvenile wildturkeys. Proc. Southeastern Assoc. Game Fish Commissioners 25:85-89.
Hays, R. L., C. S. Summers, and W. Seitz. 1981. Estimating wildlife habitatvariables. U.S. Fish Wildl. Servo FWS/DBS-81/47. 111 pp.
Healy, W. M. 1977. Wild turkey winter habitat in West Virginia cherry-mapleforests. Trans. Northeastern Sect. Wildl. Soc. 34:7-12.
1978. Feeding activity of wild turkey poults in relation toground vegetation and insect availability. Ph.D. Diss., West VirginiaUniv., Morgantown. 117 pp.
1981. Habitat requirements of wild turkeys in the southeasternmountains. Pages 24-34 in P. T. Bromley and R. L. Carlton, eds. Proc.of the Symp.: Habi tat Requi rements and Habi tat Management for the Wil dTurkey in the Southeast, Richmond, Virginia.
Healy, W. M., and L S. Nenno.management of cl eari ngs11(2): 113-120.
1983. Minimum maintenance versus intensivefor wild turkeys. Wildl. Soc. Bull.
Heckl au , J. D., W. F. Porter, and W. M. Shields. 1982. Feasibility oftransplanting wild turkeys into areas of restricted forest cover and highhuman density. Trans. Northeastern Sect. Wildl. Soc. 39:96-104.
Hillestad, H. D. 1973. Movements, behavior, and nesting ecology of the wildturkey in eastern Alabama. Pages 109-125 in G. C. Sanderson and H. C.Schultz, eds. Wild turkey management. Missouri Chapt. Wildl. Soc. andUniv. Missouri Press, Columbia.
Hillestad, H. 0., and D. W. Speake. 1970. Activities of wild turkey hens andpoults as influenced by habitat. Proc. Southeastern Assoc. Game FishCommissioners 24:244-251.
Hurst, G. A. 1978. Effects of controlled burning on wild turkey poult foodhabits. Proc. Southeastern Assoc. Fish Wildl. Agencies 32:30-37.
1981. Habitat requirements of the wild turkey on the southeastcoastal plain. Pages 2-13 in P. T. Bromley and R. L. Carlton, eds.Proc. of the Symp.: Habitat~equirements and Habitat Management for theWild Turkey in the Southeast, Richmond, Virginia.
Hurst, G. A., and B. D. Stringer, Jr. 1975. Food habits of wild turkeypoults in Mississippi. Proc. Wild Turkey Symp. 3:76-85.
Kennamer, J. L, J. R. Gwaltney, and K. R. Sims. 1980. Food habits of theeastern wild turkey on an area intensively managed for pine in Alabama.Proc. Wild Turkey Symp. 4:246-250.
Korschgen, L. J. 1967. Feeding habits and food. Pages 137-198 in D. H.Hewitt, ed. The wild turkey and its management. The Wildl:"" Soc.,Washington, DC.
30

1973. April foods of wil d turkeys in Mi ssouri . Pages143-151 in G. C. Sanderson and H. C. Schultz, eds. Wild turkey management. Missouri Chapt. Wildl. Soc. and Univ. Missouri Press, Columbia.
Koz t cky , E. L: 1942. Pennsylvania wild turkey food habits based on droppinganalysis. Pennsylvania Game News 13(8):10-11, 28-29, 31. Cited byKorschgen 1967.
Latham, R. M. 1958. Factors affecting distribution and abundance of wildturKeys in Pennsylvania. Ph.D. Thesis, Pennsylvania State Univ.,University Park.
Lewis, J. B., and E. Kurzejeski. 1984.mortality in north central Missouri.W-13-R-38. 43 pp.
Wild turkey productivity and poultMissouri Dept. Cons. Fed. Aid Proj.
Lewis, J. C. 1964. Populations of wild turkeys in relation to fields. Proc.Southeastern Assoc. Game Fish Commissioners 18:48-56.
Lindzey, J. S. 1967. Highlights of management. Pages 245-260 in O. H.Hewitt, ed. The wild turkey and its management. The Wild~ Soc.,Washington, DC.
Little, 1. W. 1980. Wild turkey restoration in "marq i nal " Iowa habitats.Proc. Wild Turkey Symp. 4:45-60.
Markley, M. H. 1967. Limiting factors. Pages 199-244 in O. H. Hewitt, ed.The wild turkey and its management. The Wildl. Soc., Washington, DC.
Martin, A. C., F. H. May, and T. E. Clarke. 1939. Early winter food preferences of the wil d turkey on the George Washi ngton Nati ona1 Forest.Trans. N. Am. Wildl. Conf. 4:570-578.
Martin, D. D., and B. S. McGinnes. 1975. Insect availability and use byturkeys in forest clearings. Proc. Wild Turkey Symp. 3:70-75.
McQuilkin, R. A., and R. A. Musbach. 1977.tree reservoirs in southeastern41(2):218-225.
Pin oak acorn production on greenMissouri. J. Wildl. Manage.
Mosby, H. S., and C. O. Handley. 1943. The wild turkey in Virginia, itsstatus, life history, and management. Div. Game Comm. Inland Fish.,Richmond, VA. 281 pp.
Nenno, E. S., and J. S. Lindzey. 1979. Wild turkey poult feeding activity inold field, agricultural clearing, and forest communities. Trans. Northeastern Sect. Wildl. Soc. 36:97-109.
Owen, C. N. 1976. Food habits of wildfields in east central Mississippi,edges on arthropod populat ions inM.S. Thesis. Mississippi StateCited by Hurst 1978.
31
turkey poults in pine stands and inand the effects of mowing hayfieldrelation to poult food production.Univ., Mississippi State. 62 pp.

Pack. J. C., R. P. Burkert. W. K. Igo. and D. J. Pybus. 1980. Habitatutilized by wild turkey broods within oak-hickory forests of WestVirginia. Proc. Wild Turkey Symp. 4:213-224.
Porter. W. F. 1977 . Home range of wil d turkeys in southeastern Mi nnesota.J. Wildl. Manage. 41(3):434-437.
1978. The ecology and behavior of the wild turkey (Meleagrisgallopovo) in southeastern Minnesota. Ph.D. Thesis. Univ. Minnesota.Minneapolis. 122 pp.
1980. An evaluation of wild turkey brood habitat in southeastern Minnesota. Proc. Wild Turkey Symp. 4:203-213.
Porter. W. F.• R. D. Tangen. G. C. Nelson. and D. A. Hamilton. 1980. Effectsof corn food plots on wild turkey in the Upper Mississippi Valley. J.Wildl. Manage. 44(2):456-462.
Pybus. D. J. 1977. Understory characteristics and utilization by wild turkeybroods in West Virginia. M.S. Thesis. West Virginia Univ .• Morgantown.106 pp.
Raybourne , J. W. 1968. Telemetry of turkey movements. Proc. SoutheasternAssoc. Game Fish Commissioners 22:47-54.
Shaw. S. P. 1971. Wildlife and oak management. Proc. Oak Symp. 1:84-89.
Speake. D. W. 1980. Predation on wild turkeys in Alabama. Proc. Wild TurkeySymp. 4: 86-101.
Speake. D. W.• L. H. Barwick. H. O. Hillestad. and W. Stickney. 1969. Somecharacteri st i cs of an expandi ng turkey population. Proc. SoutheasternAssoc. Game Fish Commissioners 23:46-53.
Speake. D. W.• T. E. Lynch. W. J. Fleming. G. A. Wright. and W. J. Hamrick.1975. Habitat use and seasonal movements of wild turkeys in the southeast. Proc. Wild Turkey Symp. 3:122-130.
Tzt l kowsk i , W. M. 1971. Winter roost sites of wild turkeys in southwestPennsylvania. Trans. Northeastern Sect. Wildl. Soc. 28:167-178.
U.S. Fish and Wildlife Service. 1981. Standards for the development ofhabitat suitability index models. 103 ESM. U.S. Fish Wildl. Serv .• Div.Ecol. Servo n.p.
Williams. L. E.. Jr. 1981. The book of the wild turkey. Winchester Press,Tulsa. 181 pp.
Williamson. J. F.• and G. T. Koeln. 1980. A computerized wild turkey habitatevaluation system. Proc. Wild Turkey Symp. 4:233-239.
32

Wright, G. A., and D. W. Speake. 1975. Compatibility of the eastern wildturkey with recreational activities at Land Between the Lakes, Kentucky.Proc. Southeastern Assoc. Game Fish Commissioners 29:578-584.
Wunz, G. A. 1971. Tolerances of wild turkeys to human disturbance and limitedrange. Trans. Northeast Sect. Wildl. Soc. 28:159-165.
33
OI"T\ONAL FOR'" 272 (IFormerly NTI:>-3S1Department of Commerce
(S.. ANSI-Z39.18)
502n·101
REPORT DOCUMENTATION 11. ~EPORT ~.Report 82(10.106~~
'11. .Reclp.ent'. Acclss,o" No.
PAGE I Blologlcal4. Titll Ind Subtitle ~ RlPOrt Oltl
August 1985Habitat Suitability Index ~odels: Eastern Hild Turkey
6. -~
7. Authorl.) 8. Plrtormin. Or.lnizltion RIPl. No.
Richard L. Schroeder9. Pertormin. O,,"niution N..... Ind Addr... Western Energy and Land Use Team 10. Pro,lct/TIsk/Work Unit No.
U.S. Fish and Wildlife Service2627 Redwing Road 11. ContrlctlC) or GrlntlG) No.
Fort Co 11 ins, CO 80526-2899 IC)
IGl
1~ SpoRSorin. Or.lniution Nlml Ind Add..... Wes tern Energy and Land Use Team 13. Type of Report & Period COYlrld
Division of Biological ServicesResearch and DevelopmentFish and Wildlife Service 14.
Deoartmen.Uf the Interior Wrlc::hinnt hn DC :mno15. Suppllmlntlry Notl' The Biological Report series was initi~ted in October 1984 to replacethe FWSjOBS series published since 1976. The report number assigned to this modelfoll ows consecutively from the Habitat SUita~llitY)Indexmodels published as FVJSjOBS-8?/1O nnw rlC:: R'i n l n o i r-a I n R? 10
16. Abstrlct (Limit: 200 worm)
A review and synthesis of existing information were used to develop a Habita tSui tabil t ty Index (HSI) model for the eastern wild turkey U~el eagri s gallopavosylvestris). The model consol idates habitat use information into a frameworkappropriate for field application, and is scaled to produce an index between 0.0(unsuitable habitat) and 1.0 (optimum habitat). HSI models are designed to be usedwi th Habitat Evaluation Procedures previously developed by the U.S. Fish and WildlifeService.
17. Document Anllysi. I. Descriptors
BirdsWildlifeHabitabil ityMathematical models
Ib. Identlfiers/Open·Ended Tlrm.
Eastern wild turkeyIMeleagris gallopavo sylvestris
Ic. COSATI Filld/GnluP
18. AYlillbillty Stltlml"; lIt. Security CII.s (Tlli. RlPOrt) I 21. No of PI,.. !
Release unlimit~d Unclassified , 33 _-.JI20. Security CII,' (Til,. PI.e) i 22~ Price II Uncl as si ft ed ! I
4-77
*u.S. GOVERNMENT PRINTING OFFICE: 1985-580246/25345

......,- . .. ..~
""
* Headquarters , 0lvI5 10n Of Biolog icalservices . Wasn,ngton . DC
)( Eastern Energy and Land Use TeamLeerown. WV
* Naloonal Coastal Ecosystems TeamSlide ll LA
• Western Energy aM LaM Use TeamFI ccu.ns. CO
• Locat ions of RegIonal Ollices
UGION 1Rqiunlll DirectorO.S. Fish lind Wildlife ServiceUoyd Five Hundred Building, Suite 1692500N.E. Multnomah StreetPortland, Oregon 97232
REGION 4Regional DirectorU.S. Fish and Wildlife ServiceRichard B. Russell Building75 Spring Street, S.W.Atlanta, Georgia 30303
,,I__r----
6!,-----L, J_1, : ,---
I ,I
REGION 2Regional DirectorU.S. Fish and Wildlife ServiceP.O. Box 1306Albuquerque, New Mexico 87103
REGION SRegional DirectorU.S. Fish and Wildlife ServiceOne Gateway CenterNewton Comer, Massachusetts 02158
REGION 7Regional DirectorU.S. Fish and Wildlife Service10II E. Tudor RoadAnchorage, Alaska 99503
,."
REGION 3Regional DirectorU.S. Fish and Wildlife ServiceFederal Building, Fort SnellingTwin Cities, Minnesota 5SIII
REGION 6Regional DirectorU.S. Fish and Wildlife ServiceP.O. Box 25486Denver Federal CenterDenver, Colorado 80225
DEPARTMENT OF THE INTERIORu.s. FISH AND WILDLIFE SERVICE
As the Nation's principal conservation asency, the Department of the Interior has responsibility for most of our .nationally owned public lands and natural resources. This includesfosterins the wisest use of our land and water resources, protecting our fish and wildlife,preserving th.environmental and cultural'values of our national parks and historical places,and providing for the enjoyment of life throulh outdoor recreation. The Department assesses our energy and mineral resources and works to assure that their development is inthe best interests of all our people. The Department also has a major responsibility forAmerican Indian reservation communities and for people who live in island territories underU.S. administration.