hagfish hemoglobins. structure, function and oxygen … over 20 min, at a flow rate of 1 ml/min....
TRANSCRIPT

Hagfish hemoglobins. Structure, function and oxygen-linked association
Angela Fago1, Laura Giangiacomo2, Rossana D’Avino3, Vito Carratore3, Mario Romano3,
Alberto Boffi 2, and Emilia Chiancone2,*
From the 1Department of Zoophysiology, University of Aarhus, Building 131,
Universitetsparken, DK 8000 Aarhus C, Denmark, the 2CNR Center of Molecular Biology and
Department of Biochemical Sciences, University “La Sapienza” P.le Aldo Moro 5, 00185
Roma, Italy, and the 3CNR Institute of Protein Biochemistry and Enzymology, Via Marconi 10,
80125 Napoli, Italy
* To whom correspondence should be addressed
Tel.: +39 6 4940543
Fax: +39 6 4440062
E-mail [email protected]
Running Title: Structure and function of hagfish hemoglobins
1
Copyright 2001 by The American Society for Biochemistry and Molecular Biology, Inc.
JBC Papers in Press. Published on April 9, 2001 as Manuscript M100759200 by guest on June 3, 2018
http://ww
w.jbc.org/
Dow
nloaded from

SUMMARY
Cyclostomes, hagfishes and lampreys, contain hemoglobins that are monomeric when
oxygenated and polymerize to dimers or tetramers when deoxygenated. The three major
hemoglobin components (HbI, HbII and HbIII) from the hagfish Myxine glutinosa have been
characterized and compared to lamprey Petromyzon marinus HbV, whose X-ray crystal
structure has been solved in the deoxygenated, dimeric state (Heaslet, H. A., and Royer, W. E.
Jr. (1999) Structure 7, 517-526). Of these three, HbII bears the highest sequence similarity to P.
marinus HbV. In HbI and HbIII the distal histidine is substituted by a glutamine residue and
additional substitutions occur in residues located at the deoxy dimer interface of P. marinus
HbV. Infrared spectroscopy of the CO derivatives, used to probe the distal pocket fine structure,
brings out a correlation between the CO stretching frequencies and the rates of CO combination.
Ultracentrifugation studies show that HbI and HbIII are monomeric in both the oxygenated and
deoxygenated states under all conditions studied, whereas deoxy HbII forms dimers at acidic pH
values, like P. marinus HbV. Accordingly, the oxygen affinities of HbI and HbIII are
independent of pH, while HbII displays a Bohr effect below pH 7.2. HbII also forms
heterodimers with HbIII and heterotetramers with HbI. The functional counterparts of
heteropolymer formation are cooperativity in oxygen binding and the oxygen-linked binding of
protons and bicarbonate. The observed effects are explained on the basis of the X-ray structure
of P. marinus HbV and the association behavior of site-specific mutants (Qiu, Y., et al. (2000)
J. Biol. Chem. 275, 13517-13528).
2
by guest on June 3, 2018http://w
ww
.jbc.org/D
ownloaded from
INTRODUCTION
In most vertebrate hemoglobins cooperativity in oxygen binding originates from the
transition between a low affinity (T) and a high affinity (R) state of the familiar α2β2 tetrameric
molecule (1, 2). The structural constraints between unlike chains are such that isolated chains
and αβ dimers are devoid of cooperativity (3, 4, 5). In contrast, in invertebrate hemoglobins
cooperativity in ligand binding may be present also within homodimeric molecules, as in HbI
from the clam Scapharca inaequivalvis (6). In this hemoglobin cooperativity arises from the
direct communication between the two heme groups through a subunit interface distinct from
those of the vertebrate hemoglobin tetramer since it is formed by the heme-carrying E and F
helices (7).
A different mechanism of cooperativity in oxygen binding is operative in the hemoglobins
from hagfishes and lampreys, the most primitive living chordates, often grouped together into
the class of Agnatha (jawless) or Cyclostomata (round-mouths) (8). In these hemoglobins
cooperative ligand binding is based on the existence of a finite equilibrium between high affinity
monomers and low affinity oligomers, notably dimers and tetramers (9). The ligand-linked
polymerization is responsible also for the Bohr effect (the decrease in oxygen affinity upon a
decrease in pH). Despite these similarities, hagfishes and lampreys may have diverged before
the separation between myoglobin and hemoglobin chains (10), a fact that may explain the
differences in the functional properties in their hemoglobins, such as the lower cooperativity and
Bohr effect which characterize the hagfish proteins (11). The structural basis for the decrease in
oxygen affinity upon dimerization has been disclosed recently by the crystal structure of
deoxygenated lamprey Petromyzon marinus HbV (12). The E helices and the AB corner form a
3
by guest on June 3, 2018http://w
ww
.jbc.org/D
ownloaded from
novel subunit interface that stabilizes a dimeric assembly. The proximity of the heme groups to
the interface and the displacement of the first part of the E helix that is coupled to dimer
formation suggest that ligand affinity is affected directly by the disposition of distal residues.
The hemoglobins from hagfishes have been studied less extensively than those from
lampreys, which are easier to catch as they migrate into freshwater rivers and streams to spawn
rather than living most of the time burrowed in the sea bottom sand. A further difficulty that
presumably hindered the elucidation of structure-function relationships in hagfish hemoglobins
is the high multiplicity of components which is due to genetic polymorphism (13, 14, 15).
A distinctive feature of hagfish hemoglobins concerns the oxygen-linked binding not only of
protons but also of bicarbonate (16). Binding of bicarbonate to the hemoglobin favors transport
of CO2 as intracellular rather than plasma-dissolved bicarbonate, as generally observed in
vertebrates, and at the same time favors oxygen unloading. In hagfish, bicarbonate produced by
the intracellular hydration of CO2 (catalysed by carbonic anhydrase) is not transported to the
plasma due to the absence of the anion-exchanger band III protein from the red blood cells
membrane (17, 18). The molecular basis of the bicarbonate effect is not known. Interestingly, it
is remarkably large in whole blood (19, 20) and in the hemolysate (15, 21), but is not present in
the isolated hemoglobin components suggesting that some form of interaction between them is
required (21). In lamprey hemoglobins the oxygen-linked binding of bicarbonate does not occur
(22).
The present work reports the structural and functional characterization of the three major
hemoglobin components from the Atlantic hagfish Myxine glutinosa. Paleus et al. (23) isolated
three hemoglobin fractions from this species. However, the high heterogeneity of their samples
4
by guest on June 3, 2018http://w
ww
.jbc.org/D
ownloaded from
allowed the determination only of the primary structure of HbIII, the component characterized by
the highest isoelectric point (24). In order to avoid the problems posed by hemoglobin
multiplicity, in this work the individual hemolysates were analysed by isoelectric focusing (15)
and only those samples showing identical patterns with three distinct, common bands were
pooled. At variance with the hemolysate, the oxygen affinity of the isolated hemoglobin
components appeared at a first characterisation to be essentially unaffected by pH and
bicarbonate, a further indication that the molecular basis of these allosteric effects must reside in
specific interactions between different components. Sedimentation velocity experiments carried
out under conditions similar to those of the oxygen equilibrium experiments confirmed this
contention and showed that the presence of HbII, the component characterised by an
intermediate isoelectric point, is essential for oligomer formation. Possible structural reasons for
these effects are proposed.
EXPERIMENTAL PROCEDURES
Hemolysate preparation and separation of the hemoglobins. Specimen of M. glutinosa were
captured in wooden traps placed on the sea bottom in the vicinity of Kristineberg Marine
Biological Station (Fiskebackskil, Sweden), and transferred into tanks with running sea water.
Blood was taken with heparinised syringes from the caudal sinus, as previously described (15).
After plasma removal by low speed centrifugation, red blood cells from each individual were
washed three times in cold 3.2% NaCl and frozen at –80 °C in order to facilitate hemolysis. A
three-fold volume of cold 10 mM HEPES buffer, pH 7.8, 0.5 mM EDTA was added to the
thawed cells and the hemolysate was centrifuged at 12000 rpm for 20 min to eliminate cellular
5
by guest on June 3, 2018http://w
ww
.jbc.org/D
ownloaded from

debris. Due to the high genetic polymorphism of hemoglobins in hagfishes (13, 14, 15), the
individual hemolysates were analysed for hemoglobin multiplicity by isoelectrofocusing on
ultrathin (0.2 mm) 7.5% polyacrylamide gels using Ampholines in the pH range 3.5-10 (1/3)
and 7-9 (2/3) on a Multiphore II system (Amersham Pharmacia Biotech) at 7 W and 15 °C
according to the instructions contained in the manual. After a 10 min prefocusing step,
performed in order to avoid artifactual bands (15), a 1 µl sample was loaded on the alkaline
region of the gel. More than one hundred hemolysates were analysed in this way. The number of
bands detected in the samples varied from three to six. Only those samples (38 in total) showing
the identical isoelectrophoretical pattern with the major three bands were pooled.
The hemolysate was stripped from organic phosphates and endogenous cofactors by passage
through a Sephadex G25 fine column equilibrated with 50 mM TRIS buffer, pH 7.8, 0.1 M
NaCl and dialysed against three changes of CO-equilibrated 10 mM TRIS buffer, pH 7.8 before
anion exchange chromatography. The three hemoglobins were separated on a DEAE Sephacel
column equilibrated with the same buffer and eluted with a 0-0.2 M NaCl gradient. The
separated hemoglobin fractions were concentrated on 4-ml Ultrafree Millipore ultrafiltration
tubes (cutoff 5000), dialysed against three changes of CO-equilibrated 10 mM HEPES buffer,
pH 7.8, 0.5 mM EDTA and stored in small aliquots at –80 °C. Under these conditions the
samples remained stable for months. All preparative steps were performed at 0-4 °C.
Amino acid Sequence Determination and Analysis. Heme was removed and the globin chains
precipitated with acid acetone according to Rossi Fanelli et al. (25). The globin chains were
purified by reverse-phase HPLC on a Vydac C4 column (3.9x300 mm) by a 35-80% linear
gradient of 50% acetonitrile (solvent B) in 40% acetonitrile, 0.1% trifluoroacetic acid (solvent
6
by guest on June 3, 2018http://w
ww
.jbc.org/D
ownloaded from

A) over 20 min, at a flow rate of 1 ml/min. S-pyridylethylation was performed according to
Friedman et al. (26). The globin chains were submitted to digestion with endoproteinase Asp-N
and to CNBr cleavage following the procedure described by Gross and Witkop (27). Peptides
were separated in a Beckman System Gold apparatus by reverse–phase HPLC on a µ-Bondapak
C18 column (3.9x300mm) (Asp-N digest) and on an Aquapore RP-300 column (4.6x250mm)
(CNBr fragments) by mixing 0.1% trifluoroacetic acid (solvent A) and 0.08% trifluoroacetic
acid in acetonitrile (solvent B) in a multistep linear gradient over 120 min, at a flow rate of 1
ml/min. Peaks were collected manually and dried in a Savant Speed Vac Concentrator. In HbII
cleavage at the Asp-Pro bond was performed in 70% formic acid (28) directly on a polybrene
coated filter and partial deacylation of the blocked N terminus was achieved by treatment of the
N-terminal Asp-N peptide with 30% trifluoracetic acid for 2 h at 55 °C.
Automated repetitive Edman degradation was performed on a Perkin Elmer Procise 492
Sequencer. Mass spectrometry measurements were carried out on intact HbI and HbIII globins,
on HbIIA and HbIIB S-pyridylethylated chains and on blocked N-terminal Asp-N peptides.
Mass spectra were recorded in linear mode on a Voyager Elite MALDI Time-of-Flight mass
spectrometer (PerSeptive, Framingham, Ma, USA). The protein samples were dissolved in
70% formic acid and 0.5 microliter of this solution immediately applied using the sandwich
method (29) in a 0.5 µl droplet of 0.1% trifluoroacetic acid on a target precoated with sinapinic
acid followed by addition of further 0.5 µl matrix solution. Mass determination was based on
external calibration.
Multiple alignment of Agnatha globins was performed with CLUSTAL W (30). The amino
acid sequences used are M. glutinosa HbI and HbII and the eight protein sequences more similar
7
by guest on June 3, 2018http://w
ww
.jbc.org/D
ownloaded from

to HbII based on a BLASTP search (31), namely P. marinus GLB5 (Swiss Prot accession
number: P02208), GLB3 (P09968) and GLB1 (P09967); Lampetra fluviatilis GLB (P02207);
Mordacia mordax GLB1 (P21197), GLB2 (P21198) and GLB3 (P21199), M. glutinosa, GLB3
(P02209).
Infrared spectroscopy measurements. FTIR spectra were measured on a MAGNA 760
Nicolet spectrometer equipped with an MCT detector. The protein solutions at a concentration
of about 1 mM (heme) in 20 mM HEPES buffer, pH 7.0 were equilibrated with 1 atm of CO gas
and a few microliters of a sodium dithionite solution were added (final concentration of about 10
mM). The spectra were measured at 20 °C in a CaF2 cell with a 50 µ teflon spacer; 512 scans at
2 cm-1 resolution were averaged. The spectra of the oxygenated proteins measured under the
same experimental conditions (dithionite was omitted) were subtracted from the spectra of the
CO derivative in order to obtain a flat baseline.
Analytical ultracentrifugation experiments. All experiments were carried out on a Beckman
XL-A analytical ultracentrifuge, equipped with absorbance optics and an An60-Ti rotor, at
10 °C. Sedimentation velocity experiments were performed at 40000 rpm. Data were collected
at an appropriate wavelength (555 or 540 nm for deoxy- and oxyhemoglobin, respectively) and
at a spacing of 0.005 cm with 3 averages in a continuous scan mode. They were analysed with
the program DCDT, provided by Dr. Walter Stafford (Boston Biomedical Research Institute),
which yields the sedimentation coefficients (32). The values were reconducted to water and 20
°C (s20,w) using standard procedures. Sedimentation equilibrium experiments were carried out
at 30000, 35000, and 40000 rpm. Data were collected at a spacing of 0.001 cm with 10 averages
8
by guest on June 3, 2018http://w
ww
.jbc.org/D
ownloaded from

in a step scan mode every 3 hours. Equilibrium was checked by comparing scans up to 24 hours.
Data sets were edited with REEDIT (J. Lary, National Analytical Ultracentrifugation Center,
Storrs, CT) and fitted with NONLIN (PC version provided by Emory Braswell, National
Analytical Ultracentrifugation Center, Storrs, CT) according to Johnson et al. (33). Data from
different speeds were combined for global fitting. For fits to a monomer-dimer association
scheme, the monomer molecular weight was fixed at the value determined from the amino acid
sequence. The protein concentration varied in the range 20-250 µM (heme) in 200 mM HEPES
buffer, pH 6.0 or 7.4, with or without 10 mM NaHCO3; it was calculated from the spectra of the
oxygenated derivatives using an extinction coefficient of 13.8 cm-1 mM-1 on a heme basis for
the oxygenated derivative at 540 nm. To obtain the deoxygenated protein, the solution at the
desired concentration was degassed in a stoppered vial with N2. Cells were filled in an inflatable
glove box (AtmosBag, Aldrich) after addition of sodium dithionite to avoid reoxygenation.
As a control of the state of oxygenation, absorbance spectra of all samples were measured in the
ultracentrifuge cell before and after the run.
Oxygen equilibrium experiments. Oxygen equilibria were measured at 10 °C in 100 mM
HEPES buffer, at a concentration of 0.5 mM (heme) in the absence and presence of 4% CO2,
corresponding to a concentration of bicarbonate in solution of approximately 15 mM at pH 7.2
(34). Stepwise increases in oxygen saturation of 3-µl samples were obtained by a modified gas
diffusion chamber connected to Wosthoff pumps for mixing pure N2 with air, O2 and CO2 (35).
The change in absorbance upon oxygenation was monitored at 436 nm. Oxygen affinity (p50,
the oxygen partial pressure necessary to achieve half-saturation) and cooperativity at half-
9
by guest on June 3, 2018http://w
ww
.jbc.org/D
ownloaded from

saturation (n50) were calculated from Hill plots (log Y/(1-Y) versus log pO2, where Y is the
fractional oxygen saturation). pH values of the hemoglobin solutions were measured by a
thermostatted BMS Mk2 microelectrode connected to a PHM64 pH meter (Radiometer). In
experiments performed in the presence of CO2, pH values were measured after equilibration of
the hemoglobin solutions with 4% CO2 in thermostatted micro-tonometers (Radiometer).
Oxygen binding experiments on the isolated hemoglobins were performed in the absence and
presence of 0.1 M KCl or 4% CO2 and 1 µM carbonic anhydrase. The functional interaction
between different components was analysed in hemoglobin mixtures at a 1:1 molar ratio, in the
absence and presence of 4% CO2 and 1 µM carbonic anhydrase.
Ligand binding kinetics. Kinetic measurements were carried out in an Applied Photophysics
(Leatherhead, UK) rapid mixing apparatus on the isolated components. In the CO binding
experiments, the protein solutions at a concentration of about 10 µM (heme) in 0.2 M HEPES
buffer, pH 7.0 containing 10 mM sodium dithionite were mixed with the same buffer containing
increasing amounts of dissolved CO gas. The reaction was followed at 434 nm (the absorbance
maximum of the deoxy derivative) and at 20 °C. The second order rate constants were obtained
from the pseudo first order plot by standard procedures. The O2 dissociation experiments were
carried out by mixing the oxygenated protein with a solution containing an excess (0.1 M)
sodium dithionite under the same experimental conditions described for CO binding
measurements.
RESULTS
10
by guest on June 3, 2018http://w
ww
.jbc.org/D
ownloaded from

Three hemoglobin fractions were separated from the M. glutinosa hemolysate by anion
exchange chromatography and were named HbI, HbII, and HbIII in reverse order of elution to
be consistent with the nomenclature adopted by Paleus et al. (23) based on increasing isoelectric
points. These were assessed by isoelectrofocusing on polyacrylamide gels and correspond to
6.35, 7.35 and 8.90 for HbI, HbII and HbIII, respectively (data not shown). The three
hemoglobin fractions HbI, HbII and HbIII occur in a ratio of approximately 15:50:35. Reverse
phase HPLC and mass spectrometry show that each fraction separated on the DEAE-column
contains essentially a single hemoglobin component, consistent with the fact that only the
individual hemolysates presenting three major bands, common to all samples, were pooled. On
reverse phase HPLC, HbI and HbIII elute as a single peak with average molecular mass of
17,033 and 16,643, respectively, whereas HbII resolves into two single, separate peaks, named
HbII A and HbII B, with molecular mass of 17,790 and 17,993, respectively (data not shown).
The molecular mass and the N-terminal sequence of the first five residues indicated that HbIII
corresponds to the component (Swiss-Prot accession number P02209) sequenced by Liljeqvist
et al. (24).
The complete amino acid sequences of HbI and of HbII A and B were obtained by automated
repetitive Edman degradation of the intact chain, of the HPLC purified Asp-N and CNBr
peptides and of the HbII fragment generated after cleavage of the single Asp-Pro bond.
Sequence of HbI - Direct sequencing of the intact chain proceeded to Glu40 and provided
the overlaps between the first three Asp-N peptides (N1-N2-N3) as shown in Fig. 1.
Incomplete cleavage at Asp residues 65 and 87 yielded peptide N4-N6 whose sequence
proceeded from residue 49 to 89 providing the overlap of peptides N4, N5, and N6-N7. The
11
by guest on June 3, 2018http://w
ww
.jbc.org/D
ownloaded from

expected N7 peptide, comprising residues 112 to 146, was not recovered indicating that Asp-N
endoproteinase failed to cleave at Asp112. The resulting N6-N7 peptide coeluted with an N4-
N5 uncleaved peptide and its sequence (up to Phe121) was obtained unambiguously by
subtracting the sequences of the N4 and N5 peptides. The lack of any detectable sequence after
acidic treatment indicated the absence of the single Asp-Pro bond characteristic of globin
chains. The sequence from Phe121 to Tyr146 was obtained from the CNBr fragments which
also provided the necessary overlaps to the Asp-N peptides. CNBr clevage yielded three
peptides. CB2 provided the sequence from Lys93 to Met113 and CB3 the sequence from
Phe114 to Glu148. CB1 corresponds to the N-terminal part of the chain (residues 1-92)
The complete amino acid sequence of HbI consists of 148 residues (Fig. 1). The calculated
molecular weight of HbI is 17,027, in agreement with the value of 17,033 measured by mass
spectrometry.
Sequence of HbII A and B - The Edman degradation of the intact chain was unsuccessful
due to the presence of a blocking group at the N-terminus. This was established to be an acetyl
group by mass spectrometry measurements. The sequence of the N-terminal peptide N1 was
obtained after deacylation of the N-terminal Ser as described under Experimental Procedures.
Following Asp-Pro cleavage, the internal sequences from Pro111 to Ser138 for HbII A and
from Pro111 to Glu135 for HbII B were obtained (Fig. 1). The two sequences are identical
except for residue 134 which is Gly in HbII A and Ala in HbII B. The Asp-N peptides of the
two globins were purified in a single HPLC chromatography run using identical conditions.
Comparison of the elution patterns indicated that all the peaks have the same elution time except
those corresponding to peptides N6 and N10. The sequence was determined for all the peaks of
12
by guest on June 3, 2018http://w
ww
.jbc.org/D
ownloaded from

HbII B and for peptides N6 and N10 of HbII A. The two N6 and N10 peptides of HbII A
differed from the corresponding peptides of HbII B at only one position, namely 83 (N6) and
134 (N10) with Ile and Gly, respectively, in HbII A, and Thr and Ala, respectively, in HbII B, in
agreement with the molecular masses measured by mass spectrometry. The sequence of peptides
N9 and N10, coeluting in the same peak, were unambiguously established since the fragment
corresponding to N10 was also recovered as two distinct peptides, named E1 and E2 (see Fig.
1), originating from an additional cleavage at Glu 135. The CNBr fragments and partially
uncleaved Asp-N peptides provided the complete overlap of all the Asp-N peptides.
The complete amino acid sequence of HbII comprises 155 residues (Fig. 1). The calculated
molecular mass is 17,690 for HbII A and 17,692 for HbII B. These values are in good agreement
with those obtained by mass spectrometry of the S-pyridylethylated chains (17,791 and 17,794,
respectively) after subtracting the mass of the pyridyl-ethyl group at Cys149.
Sequence analysis - The sequences of M. glutinosa HbI, HbII and HbIII (24) were compared
with those of the lampreys Lampetra fluviatilis, P. marinus and Mordacia mordax in an
alignment made with CLUSTAL W. In Fig. 2, only the sequence of P. marinus HbV is shown as
representative of all lamprey hemoglobins for the sake of simplicity. M. glutinosa HbII is the
only known cyclostome hemoglobin with a blocked N-terminus. Moreover, it lacks the first
three residues and has two insertions relative to the other hemoglobins, one of a single residue at
the FG corner, the other of eight residues in the region corresponding to the GH corner in
vertebrate globins. HbI and HbIII lack one residue at the GH corner and two residues at the CD
corner, and have a two residues extension at the C-terminus relative to HbII and to lamprey
hemoglobins. Interestingly, HbI and HbIII possess a glutamine residue in the distal position E7
13
by guest on June 3, 2018http://w
ww
.jbc.org/D
ownloaded from

instead of the canonical distal histidine.
Infrared spectroscopy of the isolated hemoglobins - To gain information on structural
features of the distal pocket that are relevant for ligand binding, infrared spectra were measured
in the region of the stretching frequency of the bound CO molecule (2000-1900 cm-1). The
three main hemoglobin components have distinct absorption peaks (Fig. 3). HbI-CO has an
absorption line at 1942 cm-1, HbII-CO is characterised by a sharp absorption peak at 1968 cm-
1, while HbIII-CO displays a broad and asymmetric absorption band centered at 1942 cm-1.
The spectrum of the hemolysate is included in Fig. 3; it appears to be dominated by the
contributions of the most abundant components, HbII and HbIII.
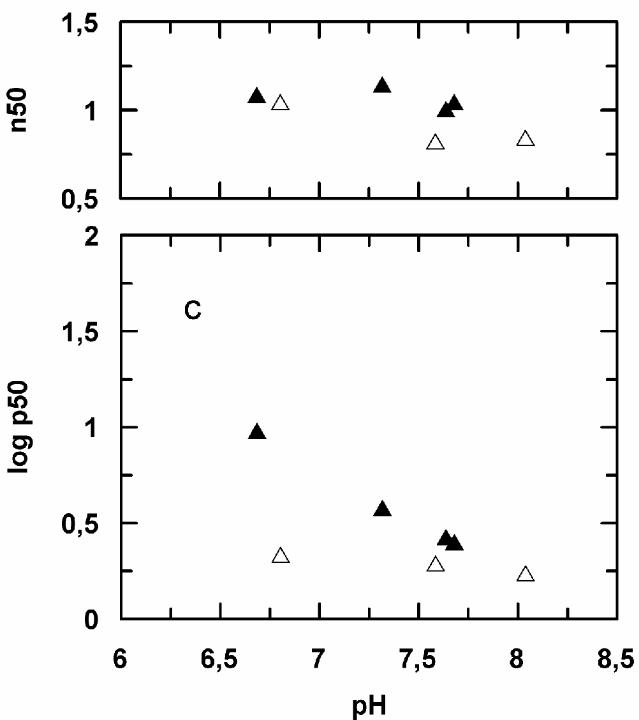
Functional properties of the isolated hemoglobins - The results of oxygen equilibrium
experiments are presented in Fig. 4. The isolated hemoglobins bind oxygen with no
cooperativity (Hill coefficient, n50, around unity) and with an affinity that is virtually
independent on pH and on the presence of bicarbonate or KCl (data not shown). Only HbII
displays a slight Bohr effect below pH 7.2 (Bohr factor, ∆log p50/∆log pH = -0.48 at pH 7.0)
both in the absence and in the presence of bicarbonate. HbIII is characterized by a lower oxygen
affinity than HbII and HbI in having an about two-fold higher p50 value.
The rates of oxygen dissociation from the three components are in accordance with the
oxygen equilibrium measurements since they parallel the values of p50 as in all myoglobins and
hemoglobins (36). Thus, the rate of oxygen release decreases in the order HbIII, HbII and HbI
(Table I). In contrast, the second order rates of CO binding follow a different trend. CO binds
14
by guest on June 3, 2018http://w
ww
.jbc.org/D
ownloaded from

about eight-fold faster to HbII than to HbI and HbIII, as indicated in the same Table. Both
reactions are independent of pH in the range 6.2-9.0 (data not shown).
Oxygen-linked interactions between the hemoglobins - The occurrence of oxygen-linked
interactions between the different hemoglobin components was studied in the equimolar binary
mixtures HbI+HbII, HbII+HbIII and HbI+HbIII (Fig. 5). When HbI and HbII are present in
solution at the same concentration, a distinct increase in the values of p50 and cooperativity is
observed relative to the isolated components. Concomitantly, marked effects of pH (the Bohr
factor is -0.50) and CO2 become apparent, indicating oxygen-linked binding of protons and
bicarbonate anions. A similar Bohr effect, but only in the presence of CO2, is observed in the
mixture HbII+HbIII. Under these conditions the p50 value increases relative to the isolated
components, but the effect is less marked than in the HbI+HbII mixture. In contrast, HbI and
HbIII do not show any functional interaction as the oxygen binding properties of the mixture
correspond to the average of those of the individual components.
The existence of association-dissociation equilibria as the structural basis of the functional
interactions operative in the hemoglobin mixtures was assessed in sedimentation velocity
experiments. These were conducted on the single components as a control, on their equimolar
binary mixtures as well as on the hemolysate. The measurements were carried out on both the
oxygenated and deoxygenated derivatives at two pH values, namely 6.0 and 7.4, in the absence
and in the presence of 10 mM NaHCO3.
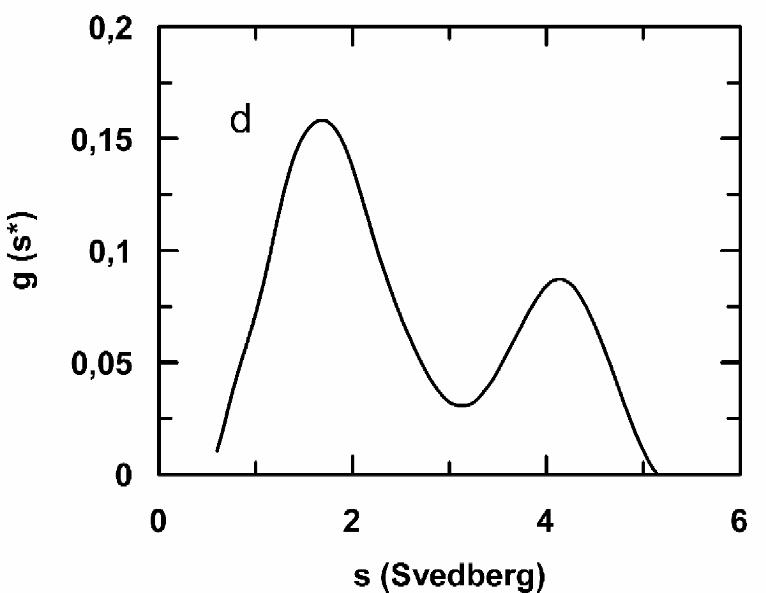
In the liganded form the individual M. glutinosa hemoglobins and their binary mixtures
sediment as monomers (s20,w 1.5-1.8 S) under all experimental conditions examined. The
15
by guest on June 3, 2018http://w
ww
.jbc.org/D
ownloaded from
addition of bicarbonate has no effect on the state of association. In the deoxygenated form, the
individual hemoglobins likewise sediment as monomers, with the exception of HbII at pH
values below 7.2 where a single peak with s20,w of about 2.1 S, indicative of dimer formation,
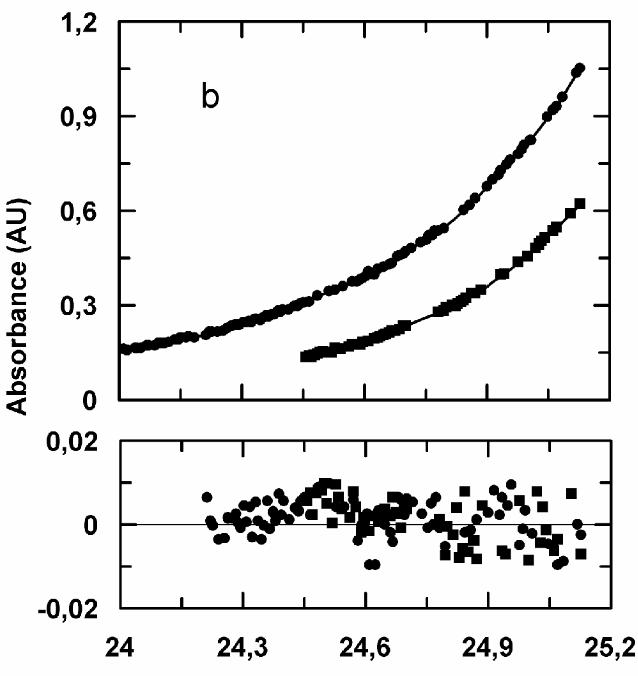
is observed. On the basis of this result, sedimentation equilibrium experiments were performed
at pH 6.0 and 10 °C; they yielded a dimerization equilibrium constant K1,2 of 450±60 and
170±10 M-1 in the absence and presence of 10 mM bicarbonate, respectively (Fig. 6).
In the deoxygenated form, the HbI+HbII mixtures polymerize at pH 6.0 and 7.4 both in the
absence and in the presence of bicarbonate. Single peaks are observed whose s20,w values, 3.5-
3.8 and 4.1 S respectively, are intermediate between those of hemoglobin dimers (2.8 S) and
tetramers (4.5 S), an indication that both oligomers are formed. In the deoxygenated HbII+HbIII
mixtures at pH 6.0 the sedimentation coefficient increases from 1.8 to 2.6 S when bicarbonate is
present, indicating that under these conditions dimerization occurs. In contrast, no
polymerization can be detected at pH 7.4 both in the absence and in the presence of bicarbonate.
The HbI+HbIII mixtures do not show polymerization when deoxygenated. The experimentally
determined sedimentation coefficients are summarized in Table II; representative sedimentation
patterns are presented in Fig. 7.
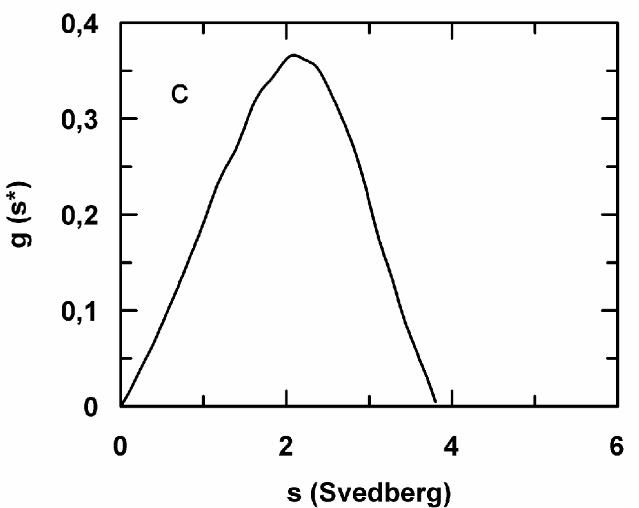
The sedimentation velocity experiments conducted on the hemolysate at pH 7.4 are
consistent with the data on the single components and on their equimolar binary mixtures. Thus,
in the presence of oxygen, the hemolysate sediments as a single homogeneous peak with s20,w
of about 1.8 S. Upon deoxygenation, in accordance with previous gel filtration data (16), a
monomer (s20,w~1.7 S) and an oligomer peak (s20,w~4.1 S) can be detected (Fig. 7d). The
16
by guest on June 3, 2018http://w
ww
.jbc.org/D
ownloaded from
amount of tetramers formed is around 30% as expected on the basis of the hemolysate
composition (15% HbI, 50% HbII, 35% HbIII) and of the fact that at pH 7.4 only HbI and HbII
are able to polymerize giving rise to heterotetramers (Table II).
DISCUSSION
The present study of the three major hemoglobins from the hagfish M. glutinosa provides the
basis for understanding the complex oxygen-linked phenomena that take place in the
hemolysate and the distinctive differences relative to lamprey hemoglobins. Firstly, the M.
glutinosa hemoglobins have been investigated separately to assess their structural and intrinsic
ligand binding properties. Thereafter, binary mixtures have been analysed to establish the role
played by each component in oxygen-linked polymer formation.
The sequences of HbI, HbII and HbIII presented in Fig. 2 bring out the high overall similarity
with P. marinus HbV. They also indicate that in the M. glutinosa hemoglobins the heme pocket
geometry is superimposable to that of sperm whale (SW) myoglobin. However, there are
substitutions in key positions of the distal pocket, namely: i) a glutamine residue instead of the
canonical distal histidine in position E7 in both HbI and HbIII; ii) a valine residue in position
E10 in HbIII (Thr in SW-Mb and Arg in lamprey and in the other two hagfish components); iii)
a methionine residue at position CD4 in HbII instead of phenylalanine in SW-Mb and in the
other hemoglobins considered.
The fine structure of the distal pocket has been probed by measuring the stretching frequency
of the bound CO molecule (νCO) in FTIR experiments since the nature of the distal residues has
been shown to affect the νCO value in a thorough study of myoglobin mutants (37). Thus, a
17
by guest on June 3, 2018http://w
ww
.jbc.org/D
ownloaded from
precise trend correlates the observed stretching frequencies to the polarity of the residues in the
distal pocket. In HbIII-CO the peak frequency (1947 cm-1) and the band profile are almost
superimposable to those of the myoglobin mutant possessing a distal glutamine. The bandshape
is broad (HWHH ~ 11 cm-1) and skewed toward high frequencies and may likewise indicate
the presence of more than one conformational state of bound CO. Consistently with the presence
of Gln E7, the absorption band of HbI-CO is centered at a similar frequency (1942 cm-1), but
is much narrower (HWHH = 3.5 cm-1) and thus indicates the existence of a single
conformational state of the Fe-C-O moiety. The presence of Val E10 in place of Arg in HbIII
may explain these bandshape differences. The smaller Val side chain may permit alternative
conformations of the nearby distal Gln E7 residue, just as in the Gln64 myoglobin mutant in
which the small Thr side chain occupies position E10 (37). The single, sharp absorption line of
HbII-CO requires a more detailed comment as it occurs at an unexpectedly high frequency
(1968 cm-1) despite the presence of the canonical distal histidine in position E7. In all
vertebrate myoglobins and hemoglobins possessing a distal histidine the CO stretching
frequency is in the range 1940-1955 cm-1, a value that has been correlated to the presence of a
strong polar interaction, i.e. a hydrogen bond, between the His Nε atom and the bound CO
molecule. In turn, νCO frequencies higher than 1960 cm-1 are indicative of a conformational
substate of bound CO with no hydrogen bonding to the carbonyl oxygen; this conformational
substate in myoglobin is referred to as A0 conformer” (38, 39) and is little populated (~ 5%). It
18
by guest on June 3, 2018http://w
ww
.jbc.org/D
ownloaded from

follows that in HbII the orientation of the distal histidine and hence its role in ligand binding
may differ from the canonical one. The stabilization of an A0-like conformer in HbII-CO may
originate from a steric effect due to the methionine residue in position CD4. In fact, in SW-Mb
mutants carrying a substitution of Phe CD4 with aliphatic residues, the bound CO peak is shifted
to 1967 cm-1 (37).
In the set of myoglobin mutants studied by Li et al. (37) the increase of νCO was found to
correlate directly with the rates of CO binding and release. The correlation holds also for the
hemoglobins from M. glutinosa at least for the CO combination reaction. Thus, HbII is
characterized by a higher νCO value relative to HbI and HbIII and by a higher rate of CO
binding (Table I). The oxygen affinity of the isolated hemoglobin components does not follow
the same trend. HbIII displays a two-fold lower oxygen affinity than HbII and HbI, an effect
that is almost entirely taken into account by the two-fold lower rate of oxygen release measured
in kinetic experiments at neutral pH values (Fig. 4 and Table I).
The most interesting properties of the hemoglobins from M. glutinosa concern the oxygen-
linked association-dissociation phenomena as they have distinctive features relative to the
hemoglobins from lampreys. The hemoglobins from both cyclostomes associate to form dimers
and tetramers in the deoxygenated state and dissociate into monomers upon ligation. In turn, the
association-dissociation equilibria provide the structural basis for cooperativity in oxygen
binding and for allosteric effects. In P. marinus, the six hemoglobin components undergo a
complex pattern of homo- and hetero-dimer and tetramer formation (40). In M. glutinosa,
hemoglobins are able to form homo- and hetero-oligomers, although not all the combinations
19
by guest on June 3, 2018http://w
ww
.jbc.org/D
ownloaded from

are allowed. Only HbII is able to self-associate and to combine with both HbI and HbIII, as
shown by ultracentrifugation (Table II) and oxygen equilibrium experiments (Figs. 4 and 5).
HbI and HbIII do not interact with themselves nor with each other.
The requirement of HbII in the formation of M. glutinosa oligomers is intriguing. A possible
explanation can be proposed on the basis of the crystal structure of deoxygenated, dimeric P.
marinus HbV (12) and of the self-association properties of the mutant proteins constructed by Qiu
et al. (41). In the deoxygenated lamprey hemoglobin dimer the contact area at the interface is
rather restricted, 478 Å2 (Fig. 8). It is formed by four residues from the AB corner and five
residues from the E helix of each subunit and is stabilized by a network of bidentate hydrogen
bonds (involving the sidechains of Tyr30, Glu31, Arg71 and Glu75 and the mainchain carbonyl
of Ser28) and by the van der Waals interactions between the side chains of Trp72 and Asn79.
Asn79 also makes two intrachain hydrogen bonds, one with the backbone oxygen of Glu75 and
the other with the OH group of Tyr27. In M. glutinosa HbII, if one disregards Ser28, all the
interface residues are conserved with the exception of Asn79 which is replaced by a glutamine
residue. The interface of the deoxygenated HbII dimer therefore is likely to be very similar to
that of P. marinus HbV. The decreased tendency to dimerize of HbII relative to lamprey
hemoglobin (K1,2 1.7x10² vs. 6.3x10⁵ M-1, ref. 41) can be accounted for by the Asn79→Gln
substitution coupled to the replacement of Tyr27 by a methionine residue. It is relevant in this
connection that the N79D and N79H mutants of P. marinus HbV are unable to polymerize (41).
In M. glutinosa HbI and HbIII the changes at interface residues are more extensive than in
HbII (Fig. 2). The substitution Tyr30→Phe in itself is sufficient to inhibit dimerization in
20
by guest on June 3, 2018http://w
ww
.jbc.org/D
ownloaded from
recombinant lamprey hemoglobin as it disrupts the interface hydrogen bonding network (41).
The presence of Lys71 in place of arginine in both HbI and HbIII and of Ser75 in place of
glutamic acid in HbI can likewise have a destabilizing effect on the dimeric assemblage. In
HbIII a further negative contribution to the stability of the dimeric structure may arise from the
presence of a leucine in place of the bulkier Trp 72. Lastly, a glutamine residue replaces the
distal histidine 73 (E7) in both HbI and HbIII. In recombinant lamprey hemoglobin this
replacement inhibits self-association at neutral and slightly acid pH values, providing an elegant
proof that the structural changes attendant dimer formation are not restricted to the interface
(41).
Despite the inability to self-associate, HbI and HbIII form hybrid oligomers with HbII. The
dimeric assemblage of these hybrids can be assumed to resemble that of P. marinus HbV and of
HbII. On this basis, the presence of Tyr30, Arg71, Trp72, His73 and Glu75 in only one of the
two subunits appears to permit dimer formation. There is no information on the possible
arrangement of the tetrameric assemblage.
Formation of the different hybrids has distinctive features. Thus, HbII and HbIII give rise to
hybrid dimers only at pH 6.0 in the presence of bicarbonate, whereas the interaction between
HbII and HbI proceeds to the tetramer stage and takes place independently of pH and of
bicarbonate (Table II). In both systems polymerization of the deoxygenated protein provides the
basis for cooperative oxygen binding and for the allosteric effects of protons and bicarbonate as
shown by the oxygen binding data presented in Fig. 5. Thus, in the HbII-HbIII mixture, a slight
cooperativity and a Bohr effect are observed only in the presence of bicarbonate. In the HbII-
HbI mixture a Bohr effect is operative even in the absence of bicarbonate; the anion decreases
21
by guest on June 3, 2018http://w
ww
.jbc.org/D
ownloaded from
the oxygen affinity at all pH values. The HbI-HbIII mixture, which does not polymerize, lacks
cooperativity and allosteric effects.
At this point of the discussion it is tempting to speculate on the nature of the groups involved
in the oxygen-linked binding of protons and of bicarbonate. In lamprey HbV the Bohr effect is
due to an unusual cluster of four glutamyl residues formed at the dimer interface by the side
chains of Glu31 and Glu75 of both subunits (12). The vicinity of these residues in the deoxy
state raises their pKa values from 4.5 to 6.0 and enables them to share a Bohr proton (41). In
lamprey hemoglobin bicarbonate does not behave as an allosteric effector (22). In HbII, the
presence of both Glu31 and Glu75 is consistent with the existence of a Bohr effect. Moreover,
there is no oxygen-linked binding of bicarbonate as in lamprey HbV, again in accordance with
the similarity of the residues at the dimer interface. The same cluster of four negatively charged
glutamyl residues can be surmised to play a central role in the Bohr effect displayed by the
hybrids. In the HbII-HbIII dimers, the Bohr effect depends on the presence of bicarbonate,
although the cluster of glutamyl residues is conserved. It may be envisaged that the replacement
of Arg71 with the smaller lysine residue in HbIII coupled to the presence of a methionine
residue in place of Tyr27 in HbII creates a cavity and hence destabilizes the interface unless
bicarbonate is bound as a bridging ligand. In the HbI-HbII tetramers, if one assumes that the
dimer provides their building block, the Bohr effect would have the same structural basis
although in HbI Glu75 is replaced by a serine residue. In turn, the presence of Lys71 in HbI
would allow the binding of bicarbonate. It is of interest that oxygen-linked binding of
bicarbonate takes place exclusively in the hybrids, but not in HbII which binds only protons in
an oxygen-linked manner. This difference may depend on the smaller number of bidentate
22
by guest on June 3, 2018http://w
ww
.jbc.org/D
ownloaded from

hydrogen bonds at the hybrid interface which endows it with a larger conformational plasticity.
The physiological relevance of hybrid formation is indicated by the large effect of pH and
CO2 observed in the hemolysate (15, 21) and in whole blood of M. glutinosa (19, 20). In the
hemolysate, the ratio between HbI, HbII, and HbIII (15:50:35) is such that mostly hybrid
molecules are formed upon deoxygenation (Fig. 7d). Functional interactions between four
different monomeric hemoglobins take place also in another hagfish species, Eptatretus burgeri
(42) and may represent a common, distinctive feature of the hemoglobins from these primitive
craniates.
In conclusion, the oxygen-linked interactions between different hemoglobin components as
the structural basis for homo- and heterotropic effects can be regarded as the first attempt in
vertebrates to regulate oxygen affinity through the association between different polypeptide
chains.
Acknowledgements - The authors want to thank Prof. Peter Roepstorff from South Danmark
University, Odense, for measuring the mass spectra, Winnie Heidemann, Anny Bang and Sonja
Kornerup (Myxine banden) from Aarhus University for technical assistance and the Danish
Natural Research Council for financial support.
23
by guest on June 3, 2018http://w
ww
.jbc.org/D
ownloaded from

REFERENCES
1. Perutz, M. F. (1970) Nature 228, 726-739
2. Baldwin, J., and Chothia, C. (1979) J. Mol. Biol. 129, 175-220
3. Antonini, E., Bucci, E., Fronticelli, C., Wyman J., and Rossi-Fanelli, A. (1965) J. Mol.
Biol. 12, 375-384
4. Kellett, G. L., and Gutfreund, H. (1970) Nature 227, 921-926
5. Ackers, G. K., Johnson, M. L., Mills, F. C., and Ip, S. H. (1976) Biochem. Biophys.
Res. Commun. 69, 135-142
6. Chiancone, E., Vecchini, P., Verzili, D., Ascoli F., and Antonini, E. (1981) J. Mol.
Biol. 152, 577-592
7. Royer, W. E. Jr., Hendrickson, W. A., and Chiancone, E. (1989) J. Biol. Chem. 264,
21052-21061
8. Martini, F. H. (1998), Sci. Am. 279, 44-49
9. Briehl, R. W. (1963) J. Biol. Chem. 238, 2361-2366
10. Goodman, M. (1981) J. Mol. Evol. 17, 114-120
11. Brittain, T. (1991) Comp. Biochem. Physiol. 99B, 731-740
12. Heaslet, H. A., and Royer, W. E. Jr. (1999) Structure 7, 517-526
13. Ohno, S., and Morrison, M. (1966) Science 154, 1034-1035
14. Li, S.-L., Tomita, S., and Riggs, A. (1972) Biochim. Biophys. Acta 278, 344-354
15. Fago, A., and Weber, R. E. (1995) Biochim. Biophys. Acta 1249, 109-115
16. Fago, A., Malte, H., and Dohn, N. (1999) Respir. Physiol. 115, 309-315
17. Ellory, J. C., Wolowyk, M. W., and Young, J. D. (1987) J. Exp. Biol. 129, 377-383
24
by guest on June 3, 2018http://w
ww
.jbc.org/D
ownloaded from
18. Peters, T., and Gros, G. (1998) in The Biology of Hagfishes (Joergensen, J. M.,
Lomholt, J. P., Weber, R. E., and Malte, H., eds.), pp. 307-320, Chapman and Hall,
London
19. Wells, R. M. G., Forster, M. E., Davison, W., Taylor, H. H., Davie, P. S., and
Satchell, G. H. (1986) J. Exp. Biol. 123, 43-53
20. Perry, S. F., Fritsche, R., and Thomas, S. (1993) J. Exp. Biol. 183, 165-184
21. Bauer, C., Engels, U., and Paleus, S. (1975) Nature 256, 66-68
22. Nikinmaa, M., and Weber, R. E. (1993) in The Vertebrate Gas Transport Cascade:
Adaptations to Environment and Mode of Life (Bicudo, J. E. P. W., ed.) pp. 179-187,
CRC Press, Boca Raton, FL
23. Paleus, S., Vesterberg, O., and Liljeqvist, G. (1971) Comp. Biochem. Physiol. 39B,
551-557
24. Liljeqvist, G., Paleus, S., and Braunitzer, G. (1982) J. Mol. Evol. 18, 102-108
25. Rossi Fanelli, A., and Antonini, E. (1958) Arch. Biochem. Biophys. 77, 478-481
26. Friedman, M., Krull., L. H., and Kavins, J. F. (1970), J. Biol. Chem. 245, 3868-3871
27. Gross, E., and Witkop, B. (1961), J. Am. Chem. Soc. 83, 1510
28. Landon (1977) Methods Enzymol. 47, 145-149
29. Kussmann, M., Nordhoff, E., Rahbek-Nielsen, H., Haebel, S., Larsen, M.R.,
Jakobsen, L., Gobom, J., Mirgorodskaya, E., Kristensen, A.K., Palm, L., and
Roepstorff, P. (1997) J. Mass Spectrom. 32, 593-601
30. Thompson, J. D., Higgins, D. G., and Gibson, T. J. (1994) Nucleic Acids Res. 22,
4673-4680
25
by guest on June 3, 2018http://w
ww
.jbc.org/D
ownloaded from
31. Altschul, S. F., Madden, T. L., Schaffer, A.A., Zhang, J., Zhang, Z., Miller, W., and
Lipman, D. J. (1997) Nucleic Acids Res. 25, 3389-402
32. Stafford, W. F. (1992) Anal. Biochem. 203, 295-301
33. Johnson, M., Correia, J. J., Yphantis, D. A., and Halvorson, H. (1981), Biophys. J. 36,
575-588
34. Randall, D. J. (1970) Fish Physiology 4, 253 - 292
35. Wells, R. M. G., and Weber, R. E. (1989), Techniques in Comparative Respiratory
Physiology: An Experimental Approach, Society for Experimental Biology Series,
Cambridge University Press, Cambridge
36. Olson, J. S., and Phillips, G. N. Jr. (1996) J. Biol. Chem. 271, 17593-17596
37. Li, T., Quillin, M. L., Phillips, G. N., and Olson, J. S. (1994) Biochemistry 33,
1433-1446
38. Maxwell, J. C., and Caughey, W. S. (1976) Biochemistry 15, 388-96
39. Park, K. D., Guo, K. M., Adebodun, F., Chiu, M. L., Sligar, S. G., and Oldfield, E.
(1991) Biochemistry 30, 2333-2347
40. Rumen, N. M., and Love, W. E. (1963), Acta Chem. Scand. 17, 222-225
41. Qiu, Y., Maillett, D. H., Knapp, J., Olson, J. S., and Riggs, A. F. (2000) J. Biol.
Chem. 275, 13517-13528
42. Bannai, S., Sugita, Y., and Yoneyama, Y. (1972) J. Biol. Chem. 247, 505-510
26
by guest on June 3, 2018http://w
ww
.jbc.org/D
ownloaded from

FIGURE LEGENDS
Fig. 1 - Amino acid sequence of M. glutinosa HbI (top) and HbII (bottom). The various
fragments used to reconstruct the sequence are shown. Dashed arrows indicate the residues
identified by direct automated Edman degradation of the intact protein. N, peptides obtained by
digestion with endoproteinase Asp-N; CB, cyanogen bromide peptides; AspPro, Asp-Pro
cleavage peptides.
Fig. 2 - Amino acid sequence alignment of M. glutinosa hemoglobins with Physeter catodon
myoglobin (S.W. Mb) and Petromyzon marinus HbV. The helix notation refers to sperm whale
myoglobin, the numbering to P. marinus HbV. Residues in the distal heme pocket are in red;
residues at the dimer interface in P. marinus HbV are in green, those involved in the hydrogen
bonding network at this interface are marked with an asterisk.
Fig. 3 - FTIR absorption spectra of M. glutinosa hemoglobins in the CO stretching region.
Protein concentration was 1.4-1.6 mM (heme). The hemolysate (total) was about 2 mM heme.
All spectra were measured in 200 mM HEPES buffer at pH 7.0 and 20 °C in a 50 µ CaF2 cell.
Fig. 4 - Oxygen equilibria of isolated M. glutinosa hemoglobins as a function of pH. The
temperature was 10 °C. The protein concentration was 0.5 mM (heme) in 100 mM HEPES
buffer with (full symbols) or without (empty symbols) 10 mM NaHCO3. HbI (circles); HbII
(squares); HbIII (triangles).
Fig. 5 - Oxygen equilibria of binary equimolar mixtures of M. glutinosa hemoglobins. The
temperature was 10 °C. The protein concentration was 0.5 mM (heme) in 100 mM HEPES
buffer with (full symbols) or without (empty symbols) 10 mM NaHCO3. a) HbI+HbII; b)
27
by guest on June 3, 2018http://w
ww
.jbc.org/D
ownloaded from

HbI+HbIII; c) HbII+HbIII.
Fig. 6 - Sedimentation equilibrium of deoxygenated HbII. The experiments were conducted
at 10 °C and 30000 (circles) or 35000 (squares) rpm. The protein concentration was 250 µM
(heme) in 200 mM HEPES buffer pH 6.0 in the absence (a) or in the presence (b) of 10 mM
NaHCO3. The data are fitted to a monomer-dimer model. Residuals are shown in the lower
panels.
Fig. 7 - Sedimentation velocity patterns of binary equimolar mixtures of deoxygenated M.
glutinosa hemoglobins. a) HbI+HbII; b), HbI+HbIII; c) HbII+HbIII; d) total hemolysate. The
protein concentration was 200 (a and c), 250 (b) and 60 (d) µM (heme) in 200 mM HEPES
buffer pH 6.0 (c) or 7.4 (a, b and d) in the presence of 10 mM NaHCO3.
Fig. 8 - Interface residues and hydrogen bonding network in deoxygenated dimeric P.
marinus HbV. The coordinates of the X-ray structure (12) are from the Protein Data Bank, PDB
ID number 3LHB.
28
by guest on June 3, 2018http://w
ww
.jbc.org/D
ownloaded from

TABLE I
Kinetics of CO binding and oxygen dissociation from HbI, HbII and HbIII hemoglobins
from M. glutinosa
All experiments were carried out in 200 mM HEPES buffer at pH 7.0 and 20 °C.
ProteinkCO (µM-1 s-1) kO2 (s-1)
HbI 0.16 ± 0.2 61 ± 3HbII
1.1 ± 0.1 82 ± 4
HbIII 0.13 ± 0.4 146 ± 8
by guest on June 3, 2018http://w
ww
.jbc.org/D
ownloaded from
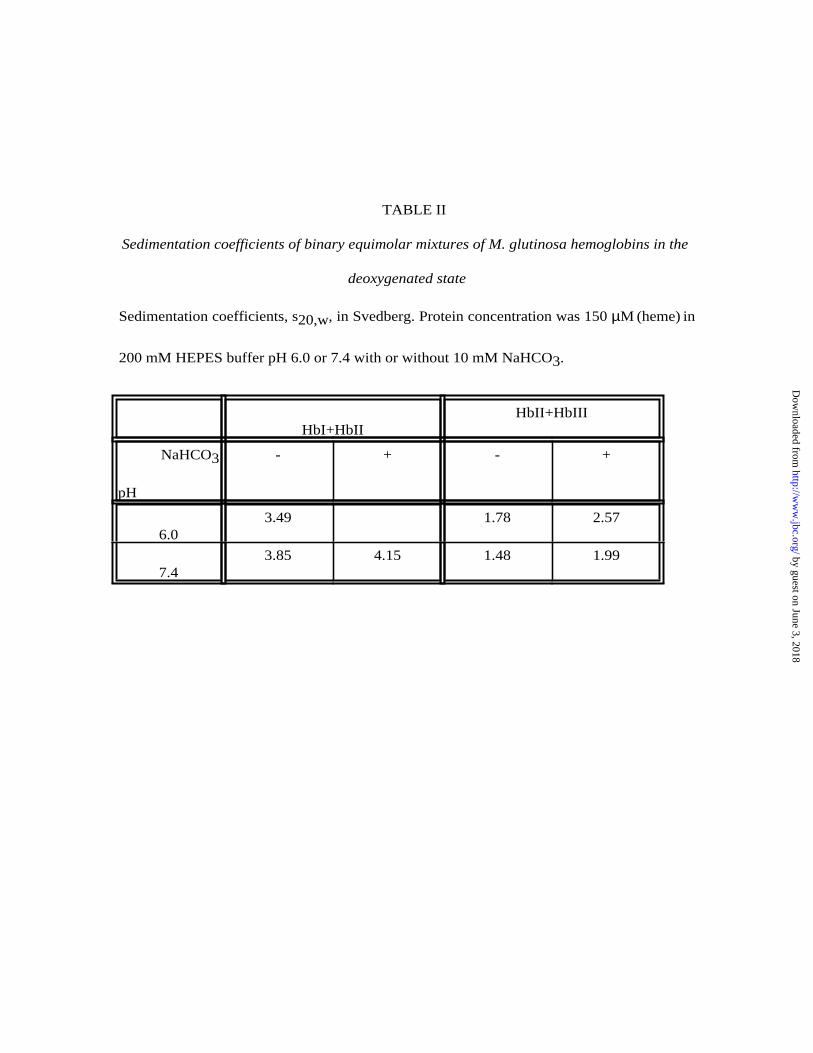
TABLE II
Sedimentation coefficients of binary equimolar mixtures of M. glutinosa hemoglobins in the
deoxygenated state
Sedimentation coefficients, s20,w, in Svedberg. Protein concentration was 150 µM (heme) in
200 mM HEPES buffer pH 6.0 or 7.4 with or without 10 mM NaHCO3.
HbI+HbII
HbII+HbIII
3NaHCO
pH
- + - +
6.03.49 1.78 2.57
7.43.85 4.15 1.48 1.99 by guest on June 3, 2018
http://ww
w.jbc.org/
Dow
nloaded from

HbI 10 20 30 40 50
PITDQRPLPTLSEGEKKAIKESWPQIYQNFEQTSLDVLIEFLKKFPEAQD
---------------------------------------------------º
N1 N2 N3
←→ ←(((((((((((((((((((((→ ←(((((((→ ← 60 70 80 90 100
SFPKFSAKKCHLEQDNEVKWQASRIINAVNAVVGHLDNEVAMKQYLKELS
N4 N5 ((((((((→ ←((((((((((((((→ ←(((((((( N4-N6 ((((((((((((((((((((((((((((º CB2
←------------ 110 120 130 140
VKHSSEFQVNPDMFKELSAIFVSTIRGKAAYEKLFSIICTLLRSSYDE
N8
N6-N7 ←→(((((((((((º CB3 ---------------→ ←----------------------------------------------------→
HbII 10 20 30 40 50
AcSAHGIARTTEGERAAVRASWAVLMKDYEHAGVQILDKFFKANPAAKPFFT
N1 N2 N3
←(((((((((((((((→ ←(((((→ ←(((((((((
CB2 ---------------------------º
60 70 80 90 100
KMKDLHTLEDLASSADARWHVERIIQAVNFAVTNIEDREKLSNKFVKLSQ I N4 N5 N6 N7
→ ←((→←(→ ←((((((((((((→ ←((((((((→ N6-N7
(((((((((((((((((º CB3 -------------------º 110 120 130 140 150
DHIEEFHVTDPQYFMILSQTILDEVEKRNGGLSAEGKSGWHKVMTIICKMLKSKY G N8 N9 E1 E2
←(((→←(((((→←(((((→←((((((((((→ N8-N9 N10
((((((º ←((((((((((((((((((→ AspPro
----------------------------------º
by guest on June 3, 2018http://w
ww
.jbc.org/D
ownloaded from

NA | ______A _______ | | ______B _______ || __C__| CD |
S.W. Mb ---------VLSEGEWQLVLHVWAKVEADVAGHGQDILIRLFKSHPETLEKFDRFKHLKT * **P.m. HbV PIVDTGSVAPLSAAEKTKIRSAWAPVYSTYETSGVDILVKFFTSTPAAQEFFPKFKGLTTM.g. HbIIB ---SAHGIARTTEGERAAVRASWAVLMKDYEHAGVQILDKFFKANPAAKPFFTKMKDLHTM.g. HbI PITDQRPLPTLSEGEKKAIKESWPQIYQNFEQTSLDVLIEFLKKFPEAQDSFPKFS--AKM.g . HbIII PITDHGQPPTLSEGDKKAIRESWPQIYKNFEQNSLAVLLEFLKKFPKAQDSFPKFS--AK | | | | | | 10 20 30 40 50 60
__D_ _|| _________E ___________ | EF | ___F___ | FG | _______
S.W. Mb EAEMKASEDLKKHGVTVLTALG---AILKKKGHHEAELKPLAQSHATKHKI-PIKYLEFI * **P.m. HbV ADQLKKSADVRWHAERIINAVNDAVASMDDTEKMSMKLRDLSGKHAKSFQV-DPQYFKVLM.g. HbIIB LEDLASSADARWHVERIIQAVNFAVTNIEDREKLSNKFVKLSQDHIEEFHVTDPQYFMILM.g. HbI KCHLEQDNEVKWQASR IINAVNAVVGHLDNEVAMKQYLKELSVKHSSEFQV-NPDMFKELM.g . HbIII KSHLEQDPAVKLQAEV IINAVNHTIGLMDKEAAMKKYLKDLSTKHSTEFQV-NPDMFKEL | | | | | | 70 80 90 100 110 119
___G ______ | GH | __________H ___________ | HC
S.W. Mb SEAIIHVLHSRHPGDFGADAQGAMNKALELFRKDIAAKYKELGYQG
P.m. HbV AAVIADTVAA---------GDAGFEKLMSMICILLRSAY-------M.g. HbIIB SQTILDEVEKRNGG-LSAEGKSGWHKVMTIICKMLKSKY-------M.g. HbI SAIFVSTIR----------GKAAYEKLFSIICTLLRSSYDE-----M.g . HbIII SAVFVSTMG----------GKAAYEKLFSIIATLLRSTYDA----- | | | 129 130 140
by guest on June 3, 2018http://www.jbc.org/Downloaded from


Alberto Boffi and Emilia ChianconeAngela Fago, Laura Giangiacomo, Rossana D'Avino, Vito Carratore, Mario Romano,
Hagfish hemoglobins, structure, function and oxygen-linked association
published online April 9, 2001J. Biol. Chem.
10.1074/jbc.M100759200Access the most updated version of this article at doi:
Alerts:
When a correction for this article is posted•
When this article is cited•
to choose from all of JBC's e-mail alertsClick here
by guest on June 3, 2018http://w
ww
.jbc.org/D
ownloaded from