haiti sector identification project
TRANSCRIPT

Investment Consulting Associates (ICA) 1 CFI Haiti Agro-industry Sector
HAITI SECTOR IDENTIFICATION
Sector Report 1
Agroindustry
October 17, 2017
ICA Headquarters ICA North America Barbara Strozzilaan 201 359 Newbury Street 1083 HN Amsterdam Boston, MA 02115 The Netherlands USA M: [email protected] M: [email protected] P: +31 20 217 01 15 P: +1 617 314 6527
Investment Consulting Associates (ICA) 2 CFI Haiti Agro-industry Sector
Investment Consulting Associates (ICA) 3 CFI Haiti Agro-industry Sector
1. Table of Contents
1. Table of Contents..................................................................................................................... 3
List of Abbreviations ....................................................................................................................... 7
1. Methodology ........................................................................................................................... 9
1.1 Documentary sources ................................................................................................................. 9
1.2 Direct interviews with key informants in Haiti ............................................................................ 9
Agroindustry Sector Description ........................................................................................... 10
2.1 Agroindustry and economic development ................................................................................ 10
2.2 A multiplicity of value chains associated to distinctive complex systems ................................. 11
2.3 International trade .................................................................................................................... 12
Global Sector Trends ............................................................................................................. 14
3.1 Population growth, urbanization and aging .............................................................................. 14
3.2 Climate change.......................................................................................................................... 14
3.3 Consumption patterns .............................................................................................................. 15
3.4 Consumer awareness ................................................................................................................ 15
3.5 Technology and innovation ....................................................................................................... 15
3.6 Market institutions.................................................................................................................... 16
3.7 Aquaculture .............................................................................................................................. 16
Global FDI Trends and Drivers for Internationalization ........................................................ 18
4.1 FDI trends .................................................................................................................................. 18
4.2 Trends and strategic challenges for Haiti by demand side drivers ............................................ 19
FDI drivers .............................................................................................................................. 20
Competitiveness of Haiti in the Sector .................................................................................. 21
6.1 Haitian agriculture sector description ....................................................................................... 21
6.1.1 Haitian agricultural imports and exports ........................................................................... 24
6.1.2 Haitian import market vs local market .............................................................................. 26
6.1.3 Haitian agricultural exports ............................................................................................... 27
6.2 Haiti vs. Dominican Republic Positioning .................................................................................. 28
6.2.1 The Dominican Republic (DR) ............................................................................................ 28
6.2.2 The Dominican Republic’s agribusiness organic positioning ............................................. 31
6.2.3 Estimates on informal Haitian imports from the DR ......................................................... 32
Best Practice Case Study ........................................................................................................ 33
Two more best practice case studies can be found in Appendix 2. ....................................................... 34
Haiti Agribusiness Profile and Strategy ................................................................................. 35
8.1 Haiti Investment and free trade agreements (other than textiles) ........................................... 35
Investment Consulting Associates (ICA) 4 CFI Haiti Agro-industry Sector
8.1.1 Investment Incentives ....................................................................................................... 36
8.2 Foreign trade zones................................................................................................................... 37
8.3 National Society of Industrial Parks (SONAPI) ........................................................................... 38
Agribusiness Productive Ecosystem ...................................................................................... 39
9.1 Public ........................................................................................................................................ 39
9.2 Donors ....................................................................................................................................... 40
Targeted Agribusiness Subsectors ..................................................................................... 43
SWOT Analysis of the Haitian Agro-industry ..................................................................... 46
Location Value Proposition for Haitian Agribusiness ........................................................ 48
12.1 Large potential for FDI attraction on national market and import substitution .................... 48
12.2 Exports potential and FDI attraction ..................................................................................... 48
Sustainable Development .................................................................................................. 51
13.1 Sustainable development trends in the sector and in Haiti................................................... 52
Target Markets for Agro-sector and Type of Companies to attract for FDI ...................... 53
14.1 Target markets for agro-sector ............................................................................................. 53
14.2 Type of companies to attract for FDI ..................................................................................... 54
Conclusions and Recommendations .................................................................................. 56
15.1 Conclusions ........................................................................................................................... 56
15.2 Recommendations ................................................................................................................ 56
References ......................................................................................................................... 61
Appendix 1 – Targeted Agribusiness Matrix ...................................................................... 64
Appendix 2 –Best Practice Case Studies ............................................................................ 85
16.1 Organic banana cluster – Dominican Republic .............................................................................. 85
16.2 The Berimbau Project - Brazil ........................................................................................................ 88
Appendix 4 – Mission Report ............................................................................................. 91
Appendix 5 – Raw Competitiveness Data .......................................................................... 94
Investment Consulting Associates (ICA) 5 CFI Haiti Agro-industry Sector
List of Figures
Figure 1. Agroindustry Value Chain ........................................................................................................... 11
Figure 2. Top Source and Destination Countries of Agricultural FDI ......................................................... 18
Figure 3: Average five-year yield by major crops in 2014 ......................................................................... 23
Figure 4. Evolution of agricultural imports and exports from 2009 to 2016 ............................................. 25
Figure 5. Categorization of market structures in Haiti .............................................................................. 27
Figure 6. Agricultural trade balance – Dominican Republic – 2003-2013 ................................................. 29
Figure 7. Food exports and imports – Dominican Republic – 2006-2016 .................................................. 30
Figure 8. Catches of fish in Haiti and the Dominican Republic – 2003-2013 ............................................. 31
Figure 9. Haiti – Countries and blocks with free trade or preferential trade arrangements ..................... 36
Figure 10: Hispaniola Island – Haiti and Dominican Republic division ...................................................... 51
List of Tables
Table 1: Exports in millions of US dollars - All food items (SITC 0+1+22+4) 2012-2016 ............................ 12
Table 2: Share in world exports - All food items (SITC 0+1+22+4) 2012-2016 .......................................... 12
Table 3. World exported products for sectors/product with more annual growth, codes linked to the
agroindustry’s value chain for 2012 and 2016 .......................................................................................... 13
Table 4. Main FDI projects span subsectors .............................................................................................. 18
Table 5. Haiti - Gross Production Value, National Production and Change in Production over 2004-2014 25
most important products in terms of Gross Production Value in 2014 .................................................... 22
Table 6. Area harvested in 2014 for the 10 most important products in terms of hectares ..................... 23
Table 7. Importance of food products imports and primary products exports in Haiti’s GDP, total imports
and total exports....................................................................................................................................... 24
Table 8. Top 10 imported food products in 2013 – Import value and imported tons ............................... 25
Table 9. Top eight exported food products in 2013 – Export value and exported tons ............................ 28
Table 10: Haiti – Bilateral Investment Treaties (BITs) International Investment Agreements .................. 35
Table 11: Targeted Agribusiness Matrix .................................................................................................... 44
Table 12: Natural disasters. The Haitian population is highly exposed to shocks compared to the Dominican
Republic .................................................................................................................................................... 51
Table 13: Targeted subsectors, markets and metrics ............................................................................... 53
Table 14: Targeted subsectors and type of companies ............................................................................. 54

Investment Consulting Associates (ICA) 6 CFI Haiti Agro-industry Sector
Table 15: Enterprise and value chain risks checklist, risk rating and mitigation strategy - Endogenous and
exogenous risks......................................................................................................................................... 59
Table 16: Targeted Agribusiness Matrix - Mango ..................................................................................... 64
Table 17: Targeted Agribusiness Matrix - Cocoa ....................................................................................... 66
Table 18: Targeted Agribusiness Matrix - Aquaculture ............................................................................. 69
Table 19: Targeted Agribusiness Matrix - Sorghum .................................................................................. 71
Table 20: Targeted Agribusiness Matrix - Bananas and Plantains ............................................................. 73
Table 21: Targeted Agribusiness Matrix - Coffee ...................................................................................... 75
Table 22: Targeted Agribusiness Matrix - Essential Oils ............................................................................ 78
Table 23: Targeted Agribusiness Matrix - Poultry and Eggs ...................................................................... 80
Table 24: Targeted Agribusiness Matrix - Rice .......................................................................................... 83
Table 25: Competitiveness Analysis Raw Data - Regulations and Business Climate .................................. 94
Table 26: Competitiveness Analysis Raw Data - Political Stability............................................................. 94
Table 27: Competitiveness Analysis Raw Data - Macroeconomic Stability ............................................... 95
Table 28: Competitiveness Analysis Raw Data - Fiscal and Cost Climate .................................................. 95
Table 29: Competitiveness Analysis Raw Data - Proximity to Markets or Customers ............................... 96
Table 30: Competitiveness Analysis Raw Data - Infrastructure and Logistics............................................ 96
Table 31: Competitiveness Analysis Raw Data - Technology and Innovation............................................ 97
Table 32: Competitiveness Analysis Raw Data - Skilled Workforce Availability ........................................ 97
Table 33: Competitiveness Analysis Raw Data - Domestic Market Growth Potential ............................... 97
Table 34: Competitiveness Analysis Raw Data - Industry Cluster and Critical Mass.................................. 98
Table 35: Competitiveness Analysis Raw Data - Attractiveness and Quality of Life .................................. 98

Investment Consulting Associates (ICA) 7 CFI Haiti Agro-industry Sector
List of Abbreviations Abbreviation Definition
ACP African, Caribbean, Pacific
ANCRE Agricultural Production Chain Support Program
ANEM Association Nationale des Exportateurs de Mangues
APAGNO Association des Producteurs Avicoles du Grand Nord
APHES Association des Producteurs d’Huiles Essentielles du Sud
ASONAHORE The National Hotels and Restaurants Association
BACOZ Bureau de Coorination et de Suivi des Accords, de la CARICOM, de l’OMC et de la ZLEA
BIT Bilateral Investment Treaties
BRH Banque de la République d’Haïti
CAGR Compound Annual Growth Rate
CARICOM Caribbean Community
CEDA Caribbean Export Development Agency
CEI-RD Centro de Exportación e Inversión de República Dominicana
CFI Centre de Facilitation des Investissements (Haiti)
CIA Central Intelligence Agency
CII Inter-Ministerial Commission for Investments
CSME CARICOM Single Market Economy
DCA Development Credit Authority (USA)
DR Dominican Republic
EC European Community
E.g. For example
EPA Economic Partnership Agreement
EPRP Export Led Poverty Reduction Programme
Etc. Etcetera
EU European Union
FAO Food and Agriculture Organization of the United Nations
FDI Foreign Direct Investment
FDI Fonds De Développement Industriel
FSMA Food Safety Modernisation Act
FTA Foreign Trade Agreement
FTAA Free Trade Area of the American
FTZ Free Trade Zone
GDP Gross Domestic Product
GPS Global Positioning System
Ha Hectare
HOFE HAITI ORGANIC FUELS ENTREPRISE
HS Harmonized System
HTG Haitian Gourde
ICA Investment Consulting Associates
ICT Information & Communications Technology
IDB Inter-American Development Bank
IFC International Finance Corporation

Investment Consulting Associates (ICA) 8 CFI Haiti Agro-industry Sector
IIC Inter-American Investment Corporation
ITC International Trade Centre
LIFDC Low-Income Food-Deficit Countries
Ltd. Limited (company)
LVCQAT Tamarinier Veterinary Laboratory and Food Quality Control
MARNDR Ministry of Agriculture, Natural Resources and Rural Development
MCI Ministry of Trade and Industry
MEF Ministry of Economy and Finance
MIF Multilateral Investment Fund
MNE Multinational Enterprise
MSME Micro Business Support Program
MT Metric Ton
NGO Non-Governmental Organization
PANSEH National Support Program for the Structuring of Haitian Entrepreneurship
PAP Port-au-Prince
PIC Industrial Park of Caracol
PIM The Metropolitan Industrial Park
PTA Preferential Trade Agreements
S.A. Société Anonyme
SITC Standard International Trade Classification
SMASH Smallholder Alliance for Sorghum in Haiti
SONAPI National Society of Industrial Parks
SWOT Strengths, Weaknesses, Opportunities, Threats
TRIMs Agreement on Trade-Related Investment Measures
UK United Kingdom
UN United Nations
UNCTAD United Nations Conference on Trade and Development
UNIDO United Nations Industrial Development Organization
UPISA The Unit for the Promotion of Private Investments in the Agricultural Sector
US United States
USAID United States Agency for International Development
USD United States Dollar
VC Value Chain
WFP World Food Program
WTO World Trade Organization

Investment Consulting Associates (ICA) 9 CFI Haiti Agro-industry Sector
1. Methodology The mandate has required collecting and analyzing a set of qualitative and quantitative information/data from documentary sources and direct interviews.
1.1 Documentary sources
Appendix 3 presents the bibliography and a list of the main documental sources. These sources allow
standing good relevant context portrayals of the agroindustry sector in Haiti and permits to define how
and to what degree this context carries very marked peculiarities.
1.2 Direct interviews with key informants in Haiti
The face-to-face interviews in Port-au-Prince have been focused to interviewed as a open direct subject
concerning the main growth sectors potential and the sustainable market opportunities for the
agroindustry development of Haiti: the answers have been compiled in a questionnaire. Such a procedure
obviously has no pretensions of statistical validity since the list of people met has nothing to do with a
technical sampling survey and is limited to fifteen interviews. The answers may have been guided by the
sector where the interviewees evolve and/or environmental influences from the socio-economic
development circles or the media. However, it is reasonable to pay interest value to the overall result
because the people interviewed may be deemed to be in good position as privileged observers to identify
the dynamic in business and economic development in Haiti agroindustry. Appendix 4 – Mission Report,
provides a list of organizations/persons met during the mission from 19th to the 29th June 2017 to Port
au Prince.

Investment Consulting Associates (ICA) 10 CFI Haiti Agro-industry Sector
Agroindustry Sector Description
2.1 Agroindustry and economic development
Agro-industry is understood as the industrialization of agriculture, often involving value-added processes
creating new products derived from raw agricultural products. It can be considered as the overarching
umbrella covering both pure agricultural commodities as well as value-added food products 1 .
Agroindustry is considered one of the most important industry sectors for developing countries as a way
of achieving economic development through higher employment and increased per capita income. There
is also a high correlation between the Human Development Index and the agribusiness/agriculture ratio.
That is, countries that have more agribusiness activity as opposed to pure agricultural activity experience
a higher degree of human development.2 Developing countries also tend to be more exposed to issues of
food safety and security, meaning agroindustry can help alleviate this problem.3
The agroindustry value chain (figure 1) begins with inputs, including equipment, pesticide, fertilizer, feed,
and seed. These inputs, especially pesticide and fertilizer, have become a large industry in their own right.
The production stage involves tillage operations, the rearing of livestock, harvesting of fish and timber,
etc. When these commodities are harvested, they can either enter the market to the consumer, or stay
within the value chain for value-added activities. If remaining in the value chain, the commodities are sold
to industrial manufacturers, where the value-added activities occur, including food and product
preservation, as well as packaging. The product is sold to either domestic or foreign wholesalers, and
distributed to retailers before finally reaching the consumer.
1 Henson and Cranfield define it as “the subset of the manufacturing sector that processes raw materials and intermediate products derived from agriculture, fisheries and forestry”. Henson & Cranfield, “Building the Political Case for Agro-industries and Agribusiness in Developing Countries,” Agro-industries for Development, FAO & UNIDO (2009).
2 Wilkinson & Rocha, “Agro-industry Trends, Patterns and Development Impacts,” Agro-industries for Development, FAO & UNIDO (2009)
3 UNIDO – Agro-Value Chain Analysis and Development (2009)

Investment Consulting Associates (ICA) 11 CFI Haiti Agro-industry Sector
Figure 1. Agroindustry Value Chain
Source: Investment Consulting Associates – ICA (2017), adapted from UNIDO – Agro-Value Chain Analysis and
Development (2009)
2.2 A multiplicity of value chains associated to distinctive complex systems
The agroindustry’s value chain is complex because it contains multiple varied value chains - each one
linked to a specific product or activity – as well as many forward and backward linkages, each value chain
operating within a unique environment where the market is seen as a national political area.
› This value chain system covers more than 20 different industries, as well as many commodity sub-
sectors, including for instance live animals, fish, meat, grains, dairy, oils, fats, fruits and vegetables,
confectioneries, coffee, etc.), with each sub-sector operating in its own environment, having its
own linkages, and following its own dynamic of development and competitiveness within national
and international markets.
› The value chain has many stages, starting with agricultural inputs (fertilizers, seeds, pesticides,
tools and machinery), followed by primary food processing, by the production/manufacturing of
agri-food products and by-products and through marketing and distribution services.
› The complexity of the analysis lies also to the variety and heterogeneity of the active players in
the chain, some of which having a leading role along the chain. For instance, the chain may
include:
- Small farmers, input manufacturers, and producers controlling new technologies and
production processes, with core competencies in manufacturing capabilities and product
innovation;
- Small sellers in the market, small supermarkets, local traders, large buyers or retailers
with purchasing power in terms of volume and core competencies in branding and
marketing, and global traders mastering export channels.
› Finally, the agriculture sector remains one of the most protected sectors in many developed and
developing countries (tariff barriers, quota restrictions, tariff escalation, non-tariff barriers such

Investment Consulting Associates (ICA) 12 CFI Haiti Agro-industry Sector
as standards requirements and various forms of certification), making it difficult for the latter to
enter the foreign markets, and therefore hampering their export growth and discouraging
investments in agricultural activities (processed or non-processed).
Agriculture continues to play a central role in the economic development of developing countries and is
a key contributor to poverty reduction: it remains essential to identify opportunities contributing to the
efficiency of the agroindustry’s value chain, leading to a more profitable participation in global trade.
2.3 International trade
In 2016, according to UNCTADstat, the world exports for the category « all food items » 4 reached 1,363
billion USD - an average growth of 6% per year since 2006. However, despite an almost stagnant evolution
since 2011 (average annual variation of -0.1%), world exports have decreased by nearly 5% per year since
2014.
› In 2016, the developing economies provided around 40% of the value of the world food item
exports (tables 1 & 2), with an evolution similar that of world exports.
› The Caribbean community is a very small exporter, providing less than 1% of all food item exports.
This region has experienced a very slow growth from 2006 to 2016, but the contraction since
2014 has been less pronounced (-2.9%) since 2014.
› With food item exports valued at 84.5 million US dollars in 2016, Haiti has a very marginal share
of the world exports (0.006%). However, the country has followed a different path with a
relatively strong growth in exports, nearly 10% per year since 2006, and around 5% per year since
2014.
Table 1: Exports in millions of US dollars - All food items (SITC 0+1+22+4) 2012-2016 Year World Developing
economies CARICOM (Caribbean
Community) Haiti
2012 1,381,854 540,014 1,997 64
2013 1,460,092 563,127 1,920 74
2014 1,501,334 584,225 1,805 76
2015 1,337,033 544,186 1,903 83
2016 1,362,287 544,040 1,702 84
Average annual variation:
2006-2016 6.0% 7.8% 0.9% 9.6%
2011-2016 -0.1% 0.2% -2.1% 5.0%
2014-2016 -4.7% -3.5% -2.9% 5.2%
Source: UNCTADstat (2016).
Table 2: Share in world exports - All food items (SITC 0+1+22+4) 2012-2016 Year World Developing
economies CARICOM Haiti
2012 100.0% 39.1% 0.14% 0.005%
2013 100.0% 38.6% 0.13% 0.005%
2014 100.0% 38.9% 0.12% 0.005%
4 Including SITC codes 0, 1, 22 and 4.

Investment Consulting Associates (ICA) 13 CFI Haiti Agro-industry Sector
2015 100.0% 40.7% 0.14% 0.006%
2016 100.0% 39.9% 0.12% 0.006%
Calculations based on UNCTADstat (2016).
The trade data of the International Trade Centre, based on the Harmonized System (HS), provides a similar
world exports estimate of 1,479 billion USD in 2016 for all products linked to the agroindustry’s value
chain, with a slight average decrease of 0.4% per year between 2012 and 2016. However, each sector has
followed a different development, specific to its own structure and organisation, its own dynamic in the
value chain, and its own environment. Thus, since 2012, some sectors have experienced a growth -
between 3 to 4.2% on average annual growth value from 2012-2016 - in their exports -, for instance roots
and tubers, citrus and melons, fish, preparation of cereals, cocoa and vegetable products (codes 03, 07,
08, 14, 18, 19, 21, 33 in yellow on table 3 – products on which Haiti could be positioned), while others,
such as dairy products, eggs, coffee, underwent a decline in the value of their exports.
Table 3. World exported products for sectors/product with more annual growth, codes linked to the agroindustry’s value chain for 2012 and 2016
Product
code
Product label Exported value (USD
billions) Average annual
growth value 2012-2016 2012 2016
07 Edible vegetables and certain roots and tubers 58.6 69.3 4.2%
08 Edible fruit and nuts; citrus or melons peels 90.7 107.2 4.3%
03 Fish and crustaceans, molluscs and other aquatic invertebrates 95.9 109.9 3.5%
21 Miscellaneous edible preparations 56.9 64.8 3.3%
19 Preparations of cereals, flour, starch or milk; pastry chefs’ products 58.0 65.6 3.1%
18 Cocoa and cocoa preparations 44.0 49.5 3.0%
14 Vegetable plaiting materials; vegetable products not elsewhere specified or included
0.8 0.9 3.0%
Sources: ITC calculations based on UN COMTRADE and ITC statistics. The sub-total is calculated from ITC data. Notes: (1) The product codes are based on the Harmonized System (HS) revision of 2012.

Investment Consulting Associates (ICA) 14 CFI Haiti Agro-industry Sector
Global Sector Trends The major trends driving the agroindustry value chain in the near future are the following.
3.1 Population growth, urbanization and aging
With a general slow down of the world population growth, the population is expected to reach 9.8 billion
in 2050, and 11.2 billion in 21005. More than half of the anticipated growth is expected to occur in Africa,
with Asia being the second largest contributor. This will boost agricultural demand.
More people live and will live in urban areas and cities, in high-income countries as well as middle and
low-income countries. Food security is even more pressing given the rapid urbanization of many emerging
and developing countries. Such rapid growth and urbanization will only put more pressure on global food
supplies and prices as demand increases.6 This huge demand will accentuate competition for natural
resources, such as land, water, and energy, as these resources become scarcer. This competition could
result in the degradation of resources.7
Not only the world is likely to be more populous and urban, but also demographically older8, with a much
more rapid increase in many low-income countries. This phenomenon of ageing is adding pressure,
slowing the economic growth potential and the income levels, and transforming food consumption
patterns. Rural ageing will impact the rural labour force, the patterns of agricultural production, land
tenure, and social organization within rural communities. Farming technologies and agricultural policies
will have to take into account the capacities and the needs of older farmers.
3.2 Climate change
Environmental and climate issues may put agricultural productivity at further risk, and further increase its
vulnerability to external shocks. Disasters occurring at greater frequency and intensity can cause political
instability, which compounds issues further. Unfortunately, Haiti is no stranger to disaster and has proven
its vulnerability. It is evident that the production of the agricultural and food market needs to be further
intensified in a balanced, innovative, and sustainable fashion, thereby taking into account societal,
economic, political, and environmental concerns.9 The adoption of sustainable practices by smallholders
(e.g. reducing greenhouse gas emissions, deforestation, and land degradation) will be crucial to efforts to
adapt to climate change.
5 In a scenario of modest economic growth.« World Population Prospects - The 2017 Revision. Key Findings and Advance Tables”, United Nations, page 1.
6 ICA
7 FAO - Global Trends and Future Challenges for the Work of the Organization (2012)
8 « The future of food and agriculture – Trend and Challenges », FAO, 2017. From 1950 to 2015, the share of children below the age of five declined from 13.4 percent to 9.1 percent, and the proportion of older (65+) people rose from 5.1 percent to 8.3 percent. This development is expected to accelerate. By the end of the century, the share of young children could decline to 5.8 percent, while the proportion of older people is forecast to rise to 22.7 percent (UN, 2015).
9 ICA

Investment Consulting Associates (ICA) 15 CFI Haiti Agro-industry Sector
3.3 Consumption patterns
As consumption has increased in developing countries that have experienced growth, the patterns of
consumption have changed with it. Diets have shifted towards a rapid increase of livestock products such
as meat, milk, and eggs, as well as vegetable oils and sugar. These three categories are projected to
account for 35% of food consumption in developing countries by 2030.10
Other factors impact food consumption patterns:
› Urbanization and higher urban wages bring an increase of demand for processed foods, fruits and
vegetables, animal-source food, prepared foods and meals (including fast food), causing a change
in the nutrient content of diet, becoming higher in salt, fat and sugar.
› Shifting demographics (aging population), the purchasing power of Millenials, and increased
ethnic diversity are contributing to changing food preferences toward food products with
enhanced nutrition, ethical food choices (e.g. animal welfare and fair grade) environmentally
sustainable diets, new taste profiles and flavour combinations.
3.4 Consumer awareness
Increased consumer awareness and demand for sustainable agri-food products in combination with
policies advocating a transition towards more sustainable agri-food practices and systems have emerged,
particularly in developed economies. Multinational enterprises (MNEs) from developed economies have
started to invest upstream in their global value chains in response to increased demand for corporate
social responsibility by consumers, governments, banks, and other institutions.11
Consumers desire more information about food12 in order to ensure that their buying habits align with
their personal values (e.g. animal welfare, vegetarian, halal, kosher, fair trade). They are looking for
recognizable nutrition information that will help them to make better choices for their personal health,
including easy-to-understand nutrition labels, health claims and front of pack symbols for easy selection.
They want a clean and a clear label embracing the concept of transparency.
3.5 Technology and innovation
Technology is pushing innovation in the agricultural sector through precision farming. Precision farming13
optimizes yields and resiliency through soil and yield mapping, precise forecasting of weather and disease,
10 FAO - Global Trends and Future Challenges for the Work of the Organization (2012)
11 ICA
12 “Canadian Food Trends to 2020 – A Long Range Consumer Outlook”, Serecon Manamgement Consulting Inc. prepared for Agriculture and Agri-Food Canada, 2005.
13 Yuan, “2016 Analysis of New Patterns and Future Trends in Agriculture,” AgroNews, http://news.agropages.com/News/NewsDetail---21111.htm, accessed 2 June 2017. This technology is very mature in the United States and a sound modern agricultural management system has been formed.

Investment Consulting Associates (ICA) 16 CFI Haiti Agro-industry Sector
and machine automation through GPS, mobile devices, robotics, sensors and the internet of things14. As
agroindustry becomes more technologically advanced, it also sets a higher bar for developing countries,
as greater amounts of investment in skills and technology are required.15
Basic information and communications technologies, such as mobile phones, still have great potential for
improving linkages and efficiencies in the value chain and for promoting inclusiveness 16 . They keep
farmers and rural entrepreneurs informed, they connect them with buyers, allowing producers to market
their perishable products more effectively and at better prices.
Regarding biotechnology, agricultural biology (including biopesticides, biofertilizers, micronutrients and
biostimulants) are expected to become the new profit drivers of the agri-input industry pushed by the
consumer awareness for environmental sustainability and environmental safe practices. Biopesticides are
the core of the future development strategy of major companies and many countries because of features
such as safety, environmental protection, low residue, etc. The compound annual growth rate of this
sector is expected to reach 17.4% by 2020, amounting to 6.4 billion USD. 17
3.6 Market institutions
According to the Food & Agricultural Organization (FAO), market institutions and their arrangements play
a key role in facilitating access of small-scale agricultural and food producers to global value chains and
help adopt sustainable agri-food standards and practices. Market institutions, especially in developing
countries, also improve small-scale producers’ access to labour, capital, raw materials, and consumer
markets, and empowers farmers through policy advocacy by acting as a conduit. Strengthening local
market institutions in that sense supports the transition to more sustainably produced agricultural and
food products and, eventually, mitigate threats of food insecurity, rural poverty, hunger, and social
exclusion.18
3.7 Aquaculture Over the past five decades, per capita consumption of fish has more than doubled19. Since the 1980s, almost all of the increase of the fish consumption has come from aquaculture, which has increased its productivity due to the intensification of production methods 20. This trend will continue with the expected growth of demand for fish products and the inability of the ocean to sustainably provide for the projected demand. This means that fisheries and aquaculture will be expected to increase production and
14 Yuan, “2016 Analysis of New Patterns and Future Trends in Agriculture,” AgroNews, http://news.agropages.com/News/NewsDetail---21111.htm, accessed 2 June 2017. This technology is very mature in the United States and a sound modern agricultural management system has been formed.
15 Yuan, “2016 Analysis of New Patterns and Future Trends in Agriculture,” AgroNews, http://news.agropages.com/News/NewsDetail---21111.htm, accessed 2 June 2017
16 FAO - Global Trends and Future Challenges for the Work of the Organization (2012), pp54-55.
17 Yuan, “2016 Analysis of New Patterns and Future Trends in Agriculture,” AgroNews, http://news.agropages.com/News/NewsDetail---21111.htm, accessed 2 June 2017
18 ICA
19 « The future of food and agriculture – Trend and Challenges », FAO, 2017, p.46.
20 « The future of food and agriculture – Trend and Challenges », FAO, 2017, p.48.

Investment Consulting Associates (ICA) 17 CFI Haiti Agro-industry Sector
will need investments and new partnerships to exploit these opportunities.21 The challenge, which also applies to agriculture at large, will be not only to improve efficiency and productivity, but also to conserve scarce natural resources and reduce waste.
21 FAO - Global Trends and Future Challenges for the Work of the Organization (2012)

Investment Consulting Associates (ICA) 18 CFI Haiti Agro-industry Sector
Global FDI Trends and Drivers for Internationalization
4.1 FDI trends
Utilizing fDiMarkets.com, an analysis was done on the global FDI activity of the agricultural sector (figure
2 & table 4) under fDiMarkets.com, the search category is called “Food and Tobacco,” which best
encompassed agroindustry activity. The typical FDI project profile in the agricultural industry brings about
40.0 million USD in capital expenditures, creating an average of 172 jobs. Between 2012 and 2016, FDI in
this sector invested 96.0 billion USD and created over 400,000 jobs, globally. 22
Figure 2-3: Top Source and Destination Countries of Agricultural FDI
Source: Investment Consulting Associates – ICA (2017), based on fDiMarkets.com data
Most FDI projects in the agricultural sector note market growth potential as the principal motive behind
the project. Other motivations include proximity to markets or customers, as well as regulations and
business climate. To a lesser degree, skilled workforce and infrastructure and logistics are influential.
Table 4. Main FDI projects span subsectors
INDUSTRY SUB SECTOR 2012 2013 2014 2015 2016 TOTAL
FRUITS, VEGETABLES AND SPECIALTY FOODS 9.93% 12.98% 14.69% 9.46% 10.76% 11.65%
DAIRY PRODUCTS 11.32% 10.43% 11.07% 8.82% 8.61% 10.03%
SUGAR AND CONFECTIONARY PRODUCTS 12.24% 8.51% 8.59% 9.89% 9.20% 9.61%
GRAINS AND OILSEED 11.09% 11.49% 9.54% 7.31% 8.22% 9.49%
ALL OTHER FOOD 6.93% 7.23% 7.82% 9.46% 10.96% 8.53%
Source: fDiMarkets.com (2017)
22 Based on an analysis done on the global activity of the agricultural sectors under the database fDimarkets.com. The search category is called “Food and Tobacco,” which best encompassed agroindustry activity.
50
100
2012 2013 2014 2015 2016
Nu
mb
er o
f Pro
ject
s
Top Five Source Countries of Agricultural FDI
France Japan Switzerland
Germany United States
20
40
60
80
2012 2013 2014 2015 2016
Top 5 Destination Countries of Agricultural FDI
United States China UK India Russia
Figure 2. Top Source and Destination Countries of Agricultural FDI

Investment Consulting Associates (ICA) 19 CFI Haiti Agro-industry Sector
4.2 Trends and strategic challenges for Haiti by demand side drivers
Drivers (brakes) by
market share:
DEMAND
Changes and Trends Strategic Challenges of Action for Haiti
Demographic
growth and
transformations
− Low population growth and "aging" of the population in several major markets; Europe, Japan, China, Russia
− Strong population growth in others (Africa) = new potential importing markets
Demand is very significant in the major USA-
Canada and European Union markets. Haitian
exporters will have to offer products that respond
well to concerns:
− Groups to which purchasing power moves;
− Groups that influence behaviour; and
− Categories of persons making culinary and purchasing decisions in households.
Growth and
economic
transformations
− Significant growth in per capita income and emergence / expansion of the middle class: China, India and various other East Asian countries; Various countries in sub-Saharan Africa;
− Increasing urbanization - Megacities
The diversification policy should lead to the
establishment or development of trade
agreements with countries / areas which
demonstrate and should continue to be
economically dynamic with a significant increase
in their imports
Values, tastes,
preferences and
ways of life
North America and the European Union:
Differentiation of products / niches:
Healthy living concerns – Healthy diet:
− Fight against obesity;
− Concerns about the control of hypertension (cardiac risk), insulin (diabetes): balanced diet, control of fats, sugar, salt in products
− Increase in prevalence rates of hypersensitivity to allergens and precautions to avoid them: information required, products guaranteed "without".
Environmental concerns:
− Strong rise of "bio / organic" products;
− Concern for non-polluting inputs and processes (water, air, and climatic impact) and non-destructive / natural environments;
− Fighting waste of scarce resources and pollution by consumption choices and purchasing behaviour: limiting the energy consumed in the value chain (production, transport and carbon emissions, distribution); Limiting the external effects of "joint products" to production processes: control of methane emissions by livestock and agriculture (rice cultivation)
− Packaging: recyclable / lightweight packaging Ethical concerns:
− Ethical treatment of animals (gavage, slaughter techniques, breeding) and the rise of vegetarianism;
− Waste of food. Socio-ethical concerns:
− The fight against poverty, unacceptable working conditions (in particular child labor), inequity with regard to gender.
− Consumer is knowledgeable, wants to know, to verify and have confidence in information on the origin of food, exact composition, production processes, environmental impact.
− Need to inform the buyers / consumers - useful for communication / promotional investment.
− Increasingly, the "savvy consumer" and "foodies" differentiate basic products (ex: origin and "raw" cocoa, coffee, beef labels, etc.) and therefore seek variety and differences: importance of products positions and the brand of origin.
− There is a challenge to respect the regulatory requirements of importing countries, to be able to produce / manufacture products that meet the requirements associated with the trends identified: imperative challenges in the inputs used, processes, etc... in relation to the characteristics and expectations of the international application.
− Poultry and fish are better aligned than beef on trends in the more developed countries.
− Livestock production: methane should be reduced and captured by altering manure management strategies at livestock operations or animal feeding practices. Industry must be encouraged to do so. Methane reduction can be used to promote their products.

Investment Consulting Associates (ICA) 20 CFI Haiti Agro-industry Sector
FDI drivers
According to a brief literature review and on the opinions expressed during the interviews with private
and public sectors, the most relevant explanatory factors of localization decisions for foreign investment
in agribusiness can be broken down into three categories of location factors:
› First, those related to access to the resources; It can be mainly for the firm to integrate and secure
upstream into its globalized supply chain the regular access to a key agricultural input that plays an
important role in the differentiation of its product. In this case, the key locating factors are those
which make the production area a place with an appropriate combination that is sufficiently distinct
from climatic features, soils, geomorphology of available land, and hydrology, to obtain an
agricultural product advantageously differentiated, and that is little or moderately substitutable
because of this provenance (e.g.: Haiti’s vetiver and francisque mangoes);
› Second, those related to market access. In this case, the agribusiness firm must: (a) ensure access
to the input / agricultural product in the vicinity of the markets it serves; or (b) whose provenance
allows the company to benefit from entry advantages via preferential tariffs and quotas. Therefore,
because of the generally perishable and bulky characteristics of agricultural products, many agro-
industrial plants and smaller-scale agro-processing enterprises tend to be located close to their
major sources of raw materials. Consequently, their immediate socio-economic impacts tend to be
exerted in rural areas.
› Thirdly, for the two preceding categories of factors to be fully decisive, they must be reinforced by
reception and operation conditions sufficiently favorable and competitive for the foreign investors.
In this case, a decisive factor may be access to land tenure and the legal property protection, but
also the business environment such as the quality of the logistical infrastructure, applicable taxes,
etc.

Investment Consulting Associates (ICA) 21 CFI Haiti Agro-industry Sector
Competitiveness of Haiti in the Sector
6.1 Haitian agriculture sector description
Haitian agriculture contributes more than 25% to the formation of GDP (MARNDR - FINTRAC). According
to data available in February 2010, agriculture is practiced by just over one million small farms (Ministry
of Agriculture, Natural Resources and Rural Development - MARNDR / FAO 2010) that have between 1
and 5 ha - an average of less than 1.5 ha of land. Land insecurity is present throughout the country.
Haiti has a diversity of ecological environments including humid and very humid mountains (47%), humid
and semi-humid plains and plateaus (19%), arid and semi-arid plains (15%), arid mountains and semi-arid
areas (16%), and irrigated plains (2%). The country is predominantly mountainous with more than half of
the land having slopes greater than 40°. In 201423, the agricultural area was evaluated at 1.84 million
hectares, with 1.07 million corresponding to arable land, of which about 97,000 is irrigated.
The workforce in the sector is valued at 1.75 million people, or 38.1% of the total labour force (4.594
million)24 (CIA World Factbook).
Haiti is classified as a Low-Income Food-Deficit Countries (LIFDC) by the FAO in 2016.25 Three-quarters of
Haitians live on less than 2 USD per day, and half of the population earns less than 1 USD per day.26 59%
of Haitians live in poverty and close to 25% in extreme poverty. 27
Haiti relies heavily on imported food, with 50% of the country's food needs. Food prices have always been
on the rise since the end of 2010.28 This increase has led to an overall loss of purchasing power for the
majority of Haitians. Cereals are a staple of the Haitian diet, and rice is eaten at almost every meal. It is
often cooked with beans and served with a sauce.
Poor agricultural productivity and urban sprawl on arable land pose additional challenges for the rural
populations of Haiti. Only one out of five farmers is able to subsist solely from agriculture on their own
land.
According to FAOSTATS data in 2014, we can identify 61 categories of agricultural products (by item code)
for which the total gross production value reached 1,617 million international dollars. 94% of the total
gross production value in 2014 was generated by 25 categories of products and nearly 71% by 10
categories: mangoes, mangosteens and guavas, bananas, indigenous cattle meat, yams, avocados,
cassava, dried beans, plantains and others, indigenous pig meat, and finally sugar cane (table 5). Over the
decade 2004-2014, all of the 25 categories of products have known an increase in quantity produced
23 FAOSTATS, Land use statistics.
24 “The World Factbook”, Haiti, Economy section, CIA.
25 http://www.fao.org/countryprofiles/lifdc/en
26 World Food Program. http://www1.wfp.org/countries/haiti
27 World Food Program. ”WFP Haiti Country Brief”, May 2017.
28 World Food Program. http://www.wfp.org/node/3478

Investment Consulting Associates (ICA) 22 CFI Haiti Agro-industry Sector
except for four categories: plantains and others (which have experienced a slight decline of 4.7% in ten
years, due specifically to the fall between 2009 and 2014), fresh vegetables (-33.1%), indigenous goat
meat (-7.5%) and indigenous chicken meat (-2.8%).
However, the main contributors to the gross production value in 2014 are not necessarily those with the
greatest production growth. Indeed, some generate a lower gross production value but reveal a
substantial growth and has more than doubled their production. These are, by order of importance of the
production’s growth: pigeon peas (261.6%), cocoa beans (204.9%), dried beans (195.9%), sweet potatoes
(191.4%), mangoes, mangosteens, guavas (160.5%), yams (139.5%), lemons and limes (121.5%), oranges
(111.8%), and avocados (106.5%).
More recently, for the period of 2009-2014, the products with the most important growth are lemons and
limes (82.2%), cocoa beans (74.5%), sweet potatoes (73.3%) avocadoes (71.8%) and groundnuts with
shells (71.7%).
Table 5. Haiti - Gross Production Value, National Production and Change in Production over 2004-2014 25 most important products in terms of Gross Production Value in 2014
Source: FAOSTATS for the data on the gross production value and the production. Notes: (1) The last data available was for 2013
In 2014, almost the entire area harvested (98,7%) was distributed among 25 crops (table 6). Maize is the
main crop with 22.9% of the total harvested area, followed by dried beans (9.2%), sorghum (8.1%), cassava
(8.1%) and pigeons peas (6.5%). These five crops represent more than the half of the total harvested area
(54,9%).
Item
Code
Item
Constant2004-
2006;Million
Int.$
In%of
total
Cumulativ
e
percentage
RANKinterm
ofGross
production
value2014
2004-2009 2009-2014 2004-2014 2009-2014 2004-2014
571 Mangoes,mangosteens,guavas 405.83 25.1% 25.1% 1 677.3 63.7% 59.2% 160.5% 7 5
486 Bananas 141.62 8.8% 33.9% 2 502.9 12.1% 49.6% 67.6% 8 12
944 Meatindigenous,cattle(1) 124.71 7.7% 41.6% 3 46.5 1.8% 6.9% 8.8% 17 20
137 Yams 121.57 7.5% 49.1% 4 476.7 47.1% 62.9% 139.5% 6 6
572 Avocados 67.27 4.2% 53.2% 5 97.1 20.2% 71.8% 106.5% 4 9
125 Cassava 64.24 4.0% 57.2% 6 615.0 32.2% 36.8% 80.9% 10 10
176 Beans,dry 60.51 3.7% 61.0% 7 100.6 125.6% 31.2% 195.9% 12 3
489 Plantainsandothers 55.07 3.4% 64.4% 8 266.8 30.2% -26.8% -4.7% 25 23
1055 Meatindigenous,pig(1) 50.72 3.1% 67.5% 9 33.0 0.0% 0.0% 0.0% 20 21
156 Sugarcane 49.76 3.1% 70.6% 10 1,515.5 5.7% 36.5% 44.3% 11 15
197 Pigeonpeas 48.10 3.0% 73.6% 11 90.0 148.6% 45.4% 261.6% 9 1
56 Maize 45.44 2.8% 76.4% 12 320.7 53.4% 5.6% 62.0% 18 13
27 Rice,paddy 40.03 2.5% 78.8% 13 143.7 22.2% 12.0% 36.8% 15 16
122 Sweetpotatoes 38.52 2.4% 81.2% 14 510.0 68.2% 73.3% 191.4% 3 4
656 Coffee,green 37.85 2.3% 83.6% 15 35.2 29.3% -6.1% 21.5% 22 18
463 Vegetables,freshnes 22.68 1.4% 85.0% 16 120.4 -19.3% -17.2% -33.1% 24 25
619 Fruit,freshnes 20.97 1.3% 86.3% 17 60.1 11.3% 7.9% 20.1% 16 19
882 Milk,wholefreshcow 20.27 1.3% 87.5% 18 65.0 25.7% 16.1% 46.0% 14 14
497 Lemonsandlimes 19.41 1.2% 88.7% 19 49.0 21.6% 82.2% 121.5% 1 7
83 Sorghum 18.84 1.2% 89.9% 20 122.5 27.9% 0.8% 28.9% 19 17
242 Groundnuts,withshell 16.66 1.0% 90.9% 21 36.9 -2.3% 71.7% 67.8% 5 11
661 Cocoa,beans 15.20 0.9% 91.9% 22 14.6 74.7% 74.5% 204.9% 2 2
1032 Meatindigenous,goat(1) 13.27 0.8% 92.7% 23 5.6 7.3% -13.8% -7.5% 23 24
1094 Meatindigenous,chicken(1) 11.18 0.7% 93.4% 24 7.7 0.1% -2.9% -2.8% 21 22
490 Oranges 10.64 0.7% 94.0% 25 55.1 63.9% 29.2% 111.8% 13 8
Grossproductionvaluein2014 Variationovertheperiod Positionningaccording
totheproduction's
growth
Production
in2014
(thousand
oftons)

Investment Consulting Associates (ICA) 23 CFI Haiti Agro-industry Sector
From 2009 to 2014, the cultivated land has increased the most for lemons and limes (85.4%), avocados
(75.3%), cocoa beans (74.3%), mangoes, groundnuts with shell (68.6%), mangosteens and guavas (59.7%),
and bananas (49.6%). For the five major crops, the area harvested has also increased since 2009.
Table 6. Area harvested in 2014 for the 10 most important products in terms of hectares
Source: FAOSTATS for hectares in 2014 and 2009.
In terms of productivity (figure 3), the average five-year yield between 2000-2004 and 2010-2014 has
increased significantly for five major crops in 201429: sweet potatoes, yams, sorghum, paddy rice and
maize. The production of dried beans, cassava, and green coffee has remained relatively stable over this
decade. Finally, bananas, mangoes, mangosteens and guavas, and pigeon peas were the crops for which
there was a decline in yield.
Figure 3: Average five-year yield by major crops in 2014
- (Ton per hectare) Source: Calculation based on yield data from FAOSTAT.
29 Based on the hectares harvested in 2014.
Ha-2014 In%of
total
Cumulative% Rank
56 Maize 387,438 22.9% 22.9% 1 2.2%
176 Beans,dry 156,276 9.2% 32.1% 2 31.6%
83 Sorghum 137,872 8.1% 40.2% 3 14.9%
125 Cassava 137,271 8.1% 48.3% 4 35.7%
197 Pigeonpeas 110,559 6.5% 54.9% 5 28.6%
571 Mangoes,mangosteens,guavas 89,762 5.3% 60.2% 6 59.7%
122 Sweetpotatoes 76,618 4.5% 64.7% 7 2.2%
486 Bananas 76,279 4.5% 69.2% 8 49.6%
656 Coffee,green 68,114 4.0% 73.2% 9 -5.9%
27 Rice,paddy 56,631 3.3% 76.6% 10 -1.5%
137 Yams 53,872 3.2% 79.7% 11 17.0%
242 Groundnuts,withshell 42,154 2.5% 82.2% 12 68.6%
195 Cowpeas,dry 41,525 2.5% 84.7% 13 -2.8%
489 Plantainsandothers 39,076 2.3% 87.0% 14 2.8%
661 Cocoa,beans 29,862 1.8% 88.8% 15 74.3%
149 Rootsandtubers,nes 25,474 1.5% 90.3% 16 27.4%
156 Sugarcane 24,534 1.4% 91.7% 17 32.6%
463 Vegetables,freshnes 24,225 1.4% 93.1% 18 -10.5%
789 Sisal 18,730 1.1% 94.2% 19 14.9%
572 Avocados 16,500 1.0% 95.2% 20 75.3%
289 Sesameseed 15,930 0.9% 96.2% 21 6.9%
490 Oranges 12,601 0.7% 96.9% 22 26.8%
497 Lemonsandlimes 11,123 0.7% 97.6% 23 85.4%
619 Fruit,freshnes 10,511 0.6% 98.2% 24 -13.6%
249 Coconuts 9,641 0.6% 98.7% 25 5.5%
Areaharvested Variation
over2009-
2014
ItemItem
Code
6.66
0.65
4.41
0.520.74
7.66
0.87
2.11
0.74
3.13
5.59
6.59
0.65
4.45
0.520.82
7.55
0.79
2.52
0.89
6.23
8.46
0
1
2
3
4
5
6
7
8
9
Bananas
Beans,dry
Cassava
Coffee,green
Maize
Mangoes,mangosteens,guavas
Pigeonpeas
Rice,paddy
Sorghum
Sweetpotato
es
Yams
Ton/ha
2000-2004 2010-2014
Investment Consulting Associates (ICA) 24 CFI Haiti Agro-industry Sector
6.1.1 Haitian agricultural imports and exports
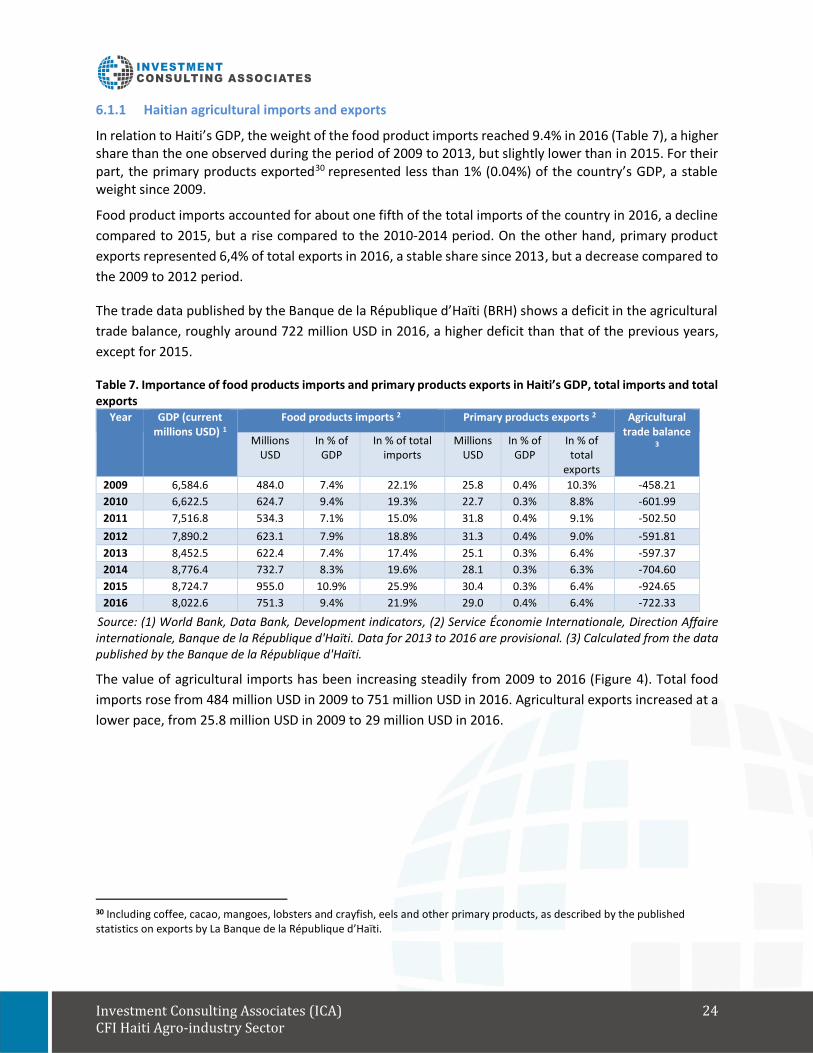
In relation to Haiti’s GDP, the weight of the food product imports reached 9.4% in 2016 (Table 7), a higher share than the one observed during the period of 2009 to 2013, but slightly lower than in 2015. For their part, the primary products exported30 represented less than 1% (0.04%) of the country’s GDP, a stable weight since 2009.
Food product imports accounted for about one fifth of the total imports of the country in 2016, a decline
compared to 2015, but a rise compared to the 2010-2014 period. On the other hand, primary product
exports represented 6,4% of total exports in 2016, a stable share since 2013, but a decrease compared to
the 2009 to 2012 period.
The trade data published by the Banque de la République d’Haïti (BRH) shows a deficit in the agricultural
trade balance, roughly around 722 million USD in 2016, a higher deficit than that of the previous years,
except for 2015.
Table 7. Importance of food products imports and primary products exports in Haiti’s GDP, total imports and total exports
Year GDP (current millions USD) 1
Food products imports 2 Primary products exports 2 Agricultural trade balance
3 Millions USD
In % of GDP
In % of total imports
Millions USD
In % of GDP
In % of total
exports
2009 6,584.6 484.0 7.4% 22.1% 25.8 0.4% 10.3% -458.21
2010 6,622.5 624.7 9.4% 19.3% 22.7 0.3% 8.8% -601.99
2011 7,516.8 534.3 7.1% 15.0% 31.8 0.4% 9.1% -502.50
2012 7,890.2 623.1 7.9% 18.8% 31.3 0.4% 9.0% -591.81
2013 8,452.5 622.4 7.4% 17.4% 25.1 0.3% 6.4% -597.37
2014 8,776.4 732.7 8.3% 19.6% 28.1 0.3% 6.3% -704.60
2015 8,724.7 955.0 10.9% 25.9% 30.4 0.3% 6.4% -924.65
2016 8,022.6 751.3 9.4% 21.9% 29.0 0.4% 6.4% -722.33
Source: (1) World Bank, Data Bank, Development indicators, (2) Service Économie Internationale, Direction Affaire internationale, Banque de la République d'Haïti. Data for 2013 to 2016 are provisional. (3) Calculated from the data published by the Banque de la République d'Haïti.
The value of agricultural imports has been increasing steadily from 2009 to 2016 (Figure 4). Total food
imports rose from 484 million USD in 2009 to 751 million USD in 2016. Agricultural exports increased at a
lower pace, from 25.8 million USD in 2009 to 29 million USD in 2016.
30 Including coffee, cacao, mangoes, lobsters and crayfish, eels and other primary products, as described by the published statistics on exports by La Banque de la République d’Haïti.

Investment Consulting Associates (ICA) 25 CFI Haiti Agro-industry Sector
Figure 4. Evolution of agricultural imports and exports from 2009 to 2016
Source: Service Économie Internationales, Direction Affaire internationale, Banque de la République d'Haïti. Note: Provisional data for 2013 to 2016
Haiti imports mainly basic foodstuffs for food security such as rice, sugar, oil, prepared food, sugar, chicken meat, wheat flour.
According to FAOSTAT, the top 10 imported products accounting for 76.6% of total value of agricultural
imports in 2013 were: rice - total (wholly milled rice), representing 22.9% of the total food import value,
palm oil (11.9%), prepared food (8.2%), centrifugal raw sugar (6.3%), chicken meat (6.1%), wheat flour
(4.8%), evaporated whole milk (3.9%), pastry (3.3%) and wheat (2.9%).
Apart for wheat, the import value has increase for all of these products from 2004 to 2013 (table 8).
Table 8. Top 10 imported food products in 2013 – Import value and imported tons Item code
Item Imports in 2013 Variation of imports value over the period
Value in millions
$US
In % of
total
Cumulative percentage
RANK in term of import value in
2013
Tons (thousands)
2004-2009
2009-2013
2004-2013
30 Rice -total (milled rice equivalent) 277.9 22.9% 22.9% 1 424.5 76.1% 49.1% 162.5%
257 Oil, palm 144.5 11.9% 34.8% 2 111.7 89.0% 92.7% 264.2%
1232 Food prep nes 100.0 8.2% 43.0% 3 30.8 27.6% 325.3% 442.5%
162 Centrifugal raw sugar 76.6 6.3% 49.3% 4 137.5 162.0% 81.9% 376.6%
1058 Meat, chicken 74.7 6.1% 55.5% 5 70.3 118.8% 154.2% 456.2%
237 Oil, soybean 74.7 6.1% 61.6% 6 51.2 171.6% 69.7% 360.8%
16 Flour, wheat 58.6 4.8% 66.4% 7 97.3 -55.7% 605.5% 212.3%
894 Milk, whole evaporated 47.7 3.9% 70.3% 8 31.2 54.1% 44.0% 122.0%
22 Pastry 40.5 3.3% 73.7% 9 21.9 117.2% 543.4% 1297.7%
15 Wheat 35.0 2.9% 76.6% 10 85.0 61.8% -40.9% -4.4%
Source: FAOSTATS for the data on import value and tons.
0
200
400
600
800
1,000
1,200
2009 2010 2011 2012 2013 2014 2015 2016
MillionsUSD
Foodproductsimports Primaryproductsexports

Investment Consulting Associates (ICA) 26 CFI Haiti Agro-industry Sector
Note: (1) This category includes both crop and livestock products. Inter alia: homogenized composite food preparations; soups and broths; ketchup and other sauces; mixed condiments and seasonings; vinegar and substitutes; yeast and baking powders; stuffed pasta - whether or not cooked; couscous; and protein concentrates. Including turtle eggs and birds' nests.
6.1.2 Haitian import market vs local market
There is an important difference between the import value chain (VC) and the local production VC.
› Import market
Imports of some products (such as rice, oil or wheat flour) are the major source of product supply
in the local markets. This distinction becomes obvious with the observed largest gains made by a
few major importers of commodities. Importers then market to wholesalers and distributors who
normally market only in the import niches. The exceptions to this chain are the few local
distributors called “Madam Sara” 31 or “Madame Sara” who distributed imported and domestic
food products in Haiti. They constituted a critical link between the rural Haitian food producers
and urban consumers. Retailers sell a mix of imported and local products.
There are between 450 and 500 small rice mills in the country. More than 80% of the plants are
located in the Lower Artibonite region, where 60% of the local rice is produced. 45 corn mills are
located near the markets.
There are a small number of major food importing companies such as Gilbert Bigio Group
(including HUHSA), Deka Group, Acra Industries and HUNASA. The Moulins d'Haïti acts as the main
importer of wheat.
› Local market
The domestic market is a significant market in several categories of agricultural products, namely
fruits and vegetables, food crops, and coffee. The traditional organization of value chains in the
food products - the “Madames Saras” system32 - is associated with lower overall productivity
(particularly because of losses due to inadequate logistics) and low small rural producers inclusion.
After epidemics affecting pigs (a very common production among small farmers) and chickens
decimated the livestock, the meat supply on the domestic market is widely imported 33 . A
noteworthy start-up has begun, however, in the poultry industry with international investments
from Jamaica (Haiti Broilers).
Many actors are involved in the marketing of agricultural products on the local market (figure 5).
Producers are the starting point. The lack of warehousing capacity and the urgent cash needs of
small farmers force them to sell their produce immediately after the harvest, when prices are at
31 Typical name in Haitian-Creole of female Haitians marketers.
32 Madame Saras who travel from place to place gathering agricultural products into marketable quantities.
33 Pork production was previously traditionally very common among small farmers and important for food security and income. Note that eggs are also partly imported from Dominican Republic.

Investment Consulting Associates (ICA) 27 CFI Haiti Agro-industry Sector
the lowest level. There are thousands of intermediaries collecting and distributing agricultural
products across the country.
These actors include:
- Madam Saras, local or rural, who buy from producers in small markets to sell to urban merchants.
With limited purchasing power, these rural intermediaries travel short distances to buy and sell
agricultural products;
- Madam Saras, who buy large stocks in the most accessible markets to sell in primary consumption
centers in Port-au-Prince or Cap Haïtien;
- The retailers who buy goods from wholesalers and the Madam Sara in order to distribute to
consumers. Many small traders operate in the informal sector as retailers;
- In addition to these intermediaries, carriers, deposit owners, and cargo handlers (who unload, load
and transport goods) also play an important role in the distribution of goods across the country.
Figure 5. Categorization of market structures in Haiti
Source: Daniel Boutaud & Carlos Puig (2015)
6.1.3 Haitian agricultural exports
The traditional export value chains are characterized by the prevalence of oligopsony structures with little
or no inclusion of small producers, which are poorly organized and lacking bargaining power.
Agricultural exports are highly concentrated in five products: mangoes, mangosteens and guavas,
essential oils, and cocoa beans. These five main products account for 83.0% of the total value of
agricultural exports of the country in 2013 (table 9). From 2004 to 2013, the first two products have known
an important export value growth while the export value of cocoa beans remained stable over this period.
Finally, the export value of green coffee and prepared fruit was on a downward slope during this period.
Source:©DanielBoutaud&CarlosPuig

Investment Consulting Associates (ICA) 28 CFI Haiti Agro-industry Sector
Table 9. Top eight exported food products in 2013 – Export value and exported tons34 Item Code
Item Exports in 2013 Variation of exports value over the period
Value in millions
$US
In % of total
Cumulative percentage
RANK in term of export value
in 2013
Tons (thousands)
2004-2009
2009-2013
2004-2013
571 Mangoes, mangosteens, guavas
13.6 36.5% 36.5% 1 10.2 62.1% 24.9% 102.5%
753 Oil, essential nes 12.7 34.3% 70.8% 2 0.1 7.0% 49.0% 59.5%
661 Cocoa beans 4.5 12.2% 83.0% 3 2.1 108.8% -51.7% 0.9%
656 Coffee, green 1.8 4.9% 87.9% 4 0.4 -19.9% -31.2% -44.9%
634 Beverages, distilled alcoholic
1.4 3.7% 91.6% 5 0.2 50.8% -7.2% 40.0%
623 Fruit, prepared nes 0.91 2.5% 94.1% 6 0.5 -20.8% -48.4% -59.2%
1293 Raw materials 0.70 1.9% 96.0% 7 -75.9% 71.4% -58.8%
603 Fruit, tropical fresh nes
0.54 1.5% 97.4% 8 0.5 142.5% 38.7% 236.3%
Source: FAOSTATS for the data on export value and tons.
The main export partner for Haiti's products is the United States, which received around 85.7% of the
total exports in 201535. For 2016, edible fruits and nuts (essentially mangoes) accounted for 34% of the
total value of agricultural products imported by the USA from Haiti36, followed by essential oils (27%),
beverages, spirits and vinegar37 (17.1%), fish and crustaceans (6.9%) and cocoa and cocoa preparations
(5.1%). These five groups of products accounted for 90% of all exports towards the United States.
› Agribusinesses
Prior to the earthquake, the formal agro-industrial sector was located mainly in the Port-au-Prince
region and consisted of 12 mango exporters, four essential oil producers/exporters, and five agri-
food companies. In recent years, farmers’ and cooperatives’ associations supported by NGOs have
undertaken initiatives such as the processing of milk, fruit, coffee and honey. Currently, about 12
mini dairies sell milk under the label "Let Agogo". Their production has increased over the last five
years, with the technical support of the NGO Veterimed. The fruit processing industry counts less
than 10 small businesses producing jams and jelly.
6.2 Haiti vs. Dominican Republic Positioning
6.2.1 The Dominican Republic (DR)
The Dominican Republic (DR) is the second largest country in the Caribbean, with a population of approximately 10.6 million38. The Dominican economy has been one of the fastest growing economies in Latin America and the Caribbean over the past 25 years39. For the period of 2012-2016, the average
34 The lines highlighted in blue correspond to the products with the highest growth over the 2004-2013 period.
35 “The World Factbook”, Haiti, Economy section, CIA.
36 Source: U.S. Census Bureau Economic Indicators Division USA Trade Online, U.S. Import and Export Merchandise trade statistics.
37 Essentially beers and alcoholic preparations.
38 “The World Factbook”, Dominican Republic, CIA. Estimate as of July 2016.
39 The World Bank in Dominican Republic. Overview.

Investment Consulting Associates (ICA) 29 CFI Haiti Agro-industry Sector
annual GDP growth rate was 5.8%, five times more than the one observed for the whole Latin America and Caribbean region (1.1%)40.
The DR agricultural sector's contribution to total GDP grew by 3.5% in 2015 (compared to 2014), propelled
by a considerable growth in non-traditional and organic crops 41 . The sector is comprised of diverse
activities, which can be divided in two main categories: production for local consumption, and export-
oriented production. Most of the agricultural activities focus on staple goods for local consumption such
as plantains, potatoes, yucca, grains (beans, rice), fruits (mangoes, bananas, pineapples, coconuts) and
vegetables (tomatoes, lettuce, etc.). With regards to animal products, the country has a significant
production of eggs, milk, poultry, pork meat, and beef.
The tourism industry is very strong and dynamic, generating a large demand for agri-food products of
many kinds, both locally-produced and imported. The National Hotels and Restaurants Association
(ASONAHORES) estimates the annual consumption of food and beverage of the tourism industry at over
500 million USD. This level is expected to keep increasing with more hotels being built.
The Dominican Republic has a deficit in its agriculture balance for the 2003-2013 period (figure 6).
Figure 6. Agricultural trade balance – Dominican Republic – 2003-2013
Source: FAOSTAT. Based on data on export value and import value for crops and livestock products.
Several multinational enterprises have had a strong presence in the DR market for many years, either
through direct investment in production facilities, corporate distribution offices, or authorized
distributors. Among others, some of these brands are Quaker, Kellogs, Kraft, McCain, Heinz, Goya, Nestlé,
and Président.
40 World Bank. From the data extracted from World Development Indicators DataBank.
41 Agri-Food Sector Profile - Dominican Republic, May 2016, Agriculture Canada and Agri-Food Canada.
-800
-700
-600
-500
-400
-300
-200
-100
02003 2004 2005 2006 2007 2008 2009 2010 2011 2012 2013
Millions$U
S

Investment Consulting Associates (ICA) 30 CFI Haiti Agro-industry Sector
According to UNCTADstat, the total food item imports were estimated at 2.7 billion USD in 2016. Over the
2006-2016 decade, both food imports and exports increased on a regular basis (figure 7), and the country
has a permanent negative food trade balance.
Figure 7. Food exports and imports – Dominican Republic – 2006-2016
Source: UNCTADstat (2016). All figures for Dominican Republic are estimated. The category corresponds to all food items (SITC 0+1+22+4).
The United States and the European Union (both of which have Free Trade Agreements with the DR) are
the DR’s main suppliers. The US alone exported 1 billion USD of agri-food products to the DR in 201642. The
main imported agricultural products by the DR were, in order of importance: cereals, milk and dairy
products, animal or vegetable fats and oils, meat and edible offal, frozen fish and crustaceans. A big
proportion of the products imported by the DR are not related to food security: they are rather expensive
products that can be related to living standards and to international tourism in the country.
The export-oriented agricultural production is dominated by items such as cocoa beans and its by-
products, coffee beans, coconuts, mangoes, spices, fruits, vegetables, and herbs. Two very important
components are greenhouse production and organic production, both of which are organized in
clusters. The DR is the world’s largest exporter of organic bananas and organic cocoa, and also exports a
considerable amount of organic coffee and tropical fruits.
In 2015, Haiti was the main export market of the DR43 for livestock products, vegetables, and fruits.
- Livestock product exports include mainly fresh and chilled chicken meat (roosters and hens) for
more than 5.47 million USD (96% of the DR’s total exports for this product), live roosters and hens
for 6.34 million USD (96.6% of total exports for this product) and eggs for more than 3.9 millions
USD (96% of the DR’s total exports for this product).
- Vegetables and fruits include cabbage (99% of DR exports), carrots (98.3%), beets (77.5%),
summer squash or chayote (60%) and plantains (88% of the total exports for more than 4.69
million USD).
42 US Census Bureau, Economic Indicators Division.
43 Centro de Exportación e Inversión de República Dominicana (CEI-RD). http://www.agricultura.gob.do/estadisticas/exportaciones-agropecuarias-totales-y-por-producto/productos-pecuarios/
0.5
1.0
1.5
2.0
2.5
3.0
2006 2007 2008 2009 2010 2011 2012 2013 2014 2015 2016
Billio
ns$U
S
Exports Imports

Investment Consulting Associates (ICA) 31 CFI Haiti Agro-industry Sector
In terms of fishery products, Haiti had sustained growth during the 2003-2013 period, from 6,300 to
16,550 tons (figure 8). For its part, the DR has known a decrease in catches. Per capita consumption
remains at 4.1 Kg in Haiti and at 10.8Kg in the DR.
Figure 8. Catches of fish in Haiti and the Dominican Republic – 2003-2013
Source: FAOSTAT. Based on data on export value and import value for crops and livestock products
6.2.2 The Dominican Republic’s agribusiness organic positioning
The Dominican Republic has fully implemented organic standards, regulations and policies.44 In 2015, the country had a total of 163,936 hectares (ha) of organic agricultural land (including in-conversion areas), representing 7% of total agricultural land. The organic sector counts 36,463 producers and 152 organic processors.
In terms of the organic area, the DR occupies the sixth rank in Latin America and Caribbean region, behind
Argentina (3,073,412 ha), Uruguay (1,307,421 ha), Brazil (750,000 ha), Mexico (584,093 ha) and Peru
(327,245 ha). The DR has the first rank in the Caribbean.
The main organic products of DR are: › Cocoa - The DR is the world leader of organic cocoa with a total of 120,315 ha planted (79.7%
organic share). It is by far the country with the largest organic area in Latin America and the Caribbean, followed by Peru (25,000 ha) and Panama (14,000 ha).
› Bananas - Organic bananas are the key tropical fruit grown in this region (almost 52,000 ha, 2.4% of the regional banana area) followed by avocados (42,115 ha). The DR also has the largest organic banana area (25,000 ha) followed by Ecuador (1,000 ha). These two countries represent 80% of the regional organic banana area. The DR exports almost all of its organic banana production to Europe, specifically to Germany.
› Coffee - The organic area for coffee in the DR is 1.774 ha (2.4% organic share). › Citrus fruit - The area has 1,064 ha (4.4% organic share).
44 The World of Organic Agriculture. Statistics & Emerging Trends 2017.
0
2
4
6
8
10
12
14
16
18
20
2003 2004 2005 2006 2007 2008 2009 2010 2011 2012 2013
Thousandtons
Hai
DominicanRepublic

Investment Consulting Associates (ICA) 32 CFI Haiti Agro-industry Sector
The DR is a major organic tropical and subtropical fruit producer and exporter with a total of 30,000
certified hectares, mainly with bananas (27% organic share). The country is classified as the 4th largest
organic producer behind Kenya (88,516 ha), Mexico (57,000 ha), and Madagascar (47,000 ha).
Finally, the DR has 11,055 certified organic beehives.
The DR continues to consolidate its position as a leading producer and exporter of organic farm products.
The Center for Export and Investment forecasts organic products exports to be around 200 million USD.
6.2.3 Estimates on informal Haitian imports from the DR
The informal Haitian imports from the Dominican Republic are related to Haitians’ daily diets, and include
wheat flour, tomato sauces and ketchup, sweet biscuits, sausages, maize, rice, plantains and rum. Most
of the goods are formally and informally imported, creating an unbalanced competitive playing field for
those companies who play by the rules. The estimated total amount unreported to Haitian customs is
around 634 million USD 45.
45 Les Flux Commerciaux entre Haïti et La Republique Dominicaine - Opportunités pour Accroître la Production Haïtienne, CFI, 2016, page 26,

Investment Consulting Associates (ICA) 33 CFI Haiti Agro-industry Sector
Best Practice Case Study
› Brasserie Nationale d'Haïti, S.A (Heineken) - Smallholder Alliance for Sorghum in Haiti (SMASH)
The Dutch brewer Heineken acquired Brasserie Nationale d'Haïti (BRANA) in 2011, making it part of
Heineken International. BRANA is the foremost brewery and bottler in Haiti and a
top Caribbean beer producer as well. The brewery manufactures the popular “Prestige” beer, one of the
premium American-style lagers produced in the Caribbean. Heineken, as a multinational foreign investor,
believes that Haiti is expected to growth as an emerging market in the near future.
Since the takeover, Heineken has invested more than 100 million USD in the BRANA production plant with
the construction of a second 24.300-square-foot production line to double the plant’s Prestige and other
beverages output.46 Heineken also focuses on growing BRANA’s product portfolio and its malt beverage
“Malta H” non-alcoholic drink brewed from barley for the local market. However, as a result of a lack of
investment in Haiti’s agricultural sector, BRANA’s production of Malta H was traditionally reliant on
imported commodities.
BRANA wants to replace imports by locally producing and purchasing sorghum in place of imported malt.
Sorghum is a cereal widely used in the global beverage industry as the main ingredient in brewing beer
and malt beverages, and is one of the most widely grown crops in Haiti and also plays a role in food
security for the rural population (before rice, sorghum was the main food for the population). The
company has committed to sourcing locally grown sorghum to supply its production operations with the
objective of reducing its imports of malted barley. BRANA estimates needing 5.000 metric tons of high
quality sorghum annually to meet its production targets.
In order to meet its targets, BRANA launched the Smallholder Alliance for Sorghum in Haiti (SMASH)
program to replace imported malt with locally grown sorghum for its Malta H beverage. SMASH seeks to
create a new and efficient value chain for sorghum that is based on international standards. The primary
focus of this project is on the integration of smallholder farmers into the sorghum value chain. The SMASH
program presents an opportunity for farmers to increase productivity and participate as suppliers in the
new market for commercial sorghum.
SMASH’s first harvest was in 2014. After the first harvest USAID (1.7 million USD) and IDB (2.3 million USD)
joined the program with funding to expand sorghum providers to other regions of the country. SMASH
uses a market driven approach to generate income for smallholder farmers by raising yields through
training on good production and processing techniques, testing and introducing new varieties, and
improving access to finance. They intend to improve the quality of local grown crops by promoting better
storage and transport practices, and modernizing the supply chain, thus enhancing domestic food security.
From a broader perspective, SMASH has the potential to create a new industrial value chain, which could
supply other local industries with grain, such as the poultry industry (Haiti Broilers) that will purchase local
sorghum for animal feed once farmers are able to compete with imports on price and quality.
46 Since 1973, have a licence agreement with PepsiCo to bottle their products in Haiti.

Investment Consulting Associates (ICA) 34 CFI Haiti Agro-industry Sector
To date the achievements have been:
› More than 4,000 farmers reached;
› More than 3,000 farmers trained;
› More than 1,000 farmers have sold sorghum to BRANA;
› More than 500 tons of high quality sorghum sold;
› Operating in the South (2 sites), Nippes, East, and Northeast Department to reduce impact risks
of natural disasters.
Lessons from the Heineken-Brana case with "Malta H"
Heineken-Brana shows the case of a major globalized agro-industry operator established in Haiti who saw
a significant market opportunity in the domestic market with a popular product in demand on the national
market, by developing a local supplier chain. Heineken-Brana is moving ahead with a relatively large
investment.
In the value chain, this investment is made in particular upstreams in the development of agricultural
production capacity for sorghum supply to replace malt imports. Sorghum is a key input in the
differentiation of the product (a non-alcoholic beverage), which on the demand side, meets the
preferences of a population that traditionally enjoys the taste. In the meantime, on the supply side, the
choice of a local supply in this key input rather than importing the malt is quite remarkable. In particular,
this shows that a globalized foreign firm with a very good knowledge of the economic context in Haiti and
its obstacles, has assessed from a business perspective that the expected benefits of investing in the
development of local supply outweighed the costs notwithstanding the risks of breaking the supply chain
and the lack of stability and regularity in the quality required for this input.
It can be understood that by having chosen to work with small producer groups for its supply, in a context
of business relationship and sustainable development, Heineken-Brana is in some way little or not
exposed to the main constraints of agricultural investment, as the major risks associated with land
investment in the absence of well-established property rights, recognized and guaranteed.
Heineken-Brana was also able to rely on appropriate incentives (eg MIF / IDB; USAID support) at the initial
stage of R&D and project analysis.
Two more best practice case studies can be found in Appendix 2.
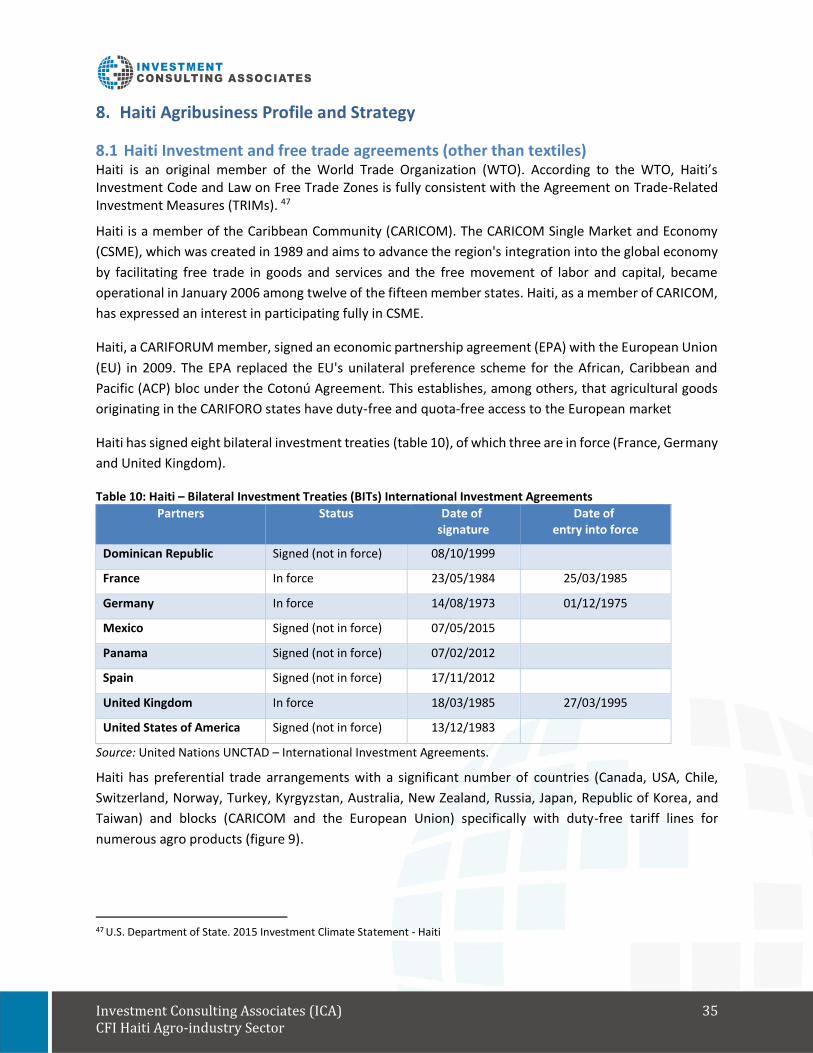
Investment Consulting Associates (ICA) 35 CFI Haiti Agro-industry Sector
Haiti Agribusiness Profile and Strategy
8.1 Haiti Investment and free trade agreements (other than textiles) Haiti is an original member of the World Trade Organization (WTO). According to the WTO, Haiti’s Investment Code and Law on Free Trade Zones is fully consistent with the Agreement on Trade-Related Investment Measures (TRIMs). 47
Haiti is a member of the Caribbean Community (CARICOM). The CARICOM Single Market and Economy
(CSME), which was created in 1989 and aims to advance the region's integration into the global economy
by facilitating free trade in goods and services and the free movement of labor and capital, became
operational in January 2006 among twelve of the fifteen member states. Haiti, as a member of CARICOM,
has expressed an interest in participating fully in CSME.
Haiti, a CARIFORUM member, signed an economic partnership agreement (EPA) with the European Union
(EU) in 2009. The EPA replaced the EU's unilateral preference scheme for the African, Caribbean and
Pacific (ACP) bloc under the Cotonú Agreement. This establishes, among others, that agricultural goods
originating in the CARIFORO states have duty-free and quota-free access to the European market
Haiti has signed eight bilateral investment treaties (table 10), of which three are in force (France, Germany
and United Kingdom).
Table 10: Haiti – Bilateral Investment Treaties (BITs) International Investment Agreements
Partners Status Date of signature
Date of entry into force
Dominican Republic Signed (not in force) 08/10/1999
France In force 23/05/1984 25/03/1985
Germany In force 14/08/1973 01/12/1975
Mexico Signed (not in force) 07/05/2015
Panama Signed (not in force) 07/02/2012
Spain Signed (not in force) 17/11/2012
United Kingdom In force 18/03/1985 27/03/1995
United States of America Signed (not in force) 13/12/1983
Source: United Nations UNCTAD – International Investment Agreements.
Haiti has preferential trade arrangements with a significant number of countries (Canada, USA, Chile,
Switzerland, Norway, Turkey, Kyrgyzstan, Australia, New Zealand, Russia, Japan, Republic of Korea, and
Taiwan) and blocks (CARICOM and the European Union) specifically with duty-free tariff lines for
numerous agro products (figure 9).
47 U.S. Department of State. 2015 Investment Climate Statement - Haiti

Investment Consulting Associates (ICA) 36 CFI Haiti Agro-industry Sector
Figure 9. Haiti – Countries and blocks with free trade or preferential trade arrangements
Source: Centre de facilitation des Investissements (CFI) (2015)
8.1.1 Investment Incentives48
In order to attract investments to certain industries, the Investment Code created a privileged status for
some manufacturers. Eligible firms can benefit from customs, tax, and other advantages under the Code.
Investments that provide added value of at least 35% in the processing of local or imported raw materials
are eligible for preferential status.
The statute allows for a 5 to 15-year income tax exemption. Industrial or crafts-related enterprises must
meet one of the following criteria in order to benefit from this exemption:
› Make intensive and efficient use of available local resources (i.e., advanced processing of existing
goods, recycling of recoverable materials).
› Increase national income.
› Create new jobs and/or upgrade the level of professional qualifications.
› Reinforce the balance of payment positions and/or reduce national economy’s level of
dependency on imports.
› Introduce or extend new technology more appropriate to local conditions (i.e., utilize non-
conventional sources of energy, use labour-intensive production).
› Create and/or intensify backward or forward linkages within the industrial sector.
› Export-oriented production.
48 U.S. Department of State. 2015 Investment Climate Statement - Haiti
Investment Consulting Associates (ICA) 37 CFI Haiti Agro-industry Sector
› Substitute a new product for an imported product, provided that the new product presents a
quality/price ratio deemed acceptable by the appropriate entity, and comprises a total production
cost of at least 60% of the value added in Haiti, including the cost of local inputs used in its
production.
› Prepare, modify, assemble, or process imported raw materials or components for finished goods
that will be re-exported.
› Utilize local inputs at a rate equal or superior to 35% of the production cost.
For investments that match one or more of the criteria described above, the Haitian government provides
customs duty and tax incentives. Companies that enjoy tax exemption status are required to submit
annual financial statements. Fines or withdrawal of tax advantages may be imposed to firms failing to
meet the Code's provisions.
A progressive tax system applies to income, profits, and capital gains earned by individuals. The tax rates
on individuals are as follows (62 HTG/USD as of September 2017):
Income (Gourdes per month) – rate:
› Up to 60,000 – 0%
› 60,001 to 240,000 – 10%
› 240,001 to 480,000 – 15%
› 480,001 to 1,000,000 – 25%
› Over 1,000,000 – 30%
The tax rate on corporate income is 30%.
In 2016, the Bank of the Republic of Haiti (BRH) issued circular exempting compulsory resource reserves
of the banks used to grant credit to the agricultural sector. These measures are aimed at lowering the cost
of the resources used and, consequently, enable banks to allocate credit at a more affordable rate to the
agricultural sector.49
8.2 Foreign trade zones
A law on Free Trade Zones (FTZ) came into force in 2002. It sets out the conditions for operating and
managing economic FTZs, together with exemption and incentive regimes granted for investments in such
zones. The law is not specific to a particular activity, and defines FTZs as geographical areas to which a
special regime on customs duties and controls, taxation, immigration, capital investment, and foreign
trade applies, and where domestic and foreign investors can provide services, imports, stores, produce,
exports, and re-export of goods.
49 BRH. Mise en oeuvre du programme d’incitation aux secteurs productifs dans le cadre de la politique monetaire de la Banque de la Republique d’Haiti.

Investment Consulting Associates (ICA) 38 CFI Haiti Agro-industry Sector
Two free trade zones were granted status in 2003, but only one was operational in northern
Haiti. Between February 2012 and March 2013, three additional free trade zones were established in
Port-au-Prince, bringing the total free trade zone space to over 150 hectares of land.50
FTZs may be private or joint ventures. The law provides the following incentives and benefits for
enterprises located in FTZs:
› Full exemption from income tax for a maximum period of 15 years, followed by a period during
which there is partial exemption that gradually decreases;
› Customs and fiscal exemptions for the import of capital goods and equipment needed to develop
the area, with the exception of tourism vehicles;
› Exemption from all communal taxes (with the exception of a fixed occupancy tax) for a period not
exceeding 15 years; and
› Registration and transfer of the balance due for all deeds relating to purchases, mortgages, and
collateral.
Goods and services sold from free trade zones on the Haitian market are considered to have entered
through Haitian customs and are subject to relevant duties and taxes. The volume of free trade zone
goods allowed for sale in Haitian markets may not exceed 30% of the total production of an enterprise in
the free trade zone.
8.3 National Society of Industrial Parks (SONAPI) SONAPI is an autonomous body governed by public law that administrates two industrial parks:
› The Metropolitan Industrial Park (PIM) - Located northeast of Port-au-Prince (4 km from the Port
and 1 km from the international airport). It was the first industrial park of Haiti, with 56 ha
completely fenced-in; 53 buildings of 30,000 to 50,000 square feet; 23 companies, and about
12,000 jobs.
› The Industrial Park of Caracol (PIC) - With an area of about 252 ha completely fenced-in, it is
operational since October 2012. It is located 30 minutes from the Cap Haïtien airport and 45
minutes from the Dominican Republic. Around nine companies are located there, mainly in the
textile sector.
50 U.S. Commercial Service trade. Haiti Country Commercial Guide

Investment Consulting Associates (ICA) 39 CFI Haiti Agro-industry Sector
Agribusiness Productive Ecosystem
9.1 Public At the level of the Haitian Government, the main entities concerned with agribusiness development are:
› The Ministry of Agriculture, Natural Resources and Rural Development (MARNDR)
A state body responsible for: "Defining the economic sector policy of the Haitian government in
the fields of agriculture, livestock, renewable natural resources and of rural development ", with
ten (10) Departmental Agricultural Departments (DDA) controlling Agricultural Commune Offices
(BACs) placed in municipalities and providing support to local authorities.
› The Unit for the Promotion of Private Investments in the Agricultural Sector (UPISA)
The UPISA is a one-stop shop where entrepreneurs can find all the information needed to start
and develop their businesses. This unit works in collaboration with the CFI to promote and
monitor the follow-up of investments in the agricultural sector.
› Tamarinier Veterinary Laboratory and Food Quality Control (LVCQAT)
The main objective is to ensure food security for all. The laboratory carries out microbiological
and physicochemical sampling of surfaces and foods at the request of professionals, individuals
or the State.
› Ministry of Trade and Industry (MCI)
The MCI's mission is to define, formulate and implement, in partnership with the main economic
players, public commercial and industrial policies to accompany the entrepreneur and the
investor, and to protect the consumer.
› Ministry of Economy and Finance (MEF)
The mission of the MEF is to formulate and conduct the economic, financial, and monetary policy
of the Haitian state in order to promote the growth and socio-economic development of the
country on a sustainable basis.
› The Industrial Development Fund (FDI)
FDI is a financial institution whose mission is to promote industrial development in Haiti by
supporting the financing needs of small and medium-sized enterprises with the potential for job
creation, foreign exchange generation, value-added creation, value-added to local raw materials,
and operating in a way that is non-detrimental to the environment.
› Centre de Facilitation des Investissements (CFI)
The CFI´s main mandate is to promote investments and help potential investors find and take
advantage of opportunities in Haiti. CFI supports investors during all stages of their investment
decision-making process, providing them technical support and administrative assistance. CFI
offers a wide range of support and services to foreign investors.

Investment Consulting Associates (ICA) 40 CFI Haiti Agro-industry Sector
Haiti offers incentive packages for investors as outlined in the Haitian Investment Code of 2002
and in the Free Zone Law of 2002. The CFI is the entry gate to the Inter-Ministerial Commission
for Investments (CII), which is the Governmental body awarding these incentives.
Incentives in the agriculture sector:
- Exemption from payroll taxes and all other direct internal taxes for a period that shall not
exceed fifteen (15) years.
- Exemption from the security deposit provided for by the Customs Tariff Code for
temporary entry imports.
- Customs duty and tax relief on the import of equipment goods.
The CFI has made some progress in reducing delays facing investors in starting a business in Haiti,
thereby reducing transaction costs. The Minister of Commerce’s (MCI) internet registry allows
investors to search for or verify the existence of a business in Haiti. The registry will eventually
provide online registration of companies through an “electronic single window.”
During the period of October 2014 to September 2015, a total of 19 agribusiness projects have
been registered in CFI for Incentive Benefits (CII), for a total potential investment of more than
246 million USD. For the same period of 2015 to 2016, a total of 18 agribusiness projects totalling
more than 316 USD million have been registered.
› Bureau for Coordination and Monitoring of Agreements CARICOM / WTO / FTAA (BACOZ). The BACOZ is a de-concentrated body of the Prime Minister's Office set up with the mission of coordinating and following up on Haiti negotiations with CARICOM and the FTAA.
9.2 Donors › Inter-American Development Bank (IDB)
The IDB's country strategy identifies six priority sectors that have the potential to transform Haiti’s
economy and society substantially and sustainably: education, private sector development,
energy (particularly electricity), water and sanitation, and agriculture and transport. IDB projects
support investments promotion and agribusiness:
Transfer of technology to small farmers. Private sector development through investment promotion. The objective of this program is
to promote the development of the private sector in Haiti by promoting investments. 17.5 million USD.
Business Accelerator Program at the North Pole Micro Business Support Program (MSME) Business and Training Service Program – SAEF Agricultural Production Chain Support Program (ANCRE)
Moreover, the Multilateral Investment Fund (MIF) from IDB can offer loans and grants to innovative
companies ranging on average from 100,000 USD to 4 million USD. Furthermore, the Inter-American
Investment Corporation (IIC) offer loans to private companies. The IIC portfolio in March 2017 consisted

Investment Consulting Associates (ICA) 41 CFI Haiti Agro-industry Sector
of eight (8) active operations, for a total of 8,015,000 USD. The smallest operation is of 150,000 USD and
the largest is 3,800,000 USD.
› World Bank
› Haiti Business and Investment Development Project
The 20 million USD project was approved in May 2013, and is expected to be completed by
November 2019. Its two main objectives are: (a) to improve the conditions for private sector
investment and inclusive growth; and (b) improve the capacity to respond effectively and quickly
to specified emergencies.
› International Finance Corporation (IFC)
As a member of the World Bank Group, IFC is the world's largest development agency with
exclusively private sector activities in developing countries.
› European Union
› Caribbean Export Development Agency (CEDA)
CEDA is a regional agency working with 21 countries to promote CARICOM. The trade component
of the project has an allocated budget of €7.2 million with four components: (1) trade; (2)
customs; (3) private sector (€ 1 million) - subsidies to SMEs up to € 30,000 (matching grants) in
value-added sectors; Companies with 1 to 10 employees; and (4) investments.
› United Nations Development Program (UNDP)
UNDP is the global development network of the United Nations system. Currently, UNDP has two
programs to support entrepreneurship development: the Supplier Development Program (PDF)
and ANN ALE.
› Global Affairs Canada
› National Support Program for the Structuring of Haitian Entrepreneurship (PANSEH)
The project aims to support Haitian micro and small and medium-sized enterprises by increasing
access to technical support and credit; and the Agricultural Finance and Insurance System in Haiti
(SYFAAH).
› United States Agency for International Development (USAID)
USAID is currently financing three projects: (i) the Local Enterprise and Value Chain Enhancement (LEVE)
Project - a project to improve local businesses and their value chains; (ii) Leveraging Effective Applications
of Direct Investments (LEAD), designed to strengthen the capacity of SMEs to engage in best business
practices, and attract foreign investment across the diaspora; and (iii) Chanje Lavi Planté Feed the Future,
a project aimed at modernizing agriculture to double the production and incomes of 90,000 rural families
Investment Consulting Associates (ICA) 42 CFI Haiti Agro-industry Sector
in the agricultural sector of the intervention zones, and transforming peasant associations into real small
businesses. USAID Credit Guarantee Program. The United States' Development Credit Authority (DCA)
uses partial credit guarantees to mobilize local financing in developing countries.

Investment Consulting Associates (ICA) 43 CFI Haiti Agro-industry Sector
Targeted Agribusiness Subsectors
In the agribusiness sector, Haiti presents some development opportunities in specific value chains (table
11). For some of them, it is mainly the potential for growth of an existing exporting value chain; while
others have the potential to diversify exports into new products / external markets; and others have the
potential for growth in the domestic market, including some for import substitution. These are value
chains where there are opportunities for foreign and / or domestic investors. That said, the potential
investments would meet production and marketing conditions more or less differentiated according to
these products. The agroindustry sub-sectors identified and presented here as those to be targeted are:
Exports and national market. Import substitutions:
Exports:
National market – import substitutions:
› Mango
› Cocoa
› Sorghum
› Aquaculture
› Bananas and plantains
› Coffee
› Essential Oils - Vetiver
› Poultry and eggs
› Rice
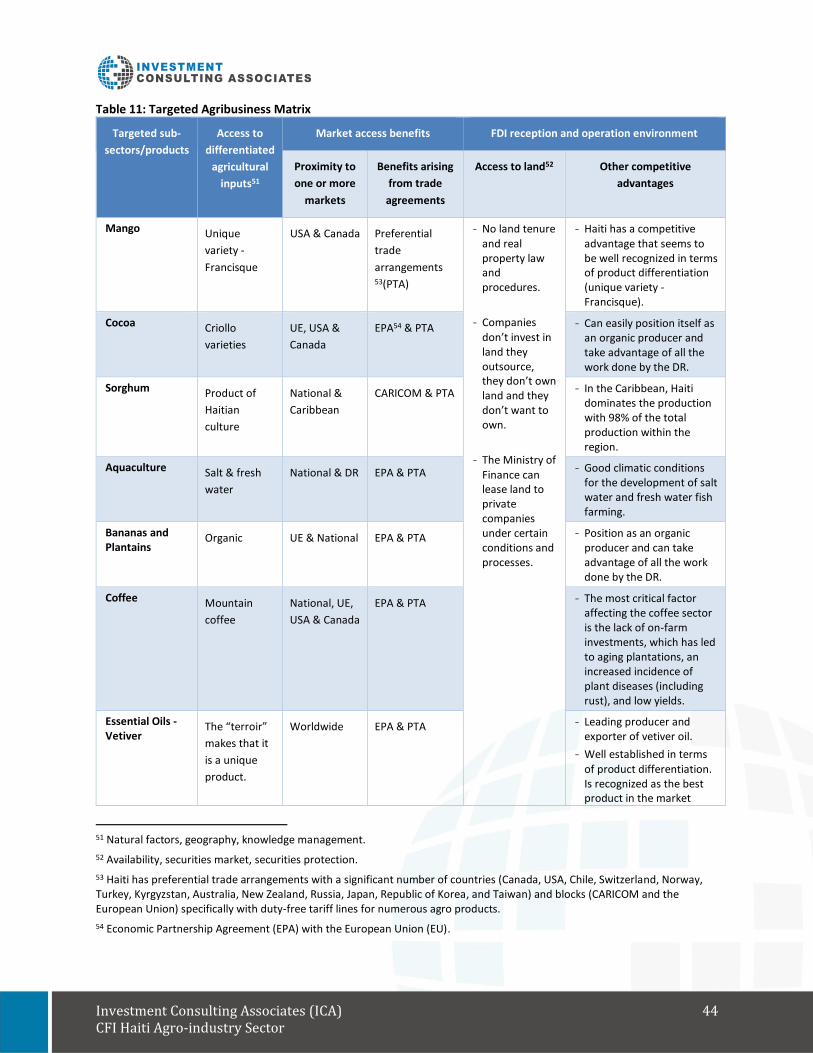
Investment Consulting Associates (ICA) 44 CFI Haiti Agro-industry Sector
Table 11: Targeted Agribusiness Matrix
Targeted sub-
sectors/products
Access to
differentiated
agricultural
inputs51
Market access benefits FDI reception and operation environment
Proximity to
one or more
markets
Benefits arising
from trade
agreements
Access to land52 Other competitive
advantages
Mango Unique
variety -
Francisque
USA & Canada Preferential
trade
arrangements 53(PTA)
- No land tenure and real property law and procedures.
- Companies don’t invest in land they outsource, they don’t own land and they don’t want to own.
- The Ministry of Finance can lease land to private companies under certain conditions and processes.
- Haiti has a competitive advantage that seems to be well recognized in terms of product differentiation (unique variety - Francisque).
Cocoa Criollo
varieties
UE, USA &
Canada
EPA54 & PTA - Can easily position itself as an organic producer and take advantage of all the work done by the DR.
Sorghum Product of
Haitian
culture
National &
Caribbean
CARICOM & PTA - In the Caribbean, Haiti dominates the production with 98% of the total production within the region.
Aquaculture Salt & fresh
water
National & DR EPA & PTA - Good climatic conditions for the development of salt water and fresh water fish farming.
Bananas and Plantains
Organic UE & National EPA & PTA - Position as an organic producer and can take advantage of all the work done by the DR.
Coffee Mountain
coffee
National, UE,
USA & Canada
EPA & PTA - The most critical factor affecting the coffee sector is the lack of on-farm investments, which has led to aging plantations, an increased incidence of plant diseases (including rust), and low yields.
Essential Oils - Vetiver
The “terroir”
makes that it
is a unique
product.
Worldwide EPA & PTA - Leading producer and exporter of vetiver oil.
- Well established in terms of product differentiation. Is recognized as the best product in the market
51 Natural factors, geography, knowledge management.
52 Availability, securities market, securities protection.
53 Haiti has preferential trade arrangements with a significant number of countries (Canada, USA, Chile, Switzerland, Norway, Turkey, Kyrgyzstan, Australia, New Zealand, Russia, Japan, Republic of Korea, and Taiwan) and blocks (CARICOM and the European Union) specifically with duty-free tariff lines for numerous agro products.
54 Economic Partnership Agreement (EPA) with the European Union (EU).

Investment Consulting Associates (ICA) 45 CFI Haiti Agro-industry Sector
mainly due to its soil particularities.
Poultry and eggs National import substitutions - No entry barriers and high level of contraband – undeclared merchandise.
Rice National import substitutions - No entry barriers and high level of donations (USA, Japan) that disturb the market.
Appendix 1 presents a detailed value appreciation for each product/value chain mentioned on Table 11 Targeted Agribusiness Matrix

Investment Consulting Associates (ICA) 46 CFI Haiti Agro-industry Sector
SWOT Analysis of the Haitian Agro-industry55
Strengths Weaknesses
› The Investment Code - foreign investors have the same rights, privileges and equal protection. Foreign investors are permitted to own 100% of a company or subsidiary.
› Tax incentives (reductions on taxable income and tax exemptions) designed to promote private investment.
› There is a national market and there is a demand for agro-industrial products, which is expected to grow.
› The workforce is available.
› Climates and soils suitable for the intensive production, with a diversity of ecological environments.
› The Ministry of Finance can lease land for productive projects to private companies.
› There is no land tenure or real property law and procedures.
› Haitian law is deficient in a number of areas:
- Foreign investment regulations and competition;
- International trade and investment promotion; - Establishment of companies; - Bank, credit operations and accounting
standards. - Customs law and administration.
› Lack of systemic support for cluster competitiveness in the main productive sectors.
› Dysfunctional government bureaucracy and red tape.
› Deteriorated physical/social infrastructure.
› Insecurity – unpredictability.
› Access to finance.
› The Haitian economy is very volatile and unpredictable.
Opportunities Threats
› National market (> 10 million inhabitants) becoming more demanding and sophisticated.
› Member of CARICOM, signatory of eight bilateral investment treaties (BITs) and international investment agreements.
› Short shipping times to U.S. ports.
› Labor force, trainable.
› Capture foreign investors and develop Haiti’s competitive advantage in niches with international and national demand:
- Imports substitution on strategic agri-products for national market (rice, corn, beans, poultry, eggs, fish, others).
- Organic and free trade certification. - Vetiver offers a competitive advantage. - Fish farming (aquaculture).
› The agro-industry is changing, which will impact market quality exigencies:
- In 2017, implementation of the Food Safety Modernisation Act (FSMA).
- In 2020, traceability will be mandatory in several agro segments.
› Limited national food production capacity and dependence on food imports.
› There is basic market information, but no detailed price information for most of the value chains.
› Soil degradation.
› Hazard risks (natural disasters).
› Roads and infrastructure in an advanced state of deterioration.
55 Based mainly on public and private sector interviews.

Investment Consulting Associates (ICA) 47 CFI Haiti Agro-industry Sector
› Developing a program linking agriculture and agroindustry to tourism.
› Multinationals awareness and attraction program.

Investment Consulting Associates (ICA) 48 CFI Haiti Agro-industry Sector
Location Value Proposition for Haitian Agribusiness
The SWOT analysis that has been carried out, and the identification of the sub-sectors and products to be
targeted, has provided the main guidelines to more precisely elaborate the location value proposition for
the Haitian agribusiness to be put forward to promote FDI in this sector, such as investments from national
entrepreneurs and business groups. Therefore, these analyses make it possible to identify the main
strategic approaches that should be supported and promoted in order to trigger favourable dynamics and
to reinforce this value proposition.
12.1 Large potential for FDI attraction on national market and import substitution
The Haitian market, with a population of more than 10 million, is an emergent market that is becoming
increasingly demanding and sophisticated, with a very high production potential in the agro-industry
sector, as national production supplies less than 50% of the food consumption needed in the country. For
the period of 2009 to 2016, the country’s food imports have grown at 6.90% annually. For the same period,
the annual value average for food imports have been more than 664 million USD,peaking at 955 million
USD in 2015.56 Food imports have decreased by 21.33% between 2015 and 2016, as the Haitian economy
began to slow down in 2016. The main products that Haiti import are rice, cereal products, malt, starch,
wheat gluten, poultry, meat and edible meat offal, animal and vegetable fats, oils, and miscellaneous food
preparations. Haiti does have important comparative advantages, even if they are not full realized and
are not yet driving foreign direct investment decisions.
In this perspective, linking agro-industry by supplying the growing tourism sector as the leading hotels in
Port-au-Prince (PAP) and the Cote des Arcadiens (60 km form PAP) seems to be an opportunity to
contribute to strengthen national agri-food value chain supplies at the same time as reinforcing the
Haitian offer to the tourist sector. Haiti’s still nascent tourism drive, if sustained, will eagerly absorb
greater and greater quantities of local agricultural staples and of value-added processed products.
With the above-stated opportunities, an awareness and attraction strategy for multinationals must be
settled to attract active food industry multinationals in the Caribbean. Multinationals will be interested in
Haiti as an emergent market that offers a good potential to grow: Nestlé, UNILEVER, Jamaica Producers,
franchises (only Dominos Pizza) and others. FDI will also contribute to putting pressure in the country to
improve the overall system.
12.2 Exports potential and FDI attraction
Haiti needs to choose niche markets and develop their competitive advantage, and organic products offer
a great opportunity to do so, as the country is not contaminated with fertilisers, contaminants. Haiti could
take advantage of the opening market the Dominican Republic has created, which is the leading country
in worldwide organic cocoa and banana exports. Haiti could take advantage of the same commercial
agreements as the DR, and the same product origin the “Island of Hispaniola”.
56 Banque de la Republique d’Haiti (BRH) import stats.

Investment Consulting Associates (ICA) 49 CFI Haiti Agro-industry Sector
› Organic and free trade products
Worldwide organic food and drink sales have increased from roughly from 18 billion USD in 2000
to almost 82 billion USD in 2015. Global growth has expanded by 10% in 2015, thus offering
opportunities for long and secures investments. The highest growth was observed in North
America (43.3 billion USD market in 2015), which accounts for over half of international sales, and
whose market share represents 5% of total sales (10% of all fruit & vegetables).57 The European
market expanded by more than 10% (31.1 billion USD market), with Germany as the largest
market (9.5 billion USD).
Haiti can be well positioned in the organic market niche to expand exports and increase revenues
with competitive advantages, as the country is closer to Caribbean markets in general and their
tourist industries, is signatory of the EPA agreement with the EU, and there are short shipping
times to U.S. ports, the climates and soils are suitable for organic production in crops like banana,
cacao, mango, coffee, and others. Organic importers could be interested to come and invest and
guarantee their supply over time. 58
› Vetiver essential oil, a unique product
Haiti is recognized globally as producing the best vetiver essential oil available worldwide, and
this product is a key and crucial ingredient in industries such as perfumery, toiletries, air
fresheners, cosmetics, and food and beverages, where it is used as a flavour as well as for food
preservation purposes and in pharmaceuticals. For the period of 2013 to 2016, Haitian formal
essential oil exports have grown at an annual average of 12.73%, for a total of 23.71 million USD
in 2016.59 The vetiver oil market was 44.5 million USD in 2014, and formal Haitian exports at 17.11
USD, or 38.45% market share.
The main producers of vetiver oil in the global market are Haiti, India, Indonesia, Japan, China,
and Brazil, and Japan, India, Europe, and the U.S. are among the chief consumers of the product.
The Asia Pacific market is expected to witness surging demand owing to its profound usage in
food and beverage, fragrance, and pharmaceutical applications. The perfume industry in Europe
and North America is expected to be a major demand driver as well. 60 Leading companies
emphasize the ecological and sustainable cultivation techniques for vetiver roots cultivation.
Some of the major vendors operating in the global vetiver oil market are Unikode S.A., Frager S.A.,
Floracopeia, Kautilya Phytoextracts Pvt. Ltd., Manohar Botanical Extracts Pvt. Ltd., Fleurchem, Inc.,
57 The Global market for Organic Food & Drink
58 Intracen Data base - Organic products importers contact details, as well as associations of importers and purchasing and supply management associations involved in the trade of certified organic products.
http://www.intracen.org/itc/sectors/organic-products/importers/
Organic farming and trade in organic products market studies, reports, readings, and other publications.
http://www.intracen.org/itc/sectors/organic-products/market-research/
59 BRH. Exports by product.
60 Vetiver Oil Market Analysis by Application (Fragrance, Pharmaceuticals, Food & Beverage) and Segment Forecasts To 2022

Investment Consulting Associates (ICA) 50 CFI Haiti Agro-industry Sector
Vee Kay International, and Rajkeerth Aromatics. Foreign investors could be interested to invest
and guarantee their supply over time.
› Aquaculture
Global demand for the aquaculture market was valued at 156.27 billion USD in 2015, and is
expected to reach 209.42 billion USD in 2021, growing at a compound annual growth rate (CAGR)
of 5.0% between 2016 and 2021. In terms of volume, the global demand for aquaculture stood at
71,190 kilotons in 2015.61
Aquaculture, both in freshwater and in brackish-marine waters, is feasible in Haiti. Haiti has many
small bays and inlets along its coast, some of which are extremely well protected. There are some
17 000 ha of mangrove forest, about half of which is in the Artibonite Department, and 20% of
which is in the North Department.62
Aquaculture can be developed as an export-oriented agribusinesses as well as for the large local
market demand for fish. The main opportunities for aquaculture development are the availability
of skilled technicians to manage commercial operations, a low wage rate for unskilled labor, local
hatcheries that produce tilapia seed, and the availability of some local feedstuffs that can be used
in production of pelleted feeds.63 International fish farming companies could be interested in
investing in Haiti to develop the national market and export to the Caribbean and other
international markets.
61 Aquaculture Market (carp, molluscs, crustaceans, salmon, trout and other fish) by Culture (marine water, fresh water and
brackish water): Global Industry Perspective, Comprehensive Analysis, Size, Share, Growth, Segment, Trends and Forecast, 2015
– 2021 62 FAO. Aquaculture development in the Caribbean. 63 Developing Tilapia Aquaculture In Haiti: Opportunities, Constraints, and Action Items, November 2012.

Investment Consulting Associates (ICA) 51 CFI Haiti Agro-industry Sector
Sustainable Development
Environmental issues are a main concern in developing a sustainable agro-industry in Haiti, as
environmental degradation in Haiti is the worst in the Western Hemisphere, a cause and result of the
country’s economic decline. Widespread deforestation, particularly of this mountainous country, has led
to flooding, dramatic rates of soil erosion, and subsequent declines in agricultural productivity. Haiti’s
depleted tree cover exacerbates the consequences of storms and hurricanes. The impact of all natural
disasters (table 12) on the population’s culture and mentality has been to look for quick gains and an
aversion to business risks.
The major effects of recurrent, large-scale natural shocks and socio-political perturbations have been:
− Destruction and damage to infrastructure;
− Production losses.
Table 12: Natural disasters. The Haitian population is highly exposed to shocks compared to the Dominican Republic
1900-2013 # of Events Killed Total Affected Damage (000 USD)
Total Haiti 104 249,111 12,287,716 9,309,865
Total Dominican Republic 66 5,786 4,696,319 2,901,533
Source: from "EM-DAT: The OFDA/CRED International Disaster Database ; www.em-dat.net - Université Catholique de Louvain - Brussels - Belgium"
A clear line can be seen running down the border that divides Haiti from the Dominican Republic (figure
10). To the west of the island of Hispaniola is Haiti, only 3% of which now has forest coverage. The
Dominican Republic, that makes up the east of the island, still has 23% forest coverage. At least 90% of
Haiti’s soils have been severely degraded by deforestation and inappropriate cultivation, as compared to
40% for the Dominican Republic.64
Figure 10: Hispaniola Island – Haiti and Dominican Republic division
In order to reverse the negative environmental consequences at the agricultural level, the investments need to take into account:
64 A Case Study of Desertification in Haiti. Dr. Vereda Johnson Williams, Associate Professor, Economics and Finance Department, School of Business and Economics North Carolina A&T State University, Greensboro, NC 27411, USA.

Investment Consulting Associates (ICA) 52 CFI Haiti Agro-industry Sector
− Develop sustainable agricultural practices;
− Restore and fertilize the land;
− Reforestation.
13.1 Sustainable development trends in the sector and in Haiti
The SWOT analysis led to identifying a potential niche market for Haiti in organic agriculture, particularly
for bananas, cocoa, mangoes, others. This orientation is in line with the crucial need to have a sustainable
development agenda for Haiti. In fact, there is a strong awareness of government and donors to promote
a comprehensive approach to agricultural investment projects, including work on the regeneration and
planting of protective vegetation, and the appropriate development of hydraulic and field systems to
control land use, erosion, and save resources.
The international future growth will create the demand for specialty products in niche markets, including
organic and vegetarian foods. Organic and free trade certification (bananas, cocoa, mangoes, coffee, and
other crops) is a niche that is growing on the international market, and where Haiti can be positioned to
expand exports and increase revenues with a competitive advantage. Poultry and fish are better aligned
with these trends than beef in more developed countries.
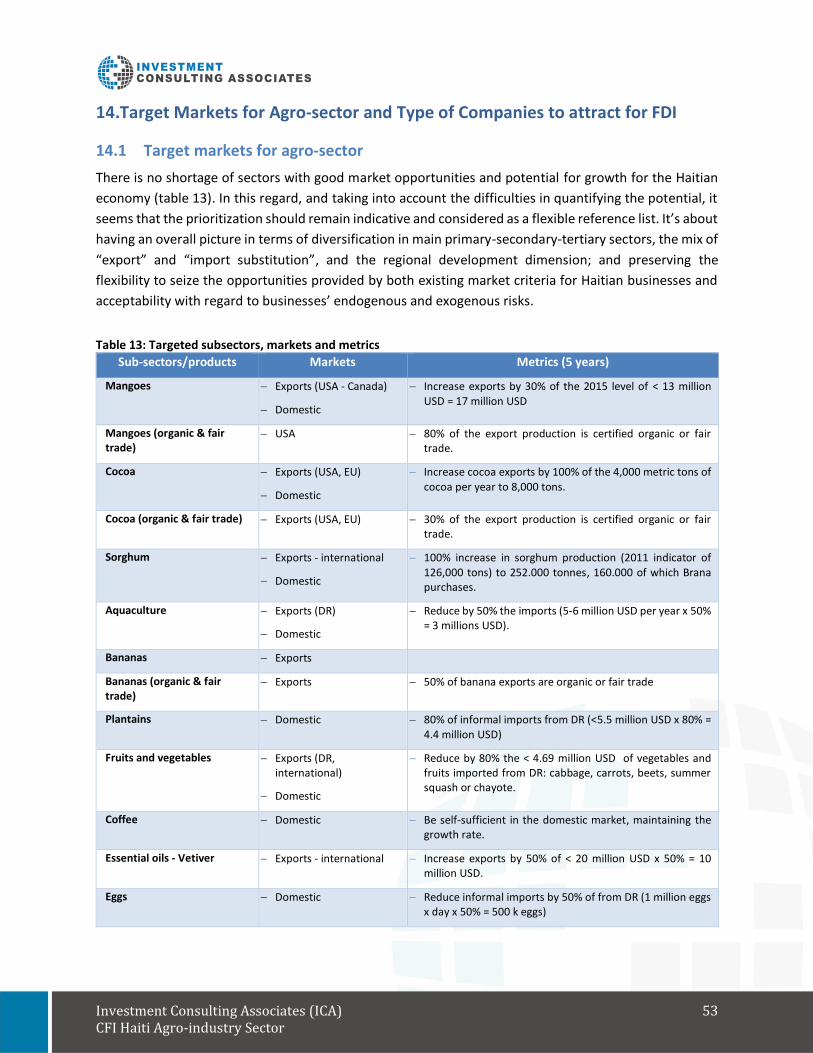
Investment Consulting Associates (ICA) 53 CFI Haiti Agro-industry Sector
Target Markets for Agro-sector and Type of Companies to attract for FDI
14.1 Target markets for agro-sector
There is no shortage of sectors with good market opportunities and potential for growth for the Haitian
economy (table 13). In this regard, and taking into account the difficulties in quantifying the potential, it
seems that the prioritization should remain indicative and considered as a flexible reference list. It’s about
having an overall picture in terms of diversification in main primary-secondary-tertiary sectors, the mix of
“export” and “import substitution”, and the regional development dimension; and preserving the
flexibility to seize the opportunities provided by both existing market criteria for Haitian businesses and
acceptability with regard to businesses’ endogenous and exogenous risks.
Table 13: Targeted subsectors, markets and metrics
Sub-sectors/products Markets Metrics (5 years)
Mangoes − Exports (USA - Canada)
− Domestic
− Increase exports by 30% of the 2015 level of < 13 million USD = 17 million USD
Mangoes (organic & fair trade)
− USA − 80% of the export production is certified organic or fair trade.
Cocoa − Exports (USA, EU)
− Domestic
− Increase cocoa exports by 100% of the 4,000 metric tons of cocoa per year to 8,000 tons.
Cocoa (organic & fair trade) − Exports (USA, EU) − 30% of the export production is certified organic or fair trade.
Sorghum − Exports - international
− Domestic
− 100% increase in sorghum production (2011 indicator of 126,000 tons) to 252.000 tonnes, 160.000 of which Brana purchases.
Aquaculture − Exports (DR)
− Domestic
− Reduce by 50% the imports (5-6 million USD per year x 50% = 3 millions USD).
Bananas − Exports
Bananas (organic & fair trade)
− Exports − 50% of banana exports are organic or fair trade
Plantains − Domestic − 80% of informal imports from DR (<5.5 million USD x 80% = 4.4 million USD)
Fruits and vegetables − Exports (DR, international)
− Domestic
− Reduce by 80% the < 4.69 million USD of vegetables and fruits imported from DR: cabbage, carrots, beets, summer squash or chayote.
Coffee − Domestic − Be self-sufficient in the domestic market, maintaining the growth rate.
Essential oils - Vetiver − Exports - international − Increase exports by 50% of < 20 million USD x 50% = 10 million USD.
Eggs − Domestic − Reduce informal imports by 50% of from DR (1 million eggs x day x 50% = 500 k eggs)
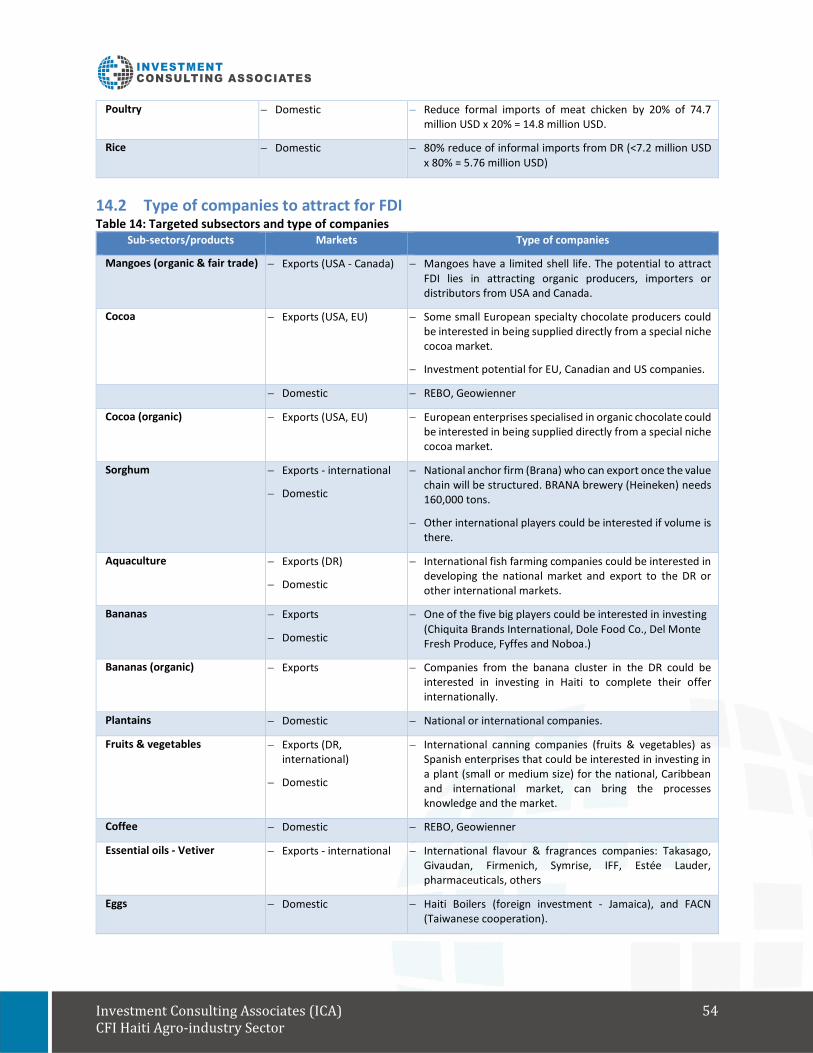
Investment Consulting Associates (ICA) 54 CFI Haiti Agro-industry Sector
Poultry − Domestic − Reduce formal imports of meat chicken by 20% of 74.7 million USD x 20% = 14.8 million USD.
Rice − Domestic − 80% reduce of informal imports from DR (<7.2 million USD x 80% = 5.76 million USD)
14.2 Type of companies to attract for FDI Table 14: Targeted subsectors and type of companies
Sub-sectors/products Markets Type of companies
Mangoes (organic & fair trade) − Exports (USA - Canada)
− Mangoes have a limited shell life. The potential to attract FDI lies in attracting organic producers, importers or distributors from USA and Canada.
Cocoa − Exports (USA, EU)
− Some small European specialty chocolate producers could be interested in being supplied directly from a special niche cocoa market.
− Investment potential for EU, Canadian and US companies.
− Domestic − REBO, Geowienner
Cocoa (organic) − Exports (USA, EU) − European enterprises specialised in organic chocolate could be interested in being supplied directly from a special niche cocoa market.
Sorghum − Exports - international
− Domestic
− National anchor firm (Brana) who can export once the value chain will be structured. BRANA brewery (Heineken) needs 160,000 tons.
− Other international players could be interested if volume is there.
Aquaculture − Exports (DR)
− Domestic
− International fish farming companies could be interested in developing the national market and export to the DR or other international markets.
Bananas − Exports
− Domestic
− One of the five big players could be interested in investing (Chiquita Brands International, Dole Food Co., Del Monte Fresh Produce, Fyffes and Noboa.)
Bananas (organic) − Exports − Companies from the banana cluster in the DR could be interested in investing in Haiti to complete their offer internationally.
Plantains − Domestic − National or international companies.
Fruits & vegetables − Exports (DR, international)
− Domestic
− International canning companies (fruits & vegetables) as Spanish enterprises that could be interested in investing in a plant (small or medium size) for the national, Caribbean and international market, can bring the processes knowledge and the market.
Coffee − Domestic − REBO, Geowienner
Essential oils - Vetiver − Exports - international − International flavour & fragrances companies: Takasago, Givaudan, Firmenich, Symrise, IFF, Estée Lauder, pharmaceuticals, others
Eggs − Domestic − Haiti Boilers (foreign investment - Jamaica), and FACN (Taiwanese cooperation).
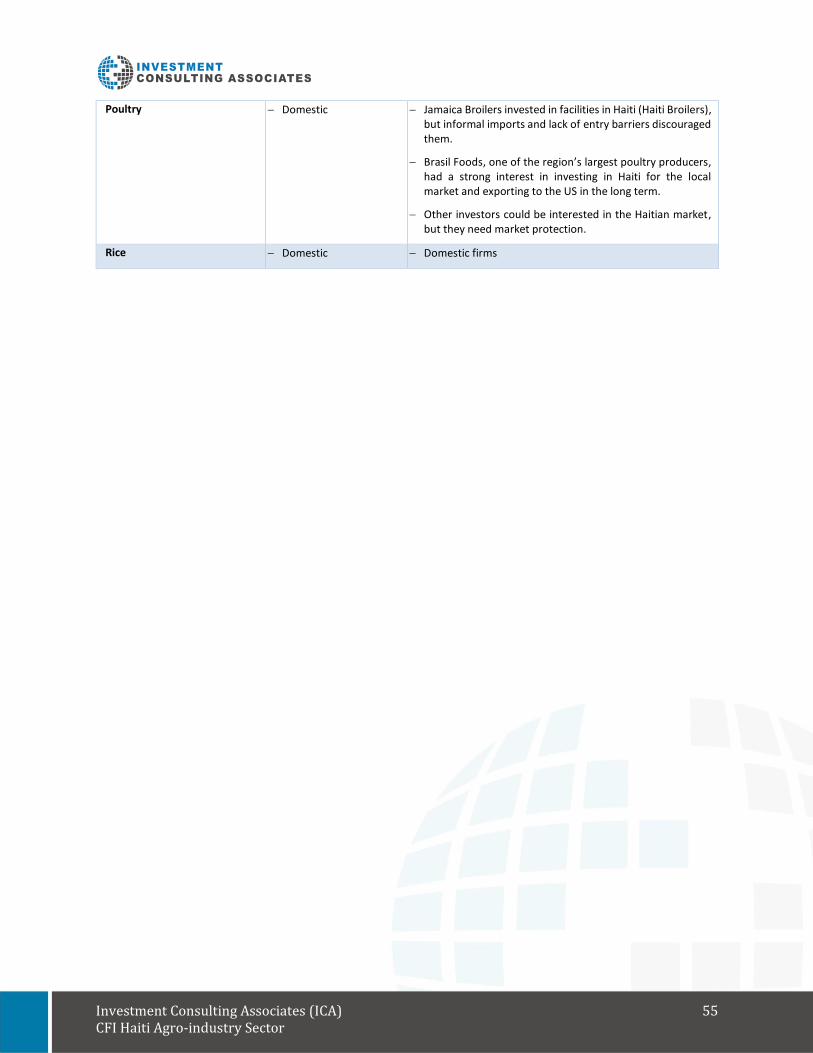
Investment Consulting Associates (ICA) 55 CFI Haiti Agro-industry Sector
Poultry − Domestic − Jamaica Broilers invested in facilities in Haiti (Haiti Broilers), but informal imports and lack of entry barriers discouraged them.
− Brasil Foods, one of the region’s largest poultry producers, had a strong interest in investing in Haiti for the local market and exporting to the US in the long term.
− Other investors could be interested in the Haitian market, but they need market protection.
Rice − Domestic − Domestic firms

Investment Consulting Associates (ICA) 56 CFI Haiti Agro-industry Sector
Conclusions and Recommendations
15.1 Conclusions
Haiti’s current foreign trade policy is open, however, there is a need to attract foreign investments in the
agroindustry sector. Haiti needs to implement a systemic approach to promote strategic sectors
internationally in countries and / or market niches where there are comparative advantages to attract
investment. For that, the use of the CARICOM, the eight bilateral investment treaties (BITs) and
international investment agreements signed are central. The private sector, nationally and internationally,
needs to know the markets where Haitian products can penetrate with a competitive advantage, as the
Dominican Republic did with organic products in the UE – mainly UK, Germany and France.
Haiti’s food trade deficit increased significantly over the last two decades. Exports, in turn, were mostly
unchanged and becoming undiversified. Haiti’s dependence on agricultural imports makes it strategically
vulnerable. Export diversification on products and markets are important to reduce Haiti vulnerability.
The country’s narrow range of exports and dependence on food imports further aggravates its
vulnerability. Export diversification is crucial for an open low-income country like Haiti. At the same time,
the diversification of exports must be combined with actions in favor of import substitution, particularly
with regard to informal imports from the DR.
The dynamics of economic development emerge and grow in sub-sectors of activities, value chains or
clusters, usually on a regional basis from poles and sectoral networks (agro-industrial cluster). The
existence of a macro-environment open for business makes for a country that will be more likely to
spontaneously engage in such dynamics to realize its potential development in the sectors in which it has
comparative advantages. That said, promoting the development of sectoral clusters or value chains is
useful and effective in most contexts, both in general, as well as in other “less or little” conducive. In fact,
the cluster cooperative development strategies are even more necessary in environments unsuitable to
business development - they allow the reduction and better control and management of the economic
and other risks that are endogenous and external to the VC.
In Haiti, it is realistic to consider that the resolution of problems and institutional malfunctions in a legal,
security, and political context that would make it more suited to business development is undergoing a
lengthy process. However, it is also realistic to consider that achieving the required changes in Haiti to
better exploit the economic benefits and to moderate and mitigate risks, is more manageable at specific
VC levels, by improving access to production factors, inputs, appropriate types of funding, business
services, and markets. More specifically the value chain approach is particularly relevant for agribusiness
activities.
15.2 Recommendations
Haiti should develop an FDI strategy for the agroindustry sector centered on two axes: (i) the development
of the national market to take advantage of the growth market demand; and substitution of imports in
order to improve the availability of basic commodities consumed locally by Haitians, and to ensure food
security and food availability through increased agricultural production; and (ii) export diversification –

Investment Consulting Associates (ICA) 57 CFI Haiti Agro-industry Sector
markets and/or products. In order to achieve these purposes, the main objective will be to put in place a
systemic rigorous strategy to attract and capture foreign investors that could bring capital, technology
and markets in the strategic agri-business niches.
› National market
- Import substitution: Promote value chains that can substitute imports (mainly informal from the
DR) in order to decrease Haiti’s dependence on agricultural imports and be strategically less
vulnerable.
- Strengthening of producer organizations: Strengthen the small producer associations to reach
economies of scale, increase access to inputs and improve their bargaining power.
- Inclusive business: Economic elites who would be encouraged to review their business models in
a more inclusive perspective, such as the approach to become faithful “anchor firms” integrating
producer associations to their value chains in a win-win strategy.
- Linking agriculture to tourism with the main hotels in Port-au-Prince and the Cote des Arcadiens.
The expected tourism growth in Haiti could provide niche opportunities for small farmers in order
to increase their revenues by marketing their products to the tourism sector.
- Access to credit: Develop programs to facilitate the access to credit in the agroindustry sector
(farmers and companies) as guarantee funds to reduce the perceived banking system risks in the
sector.
› Organics and fair trade
- Organic and fair trade certification (bananas, cocoa, mangoes, coffee, and other crops) is a niche
that is growing in the international market and where Haiti can be positioned to expand exports
and increase revenues with a competitive advantage. Setting up certification processes for
organically produced fruits, vegetables, and essential oils, to guarantee quality and market
diversification. The international future growth will be in demand for specialty products in niche
markets including ethnic, organic and vegetarian foods.
- Organic and fair trade marketing strategy: To promote organic and sustainably produced high
premium products of Haiti's agricultural sector in niche markets where Haiti’s have competitive
advantage (CARICOM, the eight bilateral investment treaties (BITs) and international investment
agreements) as well as locally.
› Business climate
- Infrastructure development to support agro-industry value chains: Inadequate basic public
infrastructure constitutes a serious restriction for investments and a bottleneck to growth. A lack
of infrastructure means that enterprises must often furnish their own security, and energy, and
cope with increased costs in transport and logistics.
- Strengthening property rights and the land tenure system: Haiti’s current land tenure system is a
serious obstacle to Haiti’s development. Establishing a modern land cadastre, which would both

Investment Consulting Associates (ICA) 58 CFI Haiti Agro-industry Sector
accurately survey each parcel of land and establish clear ownership, would greatly advance the
goal of establishing secure and transferable property rights in Haiti. Such a system would
incentivize investments to improve real property, allow land to be used as collateral, reduce costly
and time-consuming conflicts over land rights, and provide information that could be used for tax
purposes.65
- Backing structural reforms to improve the productivity of the agricultural sector and encourage
export diversification. To pair trade policy with structural reforms more conducive to export
diversification and growth.
› Foreign direct investment (FDI)
- Sustainable development goals: Companies that meet sustainable development goals should be
prioritised and awarded any concessions. FDI should target sub-sectors of Haiti's agricultural
sector with high competitiveness that are organic and sustainably produced. All foreign
companies investing in Haiti are to contribute voluntarily to: (i) developing sustainable agricultural
practices; (ii) restoring and fertilizing the land; and (iii) reforestation to minimise economy
threatening effects of erosion.
- FDI after care policies: To ensure maximum benefits from the projects with a clear strategy in
place for each project to maximize these benefits, as well as to ensure the resort has a successful
investment in Haiti.
- Donor’s partnership to sustainable development: FDI could seek assistance from donors,
conservation groups, and non-governmental organizations. Such organizations can provide start-
up funding, training, and technical assistance that can lend both legitimacy and sustainability to a
project.
- Prioritization criteria of FDI projects: Prioritization of sectors/VCs can be done by: (i) basing
themselves primarily on the criterion of “sectoral growth potential for the Haitian economy”; and
(ii) the need to further diversify the sectors of intervention (to diversify the exports heavily
concentrated on the garment sector, and limited to two or three agricultural VCs and to substitute
growing imports). In fact, the main points in assessing whether a particular sector is appropriate
for support are: (a) to ensure that there are well-identified markets for targeted companies in the
sector/industry/VC considered; and (b) that their operating conditions have sufficiently mitigated
and measured endogenous and exogenous risks that it is reasonable to expect short, medium
and/or long-term results.
65 IMF. Haiti Selected issues, June 2015

Investment Consulting Associates (ICA) 59 CFI Haiti Agro-industry Sector
Table 15: Enterprise and value chain risks checklist, risk rating and mitigation strategy - Endogenous and exogenous risks
Source: Daniel Boutaud & Carlos Puig (2015)
› Export programs - Export diversification on products and markets
− New Exporters Program: The purpose of the program will be to increase the number of exporting
companies, to improve their technical and management capacities in export-related fields. The
specific objectives will be
• Identify companies that will have the capacity and the commitment to start exporting, or
that have already exported sporadically.
• Provide them with basic training, technical knowledge, and basic methodological tools to develop and launch a viable and sustainable export project.
− Trade Agreements Promotion Program: In the context that trade agreements are tools to promote
economic growth, the private sector needs to be sensitized to the existing trade agreements
signed or negotiated by Haiti, in order to take advantage of the existing business opportunities in

Investment Consulting Associates (ICA) 60 CFI Haiti Agro-industry Sector
the partner markets. An effective way of responding is to develop a promotion and training
program aimed to companies in relation to advantages and opportunities of the trade agreements
and treaties.

Investment Consulting Associates (ICA) 61 CFI Haiti Agro-industry Sector
References 1. “Haiti is open for business”, Société Nationale des Parcs Industriels (SONAPI), pdf, 32 pages
2. “Haiti, Toward a new narrative; Systematic Country Diagnostic”, Raju Jan Singh Mary Barton-
Dock, The World Bank, 2015
3. “The Global Competitiveness Report 2014–2015: Full Data Edition”, World Economic Forum
Klaus Schwab, 2014
4. “Developing Entrepreneurship - Experience in Latin America and Worldwild”, Hugo Kantis, Pablo
Angelelli, Virginia Moori Koenig, IDB-Fundes International, 2005
5. “New Approaches to SME and Entrepreneurship Financing: Broadening the Range of
instruments”, OCDE, 2015
6. ” ADB–OECD study on enhancing financial accessibility for SMEs: Lessons from recent crises.
Asian Development Bank, 2013.
7. “Development of the MIF Haiti strategy: Main results” Washington D.C. Workshop, March 20-21,
2014; Daniel Boutaud, Guy Champagne, Stéphanie Maurissen & Carlos Puig, International
Consultant, Inter-American Development Bank, Multilateral Investment Fund
8. International Monetary Fund, 2015 Staff report, June 2015
9. World Development Indicators, World Bank: http://wdi.worldbank.org
10. World Bank: data.worldbank.org
11. “The economic accounts in 2013 - GDP by sector”, Haitian Institute of Statistics and Information,
Ministry of Economy and Finance, Republic of Haiti
12. IMF Country Report , No 15/157 Haiti, Staff report, May 6
13. World Bank Group Finance, IFC Enterprise Finance Gap Database - Raw Data /2010, Haiti Data
14. “Q2 2015 PIC Report” & “Q3 2015 PIC Report”, SONAPI Parc Industriel de Caracol
15. ADIH data base
16. “Identification de créneaux potentiels dans les filières rurales haitiennes - Rapport de synthèse,
Tome 1: cadrage global de l’agriculture”; Gilles Damais, IRAM consultant, Ministère de
l’Agriculture, des Ressources Naturelles et du Développement Rural
17. Centre de facilitation des investissements, List of approved investment projects
18. “Transforming Haitian Agriculture through an Anchor Firm Approach - Design of a pilot project
for a large scale agricultural production”, ESB Entrepreneurial Solutions Partners; Submitted to
IDB; July 2013

Investment Consulting Associates (ICA) 62 CFI Haiti Agro-industry Sector
19. BRH report: “Financial statistics and indicators, quarterly financial banks data”
20. “MIF priorities in Haiti: An Agenda for Change” (2015), Alejandro Pardo (team leader/author),
MIF-IDB 2015. “Thematic Study: Final Consolidated Report”, D. Boutaud & al.; “Background
Paper A: Access to Markets”, Carlos Puig Esteve; “Background Paper B: Access to Finance”, G.
Champagne; “Background Paper C: Access to Basic Services”, Stéphanie Maurissen
21. “Developing Entrepreneurship - Experience in Latin America and World wild”, Hugo Kantis, Pablo
Angelelli, Virginia Moori Koenig, IDB-Fundes International, 2005
22. IDB - Haiti Progress Report, May 2015
23. “Les Zones Économiques Intégrées en Haïti – Analyse du Marché”, IFC, with The Netherlands
and Wallonia, Dec.2011
24. “Haiti and Dominican Republic Border Investment Initiative, Overview and Status”, Conseil
économique
25. Binationale KISKEYA /Consejo Economico Binacional GUISQUEYA, Presentation World bank, May
12, 2015
26. “Renforcer la Compétitivité et Promouvoir la Diversification à Haiti: Cadre intégré - Étude
diagnostique sur l’intégration du commerce (EDIC), Draft 1”, World Bank, 2013
27. “Private Sector Development in Haiti: Opportunities for Investment, Job Creation and Growth”,
The World Economic Forum in partnership with the World Bank, IDB and IFC, 2011
28. “The Economic Recovery and Roadmap”, Haiti Presidential Working Group on Competitiveness
29. “Vision partagée pour une Haïti inclusive et prospère”, Rapport préliminaire, Working Group on
Competitiveness, in collaboration with Groupe OTF, July 2009
30. Global Supply Chains, Logistics Clusters And Economic Growth: What Could It Mean To
Caribbean Territories ? Université des Antilles et de la Guyane, Eric LAMBOURDIERE; Elsa
CORBIN, Namibian German Centre for Logistics, Christopher SAVAGE, October 11th – 12t 2012
UWI – Port of Spain
31. Flux Commerciaux Haiti RD - Opportunités pour Accroître la Production Haïtienne, CFI, 2016
32. World President’s Organization, CFI, Karibe 13 Nov. 2013, ppt.
33. REFORMER LE CLIMAT DES INVESTISSEMENTS, RAPPORT DU CENTRE DE FACILITATION DES
INVESTISSEMENTS, CFI
34. Henson and Cranfield define it as “the subset of the manufacturing sector that processes raw
materials and intermediate products derived from agriculture, fisheries and forestry”. Henson &

Investment Consulting Associates (ICA) 63 CFI Haiti Agro-industry Sector
Cranfield, “Building the Political Case for Agro-industries and Agribusiness in Developing
Countries,” Agro-industries for Development, FAO & UNIDO (2009).
35. Wilkinson & Rocha, “Agro-industry Trends, Patterns and Development Impacts,” Agro-industries
for Development, FAO & UNIDO (2009)
36. UNIDO – Agro-Value Chain Analysis and Development (2009)
37. FAO - Global Trends and Future Challenges for the Work of the Organization (2012)
38. « The future of food and agriculture – Trend and Challenges », FAO, 2017.
39. FAO - Global Trends and Future Challenges for the Work of the Organization (2012)
40. “Canadian Food Trends to 2020 – A Long Range Consumer Outlook”, Serecon Manamgement
Consulting Inc. prepared for Agriculture and Agri-Food Canada, 2005.
41. Yuan, “2016 Analysis of New Patterns and Future Trends in Agriculture,” AgroNews
42. FAOSTATS, Land use statistics
43. “The World Factbook”, Haiti, Economy section, CIA.
44. World Food Program. ”WFP Haiti Country Brief”, May 2017.
45. U.S. Census Bureau Economic Indicators Division USA Trade Online, U.S. Import and Export
Merchandise trade statistics.
46. The World Bank in Dominican Republic. Overview.
47. Agri-Food Sector Profile - Dominican Republic, May 2016, Agriculture Canada and Agri-Food
Canada
48. The World of Organic Agriculture. Statistics & Emerging Trends 2017
49. U.S. Department of State. 2015 Investment Climate Statement - Haiti
50. United Nations UNCTAD – International Investment Agreements
51. BRH. Mise en oeuvre du programme d’incitation aux secteurs productifs dans le cadre de la
politique monetaire de la Banque de la Republique d’Haiti.
52. U.S. Commercial Service trade. Haiti Country Commercial Guide
53. Banque de la Republique d’Haiti (BRH) import stats
54. Intracen Data base - Organic products importers contact details
55. A Case Study of Desertification in Haiti. Dr. Vereda Johnson Williams, Associate Professor,
Economics and Finance Department, School of Business and Economics North Carolina A&T
State University, Greensboro, NC 27411, USA.

Investment Consulting Associates (ICA) 64 CFI Haiti Agro-industry Sector
Appendix 1 – Targeted Agribusiness Matrix Table 16: Targeted Agribusiness Matrix - Mango
MANGO
Criteria
Value of appreciation according to indicators / factual information
Description / characteristics / comments
Insuf. Inform
Low/ Negative
Average High / Positive
Potential markets - After essential oil, mangoes are the second most valuable agribusiness export and the number one crop export from Haiti. Mango exports reached 13,06 million US dollars in 2015, but decline to 8.70 million in 2016.
- Demand should be sustained at the international level over time. Growing national market.
Export ◆
Local ◆
Including substitution of
imports
◆
Competitive advantages ◆ - Haiti has a competitive advantage that seems to be well recognized in terms of product differentiation (unique variety - Francisque).
- Haitian mangoes compete successfully with Mexico on the US market. A factor contributing to this competitiveness is the longer harvesting period (10 month vs. 4 months for Mexican mangoes)
Actual markets - Advantage of differentiation in the international market on the Francisque variety.
- Main export niches: fresh mangoes with geographical indicators, organic, gourmet and ethnic.
- Main export markets: USA, Canada other Caribbean countries.
- Growing national market and multiple varieties.
Exports ◆
Internal market ◆
Value chain organisation - Dichotomy between the majority exporters and mango producers that prevents the actual organization of the industry needed to meet market requirements.
- Some isolated companies are positioning themselves in market niches as organic and fair trade, which differenciates them.
- Concentration is relatively high in the sector: the three largest exporters account for more than 60% of shipments, and each exporter normally has its own processing and packaging facilities (hot water treatment).
Degree of organization and
bargaining capacity of
cooperatives and small
producer associations
◆
Number and bargaining
power of domestic buyers ◆
Number and bargaining
power of international
buyers
◆
Number of SMEs in
manufacturing and services ◆

Investment Consulting Associates (ICA) 65 CFI Haiti Agro-industry Sector
FDI interest ✓ ◆ - There are no plantations. The system is
“Creole garden”.
Application and access of
producers to financing ◆ -
Potential scope for scaling up
for small producers and
SMEs
-
National ◆ - About 50,000 to 75,000 families - Creole garden.
Regional ◆ - Léogâne, la Plaine de Cul de Sac, Arcahaie et Cabaret ; Artibonite, Plateau Centrale, le Nord Est et Belladère. Jacmel and Les Cayes in the Southern Department
Employment potential - Low for cultivation
- High for processing
Main points - High demand in Europe for organic products
- Haiti is an important producer of mangoes for the US Market (it has 8 plants for thermo processing)
- High potential for reforestation and a positive ecological impact
- Potential to integrate with other crops
- Small producers do not appear to benefit from an income transfer.
- All donors support the mango sector.
Global appreciation - This sector offers the potential for development through the diversification of markets (other cities in the USA), EU and other markets, and by the transformation of the product. However, even though the sector has received sustained aid from donors in recent years, it is unable to develop to its full potential, and producers do not appear to have benefited from it.
- So far, exporters have not developed an inclusion relationship with the mango producers (except the one who is position as organic and fair trade). Rather there is a dichotomy, a break between production and export markets that prevents the sector from developing to its full potential. This gap does not facilitate the search for management alternatives to very small farms in order to facilitate logistics efficiency, reduce post-harvest losses through better organization and extensive processing markets. Without a win-win strategy between the producer and the exporter, the gains made in the sector seem to benefit the exporters at the expense of the producers, who bear all the challenges of the sector.
Enablers and drivers
- Ministry of Agriculture, of Natural Resources and Rural Development (MARNDR)
- Ministry of Commerce and Industry (MCI)
- National Council for Cooperatives
- Cooperative of mango producers
- Mango exporters – major companies Agropak, Perry Import Export, Agrotechnique
- Association Nationale des Exportateurs de Mangues (ANEM)
Several national actors and donors of international funds are investing in the development of the
mango sector in Haiti. These include:
- Canadian International Development Agency (CIDA), in the South and Grande Anse.
- USAID, various actions in the sector.
- French Development Agency (ADF)
- European Union

Investment Consulting Associates (ICA) 66 CFI Haiti Agro-industry Sector
- IICA
- Technoserve with the MIF.
- Catholic Relief Services (CRS), in the South.
Table 17: Targeted Agribusiness Matrix - Cocoa COCOA
Criteria
Value of appreciation according to indicators / factual information
Description / characteristics / comments
Insuf. Inform
Low/ Negative
Average High / Positive
Potential markets - Demand should be sustained at the international level over time - larger demand for fermented cocoa. Growing national market for cocoa varieties for fine chocolate.
- Very high in Europe and North America.
- The country is endowed with its own indigenous “criollo” variety prized for its exceptional flavour by high-end chocolatiers, pastry companies, and luxury chocolate brands.
Export ◆
Local ◆
Including substitution of
imports
◆
Competitive advantages ◆ - Cocoa varieties - criollo.
Actual markets - Lack of diversification of export markets.
- Main markets are USA 66%, Germany 17%, and Holland 8%.
- The main exporters are REBO, the Novella companies and the Geo Weiner S.A. house. Currently there are other companies that have joined the export market such as SOGEPA and JL industry, as well as FECANO and Traditional Intermediary Cooperatives.
- Haiti cocoa exports were 9,66 million USD in 2016. Haiti exports only 4,000 metric tons of cocoa per year, a decline from its peak of 20,000 tons in the 1960s.
Exports ◆
Internal market ◆ - Chocolate.
- Lack of productivity - average of 150-200Kg / ha versus 400Kg / ha in the Region. The plants are quite old, produce little, and are practically not maintained by farmers.
Value chain organisation - High potential for organic production
- Good potential in processing (chocolate, cocoa butter)
- Some farmers have started marketing through cooperatives (at better prices), but most are still using traditional services offered by speculators and “Saras”.
- Prices paid by exporters discourage producers - on average 15 to 20% lower than the international market price.
- Lack of diversification of export markets.
Degree of organization and
bargaining capacity of
cooperatives and small
producer associations
◆
Number and bargaining
power of domestic buyers ◆
Number and bargaining
power of international
buyers
◆

Investment Consulting Associates (ICA) 67 CFI Haiti Agro-industry Sector
Number of SMEs in
manufacturing and services ◆
- Cooperatives are very fragile and have a very limited capacity to establish stable business relationships.
FDI interest ✓ - Some small European specialized chocolate
producers could be interested in being supplied directly from a special niche cocoa market.
- Investments potential for EU, Canadian and US companies.
Application and access of
producers to financing ✓ -
Potential scope for scaling up
for small producers and
SMEs
- 20,000 farmers
National ◆ - Cocoa is grown on low-lying hills, usually less than 500 meters tall, south and west of Cap-Haïtien, in the northern region and in the Grand Anse region in the southwest.
Regional ◆ -
Employment potential - High for cultivation
- Low for processing
Main points - The international market is growing with a long-term trend, mainly by the demand in North America and Europe for quality black chocolate - varieties from Latin America and the Caribbean.
- The biggest challenge for Haiti is to continue making progress in improving the quality of exported grain (through fermentation) and becoming a consistent and reliable supplier in niche and fair trade markets.
- To increase the productivity and investments in new tree plantations, an increase in the percentage of fermented beans, and further progress in the organization of the sector and fair trade agreements should be made.
Global appreciation - To improve the profitability of the export value chain of cocoa beans, it is necessary to improve collaboration between the various players in the sector, exporters, farmers, and cooperatives. Haiti needs to rely on an "integral quality strategy".
- Securing new international players who could bring technology, and an increase to the value added of the product, such as processing cocoa beans, liqueur and butter for export to Europe (more sophisticated market for Haitian criollo cocoa, - production of fine chocolates).
Enablers and drivers
Several national actors and donors of international funds are investing in the development of
the cocoa sector in Haiti. These include:
- Ministry of Agriculture, of Natural Resources and Rural Development
- Ministry of Commerce and Industry
- Ministry of Environment
- National Council for Cooperatives
- Local authorities of production zones
- Féderation des Coopératives Cacaoyères du Nord (FECCANO)
- Etablissements Novella
- Geo Wiener S.A.
- REBO – PISA

Investment Consulting Associates (ICA) 68 CFI Haiti Agro-industry Sector
- SOGEPA
- JL industry,
- FECANO
- Canadian International Development Agency (CIDA), in the South and Grande Anse.
- USAID, various actions in the sector
- The Swiss Cooperation
- The Catholic Relief Services (CRS) in Grande Anse and the north of the country.
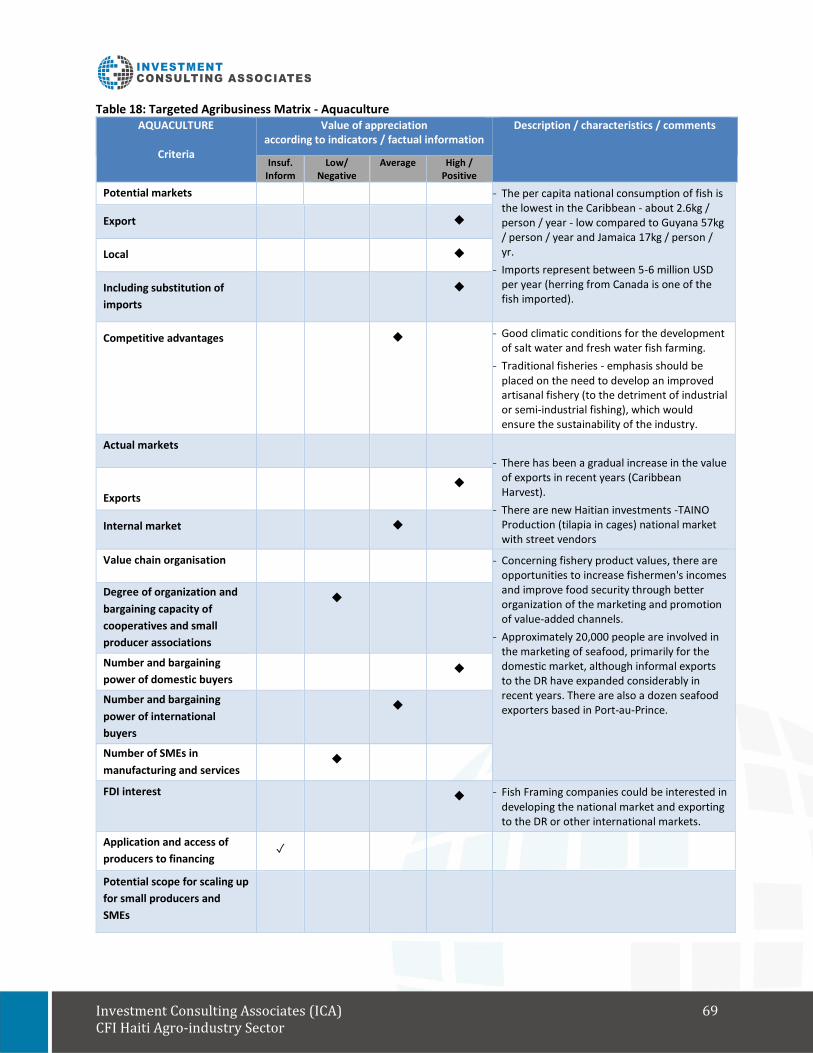
Investment Consulting Associates (ICA) 69 CFI Haiti Agro-industry Sector
Table 18: Targeted Agribusiness Matrix - Aquaculture AQUACULTURE
Criteria
Value of appreciation according to indicators / factual information
Description / characteristics / comments
Insuf. Inform
Low/ Negative
Average High / Positive
Potential markets - The per capita national consumption of fish is the lowest in the Caribbean - about 2.6kg / person / year - low compared to Guyana 57kg / person / year and Jamaica 17kg / person / yr.
- Imports represent between 5-6 million USD per year (herring from Canada is one of the fish imported).
Export ◆
Local ◆
Including substitution of
imports
◆
Competitive advantages ◆ - Good climatic conditions for the development of salt water and fresh water fish farming.
- Traditional fisheries - emphasis should be placed on the need to develop an improved artisanal fishery (to the detriment of industrial or semi-industrial fishing), which would ensure the sustainability of the industry.
Actual markets
- There has been a gradual increase in the value of exports in recent years (Caribbean Harvest).
- There are new Haitian investments -TAINO Production (tilapia in cages) national market with street vendors
Exports ◆
Internal market ◆
Value chain organisation - Concerning fishery product values, there are opportunities to increase fishermen's incomes and improve food security through better organization of the marketing and promotion of value-added channels.
- Approximately 20,000 people are involved in the marketing of seafood, primarily for the domestic market, although informal exports to the DR have expanded considerably in recent years. There are also a dozen seafood exporters based in Port-au-Prince.
Degree of organization and
bargaining capacity of
cooperatives and small
producer associations
◆
Number and bargaining
power of domestic buyers ◆
Number and bargaining
power of international
buyers
◆
Number of SMEs in
manufacturing and services ◆
FDI interest ◆ - Fish Framing companies could be interested in developing the national market and exporting to the DR or other international markets.
Application and access of
producers to financing ✓
Potential scope for scaling up
for small producers and
SMEs

Investment Consulting Associates (ICA) 70 CFI Haiti Agro-industry Sector
National ◆ - 52,000 fishing families in 420 localities.
Regional ◆ - In the secondary sector, machine manufacturers can lead to 5,000 jobs in the sector.
Employment potential - High for cultivation
- High for processing
Main points - Both traditional fishing and aquaculture in Haiti have good potential for development, both in the domestic production of cheap fish and in high value-added exports, and the development of rural areas and the increase of food security through national production. Also, it would be possible to substitute current fisheries product imports and to contribute to the recovery of the trade balance.
- At the level of aquaculture, MARNDR wants to develop the industry on a large scale. The goal is to produce 25,000 tons of fish annually to replace the current consumption of imported fish. The objective is to establish small farmers who will produce for the domestic market as well as larger scale operators who will produce for both the domestic market and the export market (MARNDR 2010).
Enablers and drivers
Several national actors and donors of international funds are investing in the development of the Aquaculture sector in Haiti. These include:
- Ministry of Agriculture, of Natural Resources and Rural Development
- Ministry of Commerce and Industry
- Ministry of Environment
- European Union
- Caribbean Harvest
- Timbo
- Clinton Foundation

Investment Consulting Associates (ICA) 71 CFI Haiti Agro-industry Sector
Table 19: Targeted Agribusiness Matrix - Sorghum SORGHUM
Criteria
Value of appreciation according to indicators / factual information
Description / characteristics / comments
Insuf. Inform
Low/ Negative
Average High / Positive
Potential markets - There can be an export market for BRANA once the industry is developed, but consistent volumes are needed; as o,f yet there is no export.
- Sorghum is a national consumption product, before rice, it was the food base for the people.
- Production of sorghum in Haiti was 126,000 tons (2011), grown on 150,000 ha, with an average production of 8,403 hg / ha (FAOSTAT).
- There are no imports of sorghum.
Export ◆
Local
◆
Including substitution of
imports
◆
Competitive advantages ◆ - In the Caribbean, Haiti dominates the production with 98% of the total production for the region (FAOSTAT).
Actual markets
- An estimated 1.5 million people consume sorghum, 33% of which live in urban areas.
Exports ◆
Internal market ◆
Value chain organisation - Producers are not organized. Depending on financial needs, they sell small quantities to rural Saras. The rural Saras distribute the product to urban Saras, who sell to retailers or directly to consumers. The number of Saras involved in the sorghum trade is estimated at 12,000
- Until the entry of Brasserie Nationale S.A. (BRANA), the number of participants involved in the distribution of sorghum was too large and there was no dominant actor in the market.
Degree of organization and
bargaining capacity of
cooperatives and small
producer association
◆
Number and bargaining
power of domestic buyers ◆
Number and bargaining
power of international
buyers
◆
Number of SMEs in
manufacturing and services ◆
FDI interest - BRANA brewery (Heineken) needs 160,000 tons.
- Other international players could be interested if the volume is there.
Application and access of
producers to financing ✓

Investment Consulting Associates (ICA) 72 CFI Haiti Agro-industry Sector
Potential scope for scaling up
for small producers and
SMEs
National ◆ - The production base of the sorghum sector is made up of about 200,000 farmers scattered throughout the country
Regional ◆ -
Employment potential - High for cultivation
- High for processing
Main points - Sorghum is the second most widely planted cereal in Haiti after corn. It is not imported. As of July 2010, sorghum has to pay an import tariff of 15%. Before this period, sorghum had no import tariff.
Global appreciation - The entry of BRANA in the sector can make it possible to better structure the sorghum sector. There is an increasing demand for the product, both for beverages as an alternative to imported malt, as well as in livestock and poultry breeding systems.
Enablers and drivers
Several national actors and donors of international funds are investing in the development of
the sorghum sector in Haiti. These include:
- Ministry of Agriculture, of Natural Resources and Rural Development
- Ministry of Commerce and Industry
- Ministry of Environment
- BRANA- Heineken
- USAID
- IDB-MIF
- Haiti Broilers

Investment Consulting Associates (ICA) 73 CFI Haiti Agro-industry Sector
Table 20: Targeted Agribusiness Matrix - Bananas and Plantains BANANAS AND PLANTAINS
Criteria
Value of appreciation according to indicators / factual information
Description / characteristics / comments
Insuf. Inform
Low/ Negative
Average High / Positive
Potential markets - It ambitions to deliver 160,000 tons of bananas in the next years.
- Very high % to Europe
- High % to the Bahamas and the Turks and Caicos
- High potential to replace imports from the Dominican Republic
- Internal market for plantain imports from the DR - substitution of more than 4.6 million USD (2015) or 88% of DR exports.
Export ◆
Local ◆
Including substitution of
imports
◆
Competitive advantages ◆ - Good climatic conditions.
- Can easily be positioned as organic and fair trade
Actual markets - Agritrans, in Trou du Nord, Northeast operates currently on 400 hectares and carries a project for 1,000 hectares.
- Already exporting to Germany, and holds a European organic certification for premium bananas.
- Two other companies in the Northern region are at the experimental stage, and are negotiating partnerships for export with the major Dominican exporters Bananamiel and Plantaciones del Norte.
- Three varieties of bananas are cultivated in Haiti: 60% French plantain, 35% Cavendish dessert banana, and 5% Bluggoe banana
Exports ◆
Internal market ◆
Value chain organisation - High potential for organic production
- Lack of diversification of export markets.
- Cooperatives are very fragile and have a very limited capacity to establish stable business relationships.
Degree of organization and
bargaining capacity of
cooperatives and small
producer associations
◆
Number and bargaining
power of domestic buyers ◆
Number and bargaining
power of international
buyers
◆
Number of SMEs in
manufacturing and services ◆
FDI interest ✓ ◆ - Dole, Bananamiel, Plantaciones del Norte.
Application and access of
producers to financing ◆
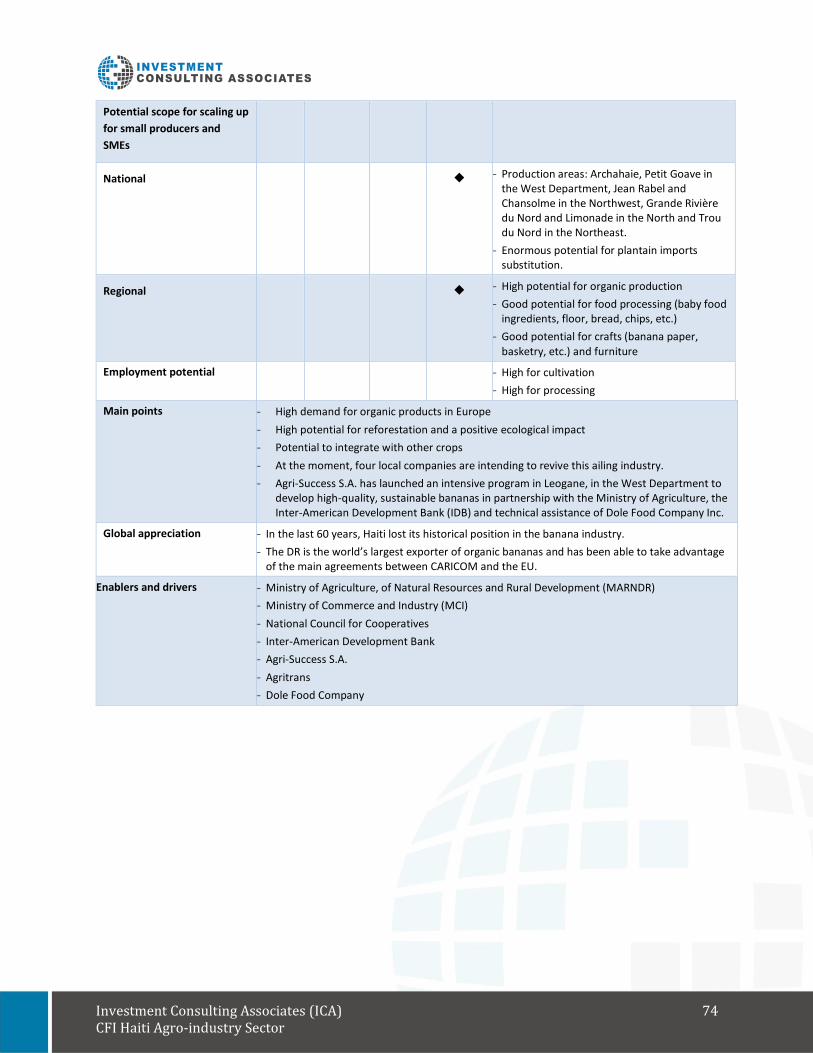
Investment Consulting Associates (ICA) 74 CFI Haiti Agro-industry Sector
Potential scope for scaling up
for small producers and
SMEs
National ◆ - Production areas: Archahaie, Petit Goave in the West Department, Jean Rabel and Chansolme in the Northwest, Grande Rivière du Nord and Limonade in the North and Trou du Nord in the Northeast.
- Enormous potential for plantain imports substitution.
Regional ◆ - High potential for organic production
- Good potential for food processing (baby food ingredients, floor, bread, chips, etc.)
- Good potential for crafts (banana paper, basketry, etc.) and furniture
Employment potential - High for cultivation
- High for processing
Main points - High demand for organic products in Europe
- High potential for reforestation and a positive ecological impact
- Potential to integrate with other crops
- At the moment, four local companies are intending to revive this ailing industry.
- Agri-Success S.A. has launched an intensive program in Leogane, in the West Department to develop high-quality, sustainable bananas in partnership with the Ministry of Agriculture, the Inter-American Development Bank (IDB) and technical assistance of Dole Food Company Inc.
Global appreciation - In the last 60 years, Haiti lost its historical position in the banana industry.
- The DR is the world’s largest exporter of organic bananas and has been able to take advantage of the main agreements between CARICOM and the EU.
Enablers and drivers
- Ministry of Agriculture, of Natural Resources and Rural Development (MARNDR)
- Ministry of Commerce and Industry (MCI)
- National Council for Cooperatives
- Inter-American Development Bank
- Agri-Success S.A.
- Agritrans
- Dole Food Company

Investment Consulting Associates (ICA) 75 CFI Haiti Agro-industry Sector
Table 21: Targeted Agribusiness Matrix - Coffee COFFEE
Criteria
Value of appreciation according to indicators / factual information
Description / characteristics / comments
Insuf. Inform
Low/ Negative
Average High / Positive
Potential markets - Very high % to Europe, North America and Japan
- Organic gourmet coffee.
- High potential for organic production
Export ◆
Local ◆
Including substitution of
imports
◆
Competitive advantages ◆ - At a broad level, the Haitian coffee industry is constrained by significant systemic problems, which have contributed to its decline over the past several decades. The industry has been disrupted by international factors such as exogenous prices and climatic shocks, as well as domestic factors including political crises, export taxes, a land tenure system which inhibits long-term investment, and low prices afforded to small farmers.
- However, the most critical factor affecting the coffee sector is the lack of on-farm investments, which has led to aging plantations, an increased incidence of plant diseases (including rust), and low yields.
Actual markets - The importance of coffee as an export crop for Haiti has continued to decline over the years. Coffee export has declined from 11 million USD in 2011 to 0,78 million USD in 2016.
- Another 28% of production is informally exported to the Dominican Republic through unregulated cross-border trade. The presence of Dominican traders provides an important market for farmers, but has led to increased competition with commercial roasters and cooperatives that must offer higher prices in order to compete. Lastly, the specialty coffee supply chain accounts for only about 2% of production. It produces high-quality washed coffee for export through a cooperative system that is responsible for collection, washing, drying, and transportation. Currently, 25 base cooperatives and three cooperative federations are active in the specialty supply chain.
- In contrast to exports, domestic consumption of coffee in Haiti is substantial and growing. Approximately 70% of coffee produced in Haiti is consumed domestically. Most of it
Exports ◆
Internal market ◆

Investment Consulting Associates (ICA) 76 CFI Haiti Agro-industry Sector
reaches consumers through an informal distribution network of small traders and artisanal roasters. However, the high-value commercial supply chain for coffee is expanding. It is relatively concentrated and dominated by two roasters, Rebo International and Geo-Wiener, who sell branded “café pile” locally and for export.
Value chain organisation - Most of Haiti's coffee is produced by smallholder farmers in “creole gardens66” less than two hectares in size. Natural coffee or “café pilé” is produced when cherries are harvested and directly dried under the sun for about four weeks, and is generally sold in the local market. Café pilé represents approximately 95% of the total coffee production in Haiti. Washed coffee is considered a specialty coffee that is produced when cherries are processed using special equipment and water to remove the pulp and skin, then dried to specific moisture levels. Washed coffee accounts for only 5% of national production.
Degree of organization and
bargaining capacity of
cooperatives and small
producer associations
◆
Number and bargaining
power of domestic buyers ◆
Number and bargaining
power of international
buyers
◆
Number of SMEs in
manufacturing and services ◆
FDI interest ◆ - Investment potential for Japanese and US companies.
- Current volumes do not justify.
Application and access of
producers to financing ✓
Potential scope for scaling up
for small producers and
SMEs
National ◆ - Demand for café pilé in the local market is increasing at a rate of 2-3% annually, largely driven by the Haitian middle class. Over the past few years, while international coffee prices have been volatile, prices in the local market have been more stable. Today, coffee farm gate prices can be more favourable than the international price.
Regional ◆ - Production areas: Beumont, Pestel, Corail, Roseaux, l’Asile, Baradères and Jérémie in the Southwest/Grande Anse; Tiburon, les Anlais and Rendel in the South; Thiotte, Belle Anse and Marigot in the Southeast; Baptiste and Savanette in the Centre; Les Cahos and Marmelade in Artibonite; Dondon, Plaisance, Pilate, Borgne, Grande Rivière du Nord, Bahon in the North; Saint-Louis du Nord, Port-de-
66 The creole garden is an agroforestry system utilizing a high density of trees (e.g. coffee, banana, citrus, yam, avocado, legumes and other food crops). It plays a dual role of promoting food security in rural areas, as well as restoring ecological balance and increasing forest cover in Haiti.
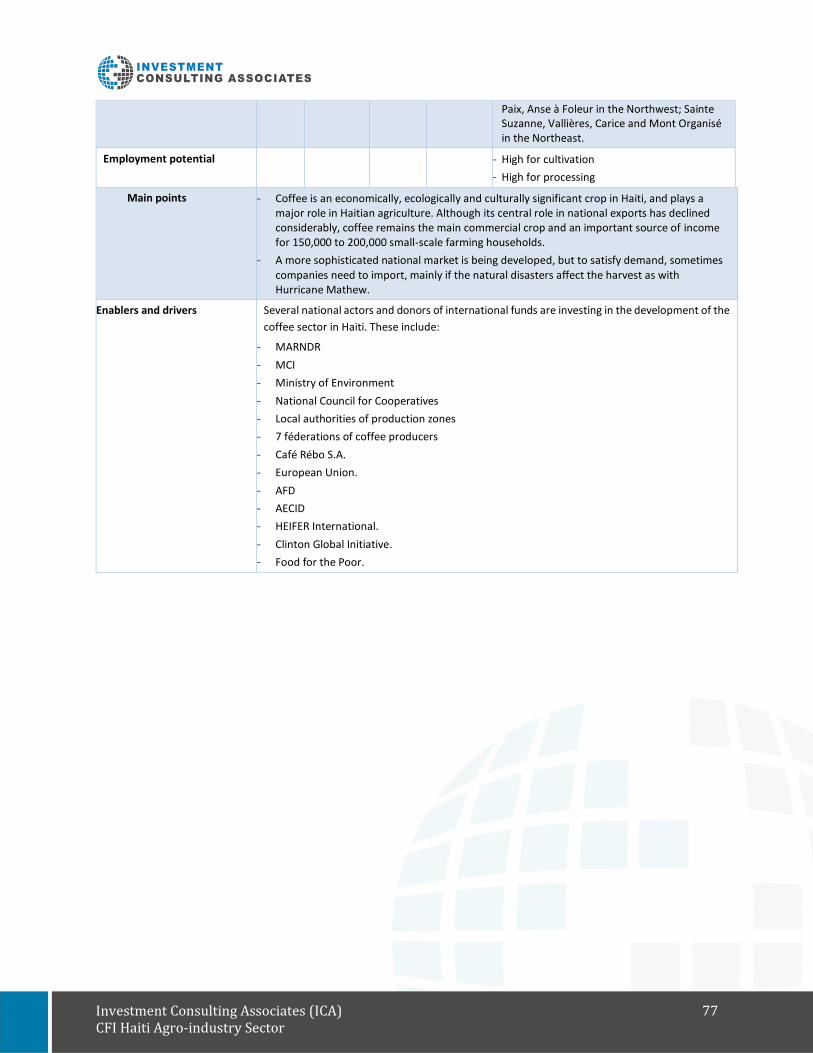
Investment Consulting Associates (ICA) 77 CFI Haiti Agro-industry Sector
Paix, Anse à Foleur in the Northwest; Sainte Suzanne, Vallières, Carice and Mont Organisé in the Northeast.
Employment potential - High for cultivation
- High for processing
Main points - Coffee is an economically, ecologically and culturally significant crop in Haiti, and plays a major role in Haitian agriculture. Although its central role in national exports has declined considerably, coffee remains the main commercial crop and an important source of income for 150,000 to 200,000 small-scale farming households.
- A more sophisticated national market is being developed, but to satisfy demand, sometimes companies need to import, mainly if the natural disasters affect the harvest as with Hurricane Mathew.
Enablers and drivers
Several national actors and donors of international funds are investing in the development of the
coffee sector in Haiti. These include:
- MARNDR
- MCI
- Ministry of Environment
- National Council for Cooperatives
- Local authorities of production zones
- 7 féderations of coffee producers
- Café Rébo S.A.
- European Union.
- AFD
- AECID
- HEIFER International.
- Clinton Global Initiative.
- Food for the Poor.

Investment Consulting Associates (ICA) 78 CFI Haiti Agro-industry Sector
Table 22: Targeted Agribusiness Matrix - Essential Oils ESSENTIAL OILS
Criteria
Value of appreciation according to indicators / factual information
Description / characteristics / comments
Insuf. Inform
Low/ Negative
Average High / Positive
Potential markets - Demand is expected to be sustained over the long term in the international market, and Haiti may gain some market share points, but the country must hold its leading position.
- Very good potential for Europe and North America for selected specialties, especially Vetiver and West Indian Lime
- Some potential for sales to spas and the wellness industry.
Export ◆
Local ◆
Including substitution of
imports
Competitive advantages ◆ - Haiti is the world's leading producer and exporter of vetiver oil.
- Haiti has a competitive advantage that seems well established in terms of product differentiation (entry limitation for potential competitors) and is recognize as the best product in the market mainly due to its soil particularities.
Actual markets - Essential oils are Haiti’s most valuable agro-industrial export. Haiti accounts for 60% of the share of the world's vetiver exports, with 250 tons annually, for more 20 million USD. Haiti is also the only producer and exporter of amyris oil. It also produces neroli oil in the North, an essential oil produced from the blossom of bitter oranges. Essential oil exports reached 23,71 million in 2016.
- The differentiation advantage is realized on the international market: Haiti is the world leader, and its essential oil production is researched by major international flavour and fragrance groups.
Exports ◆
Internal market ◆
Value chain organisation - The market structure is characterized by the historical / sustainable control of a very small number of domestic buyers (four to five currently, including one dominant) who distil the roots into essences.
- There are currently some new players joining the vetiver value chain. Their approach is more inclusive for the small producers - a win-win strategy.
Degree of organization and
bargaining capacity of
cooperatives and small
producer associations
✓ ◆
Number and bargaining
power of domestic buyers ◆
Number and bargaining
power of international
buyers
◆
Number of SMEs in
manufacturing and services ◆
FDI interest ✓ ◆ - Takasago, Givaudan, Firmenich, Symrise, IFF,
others

Investment Consulting Associates (ICA) 79 CFI Haiti Agro-industry Sector
Application and access of
producers to financing ◆
Potential scope for scaling up
for small producers and
SMEs
National ◆
Regional ◆ - 20 000 producers
- Vétiver essential oils in Cayes, Camperrin in the South and Port-au-Prince in the West.
- Amyris oil in Port-au-Prince in the West. Bitter orange oil in Cap-Haitien.
Employment potential - High for plantation labor, harvesting and collection
- Skilled labor required for distillation
- Skilled labor required for formulation
Main points - Until now, small producers do not appear to benefit from an income transfer. New players are still developing an inclusive strategy with long-term perspectives.
- Value added potential
- Very good potential for ingredient manufacture
- Some potential for finished product manufacture
- Interior design products from vetiver grass
Global appreciation Foreign investment
- Investment potential from EU, Canadian and US fragrance and flavour companies
- Grand Marnier Lapostolle investment in the North in bitter orange plantation and processing
- Social investment of Givaudan, Firmenich, International Flavors and Fragrances and Unilever in the South in vetiver production zones
- FDI could be a good opportunity for new players to expand their market.
- Investors need to be partner with Haitians.
- Aromatic plant farms
- Wild harvesting and collection sites
- Harvesting of vetiver, bitter orange, lime, amyris, ylang ylang, citronella,
- Drying and packing of dried peels and plant parts
- Distillation of essential oils,
- Alcohol extraction from ingredients
- Fragrance ingredient formulation
- Small scale production of finished aromatherapy products
Enablers and drivers
Several national actors and donors of international funds are investing in the development of the
essential oils sector in Haiti. These include:
- Ministry of Agriculture, of Natural Resources and Rural Development
- Ministry of Commerce and Industry
- Ministry of Environment
- National Council for Cooperatives
- Cooperative of vetiver producers
- Association des Producteurs d’Huiles Essentielles du Sud (APHES)

Investment Consulting Associates (ICA) 80 CFI Haiti Agro-industry Sector
- Unicors S.A.
- Agri-Supply/Fragers S.A.
- Caribbean Fragrances and Flavors
- Les Essences NIDO
Table 23: Targeted Agribusiness Matrix - Poultry and Eggs
POULTRY AND EGGS
Criteria
Value of appreciation according to indicators / factual information
Description / characteristics / comments
Insuf. Inform
Low/ Negative
Average High / Positive
Potential markets - Export to the Bahamas and the Turks and Caicos
- Long term potential for Kosher and Halal chicken meat to the US
- The exact production of poultry and eggs is not well known, but remains largely insufficient to satisfy national demand.
Export ◆
Local ◆
Including substitution of
imports
◆
Competitive advantages - Difficult with no entry barriers and a high level of contraband – undeclared merchandise.
Actual markets - The market is characterized by a very strong domestic demand for eggs (1 million eggs are imported from the DR on the black market per day), and poultry meat is satisfied by imports (formal and informal) at very competitive prices.
- Formal imports of chicken meat totalize 74.7 million USD, or 6.3% of the total food imports with 70.3 thousand tons - a variation of 456.2% of the import value for the period of 2004-2013.
- From 2006 to 2011, the import of frozen chicken pieces increased from 18.54 million USD to 62 million USD, an increase of 70% over five years.
- The egg market is fed by local production, and estimated at about 50,000 layers producing about 1.2 million eggs / month. Imports from the DR and the USA are estimated at nearly 40 million / month.
- Five percent (5%) of the consumed poultry products are locally produced; the remaining ninety-five percent (95%) is imported from the USA or DR.
- From 2010 to 2016, Haiti’s egg production has increased from 50,000 laying hens to 250,000. Haiti imports 360 million eggs and 12, 5 million chickens, mostly from the US and the DR, while producing 1.8 million chickens and 20.16 million eggs.
Exports ◆
Internal market ◆

Investment Consulting Associates (ICA) 81 CFI Haiti Agro-industry Sector
Value chain organisation - There are five players involved in the importation of frozen products.
- There are three industrial companies in Haiti: IMBA, Haiti Boilers and Ti Moulin.
- There is a new investment in a slaughterhouse with a capacity of 30,000 chickens per day. There are five constant producers of 25,000 – 30,000 chickens, including Haiti Broilers S.A., a subsidiary of Jamaica Broilers.
- Another category is comprised of 125 producers with a capacity of 5,000 – 10,000 chickens, and another one comprising of small farmers producing fewer than 5,000.
Degree of organization and
bargaining capacity of
cooperatives and small
producer associations
◆
Number and bargaining
power of domestic buyers ◆
Number and bargaining
power of international
buyers
◆
Number of SMEs in
manufacturing and services ◆
FDI interest ◆ - Large investments are made in the production of poultry inputs, chicks, food.
- Private investments are being pursued by national and multinational firms who perceive a business opportunity in an unsatisfied national market, who possess the technology and know-how in the industry, and who can reverse this dependence on imported poultry products. Haiti Boilers (foreign investment - Jamaica), and FACN (Taiwanese cooperation).
- Jamaica Broilers invest in Haitian facilities (Haiti Broilers), but informal imports and lack of entry barriers discouraged them.
- Brasil Foods, one of the region’s largest poultry producers, has a strong interest in investing in Haiti for the local market and export to the US in the long term.
- Some other investors could be interested in the Haitian market, but they need market protection.
Application and access of
producers to financing ✓
Potential scope for scaling up
for small producers and
SMEs
National ◆ - There are 125 chicken farmers in Haiti - 74.9% of chicken farms.
Regional ◆ - Are gathered in three geographical departments: the West, the South, and the South-East. The remaining 24.1% consists mainly of new breeders with operations that are fewer than five years old.
Employment potential - High for processing - very labour intensive industry – hence a good prospect for employment
- Very high % of micro and SME businesses

Investment Consulting Associates (ICA) 82 CFI Haiti Agro-industry Sector
- High for agriculture for feed raw materials
Main points - Five percent (5%) of the consumed poultry products are locally produced; the remaining ninety-five percent (95%) is imported from the USA or the DR.
- Lack of standards and standardization of imported products.
- Lack of entry barriers for imports given that these are strategic products for the country.
- Industry without regulation - wild deregulation, produced by dumping.
- Technological inadequacy.
Global appreciation - Large investments are made in the production of poultry inputs, chicks, food. Private investments are being pursued by national and multinational firms who perceive a business opportunity in an unsatisfied national market, who possess the technology and know-how in the industry, and who can reverse this dependence on imported poultry products.
Enablers and drivers
Several national actors and donors of international funds are investing in the development of
the poultry sector in Haiti. These include:
- Ministry of Agriculture, of Natural Resources and Rural Development
- Ministry of Commerce and Industry
- Ministry of Environment I
- Haiti Broilers
- IMBA
- Ti Moulin
- JAVEC Ferme Agricole
- Ele Haiti
- SAPEN S.A.
- Association des Producteurs Avicoles du Grand Nord (APAGNO)

Investment Consulting Associates (ICA) 83 CFI Haiti Agro-industry Sector
Table 24: Targeted Agribusiness Matrix - Rice RICE
Criteria
Value of appreciation according to indicators / factual information
Description / characteristics / comments
Insuf. Inform
Low/ Negative
Average High / Positive
Potential markets - No export potential, great national potential.
- Consumption of 580,000 tons per year.
- Imports in 2013 totalized 424.5 tons amounting to 277.9 millions USD, or 22.9% of total food imports (number one imported product). For the 2004-2013 period, import value has varied by more than 162.5%.
Export ◆
Local ◆
Including substitution of
imports
◆
Competitive advantages ◆ - Difficult with no entry barriers and high level of contraband – undeclared merchandise.
- The relatively high level of production costs is mainly due to input prices (23 to 30% of the total cost), labour for soil preparation activities (16 to 21%), and for transplanting (15%).
Actual markets
- Its annual production (FAOSTAT) for 2011 was around 115,000 tons, which corresponds to 19.7% of the domestic consumption.
Exports ◆
Internal market ◆
Value chain organisation - Low prices paid to producers resulting in low profitability of cultivation and lower income. The marketing of rice is completely out of the reach of producers, who have very low bargaining power.
- Very low entry barriers (decrease in customs tariffs from 50% in 1995 to 3% in 2013 ).
- Instead of competing among themselves, the main importers of agricultural products from Haiti often agree on prices.
Degree of organization and
bargaining capacity of
cooperatives and small
producer associations
◆
Number and bargaining
power of domestic buyers ◆
Number and bargaining
power of international
buyers
◆
Number of SMEs in
manufacturing and services ◆
FDI interest ◆ - No foreign investment initiatives.
Application and access of
producers to financing ✓
Potential scope for scaling up
for small producers and
SMEs
National ◆ - Economically, it is the main source of income for more than 130,000 households, 80,000
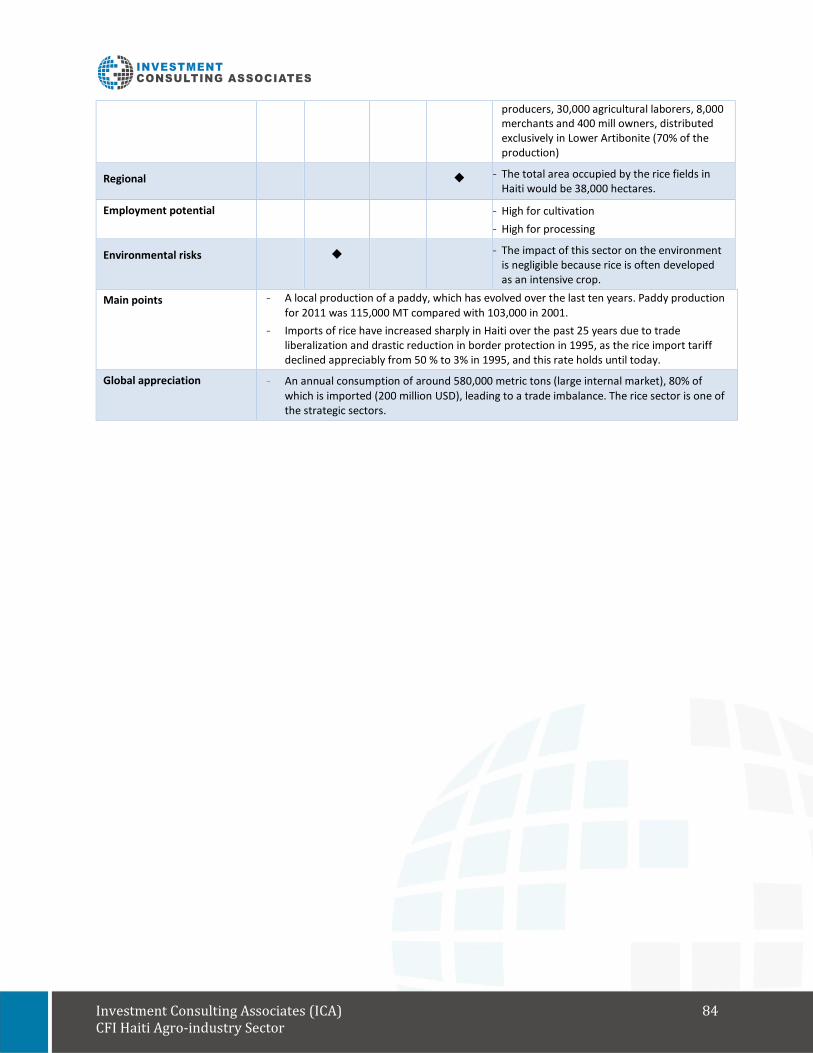
Investment Consulting Associates (ICA) 84 CFI Haiti Agro-industry Sector
producers, 30,000 agricultural laborers, 8,000 merchants and 400 mill owners, distributed exclusively in Lower Artibonite (70% of the production)
Regional ◆ - The total area occupied by the rice fields in Haiti would be 38,000 hectares.
Employment potential - High for cultivation
- High for processing
Environmental risks ◆ - The impact of this sector on the environment is negligible because rice is often developed as an intensive crop.
Main points - A local production of a paddy, which has evolved over the last ten years. Paddy production for 2011 was 115,000 MT compared with 103,000 in 2001.
- Imports of rice have increased sharply in Haiti over the past 25 years due to trade liberalization and drastic reduction in border protection in 1995, as the rice import tariff declined appreciably from 50 % to 3% in 1995, and this rate holds until today.
Global appreciation - An annual consumption of around 580,000 metric tons (large internal market), 80% of which is imported (200 million USD), leading to a trade imbalance. The rice sector is one of the strategic sectors.

Investment Consulting Associates (ICA) 85 CFI Haiti Agro-industry Sector
Appendix 2 –Best Practice Case Studies
16.1 Organic banana cluster – Dominican Republic
World market tendencies
Bananas are the world’s most popular fruit and one of the world’s most important staple foods. In 2011,
107 million metric tons of bananas were produced in more than 130 countries, for a total trade value of
9 billion USD (FAO 2013). Worldwide, organic bananas have had an especially strong growth since the
early 2000s, although it has recently somewhat decreased.
Banana plantations are increasingly dependent on agrochemicals, which has led to concerns regarding
consumer and worker health and safety. It is in the context of these sustainability concerns that voluntary
sustainability standards, including fair trade, organic and rainforest alliances, have emerged over the past
few decades.
Dominican Republic
The Dominican Republic (DR) is currently the largest producer of organic bananas worldwide, representing
more than 29% of the world’s organic banana production, followed by Ecuador (25%) and Peru (15%). In
2015, the DR had an estimated 12,000 hectares of organic bananas, and exported more than 240,000 MT
(more than 150 million USD).67 More than 60% of the total DR banana exports were organic, produced by
more than 1,000 certified growers. Banana production is concentrated in the Northwest provinces of
Valverde (majority of medium and big producers), Monte Cristi, and the Southern provinces of Azua
(majority of small producers) and Barahona.
For the period of 2001-2011, the banana production in the Dominican Republic has grown at an annual
average of 7%. For the same period, the DR shows a 17% annual average growth rate in exports value,
which is twice as high of that recorded by the rest of the world (8%).68 The average growth rate recorded
by organic banana exports was at an annual rate of 11%. During the 2002-2011 period, the Dominican
Republic exported a total of 2,089,009 MT, 53% of which was organic.
Exports to Haiti. For the 2006-2015 period, the DR plantain exports to Haiti represented an average of
76% of the total exports. In 2015, the total exports from the DR to Haiti represented 9,3 million kg or 5,32
million USD.
Trade agreements
The Dominican Republic has been a beneficiary of the preferential agreements of the European Union
(EU) since its incorporation to the Lomé IV Convention together with Haiti in 1989. This agreement
established a regime of trade preferences and development cooperation in the relations of European
nations with their former colonies in Africa, the Caribbean and the Pacific (ACP). The EU has provided non-
67 Potts, J., Lynch, M., Wilkings, A., Huppe, G., Cunningham, M., Voora, V. 2014. The state of sustainable initiatives
review 2014: Standards and the Green Economy. 68 Ministerio de Agricultura. Sector Bananero Dominicano. Desempeno del sector y estatus del régimen de importacion de la Union Europea. Abril, 2013.

Investment Consulting Associates (ICA) 86 CFI Haiti Agro-industry Sector
reciprocal trade preferences to ACP countries for a number of products, including bananas, from 1989 to
2008.
In 2008, the Economic Partnership Agreement (EPA) was signed between the Forum of Caribbean ACP
States (CARIFORO) and the state members of the European Union. The EPA replaced the EU's unilateral
preference scheme with the African, Caribbean and Pacific (ACP) bloc under the Cotonú Agreement. That
established, among others, that agricultural goods originating in the CARIFORO States have duty-free and
quota-free access to the European market
The EPA trade preferences with the European Union has allowed the DR to take advantage of the
agreement, in order to position itself as a world leader in organic banana exports. Therefore, the main
markets in 201569 were: the United Kingdom (48% of the exports), Belgium (7%), Spain (7%), Germany
(5%), and Holland (5%). Unlisted States in 2015 represented 2% of DR banana market.
National Competitiveness Council support to the banana cluster
During 2006, the Dominican Government asked the National Competitiveness Council (CNC) to prepare
the National Systemic Competitiveness Plan (NSCP), which included the detailed diagnoses and strategic
proposals for competitiveness of the country's main productive sectors. The cluster’s figure is absolutely
essential within the NSCP as the model of productive development in which companies and industries
come together to face the competition of the globalized world, and increase the competitiveness of their
economic activity.
Under this principle, the CNC created the banana cluster through the Productive Banana Group
(COPROBANA), which regroups all of the companies and actors in the banana sector. From 2008,
COPROBANA continuously updated the banana business strategy, developing action plans in conjunction
with the CNC. This joint coordination work has facilitated and allowed for the rapid and consistent
development of the sector.
Dominican Republic comparative advantages
The Dominican Republic has significant comparative advantages when compared to its Latin American
competitors. The main comparative advantages are:
On the demand side:
› Trade Agreements:
• Member of the Economic Partnership Agreements of the Caribbean countries with the
European Union - EPA's;
• The only Hispanic country to be a member of cooperation between the countries of Sub-
Saharan Africa, the Caribbean and the Pacific (the ACP countries) and the European
Community (EC) with tariff preferences from 1989 to 2008;
• DR-CAFTA signatory with the US;
• Signatory of the Free Trade Agreement with Central America;
69 Source: Dominican Republic Export and Investment Center (CEI-RD).
Investment Consulting Associates (ICA) 87 CFI Haiti Agro-industry Sector
• In negotiation: FTA with Canada and Mexico.
› International recognition as a leading country in organic banana production and fair trade.
› Ethnic market in the US.
› Domestic market: A strong demand in the domestic market both for Dominican consumers and
tourists.
On the supply side:
› High degree of organic and fair trade certification;
› Competitive shipping costs.
The main competitive advantages that the DR has developed during the last decades include:
› Delivery capacity: Faster supply than competitors to the main markets. Cargo shipments by sea
from the DR arrive 4/5 days earlier to Europe, compared to its main Latin American competitors.
› Infrastructure: The existing infrastructure in the country for export development with ports,
airports and roads is adequate or superior to its main competitors in Latin America.
› Product: Ability to produce a product with differentiated flavour (promote Caribbean island
origin), certified organic and/or fair trade.
› Country image: Perceived image of the Dominican Republic as a supplier of organic products.
› Tariff preferences in the EU and the US.
Lessons learned from the Dominican Republic organic banana
The organic banana in the Dominican Republic shows a case in which the government, through the
National Competitiveness Council, in first instance acted as a facilitator of the banana sector with different
actors networking in the DR, also as a catalyst of the dynamic comparative advantage and as a
strengthening institution, creating an efficient incentive structure to remove systemic and market
inefficiencies.
Notwithstanding being a relatively small player in the global banana market, the Dominican Republic
stands out as its most important source of organic bananas, and is therefore a useful demonstration of
common implementation methods, positioning itself in a promising niche market, and taking advantage
of the trade agreements and free access of tariff and quota to the European market.

Investment Consulting Associates (ICA) 88 CFI Haiti Agro-industry Sector
16.2 The Berimbau Project - Brazil
Linking Agriculture to Tourism Market
Many developing countries including the Caribbean are focusing on tourism as a means for economic
growth. In order for tourism to contribute to the local economy, improve rural livelihoods and alleviate
poverty, it has to develop linkages with different sectors such as agriculture. Linking tourism to agriculture
can reduce foreign exchange leakages. As such, tourist hotels should purchase local food as opposed to
importing it. For decades, research has found farmer–hotel supply chain relationships to be weak resulting
in economic leakages due to high food importation in support of the tourism sector.
A consistent theme among many tourism and agriculture stakeholders involves the need to strengthen
tourism and agricultural linkages and develop a strong local and regional market for agricultural products
serving the tourism sector.
The Berimbau Project
A good example of a community-based initiative can be found in the northeastern Brazilian region of Bahia,
once an area totally reliant on agriculture for jobs and income. 70 Capitalizing on its rich heritage and
natural landscapes, the region developed a thriving tourism industry. The Berimbau community-based
tourism project started in 2003, with the partnership of four TNC hotels, the UNCTAD/WTO International
Trade Centre, the Bank of Brazil Foundation, a holiday resort manager (Condominio Costa do Sauipe,
Bahia), and local communities in the Bahia region of Brazil. When the International Trade Centre’s Export
Led Poverty Reduction Programme (EPRP) Berimbau project started, there was only one large tourist
resort in place, the Condomino Costa do Sauipe resort. The aim was to get poor communities in the area
more involved in the tourism activities around this resort for employment and income generation.
Costa do Sauipe is a “quality tourism” resort in the heart of an environmentally protected region of Brazil,
70 km from Bahia's capital, Salvador. In fact, Costa do Sauípe is a very upscale tourist complex. Equipped
with resort and luxury hotels as well as various shops (bars, restaurants), only the access to the beach by
the beach remains free.
This development, however, had still left 54% of the local community without regular income. Some 45%
of adults are illiterate and among the working population, 23% earn less than the national minimum
monthly wage. As a development, therefore, it has lacked community support.
The main lesson drawn from the EPRP Berimbau project is that local communities must be at the centre
of any technical assistance programme to make it successful. It is vital that the momentum for change
comes from the people who are to be impacted by the project, especially in the decision-making process,
as the results will remain with them when the programme is finished.
70 UNCTAD, 2014: “Enhancing sustainable tourism, clean production and export capacity in Lao People’s Democratic Republic”.

Investment Consulting Associates (ICA) 89 CFI Haiti Agro-industry Sector
The Berimbau project took the following steps:
› Identification of community associations, whether functioning or not;
› Identification community leaders: who they were, what they were doing, level of representation,
life history;
› Invited community associations and leaders to local events;
› Organized several meetings with small groups of community leaders to explain, simply, what and
how Berimbau intended to do without creating false expectations; and
› Expanded the group of leaders.
The relationship with the communities was based on the following principles:
› Transparency and sincerity: not promising more than could be feasibly achieved;
› Action: fewer speeches and more action, quickly taking up real interest and discouraging self-
centred requests;
› Awareness: championing Berimbau’s raison-d’etre to be in the interests of the whole population
– the improvement of living conditions and integrated and sustainable local development; and
› Capacity building: activities for the local population.
The benefits experienced by over 7,000 people (including 3,500 women) in eight communities were
substantial. These benefits came about not only thanks to the EPRP project, but also to the wider
Berimbau programme, which included improvements in local infrastructure, education, cultural heritage,
job creation, and living standards, including:
› Establishment of a rural producer cooperative (fruits, vegetables and crafts) with direct sales to
the Costa do Sauipe resort;
› Construction of a handicrafts shop in Costa do Sauipe;
› Raised average monthly income of artisans (mostly women) from 40 USD to 250 USD; and
› Setting up of an organic waste recycling plant.
Lessons learned from the Brazil agriculture tourism linkage
Following its success in boosting local procurement and domestic enterprise development, other tourism
resorts have entered the region, helping to raise the incomes of traditionally poor communities and
reducing the level of unemployment from 30 per cent to less than 5 per cent. Perhaps even more
importantly for the long-term, attendance at primary school has increased eightfold.71
Berimbau is located in the northeastern region of Bahia, an area once totally reliant on agriculture for jobs
and income. Following the entry of the Sofitel (French TNC), Marriott (United States), Renaissance (also
part of the Marriott chain) and Super Clubs Breezes (Jamaican TNC) hotels, it has now become a thriving
tourism destination. With a combined capacity of 1,600 rooms in the four hotels, the resort has become
both the principal source of tourism in the region, and the largest single employer.
71 United Nations Conference On Trade And Development. FDI in Tourism: The Development Dimension Box IV.3. Boosting local procurement – the Berimbau project

Investment Consulting Associates (ICA) 90 CFI Haiti Agro-industry Sector
Initial meetings with communities and the resort’s four hotels revealed a lack of know-how on how to
create viable business linkages between the hotels and the communities. Opportunities were identified
through a demand survey to assess the supply needs of the resort’s four hotels, a community census and
agro-industry research. Training workshops involved 40 community leaders, NGO representatives and
other social agents, including the TNC hotels. Seven tourism supply chains were identified in which local
communities could feasibly participate: fruit and vegetable production, fisheries, organic waste recycling,
soaps and shampoos, textiles, artisan products and cultural activities.

Investment Consulting Associates (ICA) 91 CFI Haiti Agro-industry Sector
Appendix 4 – Mission Report CARLOS PUIG ESTEVE
MISSION REPORT
19th to the 29th June 2017
During the mission the consultant has carried out the following activities:
1. Coordination meeting with the Inter-American Bank, CFI, Wavteq, Tibidabo Ventures to discuss the
progress of the different consultancies and the presentation that had to be made to the President
of the Haiti Republic.
2. Interviews with the main actors of the private and public sectors in the tourism and agribusiness
value chains, with the objective to collect their perception concerning: the industry, business
climate, experience been working with public institutions, investment obstacles, opportunities and
recommendations.
3. Mapping presentation of existing programs and projects in Haiti to support the entrepreneurship.
Meeting coordination with the Donors relative to the private sector Development.
Meetings carried out during the mission:
GOVERNMENT:
CENTRE DE FACILITATION DES INVESTISSEMENTS (CFI)
− Tessa Jacques, Directrice Générale
− Didier Jean, Coordinateur du programme BID-HA-L0178 UNITE DE PROMOTION DES INVESTISSEMENTS DANS LE SECTEUR AGRICOLE (UPISA)
− Carl Monde, Coordinator FONDS DE DÉVELOPPEMENT INDUSTRIEL (FDI)
− Edgard Jeudry, Directeur Général
− Pierre Charles Lubin, Directeur des Opérations
DONORS:
INTER-AMERICAN DEVELOPMENT BANK (IDB)
− Rafael Juliá, Unité de Commerce et Investissements
− Salim John Loxley, CMF
− Bruno Jacquet, RND
− Jean Kawala, INO
− Ralph Denizé, MIF
− Paolo Desalvo, RND CANADIEN EMBASSY

Investment Consulting Associates (ICA) 92 CFI Haiti Agro-industry Sector
− Karine Pleau, Premier Secrétaire (Coopération) WORLD BANK
− Maria Kim, Spécialiste du Développement du Secteur privé, Commerce et Compétitivité
− Jean Emmanuel Desmornes, Operations Officer, Trade and Competitiveness EUROPEAN UNION DELEGATION
− Vincent Durruty, Attaché de Coopération, Section Développement Rural/Commerce/Intégration Régionale, Point Focal Commerce
UNITED NATIONS DEVELOPMENT PROGRAM (UNDP)
− Rita Schiara, Cheffe de l’Unité de Réduction de la Pauvreté USAID
− James Gilman, Office Chief Economic Growth
AGROINDUSTRY SECTOR:
BARBANCOUR
− Delphine Gardere, General Manager
− Alain Lafalaisse, financial Manager BRANA
− Wietse Mutters, General Manager Director
− Regine Rençe Labrouse, Public Affairs Manager GEOWIENER
− Theo Wiener
− Geffrey Wiener HAITI ORGANIC FUELS ENTREPRISE S.A. (HOFE)
− Louis C. Germain, CEO
− Kerby Compère, Financial Manager
− Martine Chatugne, Consultant
− Jean Amos, Civil engineering
− Jean Robert Germeil, Agronomic LES ESSENCES NIDO
− Dominique Jean, CEO REBO & PISA – PRODUITS DES ILES,
− Gilbert Gonzales, President, CEO PERRY IMPORT-EXPORT
− Mathias Perry
TOURIST SECTOR:
ASSOCIATION TOURISTIQUE HAITI
− Valerie Louis, Executive Manager ROYAL DECAMERON INDIGO BEACH RESORT & SPA,

Investment Consulting Associates (ICA) 93 CFI Haiti Agro-industry Sector
− Christian Roy Fombrun, Commercial Director
− Beatrice Nadal Mevs, Présidente ATH (Association Touristique d'Haiti) KARIBE HOTEL,
− Richard Buteau, General Manager MARRIOTT HOTEL,
− Vanessa Heyfiger-Degraff, Sales Manager MOULINS SUR MER HOTEL,
− Charles Fombraun, president NH EL RANCHO HOTEL
− José Garcia Lima, General Manager WAHOO BAY BEACH CLUB & RESORT,
− Genevieve Lemke, Director,
− Reagan Cetoute, Supervisor manager
OTHER HAITIAN PLAYERS:
SOCIÉTÉ FINANCIÈRE HAÏTIENNE DE DÉVELOPPEMENT (SOPHIDES)
− Serge Richard Petit-Frère, Directeur du Marketing et de la Qualité CHAMBRE DE COMMERCE DES FEMMES ENTREPRENEURS D’HAÏTI (CCFEH) –
− Daniella Jacques, Présidente
− Martine Theodore, CA
CONSULTANTS:
WAVTEC
− Andrew Thorburn
− Eusebe Muhikira TIBIDABO VENTURES
− Xavier Casares, President INVESTMENT CONCULTING ASSOCIATES (ICA)
− Tim Armstrong

Investment Consulting Associates (ICA) 94 CFI Haiti Agro-industry Sector
Appendix 5 – Raw Competitiveness Data72 Table 25: Competitiveness Analysis Raw Data - Regulations and Business Climate
Source: Investment Consulting Associates – ICA (2017) Table 26: Competitiveness Analysis Raw Data - Political Stability
Source: Investment Consulting Associates – ICA (2017)
72 Values marked with an * are a conservative estimate due to a lack of data.
Regulations and Business Climate Unit Source Year Haiti Dominican Republic Honduras Jamaica Mexico Nicaragua Panama Trinidad and Tobago
Ease of Getting Credit Rank (out of 189) World Bank Group - Doing Business 2017 175 101 7 16 5 101 20 44
Total Procedures to Register a Business Number of procedures World Bank Group - Doing Business 2017 12 7 11 2 8 6 5 7
Total Time to Register a Business Days World Bank Group - Doing Business 2017 97.0 14.5 13.0 10.0 8.5 13.0 6.0 10.5
Total Cost to Register a Business % World Bank Group - Doing Business 2017 219.3 16.3 31.1 4.3 19.1 68.0 5.8 0.6
Total Procedures to Construct a Business Number of procedures World Bank Group - Doing Business 2017 12 13 15 17 13 16 16 16
Total Time to Construct a Business Days World Bank Group - Doing Business 2017 80.0 184.0 89.0 129.5 81.0 207.0 98.0 253.0
Total Cost to Construct a Business % World Bank Group - Doing Business 2017 14.9 1.7 6.0 0.8 11.3 3.1 2.0 0.1
Getting Electricity Rank (out of 189) World Bank Group - Doing Business 2017 139.0 148.0 144.0 101.0 98.0 99.0 23.0 31.0
Enforcing Contracts Rank (out of 189) World Bank Group - Doing Business 2017 123 131 151 117 40 83 145 168
Resolving Insolvency Rank (out of 189) World Bank Group - Doing Business 2017 169 160 139 38 30 103 133 70
Strength of Legal Rights Score (0 to 12) World Bank Group - Doing Business 2017 2.0 1.0 9.0 9.0 10.0 1.0 7.0 7.0
Strength of Minority Investor Protection Score (0 to 10) World Bank Group - Doing Business 2017 2.0 5.3 4.3 5.8 6.0 4.0 5.7 6.0
Business Freedom Score (0 to 100)The Heritage Foundation - Index of
Economic Freedom 201749.4 52.8 56.9 78.9 70.7 59.0 74.4 67.7
Trade Freedom Score (0 to 100)The Heritage Foundation - Index of
Economic Freedom 201770.6 77.0 78.4 75.3 80.0 81.0 77.8 78.6
Political Stability Unit Source Year Haiti Dominican Republic Honduras Jamaica Mexico Nicaragua Panama Trinidad and Tobago
Freedom from CorruptionScore (0 to 100)
Transparency International -
Corruption Perceptions Index 201620.0 31.0 30.0 39.0 30.0 26.0 38.0 35.0
Public Institutions Score (1 to 7) WEF - Global Competitiveness Report2016
2.7 3.1 3.5 3.5 3.1 3.1 3.7 3.3
Political Violence Risk Score (1 to 6) AON - Political Risk Map 2017 4 3 4 4 2* 3 3 3
Legal and Regulatory Risk Score (1 to 6) AON - Political Risk Map 2017 6 5 5 3 2* 5 3 4
Political Interference Risk Score (1 to 6) AON - Political Risk Map 2017 6 3 4 3 2* 4 2 3
Human Rights & Rule of Law Score (1 to 10) Fund for Peace - Fragile States Index 2017 7.6 5.8 6.9 5.5 6.5 5.2 4.3 4.1
Security Apparatus Score (1 to 10) Fund for Peace - Fragile States Index 2017 7.7 5.8 7.3 6.9 8.4 5.6 5.4 6.3
External Intervention Score (1 to 10) Fund for Peace - Fragile States Index 2017 10 5.4 7.5 5.8 5.5 7.3 2.7 3.1

Investment Consulting Associates (ICA) 95 CFI Haiti Agro-industry Sector
Table 27: Competitiveness Analysis Raw Data - Macroeconomic Stability
Source: Investment Consulting Associates – ICA (2017)
Table 28: Competitiveness Analysis Raw Data - Fiscal and Cost Climate
Source: Investment Consulting Associates – ICA (2017)
Macroeconomic Stability Unit Source Year Haiti Dominican Republic Honduras Jamaica Mexico Nicaragua Panama Trinidad and Tobago
Macroeconomic EnvironmentScore (1 to 7) WEF - Global Competitiveness Report
20164.2 4.9 4.1 3.4 4.9 4.8 4.8 4.9
Efficiency of Financial MarketScore (1 to 7) WEF - Global Competitiveness Report
20162.5 3.4 3.6 3.4 3.4 3.1 4.6 3.4
Trustworthiness and Confidence of Financial MarketScore (1 to 7) WEF - Global Competitiveness Report
20163.0 3.7 5.2 5.4 5.1 3.6 5.3 4.7
Government Expenditure%
The Heritage Foundation - Index of
Economic Freedom 201725.2 18.1 29.1 27.4 27.9 25.3 23.8 37.6
Public Debt%
The Heritage Foundation - Index of
Economic Freedom 201730.4 34.3 47.4 124.3 54.0 31.2 38.8 51.1
Inflation%
The Heritage Foundation - Index of
Economic Freedom 20177.5 0.8 3.2 4.7 2.7 4.0 0.1 4.7
Government Spending Score (0 to 100)The Heritage Foundation - Index of
Economic Freedom 201781.0 90.2 74.7 77.5 76.7 80.8 83.1 57.7
Monetary Freedom Score (0 to 100)The Heritage Foundation - Index of
Economic Freedom 201773.8 76.7 77.3 79.5 78.8 71.2 78.4 75.9
Financial Freedom Score (0 to 100)The Heritage Foundation - Index of
Economic Freedom 201730.0 40.0 60.0 50.0 60.0 50.0 70.0 50.0
Exchange Transfer Risk Score (1 to 6) AON - Political Risk Map 2017 2 2 3 2 2* 2 2 2
Sovereign Non-Payment Risk Score (1 to 6) AON - Political Risk Map 2017 4 3 3 3 2* 3 3 3
Fiscal and Cost Climate Unit Source Year Haiti Dominican Republic Honduras Jamaica Mexico Nicaragua Panama Trinidad and Tobago
Tariff Rate %The Heritage Foundation - Index of
Economic Freedom 20177.2 6.5 5.8 7.3 5.0 2.0 6.1 5.7
Income Tax Rate %The Heritage Foundation - Index of
Economic Freedom 201730.0 25.0 25.0 25.0 35.0 30.0 25.0 25.0
Corporate Tax Rate %The Heritage Foundation - Index of
Economic Freedom 201730.0 27.0 25.0 25.0 30.0 30.0 25.0 25.0
Tax Burden %The Heritage Foundation - Index of
Economic Freedom 201713.2 13.8 20.6 25.5 19.7 21.9 15.2 24.7
Fiscal Health Score (0 to 100)The Heritage Foundation - Index of
Economic Freedom 201751.8 90.1 64.1 79.9 66.8 96.1 84.9 51.8
Mininum Wage USD/month World Bank Group - Doing Business 2016 137.23 311.87 453.73 229.40 168.32 214.50 558.72 408.04
Electricity Cost USD/mwhour World Bank Group - Doing Business 2016 0.31 0.22 0.17 0.21 0.07 0.33 0.25 0.07
Water Cost USD/m3 FT Various 0.96 0.96 1.42 1.45 1.70 0.83 0.36 0.56
Cost of Industrial Space USD/sqft FT Various 53.00 72.50 35.87 110.50 64.44 43.02 124.50 188.00
Cost of Office Space USD/sqft FT Various 146.50 121.00 94.54 141.00 437.08 125.45 193.50 252.00
Social Security Obligations % of salary FT 2016 6.00 16.79 11.32 9.00 39.28 18.50 13.50 7.80

Investment Consulting Associates (ICA) 96 CFI Haiti Agro-industry Sector
Table 29: Competitiveness Analysis Raw Data - Proximity to Markets or Customers
Source: Investment Consulting Associates – ICA (2017) Table 30: Competitiveness Analysis Raw Data - Infrastructure and Logistics
Source: Investment Consulting Associates – ICA (2017)
Proximity to Markets or Customers Unit Source Year Haiti Dominican Republic Honduras Jamaica Mexico Nicaragua Panama Trinidad and Tobago
Investment Freedom Score (0 to 100)The Heritage Foundation - Index of
Economic Freedom 201740.0 75.0 65.0 80.0 70.0 65.0 75.0 60.0
Domestic Competition Score (1 to 7)WEF - Global Competitiveness Report 2015
3.3 4.3 4.3 4.6 4.2 3.9 4.8 4.5
Foreign CompetitionScore (1 to 7)
WEF - Global Competitiveness Report 20153.8 4.5 4.8 4.7 4.4 4.6 5.2 4.2
Foreign Market SizeScore (1 to 7)
WEF - Global Competitiveness Report 20153.0 4.3 4.0 3.4 6.0 3.9 4.4 4.2
Trading Across Borders Rank (out of 189) World Bank Group - Doing Business 2017 76 58 109 131 61 73 53 123
Infrastructure and Logistics Unit Source Year Haiti Dominican Republic Honduras Jamaica Mexico Nicaragua Panama Trinidad and Tobago
Transport InfrastructureScore (1 to 7) WEF - Global Competitiveness Report
20152.2 3.9 3.5 3.7 4.5 2.8 4.7 3.6
Customs Score (1 to 5)World Bank Group - Global Logistics
Performance 2016 1.7 2.39 2.21 2.37 2.88 2.48 3.13 2.38
Infrastructure Score (1 to 5)World Bank Group - Global Logistics
Performance 2016 1.47 2.29 2.04 2.23 2.89 2.5 3.28 2.34
International shipments Score (1 to 5)World Bank Group - Global Logistics
Performance 2016 1.81 2.67 2.58 2.44 3 2.5 3.65 2.31
Logistics competence Score (1 to 5)World Bank Group - Global Logistics
Performance 2016 1.68 2.68 2.44 2.31 3.14 2.55 3.18 2.28
Tracking & tracing Score (1 to 5)World Bank Group - Global Logistics
Performance 2016 1.56 2.63 2.53 2.38 3.4 2.47 2.95 2.28
Timeliness Score (1 to 5)World Bank Group - Global Logistics
Performance 2016 2.02 3.06 2.91 2.64 3.38 2.68 3.74 2.79
Supply Chain Risk Score (1 to 6) AON - Political Risk Map 2017 5 3 4 2 2* 4 2 2

Investment Consulting Associates (ICA) 97 CFI Haiti Agro-industry Sector
Table 31: Competitiveness Analysis Raw Data - Technology and Innovation
Source: Investment Consulting Associates – ICA (2017)
Table 32: Competitiveness Analysis Raw Data - Skilled Workforce Availability
Source: Investment Consulting Associates – ICA (2017)
Table 33: Competitiveness Analysis Raw Data - Domestic Market Growth Potential
Source: Investment Consulting Associates – ICA (2017)
Technology and Innovation Unit Source Year Haiti Dominican Republic Honduras Jamaica Mexico Nicaragua Panama Trinidad and Tobago
IT Network InfrastructureScore (1 to 7)
WEF - Global Information Technology
Report 20161.1 3.7 3.1 3.2 3.7 3.5 4.4 5.2
IT Network AffordabilityScore (1 to 7)
WEF - Global Information Technology
Report 20163.5 4.2 4.9 5.4 5.7 1.9 6.1 5.9
Business IT UsageScore (1 to 7)
WEF - Global Information Technology
Report 20162.8 3.5 3.9 3.7 3.6 3 4.0 3.5
ICT UseScore (1 to 7) WEF - Global Competitiveness Report
20151.2 2.3 1.6 2.3 2.7 1.6 3.4 3.8
Technological AdoptionScore (1 to 7) WEF - Global Competitiveness Report
20153.5 4.7 4.8 4.8 4.9 4 5.5 4.6
Innovation Score (1 to 7) WEF - Global Competitiveness Report
20152.3 2.9 3.4 3.3 3.4 2.4 3.6 3.1
Skilled Workforce Availability Unit Source Year Haiti Dominican Republic Honduras Jamaica Mexico Nicaragua Panama Trinidad and Tobago
Labor Freedom Score (0 to 100)The Heritage Foundation - Index of
Economic Freedom 201762.1 56.2 31.2 73.7 57.9 55.6 43.0 71.4
FlexibilityScore (1 to 7)
WEF - Global Competitiveness Report 20154.8 4.3 4.2 4.7 4.3 4.5 4.5 4.2
Efficient Use of TalentScore (1 to 7)
WEF - Global Competitiveness Report 20153.5 3.3 3.2 3.9 3.2 2.9 3.7 3.8
Primary EducationScore (1 to 7)
WEF - Global Competitiveness Report 20153.0 3.7 4.3 5.0 4.8 4.1 4.5 5.5
Quantity of EducationScore (1 to 7)
WEF - Global Competitiveness Report 20154.6 4.6 3.3 4.0 4.5 3.1 4.4 3.8
Quality of EducationScore (1 to 7)
WEF - Global Competitiveness Report 20152.7 3.0 3.7 4.0 3.4 2.8 3.8 4.6
On-the-Job TrainingScore (1 to 7)
WEF - Global Competitiveness Report 20152.9 3.7 4.4 4.2 4.1 3.3 4.2 4.4
Human Capital Rank (out of 130) WEF - Human Capital Index 2016 111 80 93 67 65 95 52 74
Domestic Market Growth Potential Unit Source Year Haiti Dominican Republic Honduras Jamaica Mexico Nicaragua Panama Trinidad and Tobago
Domestic Competition Score (1 to 7)WEF - Global Competitiveness Report 2015
3.3 4.3 4.3 4.6 4.2 3.9 4.8 4.5
Domestic Market SizeScore (1 to 7)
WEF - Global Competitiveness Report 20152.4 3.7 2.8 2.6 5.5 2.6 3.3 2.6
GDP Growth % World Bank Statistics 2015 1.2 7.0 3.6 1.0 2.5 4.9 5.8 -0.1
GDP per Capita USD World Bank Statistics 2015 1757.4 14237.1 5095.2 8872.9 16988.4 5200.3 22237.2 33308.5

Investment Consulting Associates (ICA) 98 CFI Haiti Agro-industry Sector
Table 34: Competitiveness Analysis Raw Data - Industry Cluster and Critical Mass
Source: Investment Consulting Associates – ICA (2017)
Table 35: Competitiveness Analysis Raw Data - Attractiveness and Quality of Life
Source: Investment Consulting Associates – ICA (2017)
Industry Cluster and Critical Mass Unit Source Year Haiti Dominican Republic Honduras Jamaica Mexico Nicaragua Panama Trinidad and Tobago
Business Sophisitication of Local Supply ChainScore (1 to 7) WEF - Global Competitiveness Report
20152.8 3.8 4.1 4.0 4.2 3.1 4.2 3.9
Quality of Demand ConditionsScore (1 to 7) WEF - Global Competitiveness Report
20152.8 3.7 4.1 3.6 4.1 3.1 4.0 3.3
Food Production Index Number fDi Intelligence 2013 121.01 135.52 118.59 106.08 115.00 141.23 116.70 96.40
Crop Production Index Number fDi Intelligence 2013 121.90 147.93 126.37 107.91 116.96 140.55 97.56 60.25
Arable Land Ratio fDi Intelligence 2013 38.82 16.56 9.12 11.08 11.82 12.50 7.57 4.87
Number of Projects per Capita Ratio fDi Intelligence 2017 0.03 0.08 0.07 0.07 0.17 0.26 0.36 0.15
Specialization in Beverages Ratio fDi Intelligence 2017 0.18 1.20 0.16 1.91 2.21 0.16 0.77 2.34
Specialization in Food & Tobacco Ratio fDi Intelligence 2017 0.77 21.69 3.04 7.60 26.92 2.91 6.84 11.12
Attractiveness and Quality of Life Unit Source Year Haiti Dominican Republic Honduras Jamaica Mexico Nicaragua Panama Trinidad and Tobago
HealthScore (1 to 7) WEF - Global Competitiveness Report
20155.4 6.3 6.4 6.5 6.7 6.5 6.6 6.3
Human Development Index Score (0.000 to 1.000) UNDP - Human Development Index 2016 0.493 0.722 0.625 0.730 0.762 0.645 0.788 0.780
Happiness Score (1 to 10) World Happiness Report 2017 4.028 5.155 4.871 5.510 6.778 5.992 6.701 6.168