halbritter ppt update - the center for american and
TRANSCRIPT

25/08/2017
1

2

Out of our total energy production, natural gas accounts for 29% of the total. The use of natural gas is spread nearly equally across the industrial, residential and commercial, and power generation segments.
3

The 3-year growth rate for gas is impressive, increasing by a third—from 22% to 29%. The portion represented by renewables has been even more impressive growing from under 4% a few years ago to 10%.
4

If the growth in gas usage is impressive, what has happened with shale gas in Appalachia is astounding. It has gone from nothing 2008 when it all started to today where EIA projects 20 Bcf per day. What is interesting is that this forecast is too low. We have already topped 24 Bcf per day with further increases projected by the end of the year. Historically the northeast has been the largest energy consumer of energy. Today it is also among the largest, if not the largest, producing regions. That seems appropriate since it all started here almost 192 years ago.
5

Each year EIA issues its annual energy outlook and their report for 2017 projects a 60% increase in natural gas supply by 2040. The increased demand supporting this supply growth is expected to come from power generation and the transportation sector. Some will also come from export markets.
The importance of shale gas in meeting demand only increases over time. By 2040, annual gas demand will grow from about 28 Tcf to about 38 Tcf (36%) by 2040. Of thisamount, shale gas will account for almost 70% (26 Tcf) of total US natural gas supply. Much of the shale gas that will support this growth is located in Ohio, WV and PA. In fact, we are already producing at an annual rate of 8.76 trillion cubic feet.
6
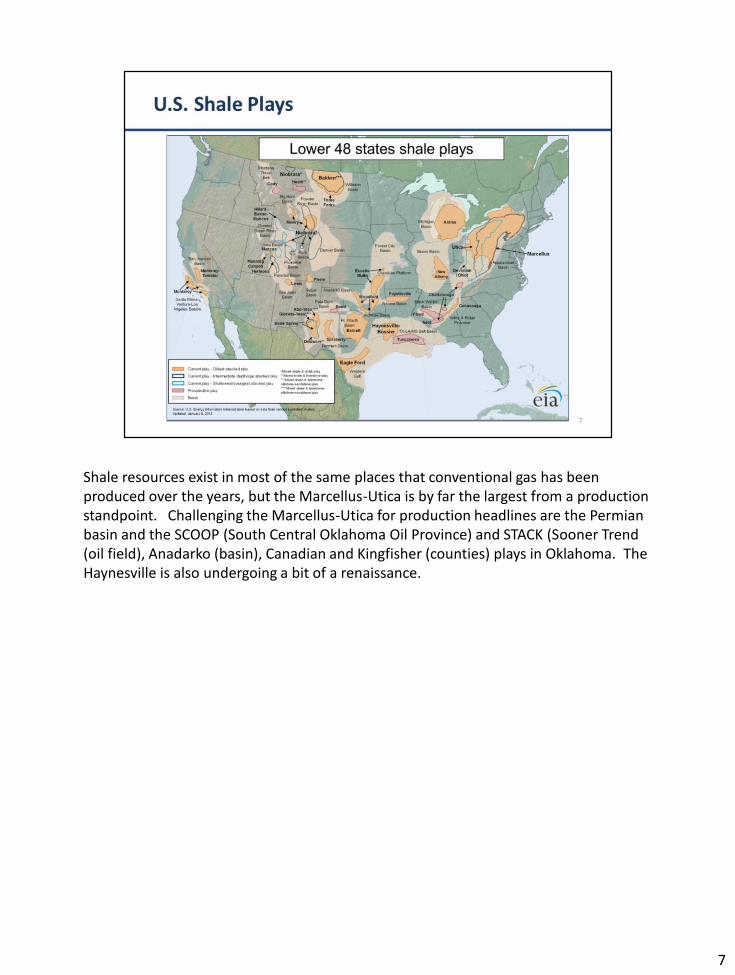
Shale resources exist in most of the same places that conventional gas has been produced over the years, but the Marcellus-Utica is by far the largest from a production standpoint. Challenging the Marcellus-Utica for production headlines are the Permian basin and the SCOOP (South Central Oklahoma Oil Province) and STACK (Sooner Trend (oil field), Anadarko (basin), Canadian and Kingfisher (counties) plays in Oklahoma. The Haynesville is also undergoing a bit of a renaissance.
7

The success of our natural gas producers has been reflected in the prices we pay. From $4.39 per MMBtu, the price has dropped to $2.46, a 44% decline. Prices are expected to be more stable than they have been in the past because of improved drilling efficiencies, lower drilling costs and abundant reserves.
8
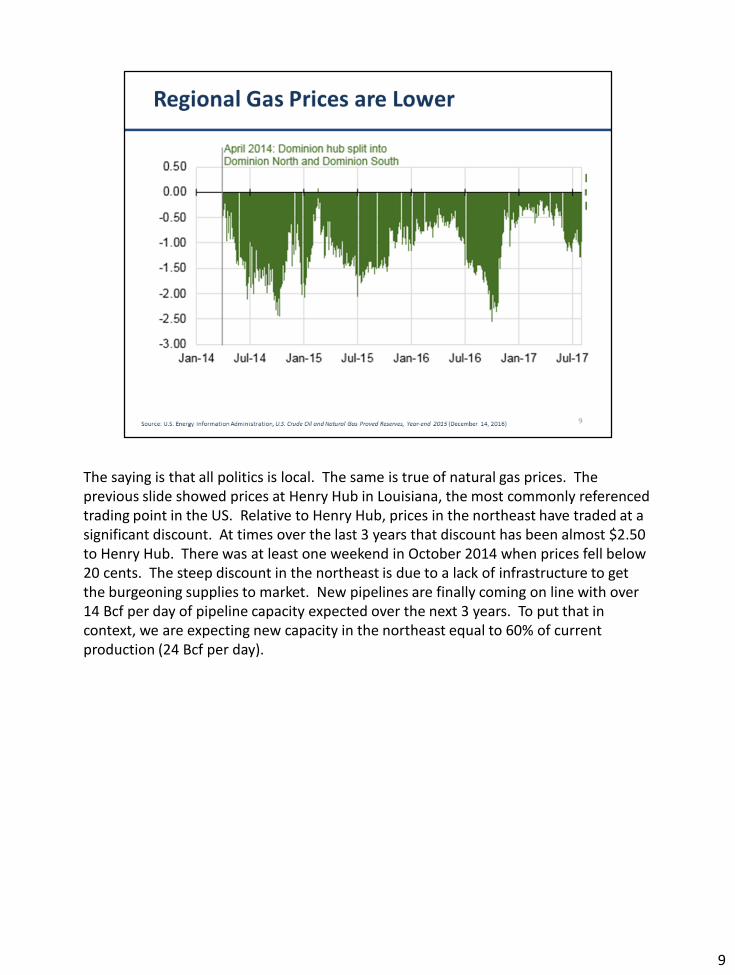
The saying is that all politics is local. The same is true of natural gas prices. The previous slide showed prices at Henry Hub in Louisiana, the most commonly referenced trading point in the US. Relative to Henry Hub, prices in the northeast have traded at a significant discount. At times over the last 3 years that discount has been almost $2.50 to Henry Hub. There was at least one weekend in October 2014 when prices fell below 20 cents. The steep discount in the northeast is due to a lack of infrastructure to get the burgeoning supplies to market. New pipelines are finally coming on line with over 14 Bcf per day of pipeline capacity expected over the next 3 years. To put that in context, we are expecting new capacity in the northeast equal to 60% of current production (24 Bcf per day).
9

10

It takes a lot of equipment to drill a well safely and protect the environment.
11

Wells can be both in the hills and the city. The picture on the left is of a well on the campus of the University of Charleston, located across the river from the State Capitol. Today all one sees is the wellhead; the drilling equipment is long gone.
12

As pipe is placed in the hole, cement is pumped down the pipe and back up between the outside the casing and the ground. Various casings protect the tubing that brings the gas from the ground.
13

14

Fracking creates holes in the pipe and fractures the shale. According to the Southwestern Energy website (https://www.swn.com/operations/documents/frac_fluid_fact_sheet.pdf), “SWN frac fluid is comprised of 99.9% fresh water and sand. The water comes from permitted sources, while the sand is similar to what would be found at a playground. The remaining 0.1% is a combination of compounds, some with identical chemical composition of many common household products. This mixture is designed to protect the integrity of the geological formation and improve the production of natural gas –allowing fracing to be performed in a safe and effective way. While not everyone may use the same mixture as SWN, it is representative.
Sand is used to keep the shale fragments “open” after fracking so that the gas, which is under high pressure, can flow into the tube’s perforations and travel to the surface where flow is controlled and directed by a series of pipes and instruments collectively nicknamed the Christmas Tree. The gas then flows from the Christmas Tree into gathering lines and ultimately downstream to be processed.
15

In this grid, we see that when drilling vertical (conventional) wells, it would have taken as many as 36 separate wells to produce a 2 square mile area.
16

Using horizontal drilling, it takes just one wellpad with 8 wells, typically known as laterals, to produce the same acreage. This is not only very efficient, it is also has much less impact on the surface.
17

Let’s turn now to the portion of the industry that is downstream of drilling and production
18
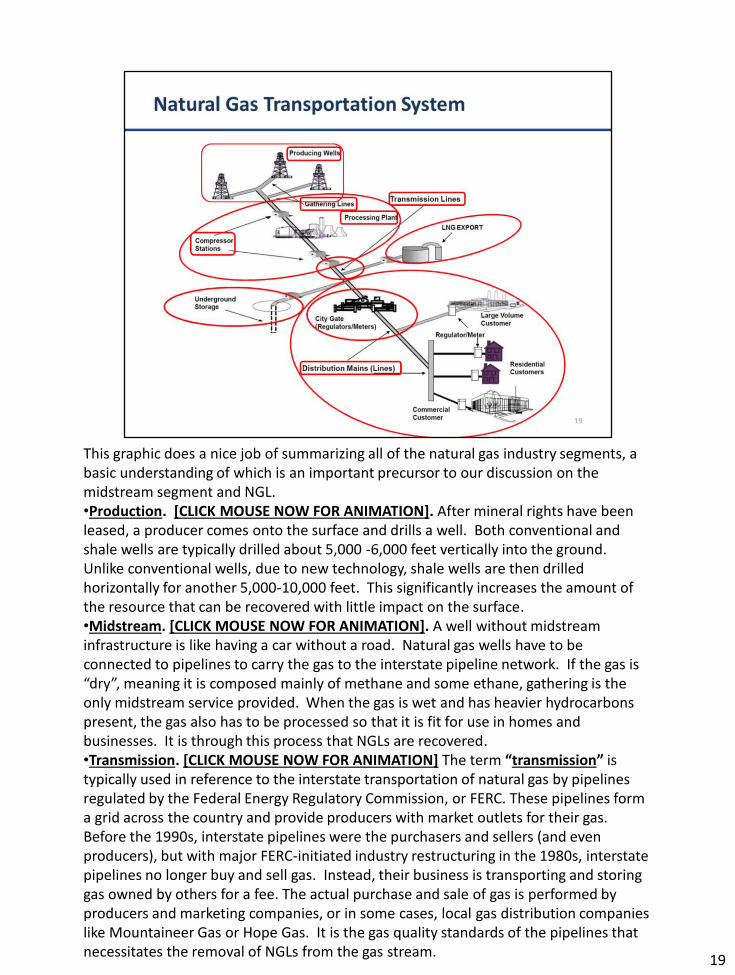
This graphic does a nice job of summarizing all of the natural gas industry segments, a basic understanding of which is an important precursor to our discussion on the midstream segment and NGL.•Production. [CLICK MOUSE NOW FOR ANIMATION]. After mineral rights have been leased, a producer comes onto the surface and drills a well. Both conventional and shale wells are typically drilled about 5,000 -6,000 feet vertically into the ground. Unlike conventional wells, due to new technology, shale wells are then drilled horizontally for another 5,000-10,000 feet. This significantly increases the amount of the resource that can be recovered with little impact on the surface. •Midstream. [CLICK MOUSE NOW FOR ANIMATION]. A well without midstream infrastructure is like having a car without a road. Natural gas wells have to be connected to pipelines to carry the gas to the interstate pipeline network. If the gas is “dry”, meaning it is composed mainly of methane and some ethane, gathering is the only midstream service provided. When the gas is wet and has heavier hydrocarbons present, the gas also has to be processed so that it is fit for use in homes and businesses. It is through this process that NGLs are recovered. •Transmission. [CLICK MOUSE NOW FOR ANIMATION] The term “transmission” istypically used in reference to the interstate transportation of natural gas by pipelines regulated by the Federal Energy Regulatory Commission, or FERC. These pipelines form a grid across the country and provide producers with market outlets for their gas. Before the 1990s, interstate pipelines were the purchasers and sellers (and even producers), but with major FERC-initiated industry restructuring in the 1980s, interstate pipelines no longer buy and sell gas. Instead, their business is transporting and storinggas owned by others for a fee. The actual purchase and sale of gas is performed by producers and marketing companies, or in some cases, local gas distribution companies like Mountaineer Gas or Hope Gas. It is the gas quality standards of the pipelines that necessitates the removal of NGLs from the gas stream.
19

Smaller diameter pipelines, 8”-12”, are used to bring gas from the wellhead to a larger diameter, usually higher pressure, gathering line where it is then delivered to a plant to be processed.
20

This is a picture of the Natrium Processing and Fractionation Plant of Blue Racer Midstream. At this location Blue Racer processes gas to remove natural gas liquids and deliver the “clean” gas stream to the interstate pipeline network. The NGLs that are removed are separated into the component parts: ethane, propane, butane and natural gasoline. Sometimes the butane is split into normal and iso butane. The separated products are then sold to a variety of markets and a variety of uses. Common uses are to make plastics, heat our homes and water, aerosol propellant, lighters, gasoline blending and serving as a diluent for tar sands crude.
21

•The pace of growth in the northeast has been extraordinary. As indicated above, in a few short years the industry has constructed almost 9 Bcf of daily processing capacity and 871,500 barrels per day of fractionation capacity
22

•We have talked about how NGLs are removed from the gas stream and fractionated. What we haven’t talked about is why.
•Prior to 2003, natural gas had a 6:1 or 8:1 ratio to oil prices, that is, six Mcf of gas equaled the price of a barrel of oil. Today that ratio is almost about 17:1 and has been as much as 20:1. So, gas has grown much cheaper than oil on a relative basis making oil a more attractive commodity to produce. Because NGLs generally follow the price of oil, “wet” gas—gas containing NGLs—is more valuable than “dry” gas which only contains methane. This has lead producers to drill for wet gas to capture the value added by the NGLs unless they had access to the absolute lowest cost areas to drill fordry gas. Northeast Pennsylvania is an example of where dry gas is produced and in staggering quantities.
•This chart shows exactly how a producer benefits from wet gas. Gas that would otherwise be sold for $3.46 per Mcf can be upsized to $4.69 per Mcf by removing the NGLs and selling them separately. It is this liquids uplift that has driven much of the demand for midstream services and resulted in the surge in wet gas production.
23

Once gas has been processed and the NGLs removed, the residue gas, comprised mainly of methane and some ethane is delivered into the interstate pipeline network for redelivery for export as LNG, into storage for later withdrawal or delivery to local distribution companies who in turn deliver it to our homes and businesses.
24
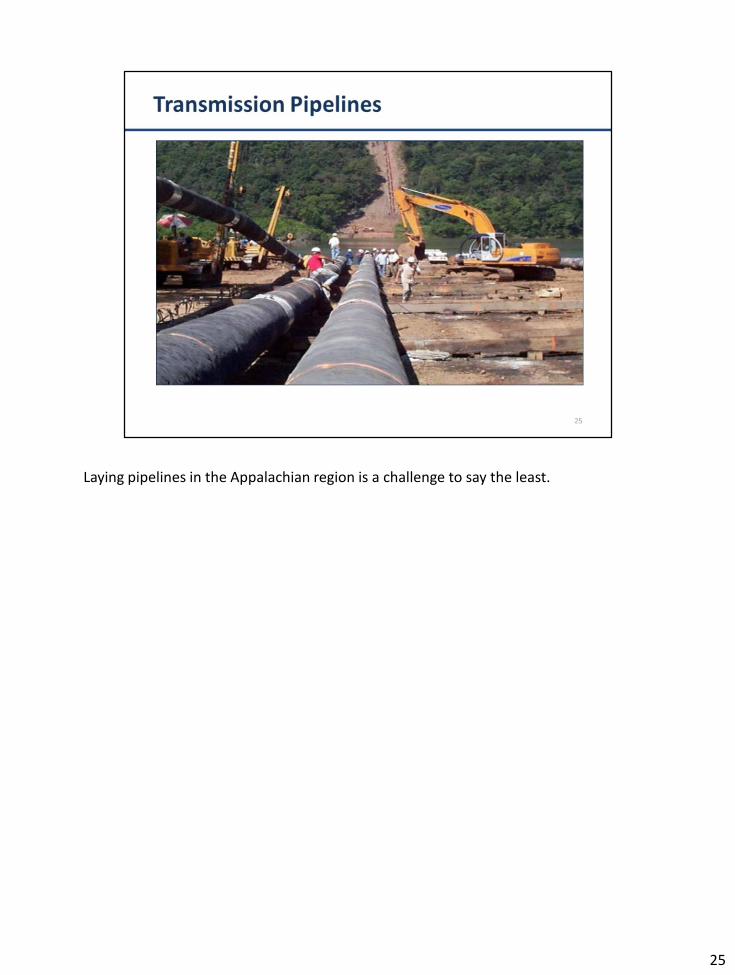
Laying pipelines in the Appalachian region is a challenge to say the least.
25

Because they are unseen, most people don’t realize just how extensive a network of under ground pipelines exists in the US. This map shows the interstate pipeline system (excludes intrastate and distribution utility systems). The largest concentration of pipelines are in the producing areas of the Gulf Coast states (Texas, Louisiana, etc.), Oklahoma, and the Appalachian region. Lesser concentrations occur in areas of consumption (cities like Chicago, for example).
26

To maximize delivery capability, compressor stations are located along the pipeline route and at major delivery points/interconnects. Higher pressure means more gas can be transported in the same size pipe and can allow for pipe to be smaller diameter than it otherwise would. Adding compression to an existing line can allow the same line to be used rather than a new one being built.
27

Natural gas is often stored in depleted reservoirs or in salt caverns. Salt caverns are particularly useful for storing NGLs and development of them is being anxiously awaited by the industry as the final segment in developing a robust NGL market in the northeast and potentially a renaissance of the chemical and plastics industry.
28

Ships like this carry LNG from the US to Europe and Asia to help meet their needs for natural gas.
29

Local distribution companies are the final segment in the industry, delivering natural gas to our homes, businesses and industry.
30

31