half-year 2011 results presentation - ugl limited · 2017-08-10 · half-year 2011 results...
TRANSCRIPT

Half-Year 2011 Results PresentationMonday, 21 February 2011Sofitel Wentworth, Sydney

OverviewRichard Leupen, Managing Director & CEO

3
Group Highlights
• healthy financial performance• record contributions from 3 of 4 divisions• increased interim dividend
Business Diversity Delivering
• financial flexibility• robust risk management• consistent focus - growth, market leadership,
sustainability and earnings stability
Strong Strategic Position
• near record $8.9b order book• expanding tender pipeline• market conditions generally improving
Growth Momentum Continuing

4
Financial Highlights
Operating revenue, EBIT, Tax, NPAT & EPS in this presentation refer to underlying results. A reconciliation to reported results is detailed on slide 13.
Operating revenue
Operating cash flow
NPAT
EPS
Capex
Gearing
DPS
$2.3b - up 7%
32¢ fully franked
14% flexibility for growth
$65.9m
$68.1m - up 16%
41.2¢ - up 16%
$22m low capital intensity

5
Revenue & Profit Growth
Operating Revenue Net profit after tax ($m)
6
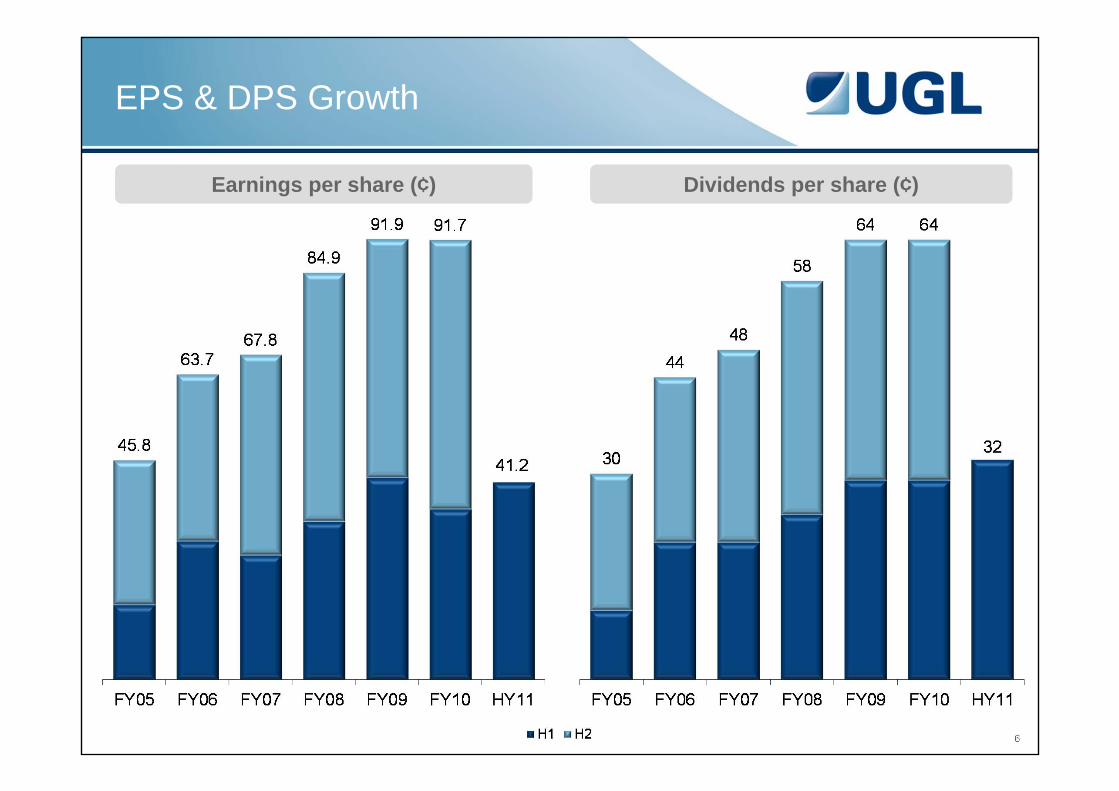
EPS & DPS Growth
Earnings per share (¢) Dividends per share (¢)

7
Drivers for Growth
Sustainable Earnings
Market Leadership
RiskManagement
FinancialStrength
BusinessPositioning
Sector Leadership
• Balanced recurring revenues• Long term capital works alliances• Diverse earnings streams• Strong order book• Solid opportunity pipeline
• Robust systems and processes• Alliance and cost-plus contracts• Blue chip and government clients• Sensible, balanced trading terms
• People• Safety• Technology partnerships • Intellectual property • Outstanding customer service
• LNG, iron ore and coal• Transport and rail engineering• Infrastructure and
the environment• Property management
• Strong balance sheet• Low capital intensity• Robust cash flow• Flexibility to grow
• Exposure to long term growth trends• Significant market opportunities• Strong technical component• World class technology

8
-
5
10
15
20
25
30
Dec-03 Dec-04 Dec-05 Dec-06 Dec-07 Dec-08 Dec-09 Dec-10
Freq
uenc
y ra
te p
er m
illio
n m
an h
ours
wor
ked*
Lost time incident frequency rate Total recordable case frequency rateLTIFR Excluding US TRCFR Excluding US
Safety
*rolling 12-month average

9
Our People
Employee numbers* Breakdown by division
2,198 (5%)2,822 (6%)5,125 (12%)
33,571 (76%)266 (1%)54 (0%)
*includes contractors
8% growth

10
Divisional Overview
UGL Infrastructure
• Record half year earnings• Strong water and power performance • Ramping up on DTRS and Airport Link• Continuing opportunities in power and communications
• Record half year earnings• Strong water and power performance • Ramping up on DTRS and Airport Link• Continuing opportunities in power and communications
UGL Rail
• Strong growth in sales and earnings• Solid contribution from rolling stock• Commenced Oscar 3 deliveries• Texmaco JV signed• Improving market conditions
• Strong growth in sales and earnings• Solid contribution from rolling stock• Commenced Oscar 3 deliveries• Texmaco JV signed• Improving market conditions
UGLResources
• RGP5 project completed• Growing maintenance services• Pluto nearing completion• Aurora and Lynas contributing in second half
• RGP5 project completed• Growing maintenance services• Pluto nearing completion• Aurora and Lynas contributing in second half
UGLServices
• All regions performing well• Continued turnaround in CRE and ANZ operations• Singapore Sports Hub financial close• Business development activity strong
• All regions performing well• Continued turnaround in CRE and ANZ operations• Singapore Sports Hub financial close• Business development activity strong

Financial AnalysisRob Bonaccorso, Chief Financial Officer

12
Results Overview
Constant currency: translating results in AUD dollars at the exchange rate applicable during the prior corresponding period.
$m HY11 HY10 Change ConstantCurrency
Operating revenue 2,273.7 2,119.7 7% 10%
EBIT 104.6 91.3 15% 17%
EBIT margin 4.6% 4.3%
NPAT 68.1 58.6 16% 18%
NPAT margin 3.0% 2.8%
EPS 41.2 35.6 16% 17%

13
Reconciliation to Underlying Results
$m HY11 HY10 Change
Consolidated revenue 2,140.5 2,073.5 67.0Add: Revenue from joint ventures & associates 135.6 47.9 87.7Less: Interest income (2.4) (1.7) (0.7)Total segment revenue 2,273.7 2,119.7 154.0
EBIT 98.3 85.8 12.5Add: Amortisation of acquired intangibles 5.2 5.5 (0.3)Add: Tax on equity accounted income 1.1 - 1.1Underlying EBIT 104.6 91.3 13.3
Tax (23.0) (20.1) (2.9)Less: Tax on amortisation of acquired intangibles (2.1) (2.2) 0.1Less: Tax on equity accounted income (1.1) - (1.1)Underlying tax (26.2) (22.3) (3.9)
NPAT (attributable to owners of the company) 65.0 55.3 9.7Add: Amortisation of acquired intangibles (after tax) 3.1 3.3 (0.2)Underlying NPAT 68.1 58.6 9.5

14
Operational Report - Infrastructure
• Favourable project completions
• Order book steady
• Expanding pipeline
• Major projects supporting growth in second half
$m HY11 HY10 Change
Sales - $m 495.6 582.6 (15%)
EBIT - $m 40.3 39.0 3%
EBIT / Sales 8.1% 6.7%
Order book - $m 1,912.5 2,139.4 (11%)
EBIT $m

15
Operational Report - Rail
• Growth driven by locomotives and wagons
• Expanding freight and passenger activity
• Strong order book
• Bidding activity high
$m HY11 HY10 Change
EBIT $m
Sales - $m 638.4 556.1 15%
EBIT - $m 38.5 13.7 182%
EBIT / Sales 6.0% 2.5%
Order book - $m 3,085.0 3,164.1 (2%)

16
Operational Report - Resources
• Strong top line growth
• Major projects division impacting performance
• Asset services continues to grow
• Growing order book
• Elevated bidding activity
Sales - $m 479.7 320.3 50%
EBIT - $m 11.6 23.6 (51%)
EBIT / Sales 2.4% 7.4%
Order book - $m 868.5 741.4 17%
$m HY11 HY10 Change
EBIT $m

17
Operational Report - Services
• Sales growth 6% (constant currency)
• US, ANZ and Asia performing well
• Discretionary spend supporting margins
• FX impacting EBIT and order book
$m HY11 HY10 Change
EBIT $m
Sales - $m 667.7 673.1 (1%)
EBIT - $m 35.6 34.8 2%
EBIT / Sales 5.3% 5.2%
Order book - $m 3,054.8 2,728.7 12%

18
Operating Cash Flow
• Underlying cash realisation steady
• New projects driving working capital growth
Operating Cash flow $m
Note: Cash Realisation = Operating cash flow / NPAT add back depreciation and amortisation
EBITDA 126.3
Financing costs & Tax (33.6)
Other non-cash items 2.9
Movement in working capital (29.7)
65.9Reported cash flow from operations

19
Financial Position
• Average term 4.9 years
• No refinancing obligations until 2012
• $141m available bank capacity

20
Financial Position
• Strong financial position
• Financial flexibility
• Positioned for growth
$m HY11 FY10
Net debt 189 234
Net debt to net debt plus equity 14.3% 16.8%
Interest cover (rolling 12 months) 14.2x 11.0x
Net debt to EBITDA 0.7x 0.8x
Total assets 2,320 2,505

OutlookRichard Leupen, Managing Director & CEO

22
Order Book • Reported $8.9b• Constant Currency $9.2b
Order Book
Historic growth ($m) Order book excludes significant value
Preferred tender status $0.2b• Property services• Locomotive delivery
and maintenance
Options in existing contracts $2.8b• Rail maintenance• Property services• Locomotive orders
Recurring maintenance $6.5b• Historic renewal rate 90-95%• Value over five years• Excludes fixed term contracts

23
By year ($m)
Order Book Breakdown
By type By division
Alliance style projects $1,432m

24
Pipeline
Weighted and Qualified ($m) Status
FY08 FY09 FY10 FY11
Note: Weighted & Qualified – excludes any opportunities with a go-get less than 25%

25
New Contract Wins & Extensions
• Murrumbidgee Irrigation• North Auckland and
Northland Grid Upgrade• Western Downs to Halys
275kV powerline
UGL Infrastructure
• Oscar 3 extension• Various freight orders
- RIO, Freightliner Australia and GE• Long term locomotive service
and support programs
UGL Rail
• Asset services mechanical shutdowns
• CITIC Pacific Mining Sino Iron project
• Brockman Marillana Iron Ore FEED
UGL Resources
• Singapore Sports Hub• RTA and Foster’s• US higher education, automotive
and pharmaceutical sectors
UGL Services
$2.3b in New Wins and Extensions

26
Divisional Outlook
• Major projects supporting growth in second half
• Sector outlook steadily improving• Power, Transport and Communications
to remain resilient
UGL Infrastructure
• Freight market recovery to continue• Ongoing passenger rail demand• MTM performance improving• Maintenance markets remain healthy
UGL Rail
Order Book

27
Divisional Outlook
• Recovery anticipated across second half
• Continuing asset services growth• Bidding activity robust and expanding• Changing customer needs
• Strong business platform• US economy recovering• Energy and environment focus• Evaluating global JV opportunities
UGL Resources
UGL Services
Order Book

28
Group Outlook
• focussed strategic intent• exposure to long term trends• significant market opportunities• sector and market leadership
Strong growth opportunities
• robust systems and processes• strong financial position• blue chip and government clients • diverse earnings streams
Flexibility to grow
• majority of revenue secured• expanding order book• record pipeline of opportunities• continuing to target 10-15% NPAT growth in FY11
On-track for growth

29
Important Notice
This presentation and any oral presentation accompanying it:
• is not an offer, invitation, inducement or recommendation to purchase or subscribe for any securities in UGL Limited (“UGL”) or to retain any securities currently held;
• is for information purposes only, is in summary form and does not purport to be complete;
• is not intended to be relied upon as advice to investors or potential investors and does not take into account the investment objectives, financial situation or needs of any particular investor, potential investor or any other person. Such persons should consider seeking independent financial advice depending on their specific investment objectives, financial situation or needs when deciding if an investment is appropriate or varying any investment;
• may contain forward looking statements. Any forward looking statements are not guarantees of future performance. Any forward looking statements have been prepared on the basis of a number of assumptions which may prove to be incorrect or involve known and unknown risks, uncertainties and other factors, many of which are beyond the control of UGL, which may cause actual results, performance or achievements to differ materially from those expressed or implied in such statements. There can be no assurance that actual outcomes will not differ materially from these statements. Any forward looking statement reflects views held only as of the date of this presentation. Subject to any continuing obligations under applicable law or any relevant stock exchange listing rules, UGL does not undertake any obligation to publicly update or revise any of the forward looking statements or any change in events, conditions or circumstances on which any such statement is based.
No representation or warranty, express or implied, is made as to the fairness, accuracy, completeness or correctness of the information, opinions and conclusions contained in this presentation and any oral presentation accompanying it. To the maximum extent permitted by law, UGL and its related bodies corporate, and their respective directors, officers, employees, agents and advisers, disclaim and exclude all liability (including, without limitation, any liability arising from fault or negligence) for any loss, damage, claim, demand, cost and expense of whatever nature arising in any way out of or in connection with this presentation and any oral presentation accompanying it, including any error or omission therefrom, or otherwise arising in connection with any reliance by any person on any part of this presentation and any oral presentation accompanying it.