half-year financial report · half year financial report as at 30 june 2017 of tlg immobilien ag...
TRANSCRIPT

HALF-YEAR FINANCIAL REPORTAS AT 30 JUNE 2017

Unit01/01/2017 –30/06/2017
01/01/2016 –30/06/2016 Change in %
Results of operations
Rental income in EUR k 78,481 67,585 16.1
Net operating income from letting activities (NOI) in EUR k 71,147 61,240 16.2
Disposal profits in EUR k 169 617 – 72.6
Net income for the period in EUR k 76,532 33,510 128.4
Funds from operations (FFO) in EUR k 46,505 38,306 21.4
FFO per share1 in EUR 0.64 0.57 12.3
Unit 30/06/2017 31/12/2016 Change in %
Balance sheet metrics
Investment property in EUR k 2,257,319 2,215,228 1.9
Cash and cash equivalents in EUR k 31,000 68,415 – 54.7
Total assets in EUR k 2,367,334 2,344,763 1.0
Equity in EUR k 1,148,263 1,009,503 13.7
Equity ratio in % 48.5 43.1 5.4 pp
Liabilities to financial institutions in EUR k 920,917 1,040,412 – 11.5
Net debt in EUR k 889,917 971,997 – 8.4
Net LTV² in % 38.7 43.4 – 4.7 pp
EPRA NAV in EUR k 1,405,752 1,248,259 12.6
EPRA NAV per share1 in EUR 18.95 18.51 2.4
Unit 30/06/2017 31/12/2016 Change in %
Key portfolio performance indicators
Property value3 in EUR k 2,302,151 2,241,615 2.7
Properties number 386 404 – 18 units
Annual rent excluding utilities4 in EUR k 157,117 155,276 1.2
In-place rental yield in % 6.8 6.9 – 0.1 pp
EPRA Vacancy Rate in % 2.9 3.8 – 0.9 pp
WALT in years 6.1 6.1 0.0 years
Average rent in EUR/sqm 9.86 9.67 1.9
1 Total number of shares as at 30 June 2016: 67.4 m, as at 30 June 2017: 74.2 m. The weighted average number of shares was 67.4 m in the first half of 2016 and 73.1 m in the first half of 2017.
² Calculation: Net debt divided by property value; for the composition, see page 17.3 In line with values disclosed according to IAS 40, IAS 2, IAS 16 and IFRS 54 The annual rent excluding utilities is calculated using the annualised rents agreed as at the reporting date – not factoring in rent-free periods.
Related links Web reference
KEY GROUP FIGURES ACCORDING TO IFRS
Table of contents
HALF
-YEA
R FI
NAN
CIAL
REP
ORT
AS
AT 3
0 JU
NE
2017
OF
TLG
IMM
OBI
LIEN
AG

CONTENTS
02 TLG IMMOBILIEN SHARES06 EPRA KEY FIGURES
10 CONSOLIDATED INTERIM MANAGEMENT REPORT11 1. COMPANY FUNDAMENTALS
11 2. ECONOMIC REPORT
18 3. REPORT ON RISKS, OPPORTUNITIES AND FORECASTS
20 CONSOLIDATED INTERIM FINANCIAL STATEMENTS21 CONSOLIDATED STATEMENT OF COMPREHENSIVE INCOME
22 CONSOLIDATED STATEMENT OF FINANCIAL POSITION
23 CONSOLIDATED CASH FLOW STATEMENT
24 CONSOLIDATED STATEMENT OF CHANGES IN EQUITY
25 CONDENSED NOTES TO THE CONSOLIDATED INTERIM FINANCIAL STATEMENTS25 A. GENERAL INFORMATION ON THE CONSOLIDATED INTERIM FINANCIAL STATEMENTS
OF TLG IMMOBILIEN AG
26 B. EXPLANATION OF ACCOUNTING AND MEASUREMENT METHODS
26 C. SELECTED NOTES TO THE CONSOLIDATED STATEMENT OF FINANCIAL POSITION
28 D. SELECTED NOTES TO THE CONSOLIDATED STATEMENT OF COMPREHENSIVE INCOME
30 E. OTHER INFORMATION
31 F. AUDITOR’S REPORT
32 FINANCIAL CALENDAR – CONTACT – PUBLISHING DETAILS
Title illustration: Office building “astropark”, Lyoner Strasse 9, Frankfurt/Main, Germany (acquisition Q3/2017)

HALF
-YEA
R FI
NAN
CIAL
REP
ORT
AS
AT 3
0 JU
NE
2017
OF
TLG
IMM
OBI
LIEN
AG
TABLE OF CONTENTS
TLG IMMOBILIEN SHARES
The stock market performed well in the first half of 2017. Essentially, this was because of the strong
improvement in leading indicators throughout the world in the first quarter and the reduction of political risks.
Strong economic indicators in the Eurozone and a strong Q1 reporting season were identified as the main
positive trends in the second quarter, although the positive developments stood in contrast to the shifting of
central banks towards less expansive monetary policies.
The German stock index DAX therefore grew in the first half of the year and closed at 12,325.12 points on
30 June. Therefore, the DAX increased by 7.9% over the first half of the year compared to its opening price
on 2 January 2017.
The SDAX performed just as well in the first six months of the year, increasing by 13.9% between the
beginning of January 2017 and the end of June 2017.
German real estate share prices also experienced positive growth. The FTSE EPRA/NAREIT Germany Index
grew by 7.9% in the first six months. The FTSE EPRA/NAREIT Europe Index grew by just 2.3% in the same
period.
The shares of TLG IMMOBILIEN made an inconsistent start to 2017 and reached EUR 19.41 on Xetra on
9 May 2017, their highest value on XETRA in the first half of 2017. The shares closed the reporting period at
EUR 17.90 on 30 June 2017 and were therefore on the same level as their opening price at the start of the
year.
2 TLG IMMOBILIEN SHARES
Performance of the shares by index
TLG IMMOBILIEN AG SDAX FTSE EPRA/NAREIT Europe Real Estate FTSE EPRA/NAREIT Germany
01/01/2017 04/08/2017
in %
90
95
100
105
110
115
120

HALF
-YEA
R FI
NAN
CIAL
REP
ORT
AS
AT 3
0 JU
NE
2017
OF
TLG
IMM
OBI
LIEN
AG
TABLE OF CONTENTS
Share data
ISIN/WKN DE000A12B8Z4/A12B8Z
Ticker symbol TLG
Share capital in EUR 74,175,558.00
Number of shares (no-par-value bearer shares) 74,175,558
Indices (selection) SDAX, EPRA/NAREIT Global Index, EPRA/NAREIT Europe Index, EPRA/NAREIT Germany Index
Sector/sub-sector Real estate
Market segment Regulated market (Prime Standard)
Designated sponsors Commerzbank AG, ODDO SEYDLER BANK AG
Reporting period high on 09/05/2017 (Xetra) in EUR 19.41
Reporting period low on 20/01/2017 (Xetra) in EUR 17.03
Closing price on 30/06/2017 (Xetra) in EUR 17.90
Market capitalisation in EUR m 1,327.7
CAPITAL INCREASE
With a view to continuing its successful growth strategy and with the approval of the Supervisory Board, on
30 January 2017 the Management Board approved a capital increase against cash contributions and excluding
subscription rights. The approx. 6.7 m new shares (approx. 10% of the share capital) were made available to
institutional investors at a placement price of EUR 17.20 per share by means of accelerated book building. The
private offering started on 30 January 2017 after the market closed and ended on 31 January 2017. The gross
proceeds were therefore around EUR 116.0 m.
TLG IMMOBILIEN AG intends to use the net proceeds from the private placement to finance its most recent and
future acquisitions of German office and retail properties in line with its stated acquisition criteria, as well as
for general business purposes.
The new shares are fully entitled to a share of profits in 2016 and were added to the current listing in the
section of the regulated market with additional post-admission transparency requirements (Prime Standard)
at the Frankfurt Stock Exchange on 7 February 2017. The transaction was closed on 7 February 2017.
VOLUNTARY PUBLIC TAKEOVER OFFER TO THE SHAREHOLDERS OF WCM BETEILIGUNGS- UND GRUNDBESITZ-AKTIENGESELLSCHAFT (WCM)
On 10 May 2017, the Management and Supervisory Boards of TLG IMMOBILIEN AG resolved to offer to purchase
the no-par value bearer shares in WCM Beteiligungs- und Grundbesitz-Aktiengesellschaft (WCM) by way of
a voluntary public takeover offer. Four new, no-par value bearer shares in TLG IMMOBILIEN with a notional
value of EUR 1.00 were offered in exchange for every 23 shares in WCM. The new shares in TLG IMMOBILIEN
will carry dividend rights from 1 January 2017 and are to be created through one or multiple capital increases
from the Authorised Capital 2014/II pursuant to Sec. 6.1 of the Articles of Association of TLG IMMOBILIEN.
TLG IMMOBILIEN SHARES 3
HALF
-YEA
R FI
NAN
CIAL
REP
ORT
AS
AT 3
0 JU
NE
2017
OF
TLG
IMM
OBI
LIEN
AG
TABLE OF CONTENTS
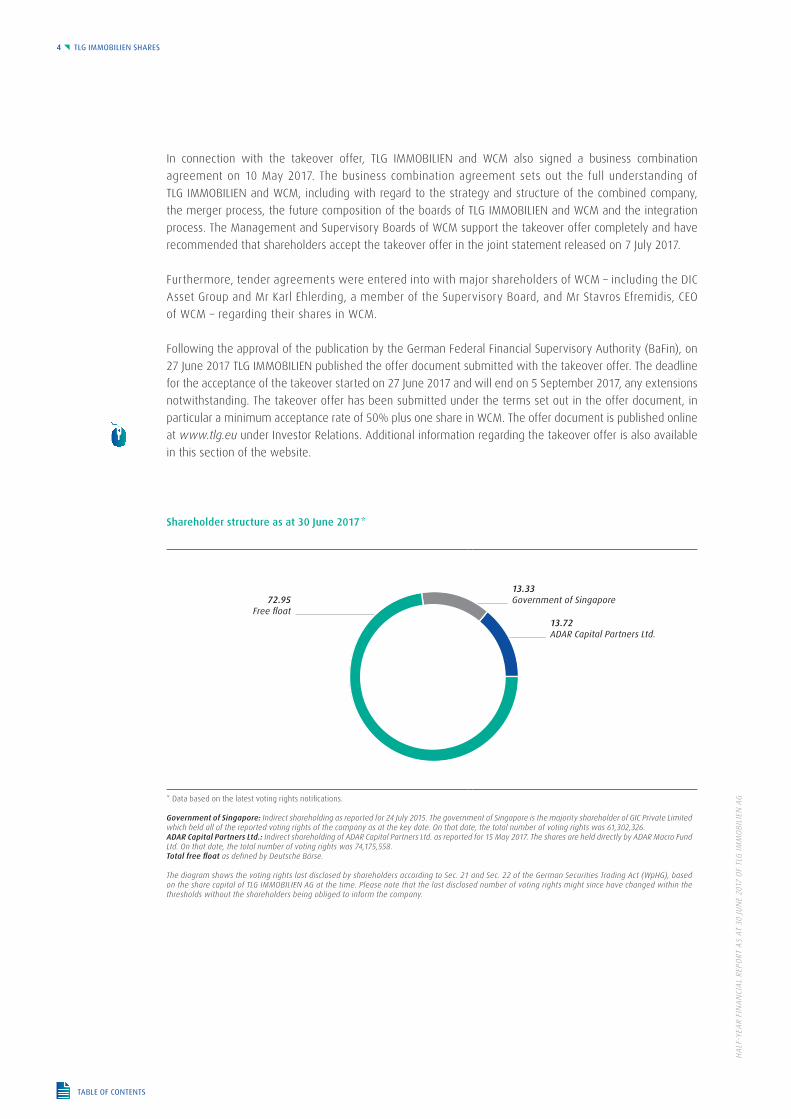
Shareholder structure as at 30 June 2017 *
* Data based on the latest voting rights notifications. Government of Singapore: Indirect shareholding as reported for 24 July 2015. The government of Singapore is the majority shareholder of GIC Private Limited which held all of the reported voting rights of the company as at the key date. On that date, the total number of voting rights was 61,302,326.ADAR Capital Partners Ltd.: Indirect shareholding of ADAR Capital Partners Ltd. as reported for 15 May 2017. The shares are held directly by ADAR Macro Fund Ltd. On that date, the total number of voting rights was 74,175,558.Total free float as defined by Deutsche Börse.
The diagram shows the voting rights last disclosed by shareholders according to Sec. 21 and Sec. 22 of the German Securities Trading Act (WpHG), based on the share capital of TLG IMMOBILIEN AG at the time. Please note that the last disclosed number of voting rights might since have changed within the thresholds without the shareholders being obliged to inform the company.
72.95 Free float
13.33 Government of Singapore
13.72 ADAR Capital Partners Ltd.
4 TLG IMMOBILIEN SHARES
In connection with the takeover offer, TLG IMMOBILIEN and WCM also signed a business combination
agreement on 10 May 2017. The business combination agreement sets out the full understanding of
TLG IMMOBILIEN and WCM, including with regard to the strategy and structure of the combined company,
the merger process, the future composition of the boards of TLG IMMOBILIEN and WCM and the integration
process. The Management and Supervisory Boards of WCM support the takeover offer completely and have
recommended that shareholders accept the takeover offer in the joint statement released on 7 July 2017.
Furthermore, tender agreements were entered into with major shareholders of WCM – including the DIC
Asset Group and Mr Karl Ehlerding, a member of the Supervisory Board, and Mr Stavros Efremidis, CEO
of WCM – regarding their shares in WCM.
Following the approval of the publication by the German Federal Financial Supervisory Authority (BaFin), on
27 June 2017 TLG IMMOBILIEN published the offer document submitted with the takeover offer. The deadline
for the acceptance of the takeover started on 27 June 2017 and will end on 5 September 2017, any extensions
notwithstanding. The takeover offer has been submitted under the terms set out in the offer document, in
particular a minimum acceptance rate of 50% plus one share in WCM. The offer document is published online
at www.tlg.eu under Investor Relations. Additional information regarding the takeover offer is also available
in this section of the website.
HALF
-YEA
R FI
NAN
CIAL
REP
ORT
AS
AT 3
0 JU
NE
2017
OF
TLG
IMM
OBI
LIEN
AG
TABLE OF CONTENTS
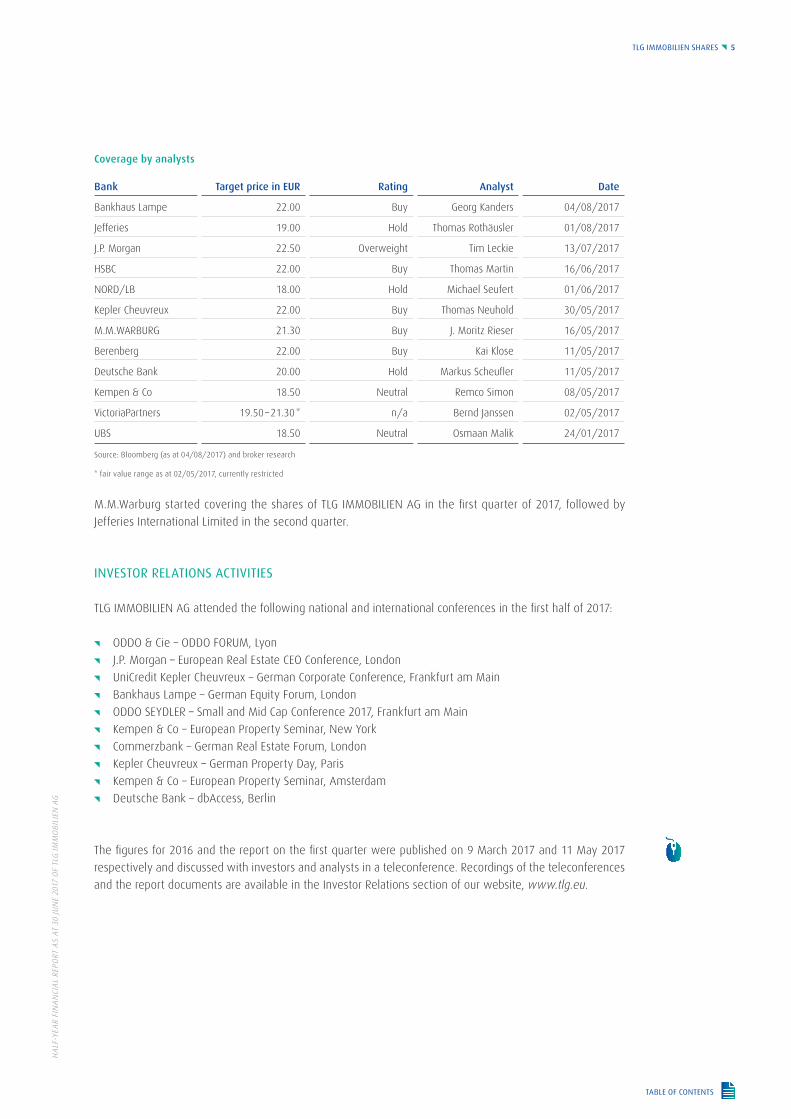
Coverage by analysts
Bank Target price in EUR Rating Analyst Date
Bankhaus Lampe 22.00 Buy Georg Kanders 04/08/2017
Jefferies 19.00 Hold Thomas Rothäusler 01/08/2017
J.P. Morgan 22.50 Overweight Tim Leckie 13/07/2017
HSBC 22.00 Buy Thomas Martin 16/06/2017
NORD/LB 18.00 Hold Michael Seufert 01/06/2017
Kepler Cheuvreux 22.00 Buy Thomas Neuhold 30/05/2017
M.M.WARBURG 21.30 Buy J. Moritz Rieser 16/05/2017
Berenberg 22.00 Buy Kai Klose 11/05/2017
Deutsche Bank 20.00 Hold Markus Scheufler 11/05/2017
Kempen & Co 18.50 Neutral Remco Simon 08/05/2017
VictoriaPartners 19.50 – 21.30 * n/a Bernd Janssen 02/05/2017
UBS 18.50 Neutral Osmaan Malik 24/01/2017
Source: Bloomberg (as at 04/08/2017) and broker research
* fair value range as at 02/05/2017, currently restricted
M.M.Warburg started covering the shares of TLG IMMOBILIEN AG in the first quarter of 2017, followed by
Jefferies International Limited in the second quarter.
INVESTOR RELATIONS ACTIVITIES
TLG IMMOBILIEN AG attended the following national and international conferences in the first half of 2017:
ODDO & Cie – ODDO FORUM, Lyon
J.P. Morgan – European Real Estate CEO Conference, London
UniCredit Kepler Cheuvreux – German Corporate Conference, Frankfurt am Main
Bankhaus Lampe – German Equity Forum, London
ODDO SEYDLER – Small and Mid Cap Conference 2017, Frankfurt am Main
Kempen & Co – European Property Seminar, New York
Commerzbank – German Real Estate Forum, London
Kepler Cheuvreux – German Property Day, Paris
Kempen & Co – European Property Seminar, Amsterdam
Deutsche Bank – dbAccess, Berlin
The figures for 2016 and the report on the first quarter were published on 9 March 2017 and 11 May 2017
respectively and discussed with investors and analysts in a teleconference. Recordings of the teleconferences
and the report documents are available in the Investor Relations section of our website, www.tlg.eu.
TLG IMMOBILIEN SHARES 5

HALF
-YEA
R FI
NAN
CIAL
REP
ORT
AS
AT 3
0 JU
NE
2017
OF
TLG
IMM
OBI
LIEN
AG
TABLE OF CONTENTS
EPRA KEY FIGURES
TLG IMMOBILIEN AG has been a member of EPRA since November 2014 and, as a company listed on a stock
exchange, publishes the key figures in line with the Best Practices Recommendations of EPRA for the sake of
transparency and comparability.
Overview of key EPRA figures
in EUR k 30/06/2017 31/12/2016 Change Change in %
EPRA NAV 1,405,752 1,248,259 157,493 12.6
EPRA NNNAV 1,131,346 992,496 138,850 14.0
EPRA Net Initial Yield (NIY) in % 5.6 5.7 – 0.1 pp
EPRA “topped-up” Net Initial Yield in % 5.7 5.7 0.0 pp
EPRA Vacancy Rate in % 2.9 3.8 – 0.9 pp
in EUR k01/01/2017 –30/06/2017
01/01/2016 –30/06/2016 Change Change in %
EPRA Earnings 33,617 38,491 – 4,874 – 12.7
EPRA Cost Ratio (including direct vacancy costs) in % 26.1 22.7 3.4 pp
EPRA Cost Ratio (excluding direct vacancy costs) in % 25.1 21.3 3.8 pp
The increase in the EPRA NAV was essentially the result of the increase in equity which in turn was due
primarily to the capital increase against cash contributions carried out on 31 January 2017 which generated
gross proceeds of EUR k 115,984.
The reduction of the EPRA Vacancy Rate for the portfolio as a whole from 3.8% as at 31 December 2016 to
2.9% as at 30 June 2017 is due primarily to the reduction of vacancy rates in the office and retail asset classes.
The EPRA Cost Ratios are increasing significantly as expenditure on consulting services is particularly high due
to the planned takeover of WCM AG and other special projects.
6 EPRA KEY FIGURES

HALF
-YEA
R FI
NAN
CIAL
REP
ORT
AS
AT 3
0 JU
NE
2017
OF
TLG
IMM
OBI
LIEN
AG
TABLE OF CONTENTS
The reconciliation of the individual EPRA key figures is as follows:
EPRA Earnings
in EUR k01/01/2017 – 30/06/2017
01/01/2016 –30/06/2016 Change Change in %
Net income for the period 76,532 33,510 43,022 128.4
Result from the remeasurement of investment property – 70,085 – 7,877 – 62,208 n/a
Result from the disposal of investment property 0 – 375 375 – 100.0
Result from the disposal of real estate inventories – 169 – 7 – 162 n/a
Tax on profits or losses on disposals 0 – 20 20 – 100.0
Gain/loss (–) from the remeasurement of derivative financial instruments – 6,115 1,638 – 7,753 n/a
Acquisition costs of share deals 2,660 559 2,101 375.8
Deferred and actual taxes in respect of EPRA adjustments 30,794 11,127 19,667 176.8
Non-controlling interests 0 – 64 64 – 100.0
EPRA Earnings 33,617 38,491 – 4,874 – 12.7
Average number of shares outstanding in thousands1 73,058 67,432
EPRA Earnings per share in EUR 0.46 0.57
1 Total number of shares as at 30 June 2016: 67.4 m, as at 30 June 2017: 74.2 m. The weighted average number of shares was 67.4 m in the first half of 2016 and 73.1 m in the first half of 2017.
EPRA Net Asset Value (EPRA NAV)
in EUR k 30/06/2017 31/12/2016 Change Change in %
Equity 1,148,263 1,009,503 138,760 13.7
Fair value adjustment of fixed assets (IAS 16) 6,492 5,327 1,165 21.9
Fair value adjustment of real estate inventories (IAS 2) 1,422 1,443 – 21 – 1.5
Fair value of derivative financial instruments 1,441 18,089 – 16,648 – 92.0
Deferred tax assets 0 – 2,652 2,652 – 100.0
Deferred tax liabilities 249,298 217,713 31,585 14.5
Goodwill – 1,164 – 1,164 0 0.0
EPRA Net Asset Value (EPRA NAV) 1,405,752 1,248,259 157,493 12.6
Number of shares in thousands 74,176 67,432
EPRA NAV per share in EUR 18.95 18.51
EPRA KEY FIGURES 7

HALF
-YEA
R FI
NAN
CIAL
REP
ORT
AS
AT 3
0 JU
NE
2017
OF
TLG
IMM
OBI
LIEN
AG
TABLE OF CONTENTS
EPRA Triple Net Asset Value (NNNAV)
in EUR k 30/06/2017 31/12/2016 Change Change in %
EPRA Net Asset Value (EPRA NAV) 1,405,752 1,248,259 157,493 12.6
Fair value of derivative financial instruments – 1,441 – 18,089 16,648 – 92.0
Fair value adjustment of liabilities to financial institutions – 23,667 – 22,613 – 1,054 4.7
Deferred tax assets 0 2,652 – 2,652 – 100.0
Deferred tax liabilities – 249,298 – 217,713 – 31,585 14.5
EPRA Triple Net Asset Value (EPRA NNNAV) 1,131,346 992,496 138,850 14.0
Number of shares in thousands 74,176 67,432
EPRA NNNAV per share in EUR 15.25 14.72
EPRA Net Initial Yield (EPRA NIY) and EPRA “topped-up” NIY
in EUR k 30/06/2017 31.12.2016 Change Change in %
Investment property 2,257,319 2,215,228 42,091 1.9
Inventories 1,053 1,103 – 50 – 4.5
Properties classified as held for sale 37,419 19,174 18,245 95.2
Property portfolio (net) 2,295,791 2,235,505 60,286 2.7
Estimated transaction costs 166,029 160,047 5,982 3.7
Property portfolio (gross) 2,461,820 2,395,552 66,268 2.8
Annualised cash passing rental income 154,679 154,511 168 0.1
Property outgoings – 17,879 – 17,994 115 – 0.6
Annualised net rents 136,800 136,517 283 0.2
Notional rent for ongoing rent-free periods 2,436 764 1,672 218.8
Annualised “topped-up” net rent 139,236 137,281 1,955 1.4
EPRA Net Initial Yield (NIY) in % 5.6 5.7 – 0.1 pp
EPRA “topped-up” Net Initial Yield in % 5.7 5.7 0.0 pp
8 EPRA KEY FIGURES

HALF
-YEA
R FI
NAN
CIAL
REP
ORT
AS
AT 3
0 JU
NE
2017
OF
TLG
IMM
OBI
LIEN
AG
TABLE OF CONTENTS
EPRA Vacancy Rate
in EUR k 30/06/2017 31/12/2016 Change Change in %
Market rent for vacant properties 4,597 6,052 – 1,455 – 24.0
Total market rent 160,580 159,728 852 0.5
EPRA Vacancy Rate in % 2.9 3.8 – 0.9 pp
EPRA Cost Ratio
in EUR k01/01/2017 –30/06/2017
01/01/2016 – 30/06/2016 Change Change in %
Costs pursuant to the consolidated statement of comprehensive income under IFRS
Expenses relating to letting activities 22,707 17,476 5,231 29.9
Personnel expenses 5,711 5,649 62 1.1
Depreciation and amortisation 263 286 – 23 – 8.0
Other operating expenses 6,840 3,071 3,769 122.7
Income from recharged operating costs – 14,249 – 10,403 – 3,846 37.0
Income from other goods and services – 771 – 688 – 83 12.1
Other operating income from reimbursements – 18 – 19 1 – 5.3
Ground rent – 4 – 4 0 0.0
EPRA costs (including direct vacancy costs) 20,479 15,368 5,111 33.3
Direct vacancy costs – 753 – 966 213 – 22.0
EPRA costs (excluding direct vacancy costs) 19,726 14,402 5,324 37.0
Rental income 78,481 67,585 10,896 16.1
EPRA Cost Ratio (including direct vacancy costs) in % 26.1 22.7 3.4 pp
EPRA Cost Ratio (excluding direct vacancy costs) in % 25.1 21.3 3.8 pp
EPRA KEY FIGURES 9

HALF
-YEA
R FI
NAN
CIAL
REP
ORT
AS
AT 3
0 JU
NE
2017
OF
TLG
IMM
OBI
LIEN
AG
TABLE OF CONTENTS
CONSOLIDATED INTERIMMANAGEMENT REPORT
11 1. COMPANY FUNDAMENTALS11 1.1 BUSINESS MODEL OF THE GROUP
11 1.1.1 Organisational structure
11 2. ECONOMIC REPORT11 2.1 GENERAL ECONOMIC CONDITIONS AND REAL ESTATE MARKETS
11 2.1.1 General economic conditions
11 2.1.2 Economic activity in the real estate sector
12 2.1.3 Developmentoftheofficepropertymarket
12 2.1.4 Developmentoftheretailpropertymarket
12 2.1.5 Developmentofthehotelpropertymarket
12 2.2 POSITION OF THE COMPANY
12 2.2.1 Course of business
13 2.2.2 Financial performance
14 2.2.3 Cashflows
15 2.2.4 Financial position
16 2.2.5 Financial performance indicators
18 3. REPORT ON RISKS, OPPORTUNITIES AND FORECASTS18 3.1 RISK REPORT
18 3.2 OPPORTUNITY REPORT
19 3.3 FORECAST REPORT
10 CONSOLIDATED INTERIM MANAGEMENT REPORTTABLE OF CONTENTS

HALF
-YEA
R FI
NAN
CIAL
REP
ORT
AS
AT 3
0 JU
NE
2017
OF
TLG
IMM
OBI
LIEN
AG
TABLE OF CONTENTS
1. COMPANY FUNDAMENTALS
1.1 BUSINESS MODEL OF THE GROUP
1.1.1 Organisational structure
The business model and the corporate strategy of TLG IMMOBILIEN are based on the following pillars:
Portfolio management
Thanks to a deep understanding of local markets and real estate, strategic services such as strategic
portfolio management and monitoring, valuation and portfolio planning are rendered centrally.
Asset management
TLG IMMOBILIEN covers significant links in the real estate value chain internally. With the engineering
and letting units, asset management is responsible for all measures on the level of the property that
influence the value of a property.
Transaction management
With its many years of expertise, TLG IMMOBILIEN is exceptionally well connected in its core markets.
This generates attractive opportunities for the company to grow and chances to sell properties for the
best possible prices in line with its portfolio optimisation strategy.
Property management
Property management bears a decentralised responsibility for the commercial management of the
properties, including tenant relations, and is in charge of external facility management.
2. ECONOMIC REPORT
2.1 GENERAL ECONOMIC CONDITIONS AND REAL ESTATE MARKETS
2.1.1 General economic conditions
In the second quarter of 2017, the German Institute for Economic Research (DIW Berlin) expects the German
economy to grow significantly and its GDP to increase by 0.5% over the previous quarter. The euphoric
attitudes of businesses indicates that the German economy will largely be able to maintain the rapid growth
rate of the first quarter. Examined more closely, however, the expectations of businesses prove not to be
as optimistic as the evaluations of the current situation. The order books of the industry are indeed full,
yet the volume of incoming orders has been stagnating since the start of the year. As a result, the driving
forces exerted by the manufacturing industry and service sectors will be weaker in future. Whereas foreign
demand for German products remains strong, private consumption can be expected to decline due to the
rapid increase in prices. Besides industry, the dynamism of the service sectors is now also becoming stifled,
possibly due to the multiplying indications that the increase in employment rates in the job market is ongoing
yet curbed.
2.1.2 Economic activity in the real estate sector
According to analyses carried out by German Property Partners, the volume of transactions on the commercial
real estate transaction markets in the top seven German locations was around EUR 11.0 bn in the first half of
2017. This represents an increase of around 20% compared to the first half of 2016. The volume of transactions
therefore remains at a high level. Given the consistently high level of demand, it remains difficult to find
suitable investment properties, especially in the core segment. However, the first signs are beginning to show
that owners are favouring disposing of properties and holding them for less time.
CONSOLIDATED INTERIM MANAGEMENT REPORT 11COMPANY FUNDAMENTALS – ECONOMIC REPORT

TABLE OF CONTENTS
HALF
-YEA
R FI
NAN
CIAL
REP
ORT
AS
AT 3
0 JU
NE
2017
OF
TLG
IMM
OBI
LIEN
AG
12 CONSOLIDATED INTERIM MANAGEMENT REPORTECONOMIC REPORT
2.1.3Developmentoftheofficepropertymarket
According to Savills, the volume of transactions in the German office property market totalled around
EUR 10.1 bn in the first half of 2017, surpassing the same period in the previous year by around 35%. The
growth was mostly driven by transactions in the top seven locations, to which around four fifths of the total
registered volume of transactions were attributable. According to Savills, investors are concentrating on major
metropolises due primarily to the positive development of the lettings markets there. For instance, top rents
increased by almost 4% within twelve months, whereas the vacancy rate fell by 70 basis points. Portfolios
accounting for more than 30% of the volume of transactions were particularly high in demand. Compared to
the previous year, the turnover per transaction increased by around 10% to almost EUR 48.0 m. In light of the
consistently strong demand amongst investors, Savills expects the volume of office property transactions in
2017 as a whole to overtake the EUR 24.0 bn recorded in the previous year.
2.1.4Developmentoftheretailpropertymarket
According to Savills, in the first half of 2017 the volume of transactions in the retail property market increased
by around 20% compared to the previous year, reaching EUR 5.9 bn. In this regard, investments in special
market centres increased particularly strongly; with an increase of 94% over the previous year, the volume
has almost doubled. One reason for this is that, with their anchor tenants in the food retail sector, special
market centres are properties considered relatively highly resistant to the competition posed by online retail.
Due to the growing demand, top yields in this segment – which stabilised at 5.2% in the first half of 2017 – can
be expected to decrease slightly over the course of the rest of the year.
2.1.5Developmentofthehotelpropertymarket
According to the German Federal Statistical Office, 41.7 million overnight stays were registered throughout
the country in May 2017. This represents a decrease of 3.0% compared to May 2016. However, at 159.4 m
the total number of overnight stays from January to May 2017 was 1.0% higher than in the same period in
the previous year.
According to CBRE, a total of around EUR 1.8 bn was invested in German hotel properties in the first half
of 2017. This was around 9% less than in the same period in the previous year. However, the number of
investments was almost 10% higher at 68, of which around two thirds were individual transactions. Munich
experienced the highest level of turnover with one quarter of the total volume of transactions.
2.2 POSITION OF THE COMPANY
2.2.1 Course of business
The properties were as follows in the reporting period:
Key figures Total Office Retail Hotel Other
Property value in EUR k1 2,302,151 1,057,453 894,663 277,262 72,772
Annual rent excluding utilities in EUR k2 157,117 67,058 68,831 16,360 4,869
In-place rental yield in % 6.8 6.4 7.7 5.8 6.5
EPRA Vacancy Rate in % 2.9 3.9 1.7 1.7 7.8
WALT in years 6.1 4.9 5.5 12.7 7.5
Properties (number) 386 60 263 7 56
Lettable area in sqm 1,396,261 603,153 580,641 109,488 102,979
1 In line with values disclosed according to IAS 40, IAS 2, IAS 16 and IFRS 52 The annual rent excluding utilities is calculated using the annualised rents agreed as at the reporting date – not factoring in rent-free periods.

TABLE OF CONTENTS
HALF
-YEA
R FI
NAN
CIAL
REP
ORT
AS
AT 3
0 JU
NE
2017
OF
TLG
IMM
OBI
LIEN
AG
The property portfolio of TLG IMMOBILIEN comprises the office, retail, hotel, and other asset classes. As at
30 June 2017, the portfolio contains 386 properties (31/12/2016: 404) with a property value (IFRS) of around
EUR 2.302 bn (31/12/2016: around EUR 2.242 bn). The 2.7% increase in the value of the property portfolio
is due primarily to the positive market developments, especially in Berlin. The market developments are
supported by the positive results of the active portfolio and asset management. On a like-for-like basis, the
property portfolio experienced a EUR 3.6 m or 2.4% increase in annual rent excluding utilities in the first half
of 2017 alongside a 1.0 percentage point decrease in EPRA Vacancy Rate to just 2.9% as well as an almost
entirely stable weighted average lease term (WALT) of temporary rental agreements of 6.1 years.
The fair values of the individual asset classes developed as follows:
in EUR m
2.2.2 Financial performance
In the first half of 2017, TLG IMMOBILIEN generated net income for the period of EUR k 76,532. The EUR k 43,022
increase compared to the same period in the previous year is due primarily to higher measurement gains.
The table below presents the financial performance:
in EUR k01/01/2017 – 30/06/2017
01/01/2016 – 30/06/2016 Change Change in %
Net operating income from letting activities 71,147 61,240 9,907 16.2
Result from the remeasurement of investment property 70,085 7,877 62,208 n/a
Result from the disposal of investment property 0 610 – 610 – 100.0
Result from the disposal of real estate inventories 169 7 162 n/a
Other operating income 815 443 372 84.0
Personnel expenses – 5,711 – 5,649 – 62 1.1
Depreciation and amortisation – 263 – 286 23 – 8.0
Other operating expenses – 6,840 – 3,071 – 3,769 122.7
Earnings before interest and taxes (EBIT) 129,402 61,171 68,231 111.5
Financial income 90 125 – 35 – 28.0
Financial expenses – 26,024 – 11,969 – 14,055 117.4
Gain/loss (–) from the remeasurement of derivative financial instruments 6,115 – 1,638 7,753 n/a
Earnings before taxes 109,583 47,688 61,895 129.8
Income taxes – 33,051 – 14,178 – 18,873 133.1
Net income for the period 76,532 33,510 43,022 128.4
Other comprehensive income (OCI) 7,771 – 3,322 11,093 n/a
Total comprehensive income for the period 84,303 30,188 54,115 179.3
CONSOLIDATED INTERIM MANAGEMENT REPORT 13 ECONOMIC REPORT
Total Office Retail Hotel Other
2,302
1,057895
27773
2,242
1,004896
27269
30/06/2017 31/12/2016

TABLE OF CONTENTS
HALF
-YEA
R FI
NAN
CIAL
REP
ORT
AS
AT 3
0 JU
NE
2017
OF
TLG
IMM
OBI
LIEN
AG
Compared to the same period in the previous year, the net operating income from letting activities of EUR k 71,147 increased by EUR k 9,907, due primarily to new properties being placed under management.
The result from the remeasurement of investment property remained positive, due mainly to the persistently favourable market conditions in the first half of 2017, especially in Berlin. In addition to the favourable market conditions, the low EPRA Vacancy Rate of 2.9% and a weighted average lease term (WALT) of temporary rental agreements of 6.1 years had a stabilising effect on the fair values.
Other operating income totalled EUR k 815 and was therefore higher than in the same period in the previous year due to factors including income of EUR k 159 from the liquidation of subsidiaries.
On 10 May 2017, the Management Board of TLG IMMOBILIEN AG submitted a public takeover offer to the shareholders of WCM Beteiligungs- und Grundbesitz-Aktiengesellschaft (WCM AG). During the reporting period, the preparation of the planned takeover incurred expenses of EUR k 2,660 which were largely attributable to legal and consulting fees. Other operating expenses therefore increased by EUR k 3,769 to EUR k 6,840 compared to the previous period. Additionally, reversals of provisions totalling EUR k 712 served to decrease expenses in 2016.
In the reporting period, financial expenses increased by EUR k 14,055 to EUR k 26,024 compared to the same period in the previous year. This was due primarily to expenses of around EUR k 12,400 for the premature repayment of loans with residual debt of EUR k 264,362 in connection with debt structure optimisation measures. Additionally, interest expenses were incurred in connection with the premature repayment of loans in the context of property disposals in the first half of the year.
The tax expenses in the first half comprise ongoing income taxes of EUR k 2,257 and deferred taxes of EUR k 30,794.
2.2.3Cashflows
The following cash flow statement was generated using the indirect method under IAS 7. The cash flows led
to a reduction in cash and cash equivalents in the first half of 2017, due mainly to the loan repayment of
EUR k 264,362 as part of the refinancing measures which stands in contrast with current loans of EUR k 166,098.
in EUR k01/01/2017 – 30/06/2017
01/01/2016 –30/06/2016 Change Change in %
1. Net cash flow from operating activities 22,072 32,610 – 10,538 – 32.3
2. Cash flow from investing activities 5,864 – 190,924 196,788 n/a
3. Cash flow from financing activities – 65,351 11,352 – 76,703 n/a
Net change in cash and cash equivalents – 37,415 – 146,962 109,547 – 74.5
Cash and cash equivalents at beginning of period 68,415 183,736 – 115,321 – 62.8
Cash and cash equivalents at end of period 31,000 36,774 – 5,774 – 15.7
In the reporting period, the cash flow from operating activities decreased by EUR k 10,538 compared to the
same period in the previous year. Besides other effects, this was influenced by the costs of refinancing loans
of around EUR k 12,400.
The positive cash flow from investing activities of EUR k 5,864 essentially reflects the cash received from the
disposal of properties. In the previous period, this was mainly influenced by the cash paid for acquisitions,
including for the acquisition of the Blue Five portfolio.
14 CONSOLIDATED INTERIM MANAGEMENT REPORTECONOMIC REPORT
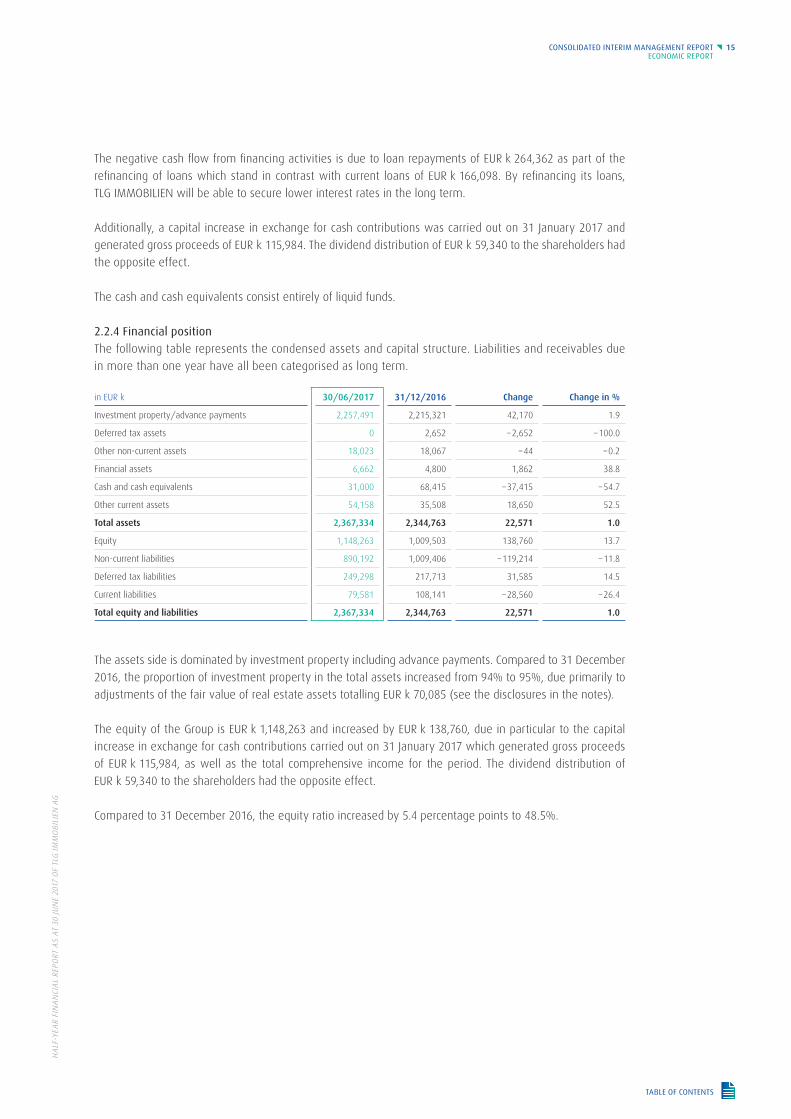
TABLE OF CONTENTS
HALF
-YEA
R FI
NAN
CIAL
REP
ORT
AS
AT 3
0 JU
NE
2017
OF
TLG
IMM
OBI
LIEN
AG
The negative cash flow from financing activities is due to loan repayments of EUR k 264,362 as part of the
refinancing of loans which stand in contrast with current loans of EUR k 166,098. By refinancing its loans,
TLG IMMOBILIEN will be able to secure lower interest rates in the long term.
Additionally, a capital increase in exchange for cash contributions was carried out on 31 January 2017 and
generated gross proceeds of EUR k 115,984. The dividend distribution of EUR k 59,340 to the shareholders had
the opposite effect.
The cash and cash equivalents consist entirely of liquid funds.
2.2.4 Financial position
The following table represents the condensed assets and capital structure. Liabilities and receivables due
in more than one year have all been categorised as long term.
in EUR k 30/06/2017 31/12/2016 Change Change in %
Investment property/advance payments 2,257,491 2,215,321 42,170 1.9
Deferred tax assets 0 2,652 – 2,652 – 100.0
Other non-current assets 18,023 18,067 – 44 – 0.2
Financial assets 6,662 4,800 1,862 38.8
Cash and cash equivalents 31,000 68,415 – 37,415 – 54.7
Other current assets 54,158 35,508 18,650 52.5
Total assets 2,367,334 2,344,763 22,571 1.0
Equity 1,148,263 1,009,503 138,760 13.7
Non-current liabilities 890,192 1,009,406 – 119,214 – 11.8
Deferred tax liabilities 249,298 217,713 31,585 14.5
Current liabilities 79,581 108,141 – 28,560 – 26.4
Total equity and liabilities 2,367,334 2,344,763 22,571 1.0
The assets side is dominated by investment property including advance payments. Compared to 31 December
2016, the proportion of investment property in the total assets increased from 94% to 95%, due primarily to
adjustments of the fair value of real estate assets totalling EUR k 70,085 (see the disclosures in the notes).
The equity of the Group is EUR k 1,148,263 and increased by EUR k 138,760, due in particular to the capital
increase in exchange for cash contributions carried out on 31 January 2017 which generated gross proceeds
of EUR k 115,984, as well as the total comprehensive income for the period. The dividend distribution of
EUR k 59,340 to the shareholders had the opposite effect.
Compared to 31 December 2016, the equity ratio increased by 5.4 percentage points to 48.5%.
CONSOLIDATED INTERIM MANAGEMENT REPORT 15ECONOMIC REPORT

TABLE OF CONTENTS
HALF
-YEA
R FI
NAN
CIAL
REP
ORT
AS
AT 3
0 JU
NE
2017
OF
TLG
IMM
OBI
LIEN
AG
2.2.5 Financial performance indicators
FFO development
in EUR k01/01/2017 –30/06/2017
01/01/2016 –30/06/2016 Change Change in %
Net income for the period 76,532 33,510 43,022 128.4
Income taxes 33,051 14,178 18,873 133.1
EBT 109,583 47,689 61,894 129.8
Result from the disposal of investment property 0 – 375 375 – 100.0
Result from the disposal of real estate inventories – 169 – 7 – 162 n/a
Result from the remeasurement of investment property – 70,085 – 7,877 – 62,208 n/a
Gain/loss (–) from the remeasurement of derivative financial instruments – 6,115 1,638 – 7,753 n/a
Other effects1 15,837 309 15,528 n/a
FFO before taxes 49,051 41,377 7,674 18.5
Income taxes – 33,051 – 14,178 – 18,873 133.1
Deferred taxes 30,794 11,127 19,667 176.8
Correction of tax effects from transaction costs and prior-period effects – 289 – 20 – 269 n/a
FFO after taxes 46,505 38,306 8,199 21.4
Average number of shares outstanding in thousands2 73,058 67,432
FFO per share in EUR 0.64 0.57 0.07 12.3
1 The other effects include (a) the depreciation of IAS 16 property (owner-occupied property) (EUR k 50; previous year EUR k 79),(b) personnel restructuring expenses (EUR k 244; previous year EUR k 358),(c) transaction costs (EUR k 2,660; previous year EUR k 559),(d) refinancing costs/repayment of loans (EUR k 12,964; previous year EUR k 0),(e) income from the liquidation of Wirkbau (EUR k 82, previous year EUR k 0),(f) the reversal of provisions for reclaimed subsidies (EUR k 0; previous year EUR k 404),(g) the reversal of the provision for liabilities arising from purchase agreements (EUR k 0; previous year EUR k 283).
2 Total number of shares as at 30 June 2016: 67.4 m, as at 30 June 2017: 74.2 m. The weighted average number of shares was 67.4 m in the first half of 2016 and 73.1 m in the first half of 2017.
Funds from operations (FFO) are a key performance indicator for the TLG IMMOBILIEN Group.
Funds from operations, adjusted for significant unsustainable effects and effects not affecting liquidity, totalled EUR k 46,505 in the reporting period. The considerable increase in FFO by 21.4%, or EUR k 8,199, compared to the same period in the previous year is due predominantly to the higher net income from letting activities. The higher financial expenses had the opposite effect.
FFO per share was EUR 0.64 and therefore significantly higher than in the same period in the previous year in spite of the increased number of shares resulting from the capital increase in January 2017.
16 CONSOLIDATED INTERIM MANAGEMENT REPORTECONOMIC REPORT
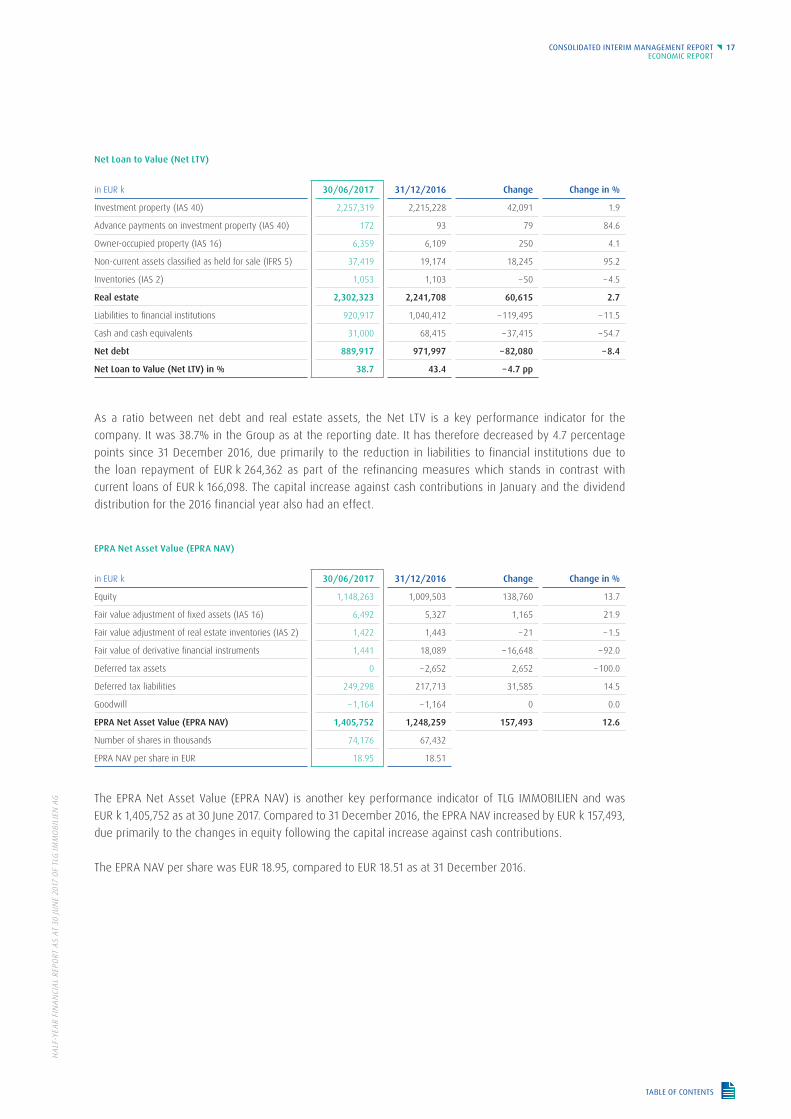
TABLE OF CONTENTS
HALF
-YEA
R FI
NAN
CIAL
REP
ORT
AS
AT 3
0 JU
NE
2017
OF
TLG
IMM
OBI
LIEN
AG
Net Loan to Value (Net LTV)
in EUR k 30/06/2017 31/12/2016 Change Change in %
Investment property (IAS 40) 2,257,319 2,215,228 42,091 1.9
Advance payments on investment property (IAS 40) 172 93 79 84.6
Owner-occupied property (IAS 16) 6,359 6,109 250 4.1
Non-current assets classified as held for sale (IFRS 5) 37,419 19,174 18,245 95.2
Inventories (IAS 2) 1,053 1,103 – 50 – 4.5
Real estate 2,302,323 2,241,708 60,615 2.7
Liabilities to financial institutions 920,917 1,040,412 – 119,495 – 11.5
Cash and cash equivalents 31,000 68,415 – 37,415 – 54.7
Net debt 889,917 971,997 – 82,080 – 8.4
Net Loan to Value (Net LTV) in % 38.7 43.4 – 4.7 pp
As a ratio between net debt and real estate assets, the Net LTV is a key performance indicator for the company. It was 38.7% in the Group as at the reporting date. It has therefore decreased by 4.7 percentage points since 31 December 2016, due primarily to the reduction in liabilities to financial institutions due to the loan repayment of EUR k 264,362 as part of the refinancing measures which stands in contrast with current loans of EUR k 166,098. The capital increase against cash contributions in January and the dividend distribution for the 2016 financial year also had an effect.
EPRA Net Asset Value (EPRA NAV)
in EUR k 30/06/2017 31/12/2016 Change Change in %
Equity 1,148,263 1,009,503 138,760 13.7
Fair value adjustment of fixed assets (IAS 16) 6,492 5,327 1,165 21.9
Fair value adjustment of real estate inventories (IAS 2) 1,422 1,443 – 21 – 1.5
Fair value of derivative financial instruments 1,441 18,089 – 16,648 – 92.0
Deferred tax assets 0 – 2,652 2,652 – 100.0
Deferred tax liabilities 249,298 217,713 31,585 14.5
Goodwill – 1,164 – 1,164 0 0.0
EPRA Net Asset Value (EPRA NAV) 1,405,752 1,248,259 157,493 12.6
Number of shares in thousands 74,176 67,432
EPRA NAV per share in EUR 18.95 18.51
The EPRA Net Asset Value (EPRA NAV) is another key performance indicator of TLG IMMOBILIEN and was EUR k 1,405,752 as at 30 June 2017. Compared to 31 December 2016, the EPRA NAV increased by EUR k 157,493, due primarily to the changes in equity following the capital increase against cash contributions.
The EPRA NAV per share was EUR 18.95, compared to EUR 18.51 as at 31 December 2016.
CONSOLIDATED INTERIM MANAGEMENT REPORT 17ECONOMIC REPORT

TABLE OF CONTENTS
HALF
-YEA
R FI
NAN
CIAL
REP
ORT
AS
AT 3
0 JU
NE
2017
OF
TLG
IMM
OBI
LIEN
AG
3. REPORT ON RISKS, OPPORTUNITIES AND FORECASTS
3.1 RISK REPORT
TLG IMMOBILIEN AG is exposed to constantly changing general economic, technical, political, legal and societal conditions that could impede its achievement of its targets, the implementation of its long-term strategies or its financial position, cash flows and financial performance. These risks are described in detail in the 2016 Group annual report.
On 10 May 2017, the Management Board of TLG IMMOBILIEN submitted a voluntary public takeover offer to the shareholders of WCM Beteiligungs- und Grundbesitz-Aktiengesellschaft (WCM AG) in the form of a share swap for new TLG shares.
The documentation for the swap offer was published and therefore submitted to the shareholders of WCM AG on 27 June 2017.
Furthermore, with the consent of the Supervisory Board, on 10 May 2017 the Management Board of TLG IMMOBILIEN resolved to utilise the 2014/II Authorised Capital one or multiple times to carry out a capital increase of up to EUR 24,521,163.00 in exchange for contributions in kind, excluding the subscription rights of the existing shareholders of TLG IMMOBILIEN.
The planned takeover of WCM AG poses both risks and opportunities.
The opportunities are described in section 3.2. Risks can arise if the takeover and integration process does not proceed according to plan or incurs higher transaction costs than originally expected. Other risks might result from change-of-control clauses in contracts of WCM AG as these grant the contractual partner a special right of termination in the event of a change of control. The expectations and plans regarding the long and short-term effects of the transaction on TLG IMMOBILIEN might prove inaccurate or incomplete.
No other changes in the risk situation compared to 31 December 2016 were identified in the reporting period.
The existence of the company is currently not considered to be at risk.
3.2 OPPORTUNITY REPORT
The intended takeover of WCM AG by TLG IMMOBILIEN will present opportunities in the accelerated expansion of the established business model of TLG IMMOBILIEN, the strengthening of its existing portfolio and the expansion of its regional coverage in western Germany. Essentially, opportunities might continue to arise from the expected synergies as well as the size-related increases in the efficiency of a combined company. The proven purchasing power of both companies and the excellent access of TLG IMMOBILIEN to growth capital can enable the combined entity to continuously increase the size of its portfolio throughout Germany.
Otherwise, we refer to the disclosures in the opportunity report in the consolidated financial statements of 31 December 2016.
18 CONSOLIDATED INTERIM MANAGEMENT REPORTREPORT ON RISKS, OPPORTUNITIES AND FORECASTS
TABLE OF CONTENTS
HALF
-YEA
R FI
NAN
CIAL
REP
ORT
AS
AT 3
0 JU
NE
2017
OF
TLG
IMM
OBI
LIEN
AG
CONSOLIDATED INTERIM MANAGEMENT REPORT 19 REPORT ON RISKS, OPPORTUNITIES AND FORECASTS
3.3 FORECAST REPORT
The expected development of TLG IMMOBILIEN in 2017 was described in detail in the consolidated management report of 31 December 2016.
In its 2016 annual report, TLG IMMOBILIEN expected funds from operations (FFO) for the 2017 financial year to be between EUR 84 m and EUR 86 m (2016: EUR 76.9 m). Due to the positive course of business, the acquisitions of the office building “astropark” and a retail property in Unterwellenborn and expected savings, TLG IMMOBILIEN now expects its funds from operations for the 2017 financial year to be between EUR 90 m and EUR 92 m. Further acquisitions in 2017 as well as the successful takeover of WCM could also increase FFO in 2017.

HALF
-YEA
R FI
NAN
CIAL
REP
ORT
AS
AT 3
0 JU
NE
2017
OF
TLG
IMM
OBI
LIEN
AG
TABLE OF CONTENTS
CONSOLIDATED INTERIMFINANCIAL STATEMENTS
21 CONSOLIDATED STATEMENT OF COMPREHENSIVE INCOME
22 CONSOLIDATED STATEMENT OF FINANCIAL POSITION
23 CONSOLIDATED CASH FLOW STATEMENT
24 CONSOLIDATED STATEMENT OF CHANGES IN EQUITY
25 CONDENSED NOTES TO THE CONSOLIDATED INTERIM FINANCIAL STATEMENTS25 A. GENERAL INFORMATION ON THE CONSOLIDATED INTERIM FINANCIAL STATEMENTS
OF TLG IMMOBILIEN AG
25 A.1 INFORMATION ON THE COMPANY
25 A.2 FUNDAMENTALS OF THE CONSOLIDATED INTERIM FINANCIAL STATEMENTS
26 B. EXPLANATION OF ACCOUNTING AND MEASUREMENT METHODS
26 C. SELECTED NOTES TO THE CONSOLIDATED STATEMENT OF FINANCIAL POSITION
26 C.1 INVESTMENT PROPERTY
28 C.2 EQUITY
28 D. SELECTED NOTES TO THE CONSOLIDATED STATEMENT OF COMPREHENSIVE INCOME
28 D.1 RESULT FROM THE REMEASUREMENT OF INVESTMENT PROPERTY
28 D.2 NET INTEREST
29 D.3 GAIN/LOSS (–) FROM THE REMEASUREMENT OF DERIVATIVE FINANCIAL INSTRUMENTS
29 D.4 INCOME TAXES
29 D.5 EARNINGS PER SHARE
30 E. OTHER INFORMATION
30 E.1 DISCLOSURES RELATING TO FINANCIAL INSTRUMENTS
30 E.2 RELATED COMPANIES AND PARTIES
30 E.3 SUBSEQUENT EVENTS
30 E.4 RESPONSIBILITY STATEMENT
31 F. AUDITOR’S REPORT
20 CONSOLIDATED INTERIM FINANCIAL STATEMENTSTABLE OF CONTENTS
HALF
-YEA
R FI
NAN
CIAL
REP
ORT
AS
AT 3
0 JU
NE
2017
OF
TLG
IMM
OBI
LIEN
AG
TABLE OF CONTENTS
KON
ZER
NA
BSC
HLU
SS
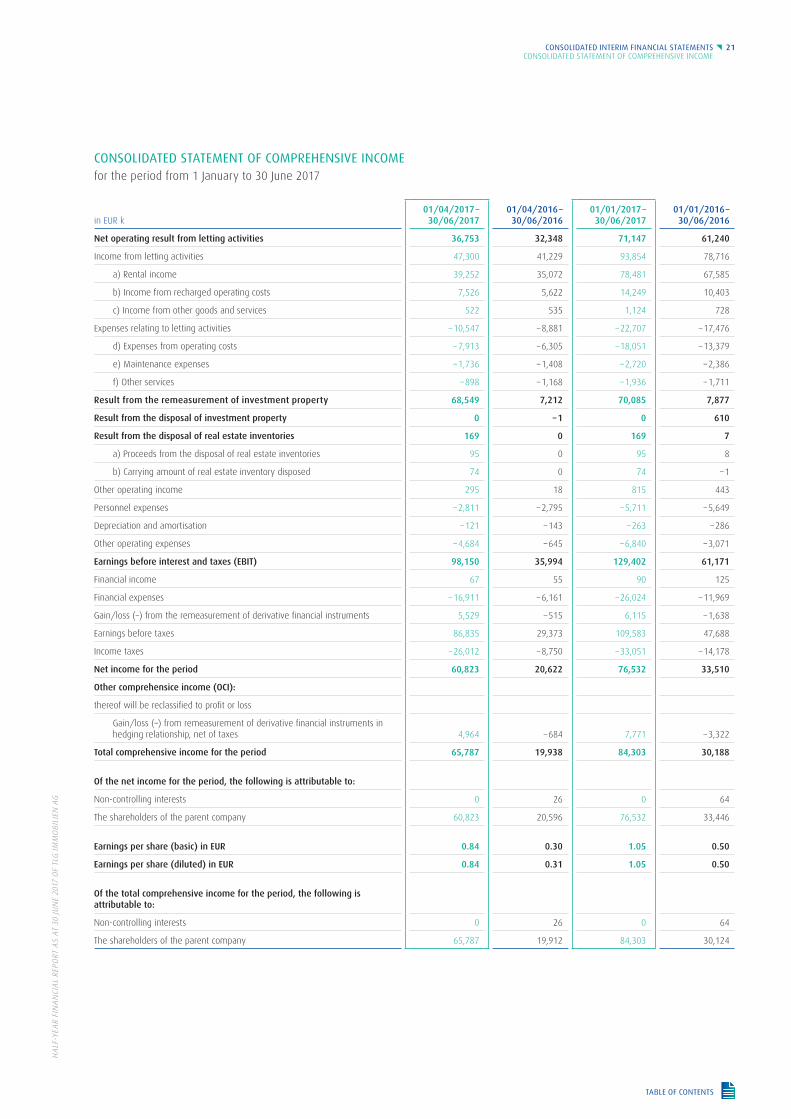
CONSOLIDATED STATEMENT OF COMPREHENSIVE INCOME for the period from 1 January to 30 June 2017
in EUR k01/04/2017 –30/06/2017
01/04/2016 –30/06/2016
01/01/2017 –30/06/2017
01/01/2016 –30/06/2016
Net operating result from letting activities 36,753 32,348 71,147 61,240
Income from letting activities 47,300 41,229 93,854 78,716
a) Rental income 39,252 35,072 78,481 67,585
b) Income from recharged operating costs 7,526 5,622 14,249 10,403
c) Income from other goods and services 522 535 1,124 728
Expenses relating to letting activities – 10,547 – 8,881 – 22,707 – 17,476
d) Expenses from operating costs – 7,913 – 6,305 – 18,051 – 13,379
e) Maintenance expenses – 1,736 – 1,408 – 2,720 – 2,386
f) Other services – 898 – 1,168 – 1,936 – 1,711
Result from the remeasurement of investment property 68,549 7,212 70,085 7,877
Result from the disposal of investment property 0 – 1 0 610
Result from the disposal of real estate inventories 169 0 169 7
a) Proceeds from the disposal of real estate inventories 95 0 95 8
b) Carrying amount of real estate inventory disposed 74 0 74 – 1
Other operating income 295 18 815 443
Personnel expenses – 2,811 – 2,795 – 5,711 – 5,649
Depreciation and amortisation – 121 – 143 – 263 – 286
Other operating expenses – 4,684 – 645 – 6,840 – 3,071
Earnings before interest and taxes (EBIT) 98,150 35,994 129,402 61,171
Financial income 67 55 90 125
Financial expenses – 16,911 – 6,161 – 26,024 – 11,969
Gain/loss (–) from the remeasurement of derivative financial instruments 5,529 – 515 6,115 – 1,638
Earnings before taxes 86,835 29,373 109,583 47,688
Income taxes – 26,012 – 8,750 – 33,051 – 14,178
Net income for the period 60,823 20,622 76,532 33,510
Other comprehensice income (OCI):
thereof will be reclassified to profit or loss
Gain/loss (–) from remeasurement of derivative financial instruments in hedging relationship, net of taxes 4,964 – 684 7,771 – 3,322
Total comprehensive income for the period 65,787 19,938 84,303 30,188
Of the net income for the period, the following is attributable to:
Non-controlling interests 0 26 0 64
The shareholders of the parent company 60,823 20,596 76,532 33,446
Earnings per share (basic) in EUR 0.84 0.30 1.05 0.50
Earnings per share (diluted) in EUR 0.84 0.31 1.05 0.50
Of the total comprehensive income for the period, the following is attributable to:
Non-controlling interests 0 26 0 64
The shareholders of the parent company 65,787 19,912 84,303 30,124
CONSOLIDATED INTERIM FINANCIAL STATEMENTS 21 CONSOLIDATED STATEMENT OF COMPREHENSIVE INCOME

HALF
-YEA
R FI
NAN
CIAL
REP
ORT
AS
AT 3
0 JU
NE
2017
OF
TLG
IMM
OBI
LIEN
AG
TABLE OF CONTENTS
22 CONSOLIDATED INTERIM FINANCIAL STATEMENTSCONSOLIDATED STATEMENT OF FINANCIAL POSITION
CONSOLIDATED STATEMENT OF FINANCIAL POSITIONas at 30 June 2017
Assets
in EUR k 30/06/2017 31/12/2016
A) Non-current assets 2,282,176 2,240,840
Investment property 2,257,319 2,215,228
Advance payments on investment property 172 93
Property, plant and equipment 6,564 6,672
Intangible assets 1,581 1,413
Other non-current financial assets 6,662 4,800
Other assets 9,878 9,982
Deferred tax assets 0 2,652
B) Current assets 85,158 103,923
Inventories 1,053 1,103
Trade receivables 4,872 5,997
Receivables from income taxes 248 1,239
Other current financial assets 1,900 864
Other receivables and assets 8,666 7,131
Cash and cash equivalents 31,000 68,415
Non-current assets classified as held for sale 37,419 19,174
Total assets 2,367,334 2,344,763
Equity and liabilities
in EUR k 30/06/2017 31/12/2016
A) Equity 1,148,263 1,009,503
Subscribed capital 74,176 67,432
Capital reserves 547,195 440,267
Retained earnings 532,410 515,094
Other reserves – 5,518 – 13,290
Equity attributable to the shareholders of the parent company 1,148,263 1,009,503
B) Liabilities 1,219,071 1,335,260
I.) Non-current liabilities 1,139,490 1,227,119
Non-current liabilities to financial institutions 870,763 975,164
Pension provisions 8,262 8,347
Non-current derivative financial instruments 5,616 20,370
Other non-current liabilities 5,551 5,525
Deferred tax liabilities 249,298 217,713
II.) Current liabilities 79,581 108,141
Current liabilities to financial institutions 50,154 65,248
Trade payables 16,011 21,178
Other current provisions 1,569 1,828
Tax liabilities 2,728 4,512
Other current liabilities 9,119 15,375
Total equity and liabilities 2,367,334 2,344,763
HALF
-YEA
R FI
NAN
CIAL
REP
ORT
AS
AT 3
0 JU
NE
2017
OF
TLG
IMM
OBI
LIEN
AG
TABLE OF CONTENTS
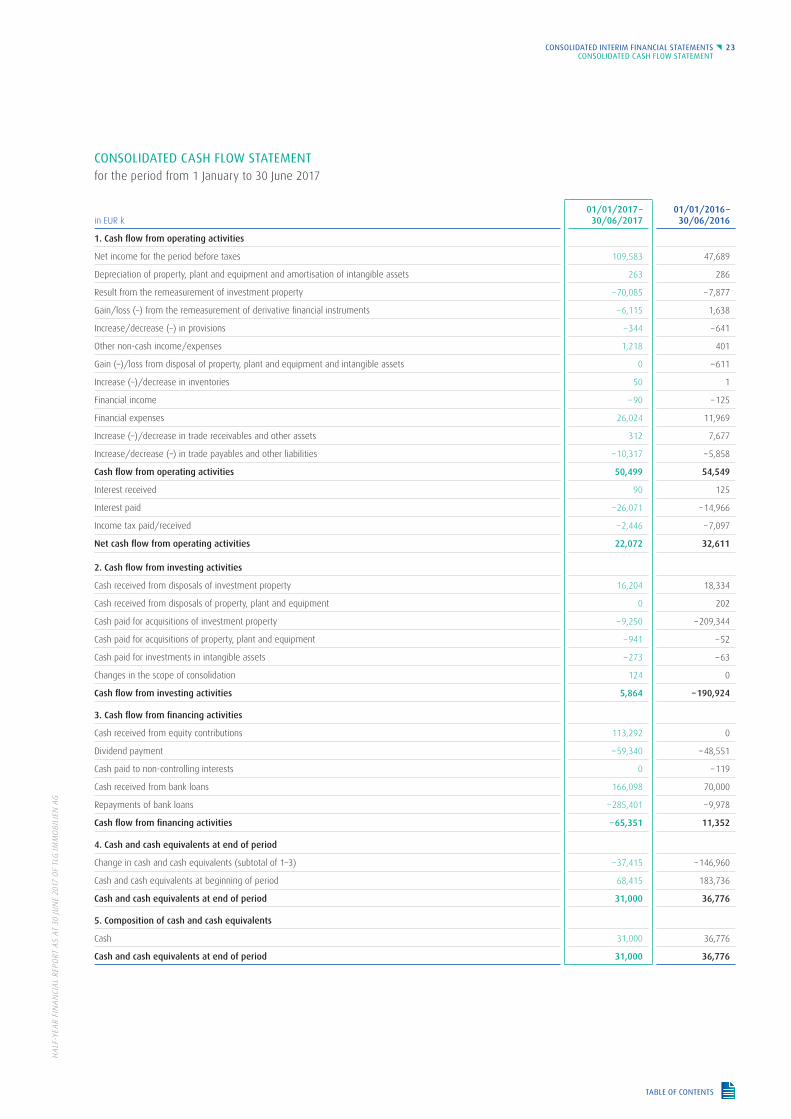
CONSOLIDATED CASH FLOW STATEMENTfor the period from 1 January to 30 June 2017
in EUR k01/01/2017 –30/06/2017
01/01/2016 –30/06/2016
1. Cash flow from operating activities
Net income for the period before taxes 109,583 47,689
Depreciation of property, plant and equipment and amortisation of intangible assets 263 286
Result from the remeasurement of investment property – 70,085 – 7,877
Gain/loss (–) from the remeasurement of derivative financial instruments – 6,115 1,638
Increase/decrease (–) in provisions – 344 – 641
Other non-cash income/expenses 1,218 401
Gain (–)/loss from disposal of property, plant and equipment and intangible assets 0 – 611
Increase (–)/decrease in inventories 50 1
Financial income – 90 – 125
Financial expenses 26,024 11,969
Increase (–)/decrease in trade receivables and other assets 312 7,677
Increase/decrease (–) in trade payables and other liabilities – 10,317 – 5,858
Cash flow from operating activities 50,499 54,549
Interest received 90 125
Interest paid – 26,071 – 14,966
Income tax paid/received – 2,446 – 7,097
Net cash flow from operating activities 22,072 32,611
2. Cash flow from investing activities
Cash received from disposals of investment property 16,204 18,334
Cash received from disposals of property, plant and equipment 0 202
Cash paid for acquisitions of investment property – 9,250 – 209,344
Cash paid for acquisitions of property, plant and equipment – 941 – 52
Cash paid for investments in intangible assets – 273 – 63
Changes in the scope of consolidation 124 0
Cash flow from investing activities 5,864 – 190,924
3. Cash flow from financing activities
Cash received from equity contributions 113,292 0
Dividend payment – 59,340 – 48,551
Cash paid to non-controlling interests 0 – 119
Cash received from bank loans 166,098 70,000
Repayments of bank loans – 285,401 – 9,978
Cash flow from financing activities – 65,351 11,352
4. Cash and cash equivalents at end of period
Change in cash and cash equivalents (subtotal of 1–3) – 37,415 – 146,960
Cash and cash equivalents at beginning of period 68,415 183,736
Cash and cash equivalents at end of period 31,000 36,776
5. Composition of cash and cash equivalents
Cash 31,000 36,776
Cash and cash equivalents at end of period 31,000 36,776
CONSOLIDATED INTERIM FINANCIAL STATEMENTS 23CONSOLIDATED CASH FLOW STATEMENT

HALF
-YEA
R FI
NAN
CIAL
REP
ORT
AS
AT 3
0 JU
NE
2017
OF
TLG
IMM
OBI
LIEN
AG
TABLE OF CONTENTS
CONSOLIDATED STATEMENT OF CHANGES IN EQUITYfor the period from 1 January to 30 June 2017
in EUR kSubscribed
capitalCapital
reservesRetained earnings
Other comprehensive income (OCI)
Non- controlling
interests Equity
Reserve hedge
accounting
Actuarialgains/losses
01/01/2016 67,432 439,510 469,369 – 9,347 – 1,899 2,809 967,874
Net income for the period 0 0 33,446 0 0 64 33,510
Other comprehensive income (OCI) 0 0 0 – 3,322 0 0 – 3,322
Total comprehensive income for the period 0 0 33,446 – 3,322 0 64 30,188
Adjustment for non-controlling interests 0 0 0 0 0 – 120 – 120
Dividend payment 0 0 – 48,551 0 0 0 – 48,551
Capital contribution in connection with share-based remuneration 0 401 0 0 0 0 401
Change during the period 0 401 – 15,105 – 3,322 0 – 56 – 18,082
30/06/2016 67,432 439,911 454,264 – 12,669 – 1,899 2,753 949,792
01/01/2017 67,432 440,267 515,094 – 11,128 – 2,162 0 1,009,503
Net income for the period 0 0 76,532 0 0 0 76,532
Other comprehensive income (OCI) 0 0 0 7,771 0 0 7,771
Total comprehensive income for the period 0 0 76,532 7,771 0 0 84,303
Change in scope of consolidation 0 0 124 0 0 0 124
Dividend payment 0 0 – 59,340 0 0 0 – 59,340
Share capital increase 6,744 109,240 0 0 0 0 115,984
Transaction costs relating to the share capital increase, after taxes 0 – 2,692 0 0 0 0 – 2,692
Capital contribution in connection with share-based remuneration 0 380 0 0 0 0 380
Change during the period 6,744 106,928 17,316 7,771 0 0 138,760
30/06/2017 74,176 547,195 532,410 – 3,356 – 2,162 0 1,148,263
24 CONSOLIDATED INTERIM FINANCIAL STATEMENTSCONSOLIDATED STATEMENT OF CHANGES IN EQUITY

HALF
-YEA
R FI
NAN
CIAL
REP
ORT
AS
AT 3
0 JU
NE
2017
OF
TLG
IMM
OBI
LIEN
AG
TABLE OF CONTENTS
CONDENSED NOTES TO THE CONSOLIDATED INTERIMFINANCIAL STATEMENTSAS AT 30 JUNE 2017
A. GENERAL INFORMATION ON THE CONSOLIDATED INTERIM FINANCIAL STATEMENTS OF TLG IMMOBILIEN AG
A.1 INFORMATION ON THE COMPANY
TLG IMMOBILIEN AG, Berlin, is an Aktiengesellschaft (stock corporation) in Germany with its headquarters at
Hausvogteiplatz 12, 10117 Berlin, entered in the commercial register of Berlin under the number HRB 161314 B,
and is – together with its subsidiaries, the TLG IMMOBILIEN Group (short: TLG IMMOBILIEN) – one of the largest
providers of commercial real estate in Germany.
The main activities consist of the operation of real estate businesses and transactions of all types in connection
with this, as well as the letting, management, acquisition, disposal and development of office, retail and hotel
properties, either itself or via companies of which the company is a shareholder.
A.2 FUNDAMENTALS OF THE CONSOLIDATED INTERIM FINANCIAL STATEMENTS
The consolidated interim financial statements of TLG IMMOBILIEN AG were prepared in condensed form in
accordance with IAS 34 (Interim Financial Reporting) and the International Financial Reporting Standards
(IFRS) adopted and published by the International Accounting Standards Board (IASB), as adopted by the
European Union. The consolidated interim financial statements were prepared in accordance with the rulings
of Regulation (EC) No. 1606/2002 of the European Parliament and of the Council of 19 July 2002 on the
application of international accounting standards. The requirements of IAS 34 (Interim Financial Reporting)
were adhered to. The notes are presented in condensed form on the basis of the option provided by IAS 34.10.
These condensed consolidated interim financial statements have been subjected to a review.
The consolidated interim financial statements are comprised of the consolidated statement of comprehensive
income, the consolidated balance sheet, the consolidated statement of cash flow, the consolidated statement
of changes in equity and the notes to the consolidated financial statements. Besides the consolidated interim
financial statements, the interim report contains the interim group management report and the responsibility
statement.
The currency of the consolidated interim financial statements is the euro.
Unless stated otherwise, all amounts are given in thousands of euros (EUR k). In tables and references – for
reasons of calculation – there can be rounding differences to the mathematically exactly determined figures.
Since 31 December 2016, one company has been deconsolidated from the scope of consolidation.
There have been no other changes to the scope of consolidation since 31 December 2016.
CONSOLIDATED INTERIM FINANCIAL STATEMENTS 25 CONDENSED NOTES TO THE CONSOLIDATED INTERIM FINANCIAL STATEMENTS
GENERAL INFORMATION ON THE CONSOLIDATED INTERIM FINANCIAL STATEMENTS OF TLG IMMOBILIEN AG

HALF
-YEA
R FI
NAN
CIAL
REP
ORT
AS
AT 3
0 JU
NE
2017
OF
TLG
IMM
OBI
LIEN
AG
TABLE OF CONTENTS
26 CONSOLIDATED INTERIM FINANCIAL STATEMENTSCONDENSED NOTES TO THE CONSOLIDATED INTERIM FINANCIAL STATEMENTSEXPLANATION OF ACCOUNTING AND MEASUREMENT METHODS – SELECTED NOTES TO THE CONSOLIDATED STATEMENT OF FINANCIAL POSITION
B. EXPLANATION OF ACCOUNTING AND MEASUREMENT METHODS
The accounting and measurement methods applied in these consolidated interim financial statements are
identical to the methods presented in the IFRS consolidated financial statements as at 31 December 2016.
These consolidated interim financial statements should therefore be read in conjunction with the consolidated
financial statements of TLG IMMOBILIEN of 31 December 2016.
As at 31 December 2016, the investment property had been subjected to a detailed external valuation by
Savills Advisory Services Germany GmbH & Co. KG and recognised at fair value.
An external expert carries out a valuation every six months and the most recently recognised fair values are
valued internally on the other reporting dates. The latest valuation carried out by an external expert was on
30 June 2017.
The TLG IMMOBILIEN Group has fully applied all new mandatory standards and interpretations as at 1 January
2017. There were no major effects on the consolidated financial statements as a result.
C. SELECTED NOTES TO THE CONSOLIDATED STATEMENT OF FINANCIAL POSITION
C.1 INVESTMENT PROPERTY
The carrying amount of the investment property had developed as follows as at the reporting date:
in EUR k 2017 2016
Carrying amount as at 01/01 2,215,228 1,739,474
Acquisitions 514 442,998
Capitalisation of construction and modernisation expenses 5,887 18,543
Reclassification as assets held for sale – 34,449 – 28,857
Reclassification from property, plant and equipment 53 3,211
Fair value adjustments 70,085 39,860
Carrying amount as at 30/06/2017 and 31/12/2016 2,257,319 2,215,228
The portfolio strategy of TLG IMMOBILIEN stipulates the concentration on the asset classes of office and retail,
as well as hotels with long-term leases in selected central locations. While the office portfolio focuses largely
on promising A and B-rated cities, the retail portfolio – which is characterised by neighbourhood shopping
centres specializing in the food retail segment – is more widely distributed. Decisions on acquisitions, sales
and pending investments are subject to the named principles of the portfolio strategy.
In the first half of 2017, the changes in the fair value of the portfolio were due primarily to fair value
adjustments (remeasurement) of EUR k 70,085 (previous year EUR k 39,860) as well as EUR k – 34,449
(previous year EUR k – 28,857) in reclassifications as assets held for sale.
Of the reclassifications as assets held for sale, 78% are attributable to the strategic disposal of two retail
packages with 30 properties in total, mostly discounters. The reclassifications also include all disposals made
during the year which are reclassified before being disposed of as assets held for sale.

HALF
-YEA
R FI
NAN
CIAL
REP
ORT
AS
AT 3
0 JU
NE
2017
OF
TLG
IMM
OBI
LIEN
AG
TABLE OF CONTENTS
The remeasurement in the first half of 2017 was due mainly to the highly dynamic development of the
markets, especially in Berlin. The market developments are supported by the positive results of the active
portfolio and asset management. The dormant portfolio experienced a EUR 3.7 m or 2.4% increase in annual
rent excluding utilities in the first half of 2017 alongside a 1.0 percentage points decrease in EPRA Vacancy
Rate to just 2.9% as well as a stable weighted average lease term (WALT) of temporary rental agreements
of 6.1 years. The dormant portfolio comprises properties that were in the portfolio on both 1 January and
30 June 2017, i.e. properties that were not acquired or reclassified as assets held for sale in the first half of
the year. Of the remeasurement, 92% was attributable to the dormant portfolio.
The capitalisation of construction expenses totalling EUR k 5,887 (previous year EUR k 18,543) is almost
entirely attributable to the core office, retail and hotel asset classes. The slight decrease compared to the first
half of the previous year, which saw capitalisations of EUR k 7,378, is due primarily to higher costs for the
development of office space now being rented out, especially in the office property at Alexanderstrasse 1, 3,
5 in Berlin, which was almost fully occupied as at 30 June 2017 with an EPRA Vacancy Rate of 1.4%.
As at 30 June 2017, the fair values of the investment property, broken down by measurement method as
well as by asset class, are as follows. Advance payments made on these properties are not included here;
they are recognised separately in the statement of financial position.
Investment properties
As at 30/06/2017
Discounted cash flow methodLiquidation
method
TotalOffice Retail Hotel Other Total Total
Investment properties in EUR k 1,050,864 863,638 277,262 39,476 2,231,240 26,079 2,257,319
Average discount rate in % 4.94 5.43 4.71 7.08 5.14 4.79 5.13
Average capitalisation rate in % 5.99 7.28 5.88 8.85 6.48 6.48
EPRA Vacancy Rate in % 3.9 1.3 1.7 8.3 2.7 43.6 2.9
Average effective rent in EUR/sqm/month 9.81 10.22 12.75 4.42 9.87 7.27 9.86
Proportion of temporary rental agreements in % 96.0 97.4 97.7 89.0 96.6 80.0 96.5
WALT of temporary rental agreements in years 4.9 5.6 12.7 7.9 6.1 2.6 6.1
As at 31/12/2016
Discounted cash flow methodLiquidation
method
TotalOffice Retail Hotel Other Total Total
Investment properties in EUR k 997,771 882,399 272,029 41,126 2,193,325 21,904 2,215,228
Average discount rate in % 4.86 5.51 4.73 6.95 5.14 4.81 5.14
Average capitalisation rate in % 6.14 7.51 5.91 8.76 6.67 6.67
EPRA Vacancy Rate in % 5.3 2.0 2.4 8.2 3.7 57.3 3.8
Average effective rent in EUR/sqm/month 9.64 9.97 12.67 4.34 9.67 12.69 9.67
Proportion of temporary rental agreements in % 95.9 97.4 99.0 90.0 96.7 89.9 96.7
WALT of temporary rental agreements in years 5.0 5.4 13.1 8.2 6.1 3.2 6.1
CONSOLIDATED INTERIM FINANCIAL STATEMENTS 27 CONDENSED NOTES TO THE CONSOLIDATED INTERIM FINANCIAL STATEMENTS
SELECTED NOTES TO THE CONSOLIDATED STATEMENT OF FINANCIAL POSITION
HALF
-YEA
R FI
NAN
CIAL
REP
ORT
AS
AT 3
0 JU
NE
2017
OF
TLG
IMM
OBI
LIEN
AG
TABLE OF CONTENTS
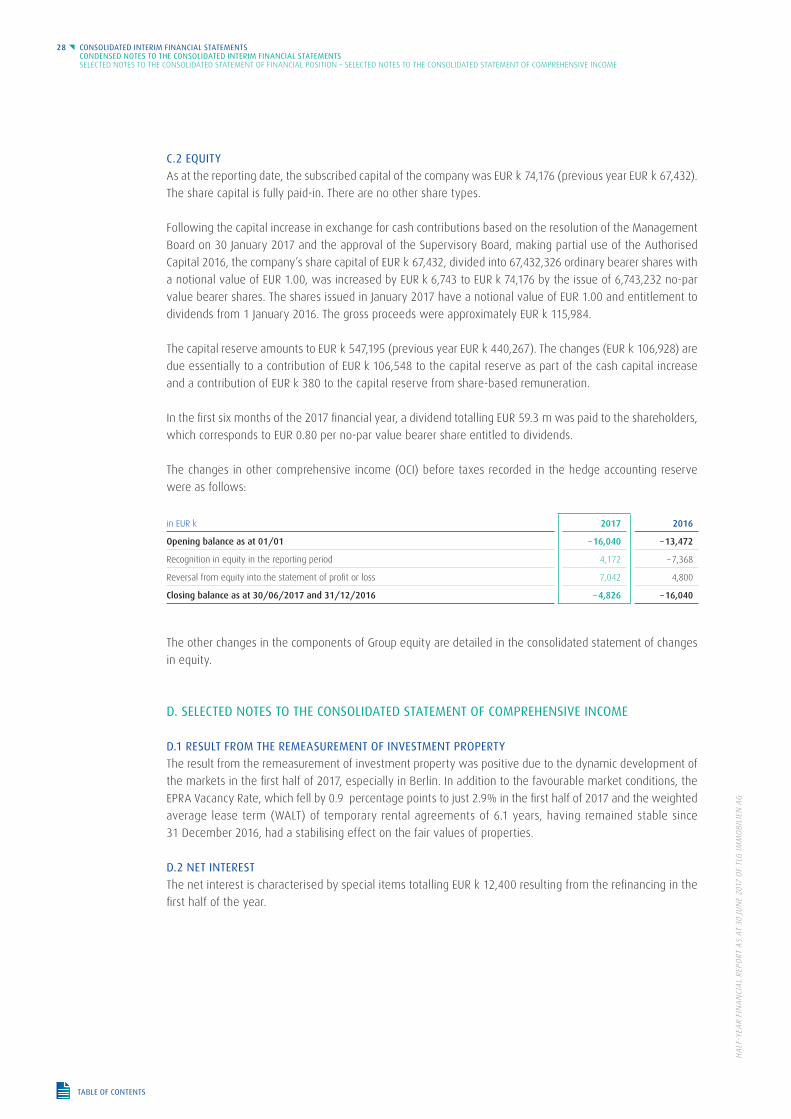
C.2 EQUITY
As at the reporting date, the subscribed capital of the company was EUR k 74,176 (previous year EUR k 67,432).
The share capital is fully paid-in. There are no other share types.
Following the capital increase in exchange for cash contributions based on the resolution of the Management
Board on 30 January 2017 and the approval of the Supervisory Board, making partial use of the Authorised
Capital 2016, the company’s share capital of EUR k 67,432, divided into 67,432,326 ordinary bearer shares with
a notional value of EUR 1.00, was increased by EUR k 6,743 to EUR k 74,176 by the issue of 6,743,232 no-par
value bearer shares. The shares issued in January 2017 have a notional value of EUR 1.00 and entitlement to
dividends from 1 January 2016. The gross proceeds were approximately EUR k 115,984.
The capital reserve amounts to EUR k 547,195 (previous year EUR k 440,267). The changes (EUR k 106,928) are
due essentially to a contribution of EUR k 106,548 to the capital reserve as part of the cash capital increase
and a contribution of EUR k 380 to the capital reserve from share-based remuneration.
In the first six months of the 2017 financial year, a dividend totalling EUR 59.3 m was paid to the shareholders,
which corresponds to EUR 0.80 per no-par value bearer share entitled to dividends.
The changes in other comprehensive income (OCI) before taxes recorded in the hedge accounting reserve
were as follows:
in EUR k 2017 2016
Opening balance as at 01/01 – 16,040 – 13,472
Recognition in equity in the reporting period 4,172 – 7,368
Reversal from equity into the statement of profit or loss 7,042 4,800
Closing balance as at 30/06/2017 and 31/12/2016 – 4,826 – 16,040
The other changes in the components of Group equity are detailed in the consolidated statement of changes
in equity.
D. SELECTED NOTES TO THE CONSOLIDATED STATEMENT OF COMPREHENSIVE INCOME
D.1 RESULT FROM THE REMEASUREMENT OF INVESTMENT PROPERTY
The result from the remeasurement of investment property was positive due to the dynamic development of
the markets in the first half of 2017, especially in Berlin. In addition to the favourable market conditions, the
EPRA Vacancy Rate, which fell by 0.9 percentage points to just 2.9% in the first half of 2017 and the weighted
average lease term (WALT) of temporary rental agreements of 6.1 years, having remained stable since
31 December 2016, had a stabilising effect on the fair values of properties.
D.2 NET INTEREST
The net interest is characterised by special items totalling EUR k 12,400 resulting from the refinancing in the
first half of the year.
28 CONSOLIDATED INTERIM FINANCIAL STATEMENTSCONDENSED NOTES TO THE CONSOLIDATED INTERIM FINANCIAL STATEMENTSSELECTED NOTES TO THE CONSOLIDATED STATEMENT OF FINANCIAL POSITION – SELECTED NOTES TO THE CONSOLIDATED STATEMENT OF COMPREHENSIVE INCOME

HALF
-YEA
R FI
NAN
CIAL
REP
ORT
AS
AT 3
0 JU
NE
2017
OF
TLG
IMM
OBI
LIEN
AG
TABLE OF CONTENTS
D.3 GAIN/LOSS (–) FROM THE REMEASUREMENT OF DERIVATIVE FINANCIAL INSTRUMENTS
Hedge accounting for derivatives was discontinued at the start of the second quarter of 2017. From then
on, all changes in the fair values will be presented in the item “Gain/loss (–) from the remeasurement of
derivative financial instruments”.
The changes in fair values recognised in other comprehensive income (OCI) in previous periods and allocated
to an equity reserve will be reversed gradually over the remaining term of each underlying transaction.
D.4 INCOME TAXES
The tax expenses/income can be broken down as follows:
in EUR k01/01/2017 –30/06/2017
01/01/2016 –30/06/2016
Current income tax 2,257 3,072
Deferred taxes 30,794 11,127
Tax expenses/income 33,051 14,179
TLG IMMOBILIEN discloses income taxes on the basis of the expected average effective Group tax rate.
A change in the tax rate compared to the previous period can be the result of various factors, especially
changes in the recognition of loss carryforwards/interest carryforwards, the accrual of tax-free income and
expenses and previous-period tax effects.
D.5 EARNINGS PER SHARE
The earnings per share are calculated by dividing the net income attributable to the shareholders of the
parent company by the weighted average number of shares outstanding.
01/01/2017 –30/06/2017
01/01/2016 –30/06/2016
Net income for the period attributable to the shareholders of the parent company in EUR k 76,532 33,446
Weighted average number of shares outstanding in thousands 73,058 67,432
Basic earnings per share in EUR 1.05 0.50
Potential diluting effect of share-based remuneration in thousands 117 74
Number of shares with a potential diluting effect in thousands 73,175 67,506
Diluted earnings per share in EUR 1.05 0.50
The share-based payments to the Management Board and some employees have a diluting effect based on
employee services already received. The number of shares on the reporting date would increase by around
117,000 shares (previous year 74,000 shares).
CONSOLIDATED INTERIM FINANCIAL STATEMENTS 29 CONDENSED NOTES TO THE CONSOLIDATED INTERIM FINANCIAL STATEMENTS
SELECTED NOTES TO THE CONSOLIDATED STATEMENT OF COMPREHENSIVE INCOME

HALF
-YEA
R FI
NAN
CIAL
REP
ORT
AS
AT 3
0 JU
NE
2017
OF
TLG
IMM
OBI
LIEN
AG
TABLE OF CONTENTS
30 CONSOLIDATED INTERIM FINANCIAL STATEMENTSCONDENSED NOTES TO THE CONSOLIDATED INTERIM FINANCIAL STATEMENTSOTHER INFORMATION
E. OTHER INFORMATION
E.1 DISCLOSURES RELATING TO FINANCIAL INSTRUMENTS
With the exception of derivatives recognised at fair value, all assets and liabilities have been measured at
amortised cost. With regard to the assets and liabilities measured at amortised cost, the carrying amounts
of the financial assets and liabilities on the statement of financial position are good approximations of fair
value, with the exception of liabilities to financial institutions.
The fair values of the liabilities to financial institutions correspond to the present values of the payments
associated with the liabilities, with consideration for the current interest parameters as at the reporting date
(level 2 according to IFRS 13), and were EUR k 944,584 as at 30 June 2017 (31 December 2016: EUR k 1,063,025).
The derivative financial instruments recognised in the statement of financial position have been measured
at fair value. They are all interest rate hedges.
The measurement methods have not changed since 31 December 2016.
E.2 RELATED COMPANIES AND PARTIES
There were no significant transactions with related companies or parties in the first six months of the 2017
financial year.
With effect from 10 February 2017, Frank D. Masuhr was appointed as a member of the Supervisory Board of
TLG IMMOBILIEN AG, initially until the end of the annual general meeting in 2017. Thereafter, Mr Masuhr was
re-appointed as a member of the Supervisory Board for another four years by the annual general meeting of
TLG IMMOBILIEN AG in 2017. Mr Masuhr succeeded Alexander Heße who resigned in 2016.
E.3 SUBSEQUENT EVENTS
There were no significant subsequent events between 30 June 2017 and the date of the publication of the
consolidated interim financial statements.
E.4 RESPONSIBILITY STATEMENT
To the best of our knowledge, and in accordance with the applicable reporting principles for interim financial
reporting, the consolidated interim financial statements of TLG IMMOBILIEN AG of 30 June 2017 give a true and
fair view of the financial performance, financial position and cash flows of the Group, and the consolidated
interim management report includes a fair review of the development and performance of the business and
the position of the Group, together with a description of the principal opportunities and risks associated with
the expected development of the Group.
Berlin, 10 August 2017
Peter Finkbeiner Niclas Karoff
Member of the Management Board Member of the Management Board

HALF
-YEA
R FI
NAN
CIAL
REP
ORT
AS
AT 3
0 JU
NE
2017
OF
TLG
IMM
OBI
LIEN
AG
TABLE OF CONTENTS
CONSOLIDATED INTERIM FINANCIAL STATEMENTS 31 CONDENSED NOTES TO THE CONSOLIDATED INTERIM FINANCIAL STATEMENTS
AUDITOR’S REPORT
F. AUDITOR’S REPORT
To TLG IMMOBILIEN AG, Berlin
We have reviewed the condensed consolidated interim financial statements – consisting of the statement of
comprehensive income, statement of financial position, statement of changes in equity, statement of cash flow
and selected explanatory notes – and the consolidated interim management report of TLG IMMOBILIEN AG,
Berlin, which are components of the half-year financial report in accordance with Sec. 37w of the German
Securities Trading Act (WpHG), for the period from 1 January 2017 to 30 June 2017. The legal representatives
of the company are responsible for preparing the condensed consolidated interim financial statements in
accordance with the IFRS for interim financial reporting as applicable in the EU, and the consolidated interim
management report in accordance with the provisions of the German Securities Trading Act (WpHG) which
apply to consolidated interim management reports. Our task is to issue a certificate for the condensed
consolidated interim financial statements and the consolidated interim management report on the basis of
our review.
We carried out our review of the condensed consolidated interim financial statements and the consolidated
interim management report with consideration for the generally accepted accounting principles in Germany
that were established by the German Institute of Auditors (IDW). These stipulate that the review must be
planned and conducted in such a way that following our critical appraisal we can, with a degree of certainty,
conclude that the condensed consolidated interim financial statements have essentially been prepared in
accordance with the IFRS for interim financial reporting as applicable in the EU, and that the consolidated
interim management report has essentially been prepared in accordance with the provisions of the German
Securities Trading Act (WpHG) that apply to consolidated interim management reports. A review is mainly
limited to interviews with employees of the company and analytical evaluations, and therefore does not
provide the certainty that can be achieved by an audit. As we have not been engaged to conduct an audit,
we cannot provide an audit certificate.
On the basis of our review we have not discovered any discrepancies that would give us cause to assume
that the condensed consolidated interim financial statements of TLG IMMOBILIEN AG, Berlin, have not
essentially been prepared in accordance with the IFRS for interim financial reporting as applicable in the EU,
and that the consolidated interim management report has not essentially been prepared in accordance with
the provisions of the German Securities Trading Act (WpHG) that apply to consolidated interim management
reports.
Berlin, 10 August 2017
Ernst & Young GmbH
Wirtschaftsprüfungsgesellschaft
Kreninger Pilawa
Auditor Auditor
HALF
-YEA
R FI
NAN
CIAL
REP
ORT
AS
AT 3
0 JU
NE
2017
OF
TLG
IMM
OBI
LIEN
AG
TABLE OF CONTENTS
FINANCIAL CALENDAR
9 NOVEMBER 2017
Publication of quarterly financial report Q3/2017
CONTACT
PUBLISHER:
TLG IMMOBILIEN AG
Hausvogteiplatz 12
10117 Berlin, Germany
Investor Relations
Sven Annutsch
Phone: + 49 30 2470-6089
Fax: + 49 30 2470-7446
E-mail: [email protected]
Internet: www.tlg.eu
PUBLISHING DETAILS
CONCEPT AND DESIGN:
GFD – Gesellschaft für Finanzkommunikation mbH
Frankfurt am Main, Germany
www.gfd-finanzkommunikation.de/en/
Ligaturas – Reportdesign, Berlin, Germany
www.ligaturas.de
32 FINANCIAL CALENDAR – CONTACT – PUBLISHING DETAILS

The greatest of care was taken during the preparation of this report. Nevertheless, rounding, transmission, typographical and
printing errors cannot be ruled out.
This is a translation of the original German text. In cases of doubt, the German version takes precedence.
This publication contains forward looking statements based on current opinions and assumptions of the management of
TLG IMMOBILIEN AG made to the best of their knowledge. Forward looking statements are subject to known and unknown risks,
uncertainties and other factors that can lead to the turnover, profitability, target achievement and results of TLG IMMOBILIEN
AG differing greatly from those named or described expressly or implicitly in this publication. Due to this, those who come into
possession of this publication should not trust in such forward looking statements. TLG IMMOBILIEN AG accepts no liability and gives
no guarantee for the correctness of such forward looking statements and will not adjust them to future results and developments.

TLG IMMOBILIEN AG
Hausvogteiplatz 12, 10117 Berlin, Germany
www.tlg.eu