half-year financial report - sampo · pdf filehalf-year financial report january – june...
TRANSCRIPT

HALF-YEAR FINANCIAL REPORT JANUARY – JUNE 2016
10 August 2016
HALF-YEAR FINANCIAL REPORT FOR JANUARY – JUNE 2016
2
CONTENTS Summary 3Second quarter 2016 in brief 5 Business areas 6P&C insurance 6Associated company Nordea Bank AB 9Life insurance 11Holding 13
Other developments 14Personnel 14Remuneration 14Shares and share capital 14Ratings 16Solvency 16Debt financing 17
Outlook 18Outlook for 2016 18The major risks and uncertainties to the Group in the near-term 18
Tables 20Group financial review 20Calculation of key figures 21 Group quarterly comprehensive income statement 23Statement of profit and other comprehensive income, IFRS 24Consolidated balance sheet, IFRS 25Statement of changes in equity, IFRS 26 Statement of cash flows, IFRS 27
Notes 28Accounting policies 28Comprehensive income statement by segment for six months ended 30 June 2016 29Comprehensive income statement by segment for six months ended 30 June 2015 30Consolidated balance sheet by segment at 30 June 2016 31Consolidated balance sheet by segment at 31 December 2015 32
Other notes 331 Insurance premiums 332 Net income from investments 343 Claims incurred 374 Staff costs 385 Intangible assets 396 Financial assets 407 Derivative financial instruments 418 Determination and hierarchy of fair values 429 Movements in level 3 financial instruments measured at fair value 4510 Sensitivity analysis of level 3 financial instruments measured at fair value 4711 Investments related to unit-linked insurance 4712 Liabilities for insurance and investment contracts 4813 Liabilities from unit-linked insurance and investment contracts 5014 Financial liabilities 5015 Contingent liabilities and commitments 5116 Result analysis of P&C insurance business 5317 Sampo plc’s income statement and balance sheet (FAS) 54

HALF-YEAR FINANCIAL REPORT FOR JANUARY – JUNE 2016
Summary
3
Sampo Group’s results for January – June 2016
Sampo Group’s profit before taxes for January – June 2016 amounted to EUR 893 million (1,015). The total comprehensive income for the period, taking changes in the market value of assets into account, decreased to EUR 607 million (1,147).
• Earnings per share were EUR 1.40 (1.60). Mark-to-market earnings per share were EUR 1.08 (2.05). The return on equity for the Group was 10.9 per cent (20.9) for January – June 2016. Net asset value per share on 30 June 2016 amounted to EUR 18.83 (23.79). A dividend of EUR 2.15 per share was paid in early May.
• Profit before taxes for the P&C insurance segment amounted to EUR 436 million (511). Combined ratio for January-June 2016 was 83.7 per cent (85.0). The record low combined ratio was impacted by a EUR 72 million release from the Swedish MTPL reserves in the first quarter of 2016. The comparison figure is also impacted by non-recurring items. Excluding these combined ratio for January-June 2016 was 87.1 per cent and 87.2 for the corresponding period a year earlier. Return on equity (RoE) was 16.2 per cent (31.2). The contribution of Topdanmark’s net profit for the first half of 2016 amounted to EUR 19 million (24).
• Sampo’s share of Nordea’s net profit for the first half of 2016 amounted to EUR 364 million (418). Nordea’s RoE amounted to 10.8 per cent (13.7). Core Tier 1 ratio (excluding transition rules) strengthened to 16.8 per cent (16.5). In segment reporting the share of Nordea’s profit is included in the segment ‘Holding’.
• Profit before taxes in life insurance operations rose to EUR 103 million (81). Return on equity (RoE) decreased to 6.5 per cent (21.8).
Key figures
EURm 1–6/2016 1–6/2015 Change,% 4–6/2016 4–6/2015 Change,%
Profit before taxes 893 1,015 -12 477 528 -10
P&C insurance 436 511 -15 220 310 -29
Associate (Nordea) 364 418 -13 205 195 5
Life insurance 103 81 28 51 42 21
Holding (excl. Nordea) -11 7 - 1 -19 -
Profit for the period 783 894 -12 421 459 -8
Change Change
Earnings per share, EUR 1.40 1.60 -0.20 0.75 0.82 -0.07
EPS (incl. change in FVR) EUR 1.08 2.05 -0.97 0.72 0.80 -0.08
NAV per share, EUR *) 18.83 23.79 -4.96 - - -
Average number of staff (FTE) 6,774 6,725 49 - - -
Group solvency ratio, % *) 145 145 0 - - -
RoE, % 10.9 20.9 -10.0 - - -
*) comparison figure from 31.12.2015The figures in this report are not audited. Income statement items are compared on a year-on-year basis and comparison figures for balance sheet items are from 31 December 2015 unless otherwise stated.
10 August 2016

HALF-YEAR FINANCIAL REPORT FOR JANUARY – JUNE 2016
4
Exchange rates used in reporting
1–6/2016 1–3/2016 1–12/2015 1–9/2015 1–6/2015
EUR 1 = SEK
Income statement (average) 9.3023 9.3241 9.3534 9.3709 9.3416
Balance sheet (at end of period) 9.4242 9.2253 9.1895 9.4083 9.2150
DKK 1 = SEK
Income statement (average) 1.2486 1.2501 1.2542 1.2567 1.2530
Balance sheet (at end of period) 1.2668 1.2381 1.2314 1.2612 1.2352
NOK 1 = SEK
Income statement (average) 0.9875 0.9790 1.0475 1.0646 1.0809
Balance sheet (at end of period) 1.0133 0.9799 0.9570 0.9878 1.0482

HALF-YEAR FINANCIAL REPORT FOR JANUARY – JUNE 2016
Second quarter 2016 in brief
5
Second quarter 2016 in brief
Sampo Group’s profit before taxes for the second quarter 2016 amounted to EUR 477 million (528). Earnings per share amounted to EUR 0.75 (0.82). Marked-to-market earnings per share were EUR 0.72 (0.80).
Net asset value per share decreased EUR 3.26 during the second quarter of 2016 and was EUR 18.83. A dividend of EUR 2.15 per share paid on 3 May 2016 and the change in the valuation difference of Nordea and Topdanmark holdings largely explain the decrease.
The second quarter combined ratio in P&C insurance amounted to 84.5 per cent (80.9). Profit before taxes decreased to EUR 220 million (310). Share of the profits of the associated company Topdanmark amounted to EUR 14 million (12).
Sampo’s share of Nordea’s second quarter 2016 net profit amounted to EUR 205 million (195).
Profit before taxes for the life insurance operations increased to EUR 51 million (42). Technical reserves were further supplemented by EUR 24 million due to low level of interest rates. Premiums written decreased 17 per cent to EUR 248 million from EUR 299 million at the corresponding period a year ago.

HALF-YEAR FINANCIAL REPORT FOR JANUARY – JUNE 2016
Business areas
6
Business areas P&C insurance
If P&C is the leading property and casualty insurance company in the Nordic region, with insurance operations that also encompass the Baltic countries. The P&C insurance group’s parent company, If P&C Insurance Holding Ltd, is located in Sweden, and the If subsidiaries and branches provide insurance solutions and services in Finland, Sweden, Norway, Denmark and the Baltic countries. If’s operations are divided into four business areas: Private, Commercial, Industrial and Baltic. The Danish insurance company Topdanmark is If P&C's associated company.
P&C insurance had an exceptionally strong first half year in terms of technical result. The decrease in profits is entirely attributable to lower investment income. Low interest rate environment is not only reflected in investment results but also burdens the profits by change in discount rates used for annuities. Solvency position continues to be strong.
Profit before taxes for January-June 2016 for the P&C insurance segment amounted to EUR 436 million (511). Combined ratio improved to 83.7 per cent (85.0) and risk ratio to 61.6 per cent (69.7). In the first quarter of 2016 EUR 72 million was released from the Swedish
Results
EURm 1-6/2016 1-6/2015 Change, % 4-6/2016 4-6/2015 Change, %
Premiums, net 2,558 2,628 -3 1,040 1,065 -2
Net income from investments 80 173 -54 44 94 -53
Other operating income 14 15 -7 7 8 -16
Claims incurred -1,312 -1,519 -14 -669 -802 -17
Change in insurance liabilities -426 -448 -5 33 39 -15
Staff costs -250 -106 136 -123 27 -552
Other operating expenses -240 -247 -3 -123 -128 -4
Finance costs -7 -9 -30 -3 -5 -36
Share of associates’ profit/loss 19 24 -20 15 12 20
Profit before taxes 436 511 -15 220 310 -29
Key figures Change Change
Combined ratio, % *) 83.7 85.0 -1.3 84.5 80.9 3.6
Risk ratio, % 61.6 69.7 -8.1 62.4 72.7 -10.3
Cost ratio, % 22.2 15.4 6.8 22.1 8.3 13.8
Expense ratio, % 16.8 9.6 7.2 16.7 2.6 14.1
Return on equity, % 16.2 31.2 -15.0 - - -
Average number of staff (FTE) 6,177 6,148 29 - - -
*) Excluding the non-recurring items combined ratio for the first half of 2016 would have been 87.1 per cent and 87.2 per cent for the first half of 2015.

HALF-YEAR FINANCIAL REPORT FOR JANUARY – JUNE 2016
Business areas
7
Combined ratio, % Risk ratio, %
1–6/2016 1–6/2015 Change 1–6/2016 1–6/2015 Change
Private 81.2 90.0 -8.7 59.1 67.2 -8.2
Commercial 87.8 94.3 -6.5 65.2 71.4 -6.2
Industrial 89.5 105.7 -16.2 67.2 84.1 -16.9
Baltic 90.5 84.6 5.9 61.9 54.3 7.6
Sweden 76.4 87.1 -10.7 55.9 65.1 -9.2
Norway 88.3 90.2 -1.9 65.3 67.2 -1.9
Finland 85.0 104.6 -19.6 62.5 83.1 -20.5
Denmark 94.7 92.6 2.1 67.6 65.6 2.0
Combined ratio, % Risk ratio, %
4–6/2016 4–6/2015 Change 4–6/2016 4–6/2015 Change
Private 83.7 90.4 -6.7 61.6 67.7 -6.1
Commercial 87.9 98.0 -10.1 65.6 75.1 -9.5
Industrial 81.3 122.2 -40.9 58.7 100.9 -42.2
Baltic 90.2 86.2 4.0 60.6 55.9 4.7
Sweden 89.6 84.6 5.0 69.4 62.8 6.6
Norway 77.6 87.0 -9.4 55.3 64.3 -9.0
Finland 83.1 129.0 -45.9 60.0 106.8 -46.8
Denmark 93.9 82.5 11.4 65.9 55.8 10.1
MTPL reserves, following a review of mortality tables by the Swedish insurance federation. This improved the combined ratio for the first half of 2016 by 3.4 percentage points. The comparison figure contains two non-recurring items – the reform of the pension system in If Norway and the lowering of the interest rate used in discounting annuities in Finland from 2.0 per cent to 1.5 per cent. Their combined effect on combined ratio was 2.2 percentage points positive.
EUR 95 million was released from technical reserves relating to prior year claims in January – June 2016. In the same period in 2015 the interest rate used in discounting annuities in Finland was lowered resulting in a reserve strengthening of EUR 110 million. Return on equity (RoE) decreased to 16.2 per cent (31.2) and the fair value reserve at the end of June 2016 was EUR 355 million (391). The contribution of Topdanmark’s net profit in the first half of 2016 amounted to EUR 19 million (24).
Technical result rose to EUR 352 million (342). Insurance margin (technical result in relation to net premiums earned) continued to improve and amounted to 16.6 per cent (15.7).

HALF-YEAR FINANCIAL REPORT FOR JANUARY – JUNE 2016
Business areas
8
The release from the Swedish MTPL reserves in the first quarter of 2016 improved both the Swedish country specific result and the Private and Commercial business area results positively by 10.0, 4.7 and 1.6 percentage points, respectively. BA Industrial’s second quarter 2016 was strong and combined ratio for the first six months of 2016 improved to 89.5 per cent (105.7). Large claims in BA Industrial were EUR 21 million better than expected in April-June 2016. Total large claims for If P&C were EUR 7 million better than expected in the first half of 2016.
Swedish discount rate used to discount the annuity reserves decreased to -0.16 per cent by the end of June 2016 and had a negative effect of EUR 38 million in the first half results. The discount rate was 0.41 per cent at the end of 2015. In Finland the discount rate for annuities was unchanged at 1.5 per cent. The comparison figures for the Finnish business are burdened by the change in the Finnish discount rate in the second quarter of 2015. Combined ratio for the Norwegian business developed well in the second quarter, largely due to improved large claims development.
Gross written premiums amounted to EUR 2,683 million (2,760) in January-June 2016. Adjusted for currency, premium growth was -0.3 per cent. Growth was positive in business areas Private and Baltic, and negative in business areas Commercial and Industrial. Operations in Sweden and Denmark showed healthy growth but in Finland and Norway premiums decreased.
Cost ratio amounted to 22.2 per cent (15.4) while expense ratio was 16.8 per cent (9.6). The comparison figures are positively impacted, 7.2 percentage points, by the non-recurring reform of the pension system in If Norway.
At the end of June 2016, the total investment assets of If P&C amounted to EUR 11.5 billion (11.4), of which fixed income investments constituted 81 per cent (74), money market 7 per cent (12) and equity 12 per cent (13). Net income from investments decreased to EUR 80 million (173). Investment return marked-to-market for January-June 2016 amounted to 0.5 per cent (2.1). Duration for interest bearing assets was 1.5 years (1.2) and average maturity 3.0 years (2.6). Fixed income running yield as at 30 June 2016 was 1.7 per cent (2.0).

HALF-YEAR FINANCIAL REPORT FOR JANUARY – JUNE 2016
Business areas
9
Nordea is among the ten largest universal banks in Europe in terms of total market capitalisation and has around 11 million customers, 30,000 employees and approximately 600 branch office locations. The Nordea share is listed on the Nasdaq exchanges in Stockholm, Helsinki and Copenhagen. In Sampo Group’s reporting Nordea is treated as an associated company and is included in the segment Holding.
On 30 June 2016 Sampo plc held 860,440,497 Nordea shares corresponding to a holding of 21.2 per cent. The average price paid per share amounted to EUR 6.46 and the book value in the Group accounts was EUR 8.24 per share. The closing price as at end of June 2016 was EUR 7.52.
Despite low growth and turbulent financial markets Nordea’s revenues held up well. Margin pressure in net interest income is levelling off and the trend is expected to improve from the second half of 2016. Costs are in line with the plans and credit quality remains solid.
The following text is based on Nordea’s January–June 2016 interim report published on 20 July 2016.
Total income was down 9 per cent in local currencies (-10 per cent in euros) in January–June 2016 compared to last year and operating profit was down 20 per cent in local currencies (-21 per cent in euros) from last year excluding non-recurring items.
Net interest income was down 4 per cent in local currencies (-7 per cent in euros) from last year. Average lending volumes in local currencies in business areas were up 2 per cent from the first half year 2015. Average deposit volumes in local currencies in business areas were up 5 per cent from the first half year 2015. Both lending margins and deposit margins are down (EUR -5 million and -89 million respectively) compared to one year ago.
Net fee and commission income decreased 3 per cent in local currencies (-4 per cent in euros) and the net result from items at fair value decreased by 28 per cent in local currencies (-27 per cent in euros) from last year.
Results
EURm 1–6/2016 1–6/2015 Change, % 4–6/2016 4–6/2015 Change, %
Net interest income 2,340 2,527 -7 1,172 1,274 -8
Total operating income* 4,700 5,242 -10 2,405 2,523 -5
Profit before loan losses 2,467 2,869 -14 1,350 1,338 1
Net loan losses -238 -225 6 -127 -103 23
Operating profit* 2,078 2,644 -21 1,072 1,235 -13
Diluted EPS, EUR 0.44 0.51 0.25 0.24
Return on equity*, % 10.8 13.7 11.4 13.1
Liiketoiminta-alueet Associated company Nordea Bank AB
*) Excluding non-recurring items (Q2/2016: gain related to Visa Inc.’s acquisition of Visa Europe amounting to EUR 151 million net of tax).

HALF-YEAR FINANCIAL REPORT FOR JANUARY – JUNE 2016
Business areas
10
Total expenses were up 2 per cent in local currencies (unchanged in euros) from the previous year excluding non-recurring items and amounted to EUR 2,384 million, in line with the cost target communicated in connection with the 2016 plan. Staff costs were down 2 per cent in local currencies.
Net loan loss provisions increased to EUR 238 million, corresponding to a loan loss ratio of 14 basis points (13bps for the first half year 2015).
Currency fluctuations had a reducing effect of 2 percentage points on income and 1 percentage point on expenses and -2 percentage point effect on loan and deposit volumes compared to a year ago.
Net profit decreased 11 per cent in local currencies (-13 per cent in euros) to EUR 1,778 million. Cost/income ratio was up at 51 per cent from 45 per cent a year earlier.
Nordea Group’s Basel III Common equity tier 1 (CET1) capital ratio increased 10 bps in the quarter to 16.8 per cent at the end of the second quarter 2016. The increase to the CET1 capital ratio was due to an increase in common equity tier 1 capital due to FX movements as well as a decrease in REA of EUR 0.1 billion.
At May 17, the Swedish Financial Authority approved the plans for the mergers of the Norwegian, Danish and Finnish banking subsidiaries with Nordea Bank AB. Nordea’s intention is to execute on the merger plan in early January 2017.
Further information on Nordea Bank AB and its January–June 2016 result is available at www.nordea.com.

HALF-YEAR FINANCIAL REPORT FOR JANUARY – JUNE 2016
Business areas
11
Life insurance profits increased despite the challenges in capital markets. In addition the technical reserves were further supplemented in preparation for continuing low interest rate level. Mandatum Life’s solvency continues to be strong after the transitional measures.
Profit before taxes for life insurance operations increased to EUR 103 million (81) in the first half of 2016. The total comprehensive income for the period after tax reflecting the changes in market values of assets decreased to EUR 44 million (144). Return on equity (RoE) amounted to 6.5 per cent (21.8). In the first half of 2016 fair value reserve decreased to EUR 492 million (532).
At the end of June 2016 Mandatum Life Group’s total technical reserves amounted to EUR 10.7 billion (10.9). In the first half of 2016 with profit reserves decreased to EUR 4.9 billion (5.0). Reserves related to the higher guarantees of 4.5 and 3.5 per cent decreased by EUR 108 million to EUR 3 billion during January – June 2016. The unit-linked reserves were almost flat at EUR 5.9 billion, which corresponds to 55 per cent (54) of total technical reserves.
Mandatum Life Group comprises Mandatum Life Insurance Co. Ltd., a wholly-owned subsidiary of Sampo plc, operating in Finland, and its five subsidiaries. Parent company, Mandatum Life, is responsible for sales functions and all the functions required by the Insurance Companies Act. The subsidiaries are Mandatum Life Services Ltd, Mandatum Life Investment Services Ltd., Mandatum Life Fund Management S.A., Innova Services Ltd. and Mandatum Life Insurance Baltic SE.
Results
EURm 1–6/2016 1–6/2015 Change, % 4–6/2016 4–6/2015 Change, %
Premiums written 492 676 -27 248 299 -17
Net income from investments 82 599 -86 147 65 126
Other operating income 6 8 -24 4 6 -41
Claims incurred -562 -588 -5 -270 -288 -6
Change in liabilities for inv. and ins. contracts 146 -548 - -49 -7 591
Staff costs -22 -24 -7 -11 -12 -7
Other operating expenses -35 -40 -11 -15 -20 -23
Finance costs -3 -4 -3 -2 -2 28
Profit before taxes 103 81 28 51 42 21
Key figures Change
Expense ratio, % 105.2 99.8 5.4 - - -
Return on equity, % 6.5 21.8 -15.3 - - -
Average number of staff (FTE) 541 520 21 - - -
Liiketoiminta-alueet Life insurance

HALF-YEAR FINANCIAL REPORT FOR JANUARY – JUNE 2016
Business areas
12
Mandatum Life has supplemented its technical reserves with a total of EUR 232 million (244) due to low level of interest rates. The figure does not take into account the reserves relating to the segregated fund. The discount rates used for 2016, 2017 and 2018 are 0.5 per cent, 1.0 per cent, and 1.75 per cent, respectively. Discount rate applied for the segregated fund is 0.75 per cent.
Mandatum Life Group’s investment assets, excluding the assets of EUR 5.8 billion (5.9) covering unit-linked liabilities, amounted to EUR 6.5 billion (6.7) at market values at the end of June 2016.
The assets covering Mandatum Life’s original with profit liabilities on 30 June 2016 amounted to EUR 5.3 billion (5.5) at market values. 45 per cent (47) of the assets are in fixed income instruments, 10 per cent (7) in money market, 29 per cent (29) in equities and 16 per cent (16) in alternative investments. The investment return marked-to-market for January - June 2016 was 1.5 per cent (5.9). The duration of fixed income assets at the end of June 2016 was 2.2 years (2.1) and average maturity 2.7 years (2.8). Fixed income (incl. money market) running yield was 3.1 per cent (2.9).
The assets covering the segregated fund amounted to EUR 1.2 billion (1.2), of which 75 per cent (71) was in fixed income, 6 per cent (9) in money market, 12 per cent (12) in equities and 7 per cent (8) in alternative investments. Segregated fund’s investment return marked-to-market for January – June 2016 was 1.7 per cent (3.0). At the end of June 2016 the duration of fixed income assets was 2.7 years (2.3) and average maturity 4.0 years (3.8). Fixed income (incl. money market) running yield was 1.9 per cent (0.8).
Mandatum Life’s solvency position is described in the section Solvency.
The expense result for life insurance segment amounted to EUR 9 million (13) and the risk result to EUR 10 million (11).
Mandatum Life Group’s premium income on own account decreased to EUR 492 million (676) in the first half of 2016. Mandatum Life’s market share in Finland amounted to 21.2 per cent (18.0).

HALF-YEAR FINANCIAL REPORT FOR JANUARY – JUNE 2016
Business areas
13
Sampo plc owns and controls its subsidiaries engaged in P&C and life insurance. In addition Sampo plc held on 30 June 2016 approximately 21.2 per cent of the share capital of Nordea, the largest bank in the Nordic countries. Nordea is an associated company to Sampo plc.
Holding segment’s profit before taxes for January – June 2016 amounted to EUR 353 million (425), of which EUR 364 million (418) relates to Sampo’s share of Nordea’s first half 2016 profit. Segment’s profit before taxes excluding Nordea was EUR -11 million (7). The depreciation of Swedish krone against EUR increased Holding segment’s profit by EUR 12 million in April-June 2016 which explains the EUR 1 million positive finance costs for the quarter.
Sampo plc’s holding in Nordea Bank was booked in the consolidated balance sheet at EUR 7.1 billion. The market value of the holding was EUR 6.5 billion, i.e. EUR 7.52 per share, at 30 June 2016. In addition the assets on Sampo plc’s balance sheet included holdings in subsidiaries for EUR 2.4 billion (2.4).
Results
EURm 1–6/2016 1–6/2015 Change, % 4–6/2016 4–6/2015 Change, %
Net investment income 3 52 -95 1 4 -60
Other operating income 8 8 -4 4 4 4
Staff costs -6 -10 -42 -2 -4 -62
Other operating expenses -7 -7 3 -4 -4 -11
Finance costs -9 -37 -77 1 -18 -
Share of associates’ profit 364 418 -13 205 195 5
Profit before taxes 353 425 -17 206 177 16
Key figures Change
Average number of staff (FTE) 56 56 0 - - -
Liiketoiminta-alueet Holding

HALF-YEAR FINANCIAL REPORT FOR JANUARY – JUNE 2016
Other developments
14
Other developments
Personnel The number of full-time equivalent staff in Sampo Group on 30 June 2016 was 6,776 employees compared to 6,782 employees at the end of 2015. The number of staff decreased slightly in P&C insurance and increased in life insurance.
During the first half of 2016, approximately 91 per cent of the staff worked in P&C insurance, 8 per cent in life insurance and 1 per cent in the Group’s parent company Sampo plc. Geographically, 32 per cent worked in Finland, 28 per cent in Sweden, 20 per cent in Norway and 20 per cent in the Baltic and other countries.
The average number of employees during January-June 2016 was 6,774. A year earlier the corresponding figure was 6,725.
Remuneration In the first half of 2016 no long-term incentive payments were made. At the end of June 2016 Sampo Group had provisioned EUR 41 million (44) for future payments of long-term incentive schemes. The release of provisions for the long-term incentive schemes in force had a positive profit impact of EUR 3 million. EUR 37 million (31), including social costs, was paid as short-term incentives during January–June 2016.
The terms of the long-term incentive schemes are available at www.sampo.com/incentiveterms.
Sampo Group published a Remuneration Report in March 2016. The report has been prepared in accordance with section 7 of the Corporate Governance Code published by the Securities Market Association in October 2010 as permitted by the new Finnish Corporate Governance Code 2015. The report is available at www.sampo.com/remuneration.
Shares and share capitalAs at 30 June 2016, Sampo plc had 560,000,000 shares, which were divided into 558,800,000 A shares and 1,200,000 B shares. Total number of votes attached to the shares is 564,800,000. Each A share entitles the holder to one vote and each B share entitles the holder to five votes at the General Meeting of Shareholders. A shares have been listed on Nasdaq Helsinki since 1988.
The Annual General Meeting held on 21 April 2016 authorized the Board to repurchase a maximum of 50,000,000 Sampo A shares. The authorization will be valid until the close of the next Annual General Meeting, nevertheless not more than 18 months after AGM's decision. Sampo plc did not repurchase its own shares during the first half of 2016 and at the end of June 2016, neither Sampo plc nor its Group companies held any Sampo A shares.
During the first half of 2016 Sampo plc received altogether 14 notifications of change in holding pursuant to Chapter 9, Section 5 of the Securities Markets Act, of which 12 related to the total number of Sampo A shares or related voting rights owned by BlackRock, Inc. (tax ID 32-0174421) and its funds directly or through financial instruments. After the end of the reporting period Sampo has received 7 further notifications from BlackRock, Inc. and its funds.

HALF-YEAR FINANCIAL REPORT FOR JANUARY – JUNE 2016
Other developments
15
The notified changes are illustrated in the table below.
In addition Sampo plc received two notifications regarding the total number of Sampo A shares and related voting rights owned by Capital Income Builder (CIB), a 100 per cent owned subsidiary of the Capital Group Companies, Inc., directly or through financial instruments. On 24 February 2016 the number of Sampo shares owned by CIB increased to over five (5) per cent of Sampo plc's entire stock (5.2). The voting rights attached to the shares remained below five (5) per cent of total number of voting rights. On 23 May 2016 the number of shares had increased to 5.10 per cent and the attached voting rights amounted to 5.06 per cent.
The details of the notifications are available at www.sampo.com/share/flagging-notifications.
Notifications by BlackRock, Inc. in 2016
% of shares and voting rights
% of shares and voting rights through financial instruments Total
Date of the change Shares Voting rights Shares Voting rights Shares Voting rights
25 Jan 2016 5.02% <5% 0.03% <5% 5.04% <5%
26 Jan 2016 - - - - <5% <5%
29 Jan 2016 5.00% <5% 0.02% <5% 5.02% <5%
1 Feb 2016 - - - - <5% <5%
3 Feb 2016 5.01% <5% 0.02% <5% 5.03% <5%
4 Feb 2016 - - - - <5% <5%
4 Apr 2016 4.96% <5% 0.05% <5% 5.01% <5%
5 Apr 2016 5.01% 4.97% 0.03% 0.03% 5.05% 5.00%
6 Apr 2016 5.08% 5.04% 0.01% 0.01% 5.09% 5.05%
22 Apr 2016 4.94% 4.90% 0.24% 0.24% 5.19% 5.14%
25 Apr 2016 5.01% 4.97% 0.17% 0.16% 5.18% 5.14%
26 Apr 2016 5.24% 5.19% 0.14% 0.14% 5.38% 5.33%
After the end of the reporting period
8 Jul 2016 5.04% 4.995% 0.06% 0.06% 5.10% 5.05%
12 Jul 2016 4.98% 4.94% 0.11% 0.11% 5.09% 5.05%
22 Jul 2016 5.02% 4.98% 0.04% 0.04% 5.06% 5.02%
25 Jul 2016 4.96% 4.92% 0.04% 0.04% 5.00% 4.96%
26 Jul 2016 5.05% 5.00% 0.04% 0.04% 5.09% 5.04%
28 Jul 2016 5.01% 4.97% 0.04% 0.04% 5.05% 5.01%
8 August 2016 5.07% 5.03% 0.04% 0.04% 5.11% 5.06%

HALF-YEAR FINANCIAL REPORT FOR JANUARY – JUNE 2016
Other developments
16
Ratings On 20 April 2016 S&P strengthened If P&C’s ratings to A+ with a stable outlook. At the same time S&P initiated Sampo plc’s rating with A- and a stable outlook. The table below illustrates all the ratings of Sampo Group companies at the end of June 2016.
Rated company Moody’s Standard & Poor’s
Rating Outlook Rating Outlook
Sampo plc Baa2 Positive A- Stable
If P&C Insurance Ltd (Sweden) A2 Positive A+ Stable
If P&C Insurance Company Ltd (Finland) A2 Positive A+ Stable
Solvency As of 1 January 2016 insurance subgroups If P&C and Mandatum Life apply Solvency II rules in their regulatory solvency calculations. Both subgroups use a standard model in calculating their solvency requirements and eligible own funds.
On 30 June 2016 If P&C Group’s Solvency II capital requirement under standard model amounted to EUR 2,099 million (2,073) and own funds to EUR 3,293 million (3,202). Solvency ratio was stable at 157 per cent (158). S&P rating total capital charge for If P&C Group amounted to EUR 2,950 million (3,058) at the end of June 2016 while the capital base stood at EUR 3,457 (3,455) million.
Mandatum Life’s solvency ratio after transitional measures remained strong at 154 per cent (158). Own funds of EUR 1,704 million (1,913) exceed Solvency Capital Requirement (SCR) of EUR 1,110 million (1,212) by EUR 594 million. Without transitional measures, own funds would have amounted to EUR 1,237 and the solvency capital requirement EUR 1,268 million leading to a solvency ratio of 98 per cent.
Sampo Group is regarded as a financial and insurance conglomerate according to the Act on the Supervision of Financial and Insurance Conglomerates (2004/699). The Act is based on Directive 2002/87/EC of the European Parliament and of the Council on the supplementary supervision of credit institutions, insurance undertakings and investment. The Act was amended as of 1 January 2016 to correspond to Solvency II and Basel III rules. Sampo Group is also treated as a Solvency II Group by the supervisor and therefore has to calculate its solvency requirement and own funds on the Group level based on Solvency II rules. The results of these Group Solvency calculations are submitted to the Finnish FSA on a quarterly basis and published once a year in the Annual Report. Currently the Solvency II Group calculations don’t differ materially from the Conglomerate Solvency results.
The starting point for the Group’s solvency capital is the consolidated Group equity. The sectoral items are added to it and the intangibles and other deductibles are subtracted from it.

HALF-YEAR FINANCIAL REPORT FOR JANUARY – JUNE 2016
Other developments
17
Sampo Group solvency
EURm 30 Jun 2016 31 Dec 2015
Group capital 10,830 11,411
Goodwill, other intangibles and deductibles -2,470 -3,371
Sectoral items 1,765 2,254
Group's own funds, total 10,125 10.294
Minimum requirements for own funds, total 6,995 7,114
Group solvency 3,130 3,179
Group solvency ratio (Own funds % of minimum requirements) 145 145
Group’s conglomerate solvency ratio (own funds in relation to minimum requirements for own funds) using Solvency II rules for the insurance subsidiaries was 145 per cent (145) as at 30 June 2016.
More information on Sampo Group’s capital policy is available at the Risk Management section of the Annual Report 2015.
Debt financing Sampo plc’s debt financing on 30 June 2016 amounted to EUR 2,462 million (2,302) and interest bearing assets to EUR 1,058 million (1,343). Interest bearing assets include bank accounts, fixed income instruments and EUR 614 million (579) of hybrid capital and subordinated debt instruments issued by the subsidiaries. At the end of the first half of 2016 the net debt amounted to EUR 1,403 million (959). The net debt calculation only takes into account interest bearing assets and liabilities. Gross debt to Sampo plc’s equity was 37 per cent (32) and financial leverage 27 per cent (24).
At the end of June 2016 financial liabilities in Sampo plc’s balance sheet consisted of issued senior bonds and notes of EUR 2,157 million (1,997) and EUR 305 million (305) of CPs issued. The average interest, net of interest rate swaps, on Sampo plc’s debt as of 30 June 2016 was 1.35 per cent (1.45).
More information on Sampo Group’s outstanding debt issues is available at www.sampo.com/debtfinancing.

HALF-YEAR FINANCIAL REPORT FOR JANUARY – JUNE 2016
Outlook
18
Outlook
Outlook for 2016 Sampo Group’s business areas are expected to report good operating results for 2016.
However, the mark-to-market results are, particularly in life insurance, highly dependent on capital market developments. The continuing low interest rate level also creates a challenging environment for reinvestment in fixed income instruments.
The P&C insurance operations are expected to reach a combined ratio of 87 – 90 per cent excluding the release from the Swedish MTPL reserves.
Nordea’s contribution to the Group’s profit is expected to be significant.
The major risks and uncertainties to the Group in the near-term
In its current day-to-day business activities Sampo Group is exposed to various risks and uncertainties mainly through its separately managed major business units. Parent company Sampo's contribution to risks is a minor one.
Major risks affecting the Group companies’ profitability and its variation are market, credit, insurance and operational risks that are quantified independently by the major business units. At the Group level sources of risks are same, but they are not directly additive because of diversification effects.
Uncertainties in the form of major unforeseen events may have an immediate impact on the Group’s profitability. Identification of unforeseen events is easier than estimation of their probabilities, timing and potential outcomes. Currently there are a number of widely identified macro-economic, political and other sources of uncertainty which can in various ways affect financial services industry negatively.
Other sources of uncertainty are unforeseen structural changes in the business environment and already identified trends and potential wide-impact events. These external drivers may have also long-term impact on how business shall be conducted.
SAMPO PLC Board of Directors

HALF-YEAR FINANCIAL REPORT FOR JANUARY – JUNE 2016
Information
19
Distribution: Nasdaq Helsinki London Stock Exchange The principal media Financial Supervisory Authority www.sampo.com
For more information, please contact:Peter Johansson, Group CFO, tel. +358 10 516 0010
Jarmo Salonen, Head of Investor Relations and Group Communications, tel. +358 10 516 0030
Essi Nikitin, IR Manager, tel. +358 10 516 0066
Maria Silander, Communications Manager, tel. +358 10 516 0031
Press conference & analyst conference callSampo will arrange a press conference at Hotel Kämp (Conference room Paavo Nurmi, Pohjoisesplanadi 29, Helsinki) today at 12:30 pm Finnish time. The press conference will be held in Finnish.
An English-language conference call for investors and analysts will be arranged at 4:00 pm Finnish time (2:00 pm UK time). Please call tel. +44 (0)203 194 0552, +46 (0)8 5664 2702, +1 855 7161 597, or +358 (0)9 8171 0465.
The conference call can also be followed live at www.sampo.com/result. A recorded version will later be available at the same address.
In addition the Supplementary Financial Information Package is available at www.sampo.com/result.
Sampo will publish the Interim Statement for January–September 2016 on 3 November 2016.
HALF-YEAR FINANCIAL REPORT FOR JANUARY – JUNE 2016
20
Group financial review
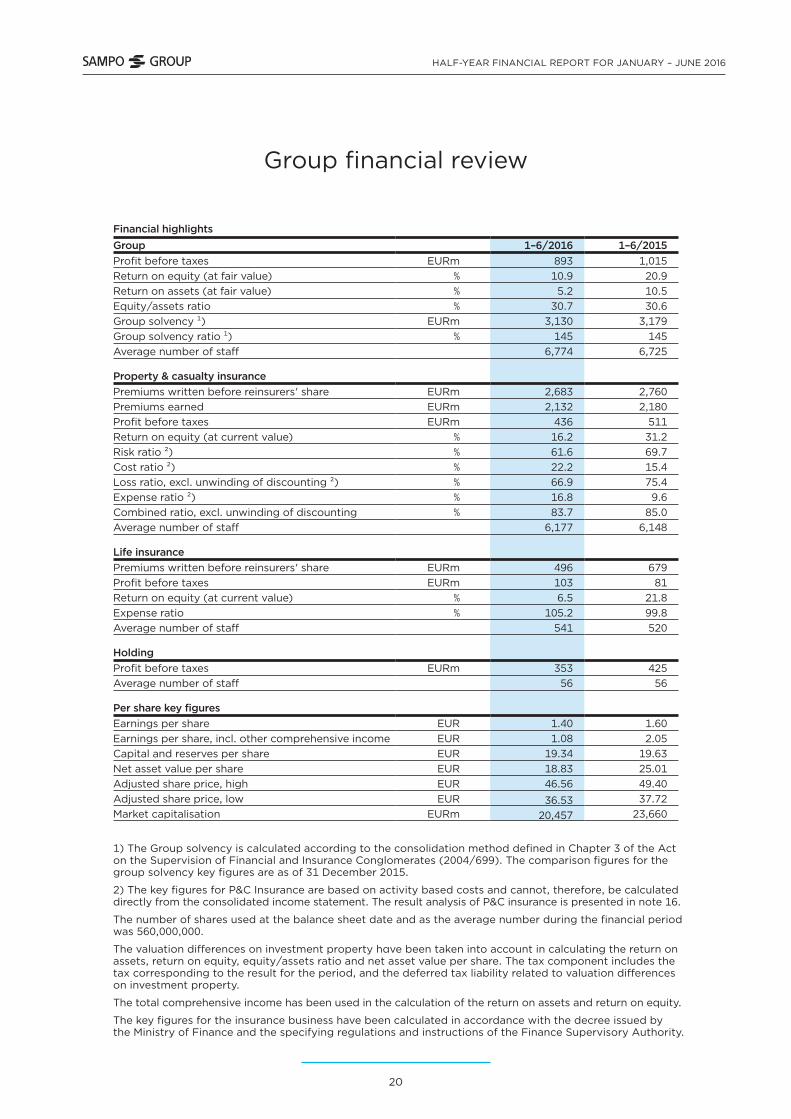
Financial highlightsGroup 1–6/2016 1–6/2015Profit before taxes EURm 893 1,015Return on equity (at fair value) % 10.9 20.9Return on assets (at fair value) % 5.2 10.5Equity/assets ratio % 30.7 30.6Group solvency ¹) EURm 3,130 3,179Group solvency ratio ¹) % 145 145Average number of staff 6,774 6,725
Property & casualty insurancePremiums written before reinsurers' share EURm 2,683 2,760Premiums earned EURm 2,132 2,180Profit before taxes EURm 436 511Return on equity (at current value) % 16.2 31.2Risk ratio ²) % 61.6 69.7Cost ratio ²) % 22.2 15.4Loss ratio, excl. unwinding of discounting ²) % 66.9 75.4Expense ratio ²) % 16.8 9.6Combined ratio, excl. unwinding of discounting % 83.7 85.0Average number of staff 6,177 6,148
Life insurancePremiums written before reinsurers' share EURm 496 679Profit before taxes EURm 103 81Return on equity (at current value) % 6.5 21.8Expense ratio % 105.2 99.8Average number of staff 541 520
HoldingProfit before taxes EURm 353 425Average number of staff 56 56
Per share key figuresEarnings per share EUR 1.40 1.60Earnings per share, incl. other comprehensive income EUR 1.08 2.05Capital and reserves per share EUR 19.34 19.63Net asset value per share EUR 18.83 25.01Adjusted share price, high EUR 46.56 49.40Adjusted share price, low EUR 36.53 37.72Market capitalisation EURm 20,457 23,660
1) The Group solvency is calculated according to the consolidation method defined in Chapter 3 of the Act on the Supervision of Financial and Insurance Conglomerates (2004/699). The comparison figures for the group solvency key figures are as of 31 December 2015.
2) The key figures for P&C Insurance are based on activity based costs and cannot, therefore, be calculated directly from the consolidated income statement. The result analysis of P&C insurance is presented in note 16.
The number of shares used at the balance sheet date and as the average number during the financial period was 560,000,000.
The valuation differences on investment property have been taken into account in calculating the return on assets, return on equity, equity/assets ratio and net asset value per share. The tax component includes the tax corresponding to the result for the period, and the deferred tax liability related to valuation differences on investment property.
The total comprehensive income has been used in the calculation of the return on assets and return on equity.
The key figures for the insurance business have been calculated in accordance with the decree issued by the Ministry of Finance and the specifying regulations and instructions of the Finance Supervisory Authority.
Tables

HALF-YEAR FINANCIAL REPORT FOR JANUARY – JUNE 2016
21
Calculation of key figures
Return on equity (fair values), % + total comprehensive income
valuation differences on investments less deferred tax x 100 %
+ total equity valuation differences on investments less deferred tax
(average of values 1 Jan. and the end of reporting period)
Return on assets (at fair values), % + operating profit
other comprehensive income before taxes+ interest and other financial expense + calculated interest on technical provisions
change in valuation differences on investments x 100 %
+ balance sheet, total – technical provisions relating to unit-linked insurance
valuation differences on investments (average of values on 1 Jan. and the end of the reporting period)
Equity/assets ratio (at fair values), % + total equity
valuation differences on investments after deduction of deferred tax x 100 %+ balance sheet total
valuation differences on investments
Risk ratio for P&C insurance, % + claims incurred – claims settlement expenses
x 100 %
insurance premiums earned
Cost ratio for P&C insurance, % + operating expenses + claims settlement expenses
x 100 % insurance premiums earned
Loss ratio for P&C insurance, % claims incurred
x 100 % insurance premiums earned
Expense ratio for P&C insurance, % operating expenses
x 100 % insurance premiums earned
Combined ratio for P&C insurance, % Loss ratio + expense ratio
Expense ratio for life insurance, % + operating expenses before change in deferred acquisition costs + claims settlement expenses x 100 % expense charges

HALF-YEAR FINANCIAL REPORT FOR JANUARY – JUNE 2016
22
Per share key figures
Earnings per share profit for the financial period attributable to the parent company’s equity holders adjusted average number of shares
Equity per share equity attributable to the parent company’s equity holders adjusted number of shares at the balance sheet date
Net asset value per share+ equity attributable to the parent company’s equity holders valuation differences on listed associates in the Group valuation differences after the deduction of deferred taxes
adjusted number of shares at balance sheet date
Market capitalisation number of shares at the balance sheet date x closing share price at the balance sheet date

HALF-YEAR FINANCIAL REPORT FOR JANUARY – JUNE 2016
23
Group quarterly comprehensive income statement
EURm 4–6/2016 1–3/2016 10–12/2015 7–9/2015 4–6/2015
Insurance premiums written 1,289 1,734 1,191 1,027 1,364Net income from investments 189 -30 374 -194 158Other operating income 10 9 15 9 13
Claims incurred -939 -934 -949 -861 -1,090Change in liabilities for insurance and investment contracts -17 -238 -84 584 30
Staff costs -135 -142 -146 -153 11Other operating expenses -138 -136 -139 -121 -147
Finance costs -1 -10 -27 -2 -19Share of associates' profit/loss 219 164 179 171 208
Profit for the period before taxes 477 416 413 460 528
Taxes -55 -55 -49 -62 -69
Profit for the period 421 362 364 398 459
Other comprehensive income for the period
Items reclassifiable to profit or lossExchange differences on translating foreign operations -42 -6 39 -85 -8
Available-for-sale financial assets 51 -151 129 -409 -170Share of other comprehensive income of associates -2 -30 45 -109 73
Taxes -11 31 -27 87 33Total items reclassifiable to profit or loss, net of tax -5 -155 185 -517 -71
Items not reclassifiable to profit or lossActuarial gains and losses from defined pension plans -18 -2 -21 3 78
Taxes 4 0 5 -1 -19Total items not reclassifiable to profit or loss, net of tax -14 -2 -16 2 59
TOTAL COMPREHENSIVE INCOME FOR THE PERIOD 402 204 533 -116 447

HALF-YEAR FINANCIAL REPORT FOR JANUARY – JUNE 2016
24
Statement of profit and other comprehensive income, IFRS
EURm Note 1–6/2016 1–6/2015
Insurance premiums written 1 3,022 3,304
Net income from investments 2 159 818
Other operating income 19 22
Claims incurred 3 -1,873 -2,107
Change in liabilities for insurance and investment contracts -255 -1,002
Staff costs 4 -278 -140
Other operating expenses -274 -285
Finance costs -11 -39
Share of associates' profit/loss 383 443
Profit before taxes 893 1,015
Taxes -110 -121
Profit for the period 783 894
Other comprehensive income for the period
Items reclassifiable to profit or lossExchange differences -49 12
Available-for-sale financial assets -100 174
Share of other comprehensive income of associates -32 81
Taxes 20 -38
Total items reclassifiable to profit or loss, net of tax -161 229
Items not reclassifiable to profit or loss
Actuarial gains and losses from defined pension plans -20 32
Taxes 5 -8
Total items not reclassifiable to profit or loss, net of tax -16 24
TOTAL COMPREHENSIVE INCOME FOR THE PERIOD 607 1,147
Basic earnings per share (eur) 1.40 1.60
HALF-YEAR FINANCIAL REPORT FOR JANUARY – JUNE 2016
25
Consolidated balance sheet, IFRS
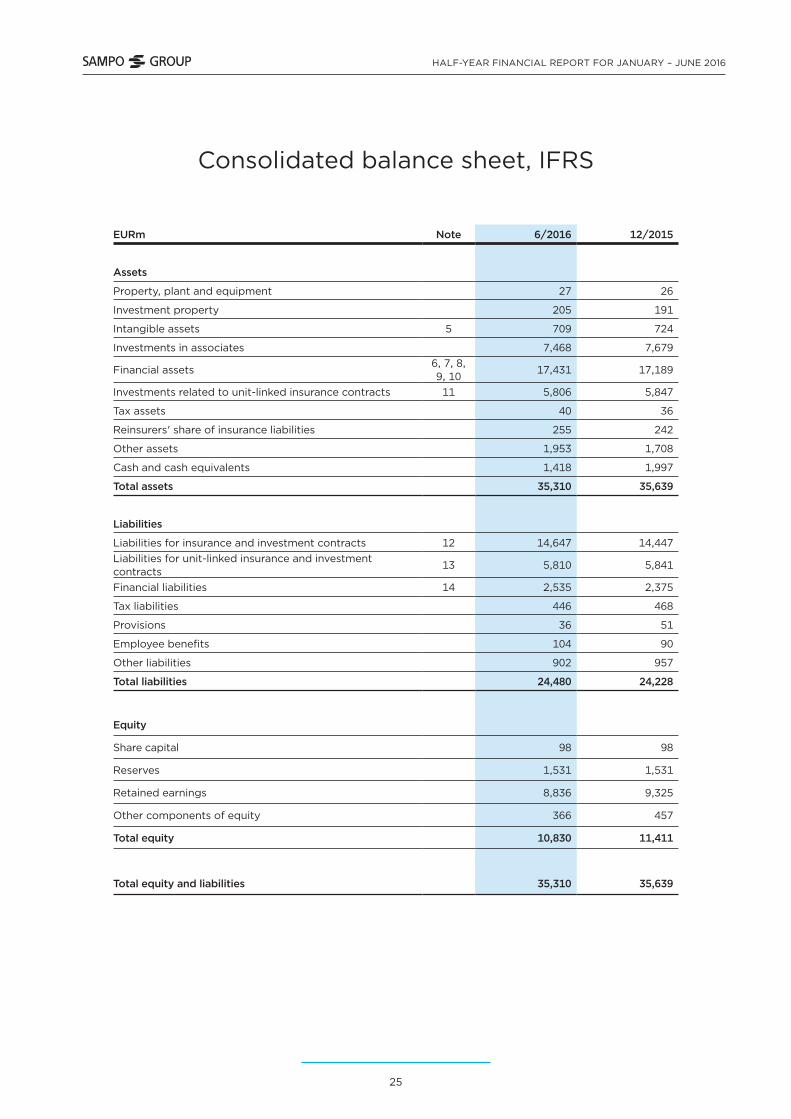
EURm Note 6/2016 12/2015
Assets
Property, plant and equipment 27 26
Investment property 205 191
Intangible assets 5 709 724
Investments in associates 7,468 7,679
Financial assets6, 7, 8, 9, 10
17,431 17,189
Investments related to unit-linked insurance contracts 11 5,806 5,847
Tax assets 40 36
Reinsurers' share of insurance liabilities 255 242
Other assets 1,953 1,708
Cash and cash equivalents 1,418 1,997
Total assets 35,310 35,639
Liabilities
Liabilities for insurance and investment contracts 12 14,647 14,447Liabilities for unit-linked insurance and investment contracts
13 5,810 5,841
Financial liabilities 14 2,535 2,375
Tax liabilities 446 468
Provisions 36 51
Employee benefits 104 90
Other liabilities 902 957
Total liabilities 24,480 24,228
Equity
Share capital 98 98
Reserves 1,531 1,531
Retained earnings 8,836 9,325
Other components of equity 366 457
Total equity 10,830 11,411
Total equity and liabilities 35,310 35,639

HALF-YEAR FINANCIAL REPORT FOR JANUARY – JUNE 2016
26
Statement of changes in equity, IFRS
EURm Share capital Legal reserve
Invested unrestricted
equity
Retained earnings
1)
Translation of
foreign operations
2)
Available- for-sale
financial assets
3) Total
Equity at 1 Jan. 2015 98 4 1,527 8,655 -400 1,039 10,924
Changes in equityRecognition of undrawn dividends 8 8
Dividends -1,092 -1,092Share of associate's other changes in equity 3 3
Profit for the period 894 894Other comprehensive in-come for the period 69 59 125 253
Equity at 30 June 2015 98 4 1,527 8,538 -341 1,164 10,990
Equity at 31 Jan. 2016 98 4 1,527 9,325 -472 929 11,411
Changes in equityRecognition of undrawn dividends 9 9
Dividends -1,204 -1,204Share of associate's other changes in equity 7 7
Profit for the period 783 783
Other comprehensive income for the period -85 -23 -68 -176
Equity at 30 June 2016 98 4 1,527 8,836 -495 860 10,830
1) IAS 19 Pension benefits had a net effect of EURm -85 (69) on retained earnings.
2) The total comprehensive income includes also the share of the associate Nordea's other comprehensive income, in accordance with the Group's share holding. The retained earnings thus include EURm -69 (45) of Nordea's actuarial gains/losses from defined pension plans. The exchange differences include the share of Nordea's exchange differences EURm 26 (47). Respectively, available-for-sale financial assets include EURm 12 (-11) of Nordea's valuation differences.
3) The amount recognised in equity from available-for-sale financial assets for the period totalled EURm -143 (361). The amount transferred to p/l amounted to EURm 47 (-215). EURm 16 (10) was transferred to the Segregated Suomi portfolio.
The amount included in the translation, available-for-sale and defined benefit plans represent other comprehensive income for each component, net of tax.

HALF-YEAR FINANCIAL REPORT FOR JANUARY – JUNE 2016
27
Statement of cash flows, IFRS
EURm 1–6/2016 1–6/2015
Cash and cash equivalent at the beginning of the period 1,997 2,074
Cash flow from/used in operating activities -121 392
Cash flow from/used in investing activities 555 526
Cash flow from/used in financing activities -1,013 -965
Dividends paid -1,189 -1,078
Increase of liabilities 815 701
Decrease of liabilities -639 -587
Cash and cash equivalent at the end of the period 1,418 2,027
The cash flow statement reports cash flows during the period classified by operating, investing and financing activities. Cash flows from operating activities derive primarily from the principal revenue-producing activities. Cash flows from investments in subsidiaries and associated undertakings and those from investments in intangible assets and property, plant and equipment are presented in investing activities. Financing activities include cash flows resulting from changes in equity and borrowings in order to conduct the business. Cash and cash equivalents consist of cash at bank and in hand and short-term deposits (under 3 months).

HALF-YEAR FINANCIAL REPORT FOR JANUARY – JUNE 2016
28
Notes
Accounting policies Sampo Group’s consolidated financial statements are prepared in accordance with the International Financial Reporting Standards (IFRS) adopted by the EU. The interim financial statements are presented in accordance with IAS 34 Interim Financial Reporting. In preparing the interim financial statements, the same accounting policies and methods of computation are applied as in the financial statements for 2015.
Sampo adopted new or revised standards and interpretations at the beginning of the year 2016. These standards and interpretations are explained in Sampos accounting policies for the financial year 2015. The financial statements are available at www.sampo.com/annualreport.
Accounting policies
HALF-YEAR FINANCIAL REPORT FOR JANUARY – JUNE 2016
29
Comprehensive income statement by segment for six months ended 30 June 2016
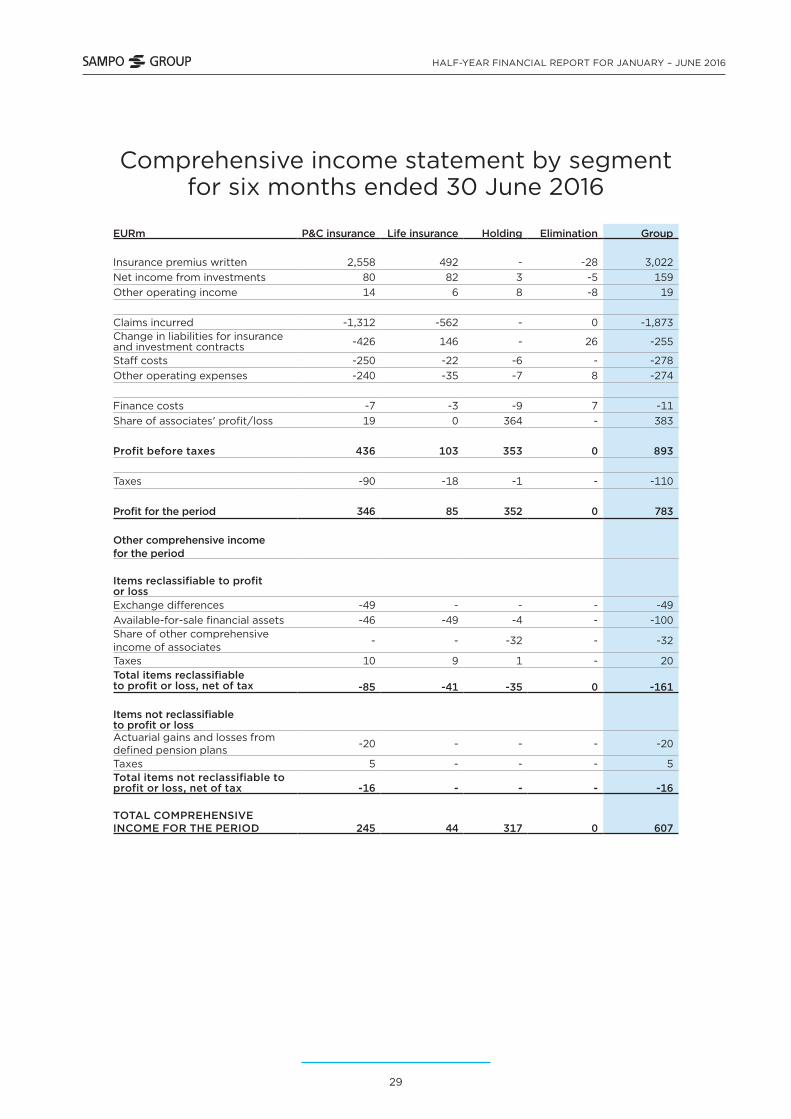
EURm P&C insurance Life insurance Holding Elimination Group
Insurance premius written 2,558 492 - -28 3,022Net income from investments 80 82 3 -5 159Other operating income 14 6 8 -8 19
Claims incurred -1,312 -562 - 0 -1,873Change in liabilities for insurance and investment contracts -426 146 - 26 -255
Staff costs -250 -22 -6 - -278Other operating expenses -240 -35 -7 8 -274
Finance costs -7 -3 -9 7 -11Share of associates' profit/loss 19 0 364 - 383
Profit before taxes 436 103 353 0 893
Taxes -90 -18 -1 - -110
Profit for the period 346 85 352 0 783
Other comprehensive income for the period
Items reclassifiable to profit or lossExchange differences -49 - - - -49Available-for-sale financial assets -46 -49 -4 - -100Share of other comprehensive income of associates
- - -32 - -32
Taxes 10 9 1 - 20Total items reclassifiable to profit or loss, net of tax -85 -41 -35 0 -161
Items not reclassifiable to profit or lossActuarial gains and losses from defined pension plans -20 - - - -20
Taxes 5 - - - 5Total items not reclassifiable to profit or loss, net of tax -16 - - - -16
TOTAL COMPREHENSIVE INCOME FOR THE PERIOD 245 44 317 0 607

HALF-YEAR FINANCIAL REPORT FOR JANUARY – JUNE 2016
30
Comprehensive income statement by segment for six months ended 30 June 2015
EURm P&C insurance Life insurance Holding Elimination Group
Insurance premius written 2,628 676 - - 3,304Net income from investments 173 599 52 -6 818Other operating income 15 8 8 -9 22
Claims incurred -1,519 -588 - - -2,107Change in liabilities for insurance and investment contracts -448 -548 - -6 -1,002
Staff costs -106 -24 -10 - -140Other operating expenses -247 -40 -7 9 -285
Finance costs -9 -4 -37 10 -39Share of associates' profit/loss 24 0 418 - 443
Profit before taxes 511 81 425 -2 1,015
Taxes -106 -14 0 0 -121
Profit for the period 404 67 425 -2 894
Other comprehensive income for the period
Items reclassifiable to profit or lossExchange differences 12 - - - 12Available-for-sale financial assets 60 99 7 8 174Share of other comprehensive income of associates - - 81 - 81
Taxes -13 -22 -1 -2 -38Total items not reclassifiable to profit or loss, net of tax 59 77 86 6 229
Items not reclassifiable to profit or lossActuarial gains and losses from defined pension plans 32 - - - 32
Taxes -8 - - - -8Total items not reclassifiable to profit or loss, net of tax 24 - - - 24
TOTAL COMPREHENSIVE INCOME FOR THE PERIOD 488 144 511 5 1,147

HALF-YEAR FINANCIAL REPORT FOR JANUARY – JUNE 2016
31
Consolidated balance sheet by segment at 30 June 2016
EURmP&C
insuranceLife
insurance Holding Elimination Group
AssetsProperty, plant and equipment 19 4 3 - 27Investment property 14 194 - -4 205Intangible assets 549 159 0 - 709Investments in associates 374 0 7,094 - 7,468Financial assets 11,108 5,825 3,157 -2,659 17,431Investments related to unit-linked insurance contracts - 5,849 - -43 5,806
Tax assets 31 13 -4 40Reinsurers' share of insurance liabilities 252 3 - - 255
Other assets 1,810 123 31 -12 1,953Cash and cash equivalents 575 426 416 - 1,418Total assets 14,732 12,584 10,716 -2,722 35,310
LiabilitiesLiabilities for insurance and investment contracts 9,777 4,870 - - 14,647
Liabilities for unit-linked insurance and investment contracts - 5,853 - -43 5,810
Financial liabilities 230 128 2,465 -289 2,535Tax liabilities 303 143 - 0 446Provisions 36 - - - 36Employee benefits 104 - - - 104Other liabilities 690 137 88 -13 902Total liabilities 11,140 11,131 2,554 -345 24,480
EquityShare capital 98Reserves 1,531Retained earnings 8,836Other components of equity 366Total equity 10,830
Total equity and liabilities 35,310

HALF-YEAR FINANCIAL REPORT FOR JANUARY – JUNE 2016
32
Consolidated balance sheet by segment at 31 December 2015
EURmP&C
insuranceLife
insurance Holding Elimination Group
Assets Property, plant and equipment 19 5 3 - 26Investment property 15 180 - -4 191Intangible assets 564 160 0 - 724Investments in associates 374 0 7,305 - 7,679Financial assets 10,566 6,039 3,243 -2,659 17,189Investments related to unit-linked insurance contracts - 5,865 - -18 5,847
Tax assets 27 - 12 -4 36Reinsurers' share of insurance liabilities 239 3 - - 242
Other assets 1,541 127 51 -10 1,708Cash and cash equivalents 775 482 739 - 1,997Total assets 14,119 12,860 11,354 -2,695 35,639
LiabilitiesLiabilities for insurance and investment contracts 9,433 5,014 - - 14,447
Liabilities for unit-linked insurance and investment contracts - 5,858 - -18 5,841
Financial liabilities 216 133 2,314 -289 2,375Tax liabilities 314 154 - 0 468Provisions 51 - - - 51Employee benefits 90 - - - 90Other liabilities 669 167 133 -11 957Total liabilities 10,772 11,327 2,447 -318 24,228
EquityShare capital 98Reserves 1,531Retained earnings 9,325Other components of equity 457Total equity 11,411
Total equity and liabilities 35,639
HALF-YEAR FINANCIAL REPORT FOR JANUARY – JUNE 2016
33
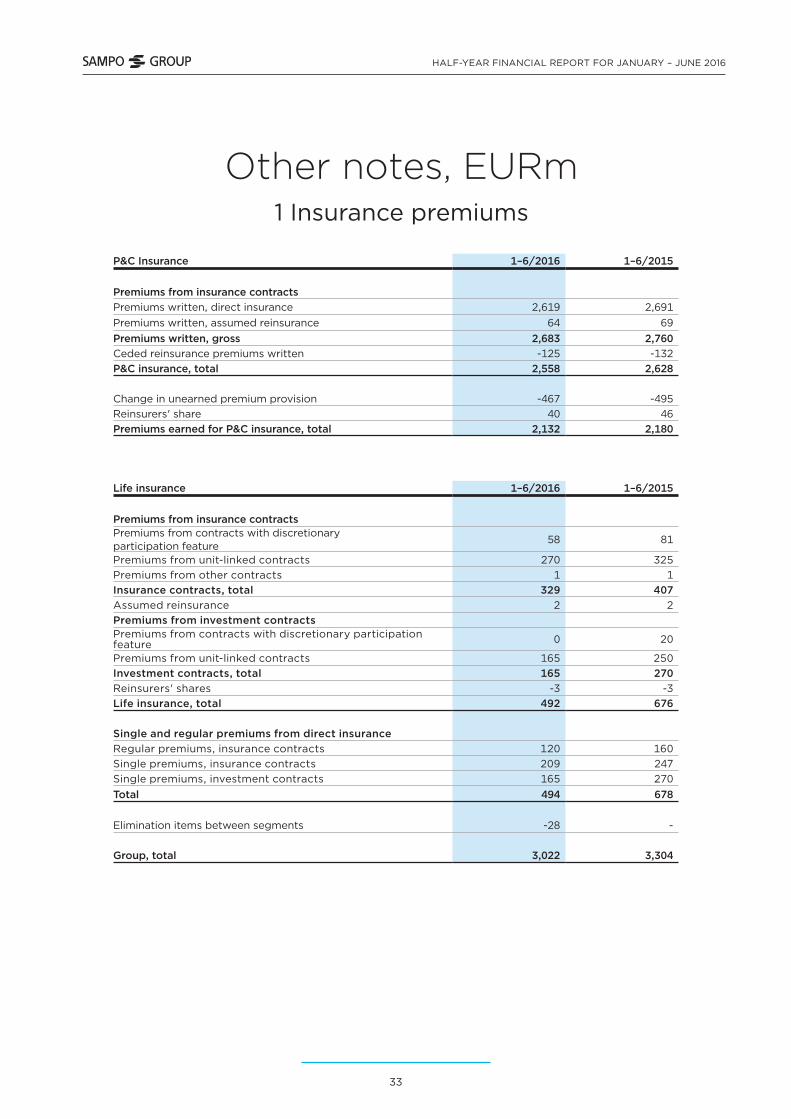
Other notes, EURm1 Insurance premiums
P&C Insurance 1–6/2016 1–6/2015
Premiums from insurance contractsPremiums written, direct insurance 2,619 2,691Premiums written, assumed reinsurance 64 69Premiums written, gross 2,683 2,760Ceded reinsurance premiums written -125 -132P&C insurance, total 2,558 2,628
Change in unearned premium provision -467 -495Reinsurers' share 40 46Premiums earned for P&C insurance, total 2,132 2,180
Life insurance 1–6/2016 1–6/2015
Premiums from insurance contractsPremiums from contracts with discretionary participation feature
58 81
Premiums from unit-linked contracts 270 325Premiums from other contracts 1 1Insurance contracts, total 329 407Assumed reinsurance 2 2Premiums from investment contractsPremiums from contracts with discretionary participation feature 0 20
Premiums from unit-linked contracts 165 250Investment contracts, total 165 270Reinsurers' shares -3 -3Life insurance, total 492 676
Single and regular premiums from direct insuranceRegular premiums, insurance contracts 120 160Single premiums, insurance contracts 209 247Single premiums, investment contracts 165 270Total 494 678
Elimination items between segments -28 -
Group, total 3,022 3,304

HALF-YEAR FINANCIAL REPORT FOR JANUARY – JUNE 2016
34
2 Net income from investments >
P&C Insurance 1–6/2016 1–6/2015
Financial assetsDerivative financial instruments 1 -7
Loans and receivables 4 9
Financial asset available-for-sale Debt securities 73 104 Equity securities 25 96Total 98 199
Total financial assets 103 202
Fee and commission expense -6 -8
Expense on other than financial liabilities -2 -2
Effect of discounting annuities -15 -19
P&C insurance, total 80 173

HALF-YEAR FINANCIAL REPORT FOR JANUARY – JUNE 2016
35
> 2 Net income from investments >
Life insurance 1–6/2016 1–6/2015
Financial assetsDerivative financial instruments 54 -70
Financial assets designated as at fair value through p/l Debt securities -3 1 Equity securities 0 0Total -3 2
Investments related to unit-linked contracts Debt securities -5 62 Equity securities -73 307 Loans and receivables 0 1 Other financial assets 3 -23Total -75 346
Loans and receivables 5 26
Financial asset available-for-sale Debt securities 28 76 Equity securities 64 209Total 93 284
Total income from financial assets 73 589
Other assets 4 3
Fee and commission income, net 5 7
Life insurance, total 82 599

HALF-YEAR FINANCIAL REPORT FOR JANUARY – JUNE 2016
36
> 2 Net income from investments
Holding 1–6/2016 1–6/2015
Financial assetsDerivative financial instruments 6 4
Loans and other receivables -11 5
Financial assets available-for-sale Debt securities 14 24 Equity securities -6 19Total 7 43
Holding, total 3 52
Elimination items between segments -5 -6
Group, total 159 818

HALF-YEAR FINANCIAL REPORT FOR JANUARY – JUNE 2016
37
3 Claims incurred
P&C insurance 1–6/2016 1–6/2015
Claims paid -1,427 -1,365Reinsurers' share 42 35Claims paid, net -1,385 -1,330Change in provision for claims outstanding 98 -189Reinsurers' share -25 0P&C insurance total -1,312 -1,519
Life insurance 1–6/2016 1–6/2015
Claims paid -567 -558Reinsurers' share 2 2Claims paid, net -565 -556Change in provision for claims outstanding 3 -32Reinsurers' share 0 0Life insurance, total -562 -588
Elimination items between segments 0 -
Group, total 1,873 -2,107

HALF-YEAR FINANCIAL REPORT FOR JANUARY – JUNE 2016
38
4 Staff costs
P&C insurance 1–6/2016 1–6/2015
Wages and salaries -183 -183Granted cash-settled share options 2 -9Pension costs -34 102Other social security costs -35 -16P&C insurance, total -250 -106
Life insurance 1–6/2016 1–6/2015
Wages and salaries -18 -18Granted cash-settled share options 0 -2Pension costs -3 -3Other social security costs -1 -2Life insurance, total -22 -24
Holding 1–6/2016 1–6/2015
Wages and salaries -5 -4Granted cash-settled share options 1 -4Pension costs -1 -1Other social security costs -1 0Holding, total -6 -10
Group, total -278 -140

HALF-YEAR FINANCIAL REPORT FOR JANUARY – JUNE 2016
39
5 Intangible assets
P&C insurance 6/2016 12/2015
Goodwill 533 547Other intangible assets 16 17P&C insurance, total 549 564
Life insurance 6/2016 12/2015
Goodwill 153 153Other intangible assets 6 7Life insurance, total 159 160
Group, total 709 724

HALF-YEAR FINANCIAL REPORT FOR JANUARY – JUNE 2016
40
6 Financial assets
P&C insurance 6/2016 12/2015
Derivative financial instruments (Note 7) 21 21Loans and receivables Loans 27 108 Deposits with ceding undertakings 1 1Total 27 108Financial assets available-for-sale Debt securities 9,636 8,916 Equity securities 1,424 1,522Total 11,060 10,437P&C insurance, total 11,108 10,566
Life insurance 6/2016 12/2015
Derivative financial instruments (Note 7) 12 11Financial assets designated as at fair value through p/l Debt securities 24 47 Equity securities 2 2Total 26 48Loans and receivables Loans 21 24Financial assets available-for-sale Debt securities 3,283 3,414 Equity securities *) 2,483 2,542Total 5,766 5,956Life insurance, total 5,825 6,039
*) of which investments in fixed income funds 107 113
Holding 6/2016 12/2015
Derivative financial instruments (Note 7) 9 21Loans and receivables Deposits 1 1Financial assets available-for-sale Debt securities 642 603 Equity securities 136 248Total 778 852Investments in subsidiaries 2,370 2,370Holding, total 3,157 3,243
Elimination items between segments -2,659 -2,659
Group, total 17,431 17,189

HALF-YEAR FINANCIAL REPORT FOR JANUARY – JUNE 2016
41
7 Derivative financial instruments
6/2016 12/2015P&C insurance Fair value Fair value Fair value Fair value
Contract/ notional amount Assets Liabilities
Contract/ notional amount Assets Liabilities
Derivatives held for tradingInterest rate derivatives 68 - 4 2,069 0 2Foreign exchange derivatives 3,363 20 27 2,878 21 15Equity derivatives 0 1 - - - -
P&C Insurance, total 3,432 21 31 4,948 21 17
6/2016 12/2015Life insurance Fair value Fair value Fair value Fair value
Contract/ notional amount Assets Liabilities
Contract/ notional amount Assets Liabilities
Derivatives held for tradingInterest rate derivatives - - - 4,618 0 1Credit risk derivatives - - - 643 - 0Foreign exchange derivatives 1,958 12 22 1,789 9 22Total 1,958 12 22 7,050 9 24
Derivatives held for hedgingFair value hedges 554 - 6 602 2 9
Life insurance, total 2,512 12 28 3,981 11 33
6/2016 12/2015Holding Fair value Fair value Fair value Fair value
Contract/ notional amount Assets Liabilities
Contract/ notional amount Assets Liabilities
Derivatives held for tradingInterest rate derivatives 500 6 - 800 10 -Foreign exchange derivatives 400 1 1 74 1 2Equity derivatives 11 2 3 60 10 10
Holding, total 911 9 4 933 21 12

HALF-YEAR FINANCIAL REPORT FOR JANUARY – JUNE 2016
42
8 Determination and hierarchy of fair values >
A large majority of Sampo Group's financial assets are valued at fair value. The valuation is based on either published price quatations or valuation techniques based on market observable inputs, where available. For a limited amount of assets the value needs to be determined using other techniques.
The financial instruments measured at fair value have been classified into three hierarchy levels in the notes, depending on e.g. if the market for the instrument is active, or if the inputs used in the valuation technique are observable.
On level 1, the measurement of the instrument is based on quoted prices in active markets for identical assets or liabilities.
On level 2, inputs for the measurement of the instrument include also other than quoted prices observable for the asset or liability, either directly or indirectly by using valuation techniques.
In level 3, the measurement is based on other inputs rather than observable market data.
Financial assets at 30.6.2016 Level 1 Level 2 Level 3 Total
Derivative financial instruments
Interest rate swaps - 6 - 6
Foreign exchange derivatives - 33 - 33
Equity derivatives - 2 - 2
Total - 41 - 41
Financial assets designated at fair value through profit or lossEquity securities 2 - - 2
Debt securities 18 6 0 24
Total 20 6 0 26
Financial assets related to unit-linked insuranceEquity securities 551 10 14 575
Debt securities 674 524 27 1,224
Mutual funds 2,715 901 114 3,729
Derivative financial instruments - 13 - 13
Total 3,940 1,447 155 5,541
Financial assets available-for-sale
Equity securities 1,889 - 45 1,934
Debt securities 9,480 3,735 57 13,272
Mutual funds 1,261 66 782 2,110
Total 12,629 3,801 884 17,315
Total financial assets measured at fair value 16,589 5,295 1,039 22,923
HALF-YEAR FINANCIAL REPORT FOR JANUARY – JUNE 2016
43
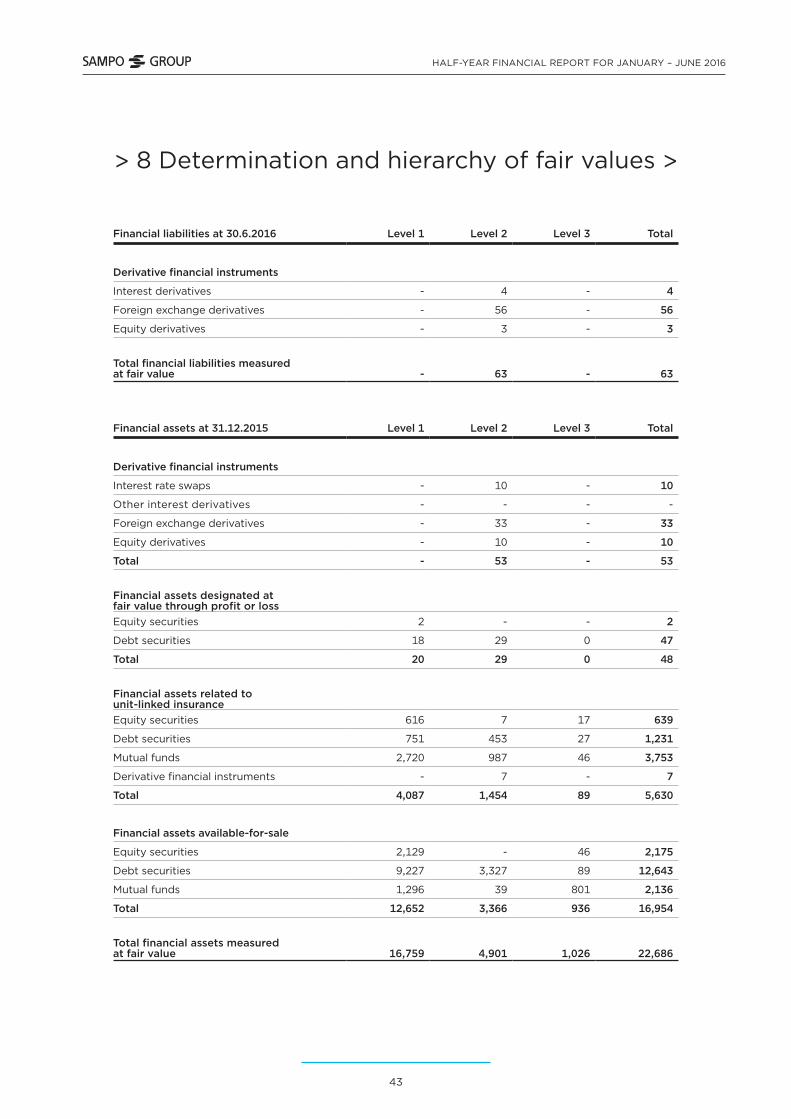
Financial liabilities at 30.6.2016 Level 1 Level 2 Level 3 Total
Derivative financial instruments
Interest derivatives - 4 - 4
Foreign exchange derivatives - 56 - 56
Equity derivatives - 3 - 3
Total financial liabilities measured at fair value - 63 - 63
Financial assets at 31.12.2015 Level 1 Level 2 Level 3 Total
Derivative financial instruments
Interest rate swaps - 10 - 10
Other interest derivatives - - - -
Foreign exchange derivatives - 33 - 33
Equity derivatives - 10 - 10
Total - 53 - 53
Financial assets designated at fair value through profit or lossEquity securities 2 - - 2
Debt securities 18 29 0 47
Total 20 29 0 48
Financial assets related to unit-linked insuranceEquity securities 616 7 17 639
Debt securities 751 453 27 1,231
Mutual funds 2,720 987 46 3,753
Derivative financial instruments - 7 - 7
Total 4,087 1,454 89 5,630
Financial assets available-for-sale
Equity securities 2,129 - 46 2,175
Debt securities 9,227 3,327 89 12,643
Mutual funds 1,296 39 801 2,136
Total 12,652 3,366 936 16,954
Total financial assets measured at fair value 16,759 4,901 1,026 22,686
> 8 Determination and hierarchy of fair values >
HALF-YEAR FINANCIAL REPORT FOR JANUARY – JUNE 2016
44
> 8 Determination and hierarchy of fair values
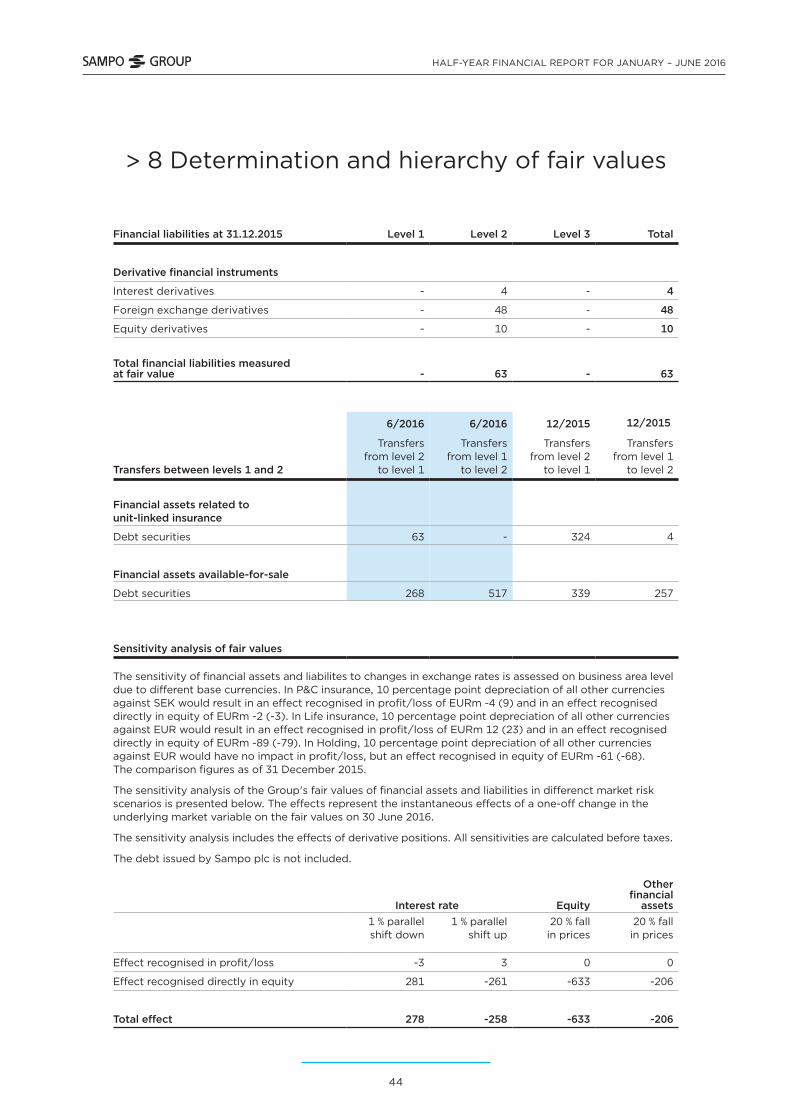
Financial liabilities at 31.12.2015 Level 1 Level 2 Level 3 Total
Derivative financial instruments
Interest derivatives - 4 - 4
Foreign exchange derivatives - 48 - 48
Equity derivatives - 10 - 10
Total financial liabilities measured at fair value - 63 - 63
6/2016 6/2016 12/2015 12/2015
Transfers between levels 1 and 2
Transfers from level 2
to level 1
Transfers from level 1
to level 2
Transfers from level 2
to level 1
Transfers from level 1
to level 2
Financial assets related to unit-linked insurance
Debt securities 63 - 324 4
Financial assets available-for-sale
Debt securities 268 517 339 257
Sensitivity analysis of fair values
The sensitivity of financial assets and liabilites to changes in exchange rates is assessed on business area level due to different base currencies. In P&C insurance, 10 percentage point depreciation of all other currencies against SEK would result in an effect recognised in profit/loss of EURm -4 (9) and in an effect recognised directly in equity of EURm -2 (-3). In Life insurance, 10 percentage point depreciation of all other currencies against EUR would result in an effect recognised in profit/loss of EURm 12 (23) and in an effect recognised directly in equity of EURm -89 (-79). In Holding, 10 percentage point depreciation of all other currencies against EUR would have no impact in profit/loss, but an effect recognised in equity of EURm -61 (-68). The comparison figures as of 31 December 2015.
The sensitivity analysis of the Group's fair values of financial assets and liabilities in differenct market risk scenarios is presented below. The effects represent the instantaneous effects of a one-off change in the underlying market variable on the fair values on 30 June 2016.
The sensitivity analysis includes the effects of derivative positions. All sensitivities are calculated before taxes.
The debt issued by Sampo plc is not included.
Interest rate Equity
Other financial
assets1 % parallel shift down
1 % parallel shift up
20 % fall in prices
20 % fall in prices
Effect recognised in profit/loss -3 3 0 0
Effect recognised directly in equity 281 -261 -633 -206
Total effect 278 -258 -633 -206

HALF-YEAR FINANCIAL REPORT FOR JANUARY – JUNE 2016
45
9 Movements in level 3 financial instruments measured at fair value >
Financial assets at 30.6.2016At Jan. 1
2016
Total gains/losses in income
statement
Total gains/losses
recorded in other com-prehensive
income Purchases Sales
Transfers between
levels 1 and 2
At 30 June
2016
Gains/losses included in p/l
for financial assets
30 June 2016
Financial assets designated at fair value through profit or loss
Equity securities 17 -7 - 7 -2 - 14 -
Debt securities 27 0 - - - - 27 0
Mutual funds 46 0 - 76 -8 - 114 2
Total 89 -7 - 83 -11 - 155 2
Financial assets available-for-sale
Equity securities 46 0 0 0 -1 - 45 0
Debt securities 90 1 0 113 -145 - 58 0
Mutual funds 801 -9 -22 112 -100 - 781 -30
Total 936 -9 -22 225 -247 - 884 -30
Total financial assests measured at fair value 1,026 -15 -22 308 -257 - 1,039 -28
6/2016
Realised gainsFair value gains
and losses Total
Total gains or losses included in profit or loss for the financial period -15 -22 -37Total gains or losses included in profit and loss for assets held at the end of the financial period -6 -22 -28

HALF-YEAR FINANCIAL REPORT FOR JANUARY – JUNE 2016
46
> 9 Movements in level 3 financial instruments measured at fair value
Financial assets at 31.12.2015At Jan. 1
2015
Total gains/losses in income
statement
Total gains/losses
recorded in other com-prehensive
income Purchases Sales
Transfers between
levels 1 and 2
At 31 Dec
2015
Gains/losses included in p/l
for financial assets
31 Dec 2015
Financial assets designated at fair value through profit or loss
Equity securities 16 2 - 3 -4 - 17 1
Debt securities 24 0 - 0 0 3 27 0
Mutual funds 57 2 - 11 -23 - 46 2
Total 96 3 - 14 -27 3 89 3
Financial assets available-for-sale
Equity securities 228 14 -2 0 -194 - 46 2
Debt securities 78 9 0 90 -86 - 90 0
Mutual funds 748 25 13 174 -159 - 801 7
Total 1,054 48 10 264 -440 - 936 9
Total financial assests measured at fair value 1,150 51 10 278 -467 3 1,026 12
12/2015
Realised gainsFair value
gains and losses Total
Total gains or losses included in profit or loss for the financial period 51 6 57Total gains or losses included in profit and loss for assets held at the end of the financial period 6 6 12

HALF-YEAR FINANCIAL REPORT FOR JANUARY – JUNE 2016
47
10 Sensitivity analysis of level 3 financial instruments measured at fair value
6/2016 12/2015
Carrying amount
Effect of reasoably
possible alternative
assumptions (+ / -)
Carrying amount
Effect of reasoably
possible alternative
assumptions (+ / -)
Financial assets
Financial assets available-for-sale
Equity securities 48 -10 46 -9
Debt securities 57 -1 89 -2
Mutual Funds 779 -156 801 -160
Total 885 -167 936 -171
The value of financial assets regarding the debt security instruments has been tested by assuming a rise of 1 per cent unit in interest rate level in all maturities. For other financial assets, the prices were assumed to go down by 20 per cent. Sampo Group bears no investment risks related to unit-linked insurance, so a change in assumptions regarding these assets does not affect profit or loss. On the basis of the these alternative assumptions, a possible change in interest levels at 30 June 2016 would cause descend of EURm 1 (2) for the debt instruments, and EURm 165 (169) valuation loss for other instruments in the Group's other comprehensive income. The reasonably possible effect, proportionate to the Group's equity, would thus be 1.5 per cent (1.5).
11 Investments related to unit-linked insurance
Life insurance 6/2016 12/2015
Financial assets as at fair value through p/lDebt securities 1,267 1,248Equity securities 4,304 4,392Loans and receivables 265 217Derivatives 13 7Life insurance, total 5,849 5,865
Elimination items between segments -43 -18
Group, total 5,806 5,847

HALF-YEAR FINANCIAL REPORT FOR JANUARY – JUNE 2016
48
12 Liabilities for insurance and investment contracts >
P&C insurance 6/2016 12/2015
Insurance contractsProvision for unearned premiums 2,485 2,017Provision for claims outstanding 7,292 7,416P&C insurance, total 9,777 9,433
Reinsurers' shareProvision for unearned premiums 86 46Provision for claims outstanding 166 193P&C insurance, total 252 239
HALF-YEAR FINANCIAL REPORT FOR JANUARY – JUNE 2016
49
> 12 Liabilities for insurance and investment contracts
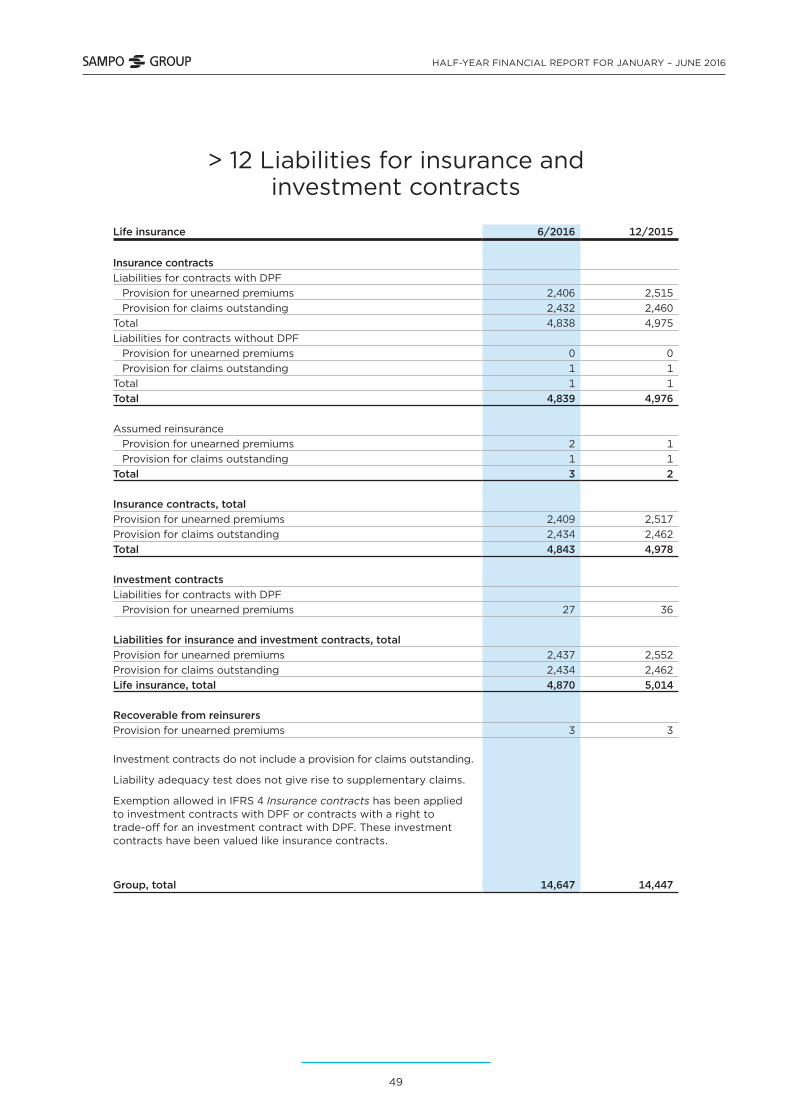
Life insurance 6/2016 12/2015
Insurance contractsLiabilities for contracts with DPF Provision for unearned premiums 2,406 2,515 Provision for claims outstanding 2,432 2,460Total 4,838 4,975Liabilities for contracts without DPF Provision for unearned premiums 0 0 Provision for claims outstanding 1 1Total 1 1Total 4,839 4,976
Assumed reinsurance Provision for unearned premiums 2 1 Provision for claims outstanding 1 1Total 3 2
Insurance contracts, totalProvision for unearned premiums 2,409 2,517Provision for claims outstanding 2,434 2,462Total 4,843 4,978
Investment contractsLiabilities for contracts with DPF Provision for unearned premiums 27 36
Liabilities for insurance and investment contracts, totalProvision for unearned premiums 2,437 2,552Provision for claims outstanding 2,434 2,462Life insurance, total 4,870 5,014
Recoverable from reinsurersProvision for unearned premiums 3 3
Investment contracts do not include a provision for claims outstanding.
Liability adequacy test does not give rise to supplementary claims.
Exemption allowed in IFRS 4 Insurance contracts has been applied to investment contracts with DPF or contracts with a right to trade-off for an investment contract with DPF. These investment contracts have been valued like insurance contracts.
Group, total 14,647 14,447
HALF-YEAR FINANCIAL REPORT FOR JANUARY – JUNE 2016
50
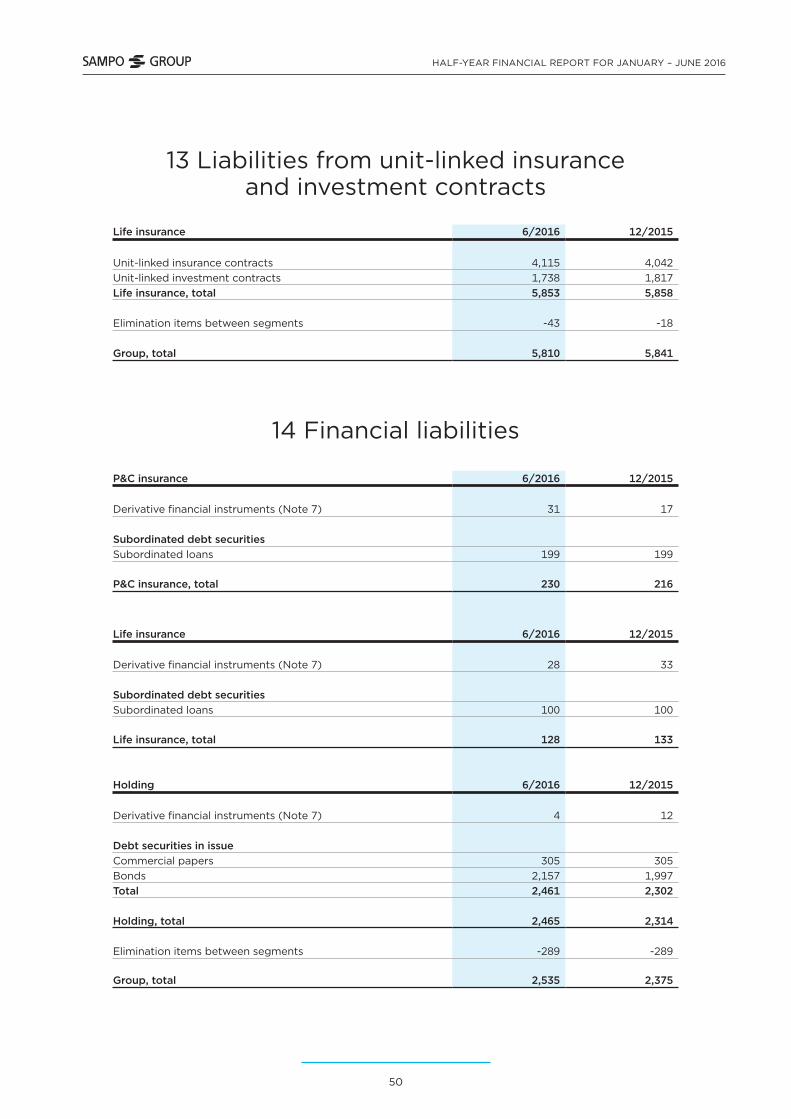
13 Liabilities from unit-linked insurance and investment contracts
14 Financial liabilities
Life insurance 6/2016 12/2015
Unit-linked insurance contracts 4,115 4,042Unit-linked investment contracts 1,738 1,817Life insurance, total 5,853 5,858
Elimination items between segments -43 -18
Group, total 5,810 5,841
P&C insurance 6/2016 12/2015
Derivative financial instruments (Note 7) 31 17
Subordinated debt securitiesSubordinated loans 199 199
P&C insurance, total 230 216
Life insurance 6/2016 12/2015
Derivative financial instruments (Note 7) 28 33
Subordinated debt securitiesSubordinated loans 100 100
Life insurance, total 128 133
Holding 6/2016 12/2015
Derivative financial instruments (Note 7) 4 12
Debt securities in issueCommercial papers 305 305Bonds 2,157 1,997Total 2,461 2,302
Holding, total 2,465 2,314
Elimination items between segments -289 -289
Group, total 2,535 2,375

HALF-YEAR FINANCIAL REPORT FOR JANUARY – JUNE 2016
51
15 Contingent liabilities and commitments >
P&C insurance 6/2016 12/2015
Off-balance sheet itemsGuarantees 5 5Other irrevocable commitments 15 15Total 19 20
Assets pledged as collateral for liabilities or contingent liabilities
6/2016 6/2016 12/2015 12/2015
Assets pledged as collateralAssets
pledgedLiabilities/
commitmentsAssets
pledgedLiabilities/
commitments
Investments- Investment securities 231 157 242 159
Assets pledged as security for derivative contracts, carrying value 6/2016 12/2015Investment securities 13 0
The pledged assets are included in the balance sheet item Other assets.
Non-cancellable operating leases 6/2016 12/2015Minimum lease payments - not later than one year 30 32- later than one year and not later than five years 101 98- later than five years 48 48Total 178 178

HALF-YEAR FINANCIAL REPORT FOR JANUARY – JUNE 2016
52
> 15 Contingent liabilities and commitments
Life insurance 6/2016 12/2015
Off-balance sheet itemsInvestment commitments 407 397Acquisition of IT-software 1 1Total 407 398
Assets pledged as security for derivative contracts, carrying value
Cash and cash equivalents 19 19
The pledged assets are included in the balance sheet item Other assets.
Non-cancellable operating leases 6/2016 12/2015Minimum lease payments - not later than one year 2 2- later than one year and not later than five years 7 8- later than five years 5 7Total 13 18
Holding 6/2016 12/2015
Non-cancellable operating leases Minimum lease payments - not later than one year 1 1- later than one year and not later than five years - 0Total 1 1

HALF-YEAR FINANCIAL REPORT FOR JANUARY – JUNE 2016
53
16 Result analysis of P&C insurance business
1–6/2016 1–6/2015
Premiums earned 2,132 2,180
Claims incurred -1,427 -1,644
Operating expenses -358 -210
Other technical income and expenses -2 -1Allocated investment return transferred from the non-technical account
8 16
Technical result 352 342
Investment result 89 183Allocated investment return transferred to the technical account
-23 -35
Other income and expenses 18 21
Operating result 436 511

HALF-YEAR FINANCIAL REPORT FOR JANUARY – JUNE 2016
54
17 Sampo plc’s income statement and balance sheet (FAS)
INCOME STATEMENT 1–6/2016 1–6/2015
Other operating income 8 8
Staff expenses -6 -10
Depreciation and impairment 0 0
Other operating expenses -7 -7
Operating profit -5 -8Finance income and expenses 670 649
Profit before appropriations and income taxes 665 640Income taxes -1 0
Profit for the financial period 664 640
BALANCE SHEET 6/2016 12/2015
ASSETSIntangible assets 0 0
Property, plant and equipment 3 3
Investments
Shares in Group companies 2,370 2,370
Receivables from Group companies 298 296
Shares in participating undertakings 5,557 5,557
Receivables from participating undertakings 228 196
Other shares and participations 136 248
Other receivables 116 111
Receivables 54 84
Cash and cash equivalents 416 739
TOTAL ASSETS 9,179 9,606
LIABILITIESEquityShare capital 98 98
Fair value reserve 5 8
Invested unrestricted equity 1,527 1,527
Other reserves 273 273
Retained earnings 4,059 4,026
Profit for the year 664 1,228
Total equity 6,625 7,159
LiabilitiesLong-term 2,157 1,997
Short-term 397 450
Total liabilities 2,554 2,447
TOTAL LIABILITIES 9,179 9,606

Sampo plc
Fabianinkatu 27
00100 Helsinki, Finland
Phone +358 10 516 0100
Business ID: 0142213-3
www.sampo.com
@Sampo_plc
sampo-plc