half-year report 2015 - ccb · definitions 2 half-year report 2015 in this half-year report, unless...
TRANSCRIPT
Half-Year Report 2015
(A joint stock company incorporated in the People’s Republic of China with limited liability)
Stock Code: 939
China Construction Bank Corporation
Contents 2 Definitions
3 Financial Highlights
4 Corporate Information
6 Chairman’s Statement
8 President’s Report
11 Management Discussion and Analysis 11 Financial Review 28 Business Review 39 Risk Management 45 Capital Management 52 Prospects
53 Changes in Share Capital and Particulars of Shareholders
55 Profiles of Directors, Supervisors, and Senior Management
57 Major Issues
60 Independent Review Report
61 Half-Year Financial Statements
167 Unaudited Supplementary Financial Information
170 Appendix Composition of Capital
Definitions
2 China Construction Bank Corporation Half-Year Report 2015
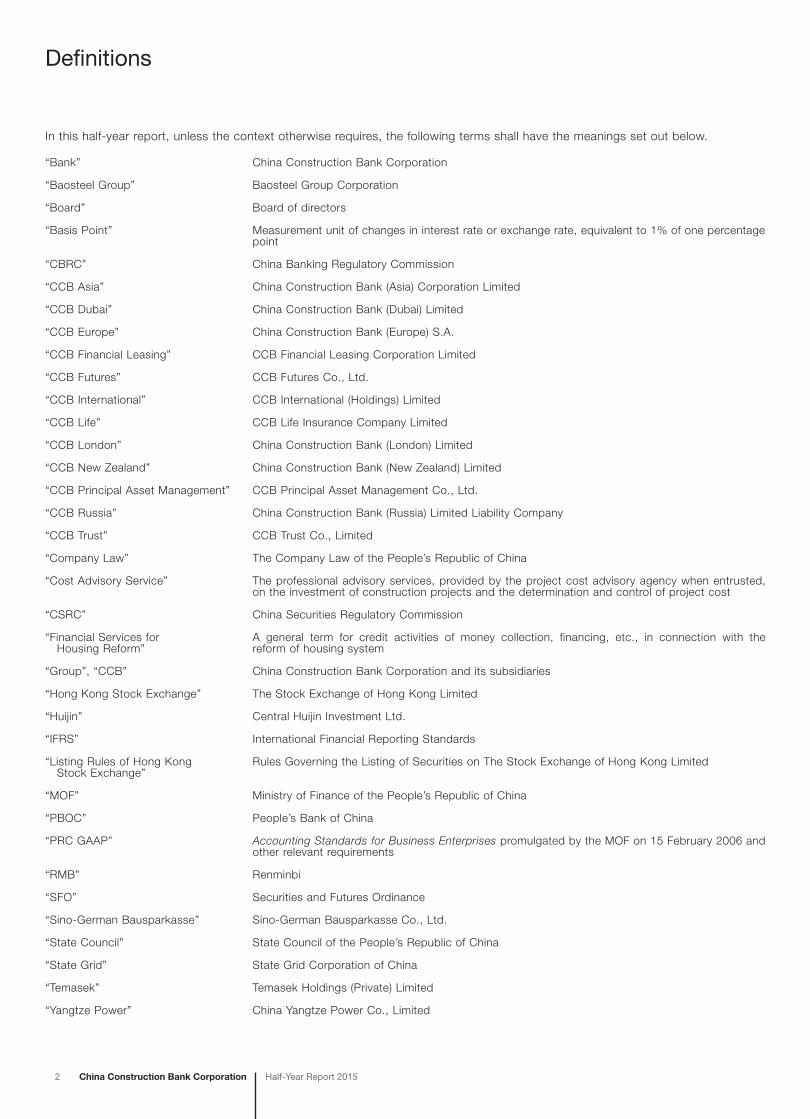
In this half-year report, unless the context otherwise requires, the following terms shall have the meanings set out below.
“Bank” China Construction Bank Corporation
“Baosteel Group” Baosteel Group Corporation
“Board” Board of directors
“Basis Point” Measurement unit of changes in interest rate or exchange rate, equivalent to 1% of one percentage point
“CBRC” China Banking Regulatory Commission
“CCB Asia” China Construction Bank (Asia) Corporation Limited
“CCB Dubai” China Construction Bank (Dubai) Limited
“CCB Europe” China Construction Bank (Europe) S.A.
“CCB Financial Leasing” CCB Financial Leasing Corporation Limited
“CCB Futures” CCB Futures Co., Ltd.
“CCB International” CCB International (Holdings) Limited
“CCB Life” CCB Life Insurance Company Limited
“CCB London” China Construction Bank (London) Limited
“CCB New Zealand” China Construction Bank (New Zealand) Limited
“CCB Principal Asset Management” CCB Principal Asset Management Co., Ltd.
“CCB Russia” China Construction Bank (Russia) Limited Liability Company
“CCB Trust” CCB Trust Co., Limited
“Company Law” The Company Law of the People’s Republic of China
“Cost Advisory Service” The professional advisory services, provided by the project cost advisory agency when entrusted, on the investment of construction projects and the determination and control of project cost
“CSRC” China Securities Regulatory Commission
“Financial Services for Housing Reform”
A general term for credit activities of money collection, financing, etc., in connection with the reform of housing system
“Group”, “CCB” China Construction Bank Corporation and its subsidiaries
“Hong Kong Stock Exchange” The Stock Exchange of Hong Kong Limited
“Huijin” Central Huijin Investment Ltd.
“IFRS” International Financial Reporting Standards
“Listing Rules of Hong Kong Stock Exchange”
Rules Governing the Listing of Securities on The Stock Exchange of Hong Kong Limited
“MOF” Ministry of Finance of the People’s Republic of China
“PBOC” People’s Bank of China
“PRC GAAP” Accounting Standards for Business Enterprises promulgated by the MOF on 15 February 2006 and other relevant requirements
“RMB” Renminbi
“SFO” Securities and Futures Ordinance
“Sino-German Bausparkasse” Sino-German Bausparkasse Co., Ltd.
“State Council” State Council of the People’s Republic of China
“State Grid” State Grid Corporation of China
“Temasek” Temasek Holdings (Private) Limited
“Yangtze Power” China Yangtze Power Co., Limited
Financial Highlights
China Construction Bank CorporationHalf-Year Report 2015 3
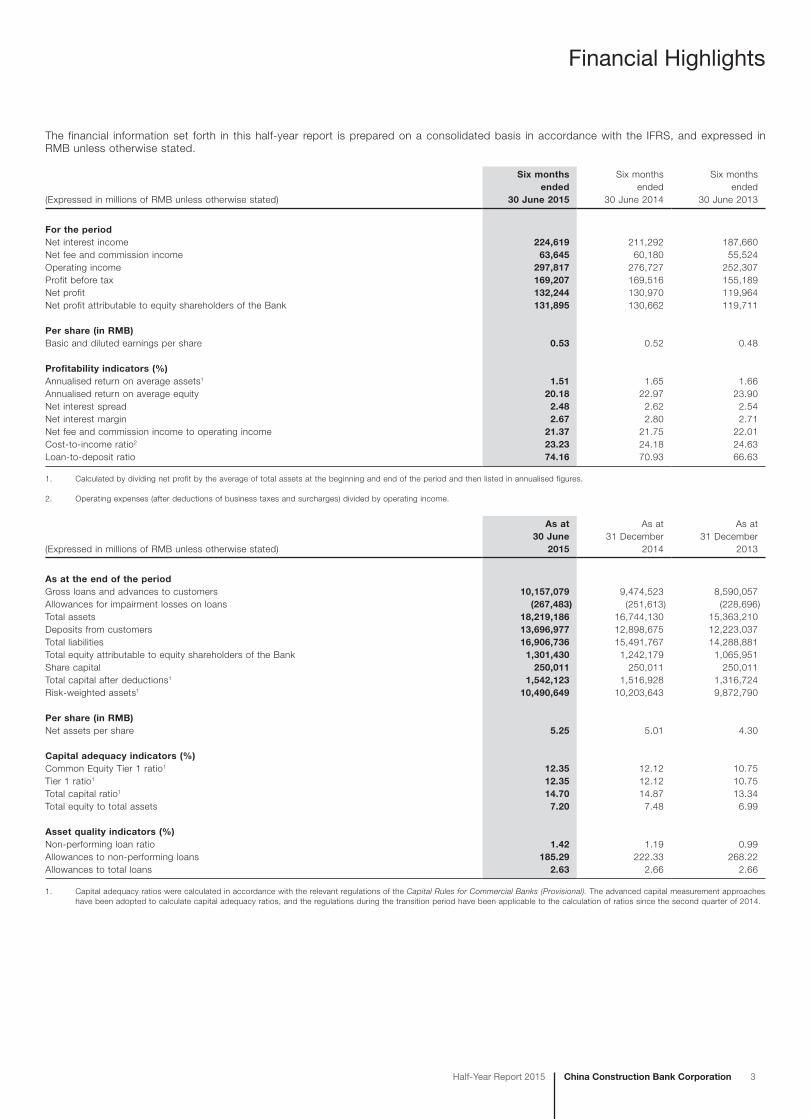
The financial information set forth in this half-year report is prepared on a consolidated basis in accordance with the IFRS, and expressed in RMB unless otherwise stated.
(Expressed in millions of RMB unless otherwise stated)
Six months ended
30 June 2015
Six months ended
30 June 2014
Six months ended
30 June 2013
For the periodNet interest income 224,619 211,292 187,660Net fee and commission income 63,645 60,180 55,524Operating income 297,817 276,727 252,307Profit before tax 169,207 169,516 155,189Net profit 132,244 130,970 119,964Net profit attributable to equity shareholders of the Bank 131,895 130,662 119,711
Per share (in RMB)Basic and diluted earnings per share 0.53 0.52 0.48
Profitability indicators (%)Annualised return on average assets1 1.51 1.65 1.66Annualised return on average equity 20.18 22.97 23.90Net interest spread 2.48 2.62 2.54Net interest margin 2.67 2.80 2.71Net fee and commission income to operating income 21.37 21.75 22.01Cost-to-income ratio2 23.23 24.18 24.63Loan-to-deposit ratio 74.16 70.93 66.63
1. Calculated by dividing net profit by the average of total assets at the beginning and end of the period and then listed in annualised figures.
2. Operating expenses (after deductions of business taxes and surcharges) divided by operating income.
(Expressed in millions of RMB unless otherwise stated)
As at 30 June
2015
As at 31 December
2014
As at 31 December
2013
As at the end of the periodGross loans and advances to customers 10,157,079 9,474,523 8,590,057Allowances for impairment losses on loans (267,483) (251,613) (228,696)Total assets 18,219,186 16,744,130 15,363,210Deposits from customers 13,696,977 12,898,675 12,223,037Total liabilities 16,906,736 15,491,767 14,288,881Total equity attributable to equity shareholders of the Bank 1,301,430 1,242,179 1,065,951Share capital 250,011 250,011 250,011Total capital after deductions1 1,542,123 1,516,928 1,316,724Risk-weighted assets1 10,490,649 10,203,643 9,872,790
Per share (in RMB)Net assets per share 5.25 5.01 4.30
Capital adequacy indicators (%)Common Equity Tier 1 ratio1 12.35 12.12 10.75Tier 1 ratio1 12.35 12.12 10.75Total capital ratio1 14.70 14.87 13.34Total equity to total assets 7.20 7.48 6.99
Asset quality indicators (%)Non-performing loan ratio 1.42 1.19 0.99Allowances to non-performing loans 185.29 222.33 268.22Allowances to total loans 2.63 2.66 2.66
1. Capital adequacy ratios were calculated in accordance with the relevant regulations of the Capital Rules for Commercial Banks (Provisional). The advanced capital measurement approaches have been adopted to calculate capital adequacy ratios, and the regulations during the transition period have been applicable to the calculation of ratios since the second quarter of 2014.
Corporate Information
4 China Construction Bank Corporation Half-Year Report 2015
Legal name and abbreviation in Chinese 中國建設銀行股份有限公司 (abbreviated as “中國建設銀行”)
Legal name and abbreviation in English China Construction Bank Corporation (abbreviated as “CCB”)
Legal representative Wang Hongzhang
Authorised representatives Wang ZujiMa Chan Chi
Secretary to the Board Chen Caihong
Representative of securities affairs Xu Manxia
Company secretary Ma Chan Chi
Qualified accountant Yuen Yiu Leung
Registered address, office address and postcode No. 25, Financial Street, Xicheng District, Beijing 100033
Internet website www.ccb.com
Email address [email protected]
Principal place of business in Hong Kong 28/F, CCB Tower, 3 Connaught Road Central, Central, Hong Kong
Newspapers for information disclosure China Securities Journal and Shanghai Securities News
Website of the Shanghai Stock Exchange for publishing the half-year report prepared in accordance with PRC GAAP
www.sse.com.cn
“HKExnews” website of Hong Kong Stock Exchange for publishing the half-year report prepared in accordance with IFRS
www.hkexnews.hk
Place where copies of this half-year report are kept Board of Directors Office of the Bank
Contact Information Address: No. 25, Financial Street, Xicheng District, BeijingTelephone: 86-10-66215533Facsimile: 86-10-66218888
Listing stock exchanges, stock abbreviations and stock codes
A-share: Shanghai Stock Exchange Stock abbreviation: 建設銀行 Stock code: 601939
H-share: The Stock Exchange of Hong Kong Limited Stock abbreviation: CCB Stock code: 939
China Construction Bank CorporationHalf-Year Report 2015 5
Corporate Information
Date and place of initial registration 17 September 2004State Administration for Industry & Commerce of the People’s Republic of China(Please refer to the H-share Global Offering Prospectus issued by the Bank on Hong Kong Stock Exchange on 14 October 2005 and the A-share Prospectus issued by the Bank on the Shanghai Stock Exchange on 11 September 2007 for more information.)
Date and place of registration change 8 May 2013State Administration for Industry & Commerce of the People’s Republic of China
Registration number of the corporate legal person business licence
100000000039122
Organisation code 10000444-7
Financial licence institution number B0004H111000001
Taxation registration number 京稅證字110102100004447
Certified public accountants PricewaterhouseCoopers Zhong Tian LLPAddress: 11/F, PricewaterhouseCoopers Centre, 202 Hu Bin Road,
ShanghaiSigning accountants: Zhu Yu and Wang WeiPricewaterhouseCoopersAddress: 22/F, Prince’s Building, Central, Hong Kong
Legal advisor as to PRC laws Haiwen & PartnersAddress: 20/F, Fortune Financial Centre, 5 Dong San Huan Central Road,
Chaoyang District, Beijing
Legal advisor as to Hong Kong laws Clifford ChanceAddress: 27/F, Jardine House, One Connaught Place, Central, Hong Kong
A-share registrar China Securities Depository and Clearing Corporation Limited, Shanghai BranchAddress: 36/F, China Insurance Building, 166 East Lujiazui Road,
Pudong New District, Shanghai
H-share registrar Computershare Hong Kong Investor Services LimitedAddress: Rooms 1712-1716, 17/F, Hopewell Centre,
183 Queen’s Road East, Wanchai, Hong Kong
Chairman’s Statement
6 China Construction Bank Corporation Half-Year Report 2015
Dear shareholders,
The first half of 2015 witnessed an uneven and slow recovery of global economy, and further divergent performances in different regions. In the face of mounting downward pressure on China’s economy, the economic growth in certain areas and sectors slowed down dramatically. By virtue of a series of government policies and measures, major economic indicators in the second quarter showed stabilised and positive signs, and driving forces for economic growth were further boosted. Faced with complex domestic and overseas economic situations and fierce competition, the Group persisted in serving the real economy, implementing the transformation and development plans, and strengthening risk prevention and control in full blast. Our key operating indicators performed as expected. In the first half of 2015, the Group’s total assets exceeded RMB18 trillion. Net profit amounted to RMB132.2 billion, an increase of 0.97% over the same period last year. The annualised return on average assets and the annualised return on average equity were 1.51% and 20.18% respectively. Total capital ratio and common equity tier one ratio stood at 14.70% and 12.35% respectively. Our key financial indicators continued to be in the leading position among peers.
We actively supported the real economy and continued to adjust and optimise credit structure. In view of the national major strategies and projects including “One Belt and One Road”, the construction of free trade zones, coordinated development for the Beijing-Tianjin-Hebei region and the construction of Yangtze River Economic Belt, the Group further promoted the adjustments and optimisation of credit structure by supporting major projects, key enterprises and important areas. In the first half of 2015, the loan increase in infrastructure sectors accounted for over 70% of the increase in corporate loans. The Group continued to maintain a leading edge in housing finance. The residential mortgages ranked first among peers in terms of both the balance and the increase, and the market share of financial services for housing reform continuously exceeded 50%. The Group actively supported the loan demand in areas with strong growth potential. Loans to areas such as small and micro businesses, agriculture-related sectors and urbanisation development maintained rapid growth. The Group provided customers with more convenient financing services with the help of internet technology, and strictly controlled the loans to local government financing vehicles and industries with excess capacity by continuously reducing existing loans.
We made a good start in transformation and development, with benefits gradually unfolding themselves. New progress of transformation and development was achieved in many important areas, as benefits gradually unfolded themselves. The Group further enhanced the comprehensive service abilities by constantly optimising product supply, functional facilities and service models at branches and sub-branches; further upgraded service functions and efficiency by building and improving the cross-region, cross-business line and cross-border collaborative response mechanism as well as cross-time-zone non-stop services among the head office and branches. As a result, major indicators of key businesses, products, and channels targeted for overall business transformation grew at a remarkably faster speed than traditional businesses, and separation between the bank counters and back offices was pressed ahead in an orderly manner. The Group made new breakthroughs in “e.ccb.com” e-commerce platform, mobile banking, as well as innovation of products and operating models based on internet and information technology. Important progress was made in the “New Generation Core Banking System”, big data research and application as well as international expansion.
We basically formed an integrated operation system and accelerated the expansion of overseas network. The Group basically established an integrated banking group framework to provide services in areas including fund, leasing, trust, insurance and futures. Integrated financial services capability, based on banking businesses and supplemented by non-banking financial businesses, was gradually formed to provide customers with integrated cross-market, cross-sector and cross-border financial services. At the end of June 2015, total assets of the Group’s integrated operation subsidiaries reached RMB242.4 billion, an increase of 27.91% over the end of last year. Net profit increased by 47.62% over the same period last year to RMB2,160 million. In the first half of 2015, the Group rapidly expanded its overseas network. Paris Branch, Amsterdam Branch, Barcelona Branch and Milan Branch under CCB Europe opened for business simultaneously in June. Chile Branch obtained the banking license and was designated as the RMB clearing bank in Chile. London Branch officially commenced business operation. Applications and preparations for the establishment of institutions including Zurich Branch and a subsidiary bank in Malaysia were pushed forward. By the end of June 2015, the Group has established 26 tier-one institutions in 24 countries and regions.
China Construction Bank CorporationHalf-Year Report 2015 7
Chairman’s Statement
We intensified risk management and control, and kept asset quality controlled within expectations. In the first half of 2015, the Group further strengthened risk management and control, reinforced internal control and compliance and audit practices, carried out “Year of Compliance Management” campaign, intensified internal audit over key risk areas, and identified and mended loopholes in systems and processes. The Group promoted professional credit approval by setting up centralised loan review and disbursement centres at tier-one branches and establishing intensive and professional risk control mechanism in the process of credit approval. The Group optimised policies and approval processes for disposal of non-performing loans (NPLs), enhanced risk mitigation and disposal, and NPLs were controlled within expectations. In the first half of 2015, the Group firmly held the bottom line to prevent systematic and regional risks, and the overall risk profile of the Group was kept at a stable and controllable level. The NPL ratio was 1.42%, the ratio of allowances to NPLs was 185.29%, and the ratio of allowances to total loans was 2.63%.
We were unswervingly committed to corporate social responsibilities and proactively contributed to the society. The Group constantly participated in donation and social welfare activities in areas including education, medical and health care, poverty alleviation and environmental protection. Since listing, the Group has successively developed and implemented 106 important public welfare projects and has donated accumulatively RMB780 million. We vigorously promoted green credit, organically integrated low carbon solutions, energy saving and environmental protection targets into our credit policy and business philosophy, and supported the country’s ecological civilisation construction. We actively participated in international organisation activities including APEC Business Advisory Council, B20 of G20 Summit, World Economic Forum (Davos) and Boao Forum for Asia, extensively communicated with representatives from various economies and business communities, presented a good corporate image for the Group and the business community of China, supported national strategic development, and made active efforts in promoting economic and financial collaborations in the Asia-Pacific region and among major economic regions around the world.
In the first half of 2015, the Group’s good performance in various aspects gained wide recognition from the market and community. We received more than 40 accolades from renowned organisations both at home and abroad, including the second place again in the “Top 1000 World Banks” published by The Banker in terms of total tier-one capital; the second place again in “Global 2000” published by Forbes; the 29th place in “Fortune Global 500” published by Fortune, advancing by nine places over last year; the award of the “Best Bank in China 2015” by Global Finance, and two comprehensive awards, namely the “Best Social Responsible Financial Institution Award” and the “Best Livelihood Finance Award in Social Responsibility of the Year” by China Banking Association.
In the first half of 2015, the Group experienced some adjustments and changes to the composition of the Board members. Mr. Zhang Jianguo, Mr. Zhu Hongbo and Mr. Hu Zheyi successively ceased to serve in their positions; Mr. Wang Zuji, Mr. Pang Xiusheng and Mr. Zhang Gengsheng were elected executive directors, and Mr. Li Jun and Ms. Hao Aiqun were elected non-executive directors at the 2014 annual general meeting. On behalf of the Board, I would like to take this opportunity to express sincere gratitude to Mr. Zhang Jianguo, Mr. Zhu Hongbo and Mr. Hu Zheyi for their contributions to the Group, and extend cordial welcome to Mr. Wang Zuji and other new directors.
In the second half of 2015, we will continue to proactively adapt ourselves to the new normal, further deepen the reform, comprehensively promote transformation and development, and cultivate new driving forces for development, so as to gain new competitive edges, and strive to achieve our stated goals of transformation and development.
Wang HongzhangChairman and executive director
28 August 2015
President’s Report
8 China Construction Bank Corporation Half-Year Report 2015
Dear shareholders,
In the first half of 2015, against the backdrop of severe economic and financial situations, the Group persisted in stable operation, continuously reinforced development foundation, promoted comprehensive business transformation, and maintained a good development momentum as a result of constantly released endogenous power.
Expected Business Performance
At the end of June, the Group’s total assets increased by 8.81% to RMB18,219.2 billion over the end of last year. Gross loans and advances to customers increased by 7.20% to RMB10,157.1 billion; deposits from customers rose by 6.19% to RMB13,697 billion. Net profit increased by 0.97% year-on-year to RMB132.2 billion. Operating income increased by 7.62% year-on-year to RMB297.8 billion. In this amount, net interest income increased by 6.31% year-on-year, and net fee and commission income increased by 5.76% year-on-year. Cost-to-income ratio stood at 23.23%, a year-on-year decrease of 0.95 percentage points. The total capital ratio was 14.70%, leading the market among peers.
Steadily improved service capability
The Group established a comprehensive financial service platform, to coordinate the development between direct and indirect financing, and continuously satisfy the diversified and personalised financial needs of customers. Drawing on its traditional competitive edges, the Group comprehensively supported the state’s major strategies and key construction projects, and established convenient procedures and green channels to accelerate credit approval and granting. Loans to infrastructure sectors increased by RMB147.8 billion, accounting for 73.98% of the increase in corporate loans. The Group vigorously promoted domestic and overseas collaborative services, to meet the financial needs arising from upgraded “Going Global” and international production capacity cooperation. The Group strengthened financial services to small and micro businesses by adopting big data in the innovative service model of micro-credit loans and building credit support platforms for small and micro businesses through cooperation with governments at various levels. Loans granted through “Credit Cooperation Loan”, a key product, exceeded RMB30 billion, and the availability rate of loan applications of small and micro enterprises was 84%. With the expansion of cooperation with platforms for internet banking, the accumulated amount of loans granted to internet banking business exceeded RMB150 billion, extending to over 17,000 customers. The Group strove to meet the housing demands of general residents, with residential mortgages increasing by 9.61% to RMB2,470.4 billion, ranking first in the market in terms of both the increase and the balance.
New progress in transformation and development
Contribution from retail business was on the rise. The proportion of profit before tax contributed by personal banking business increased by 3.48 percentage points to 32.56% year-on-year. More specifically, core business indicators of credit card business, including the number of new cards issued, the number of new customers, the number of consumer transactions as well as asset quality, continued to lead the market among peers. The number of private banking customers with financial assets above RMB10 million grew by 12.32%, and the total amount of customers’ financial assets increased by 20.79%. In active response to customers’ demands in financial services for housing reform, the Group was entrusted to grant personal provident housing fund loans with a balance of RMB1,298,199 million. Due to the rapid growth in businesses including personal wealth management, agency fund sales and precious metals business, net fee and commission income from personal banking business increased by 19.50% year-on-year.
The international business maintained a sound growth momentum. The Group promoted the building of multi-functional marketing service platforms, prepared to establish the overseas capital platform, overseas project information management platform and overseas approval centre, and propelled the centralisation of clearing business of overseas institutions and the global expansion of overseas network. In the first half of 2015, international settlement volume amounted to US$607.9 billion, a year-on-year increase of 8.70%; the accumulated cross-border RMB settlement volume on the cash basis reached RMB834.1 billion, a year-on-year increase of 17.38%. The coverage of RMB clearing network expanded to 43 countries and regions.
China Construction Bank CorporationHalf-Year Report 2015 9
President’s Report
Key businesses in transformation developed rapidly. At the end of June, the accumulated underwriting volume of debt financing instruments for non-financial enterprises was RMB237,476 million, ranking first among peers. The Group also led the market in terms of both the total number of securities investment funds under custody and the number of new funds under custody, and became the only bank among the first entities qualified as mainland sales agent for Hong Kong funds. The market share of strategic products including multi-model cash pool, bank notes pool and UnionPay corporate settlement card was constantly expanded, and the market influence of its treasury management service branded as “Yudao” was further promoted. It ranked first among peers in terms of the number of customers of the central finance authorised payment and non-tax revenue collection agency service, and it was the first one among peers to pilot electronic online central non-tax revenue collection under the requirements of the MOF. The number of “Xincunguan” customers whose securities deposits were managed by the Bank as a third party totalled 30.76 million, and assets under management amounted to RMB741,741 million, both ranking first among peers.
Solid and effective risk management and control
In response to periodic adjustments and structural changes in economy, the Group maintained relatively stable asset quality by firmly mitigating risks in a stable way in the course of development, strengthening risk pre-warning and pre-control and routine management, constantly conducting risk screening and elimination in high-risk areas, and reinforcing the disposal of NPLs. At the end of June, the Group’s NPL ratio was 1.42%, up by 0.23 percentage points over the end of last year; and the ratio of allowances to NPLs maintained at a high level of 185.29%. The Group earnestly mitigated risk exposures of the risky projects, intensified risk pre-warning and pre-control, carried out multi-dimensional risk stress tests on the macro economy, real estate industry, financial stability and so on, and relied on big data to conduct rapid screening and issue classified early warning towards customers with potential risks. Drawing on lessons from previous risk cases, the Group analysed the weaknesses of risk internal control to identify and mend loopholes in the system. It promoted professional credit approval by setting up centralised loan review and disbursement centres at tier-one branches to strengthen control over weaknesses in the loan disbursement and approval process. The Group actively explored new models of market-driven risk disposal, and worked out plans for collaborative disposal of non-performing assets with subsidiaries and restructuring of assets securitisation. Meanwhile, through the “Year of Compliance Management” campaign, the Group pressed ahead with the transformation of its internal control and compliance practices, and adopted the new mechanism of “vertically promoting system building and horizontally reinforcing compliance and internal control”. As a result, all market risk indicators were controlled within the limits, and the Group maintained adequate liquidity reserve and kept reserve ratio at a reasonable level.
Reinforced fundamental structure
We promoted the coordinated development of physical and electronic channels. The Channel and Operation Management Department was set up at the head office to promote channel integration in an all-round way. As new progress was achieved in the implementation of “three integrations” at outlets, the number of integrated outlets totalled 14,400, the number of integrated marketing teams amounted to 19,934, and the proportion of integrated tellers reached 84%. Customers can enjoy convenient and comfortable “one-stop” services at the transformed outlets. With intensified efforts in building electronic banking as its main channel and strongly supporting the comprehensive transformation of physical channels, the ratio of the number of accounting transactions through electronic banking and self-service channels to the total number of accounting transactions through various channels rose to 94.32%, up by 6.29 percentage points over the end of last year. The number of personal online banking customers, corporate online banking customers and mobile banking customers increased by 8.19%, 10.78% and 11.47%, respectively. The “e.ccb.com” website introduced its exquisite mobile platform by formally launching the mobile APP of retail mall, i.e., “CCB e-commerce Mall”.
Functions of the “New Generation Core Banking System” were gradually released. Following the successful launch of 13 application projects in Phase I, the first batch of 27 projects in Phase II were successfully rolled out. The Bank introduced new services such as smart mobile assistance, multi-channel business reservation, and pre-filling of forms, and took the lead in expanding mobile financial service channels including WeChat, Credulity and Alipay Wallet. The Bank became the first bank to support fund custodian services on the “National Equities Exchange and Quotations” and Shanghai-Hong Kong Stock Connect, and continued to increase financial market and corporate treasury management offerings. The Bank enriched risk measurement models and launched the risk measurement central engine, significantly improving capabilities in risk internal controls, employee services and managerial analysis.
10 China Construction Bank Corporation Half-Year Report 2015
President’s Report
Prospects
In the second half of 2015, the macro economic situation both at home and abroad will remain complex. By seizing new opportunities arising from the “new normal”, the Group will remain committed to providing financial services to support the implementation of national major strategies, optimising its financial service models, increasing support to areas including small and micro businesses, agriculture-related loans and personal consumption, and bolstering its competitive edges in residential mortgages and financial services for housing reform. Leveraging on its network service, the Group will accelerate the innovation of payment and settlement as well as treasury management products, strengthen initiative liability management and expand reliable and stable funding sources. The Group will actively push forward comprehensive pricing for customers to further improve its pricing capability. With equal emphases on providing financing solutions and consultancy and advisory services for customers, the Group will endeavour to enhance its service capability in fee-based business, and accelerate the development of asset management and custodial businesses. Adhering to the “customer-centric” business concept, the Group will speed up product innovation and system development. It will strive to maintain stable asset quality while firmly holding the risk bottom line, so as to accomplish the business plan for the year.
Lastly, I would like to sincerely thank the Board and the Board of Supervisors for their tremendous support, as well as our customers for their trust and our staff for their great dedication.
Wang ZujiVice chairman, executive director and president
28 August 2015

Management Discussion and Analysis
China Construction Bank CorporationHalf-Year Report 2015 11
Financial Review
In the first half of 2015, the global economy maintained a good development momentum on the whole, whereas complexity and differentiation remained the main characteristics of the world economy. The US economy continued its moderate recovery. The Euro zone economy exhibited multiple positive signs, while Greek debt crisis negatively affected the economic and financial stability in the zone. Japanese economy gradually picked up with future prospect still subject to further observation. Some emerging economies witnessed economic slowdown and increasing fluctuations in the financial market.
Chinese economy operated within an appropriate range, as witnessed by further deepened structural adjustments and invigorated development vitality. The contribution of consumption toward economic growth was on the rise, investment in infrastructure grew rapidly and trade surplus continued to increase. The prudent monetary policy gradually produced the desired effect, demonstrated by the adequate liquidity in the banking system, rapid yet steady growth in the supply of money and credit, constantly improved loan structure, remarkably decreased interest rate and approximately steady RMB exchange rate. The reform of interest rate liberalisation progressed orderly. The floating range of RMB deposit interest rate was expanded to 1.5 times of the benchmark rate, and large-denomination certificates of deposit (CD) were launched for both corporate and personal customers.
The Group closely monitored the trend of domestic and foreign economic development and changes in macro policies, insisted on transformation and development and sound operation, strengthened risk prevention and control, and timely adjusted operation strategies, to ensure steady development of businesses and stable asset quality.
Statement of Comprehensive Income Analysis
In the first half of 2015, the Group recorded net profit of RMB132,244 million and net profit attributable to equity shareholders of the Bank of RMB131,895 million, up by 0.97% and 0.94% respectively over the same period last year. The steady growth of the Group’s profitability was mainly due to the following factors: First, the interest-earning assets increased moderately, pushing up net interest income by RMB13,327 million, or 6.31% compared to the same period in 2014. Second, the Group actively explored customers and strengthened product innovation, constantly improving the comprehensive service abilities. Net fee and commission income increased by RMB3,465 million, or 5.76% over the same period last year. Third, the Group further improved its cost management and optimised its expenses structure. Cost-to-income ratio fell by 0.95 percentage points to 23.23% compared with the same period last year. In addition, the Group made prudent and sufficient provisions for impairment losses on loans and advances to customers. The expense on impairment losses was RMB41,249 million, up by 78.40% compared to the same period in 2014.
The following table sets forth the composition of the Group’s statement of comprehensive income and the changes during the respective periods.
(In millions of RMB, except percentages)
Six months ended
30 June 2015
Six months ended
30 June 2014 Change (%)
Net interest income 224,619 211,292 6.31Net non-interest income 73,198 65,435 11.86– Net fee and commission income 63,645 60,180 5.76
Operating income 297,817 276,727 7.62Operating expenses (87,429) (84,139) 3.91Impairment losses (41,249) (23,122) 78.40Share of profits less losses of associates and joint ventures 68 50 36.00
Profit before tax 169,207 169,516 (0.18)Income tax expense (36,963) (38,546) (4.11)
Net profit 132,244 130,970 0.97Other comprehensive income for the period, net of tax 2,870 16,441 (82.54)
Total comprehensive income for the period 135,114 147,411 (8.34)
12 China Construction Bank Corporation Half-Year Report 2015
Management Discussion and Analysis
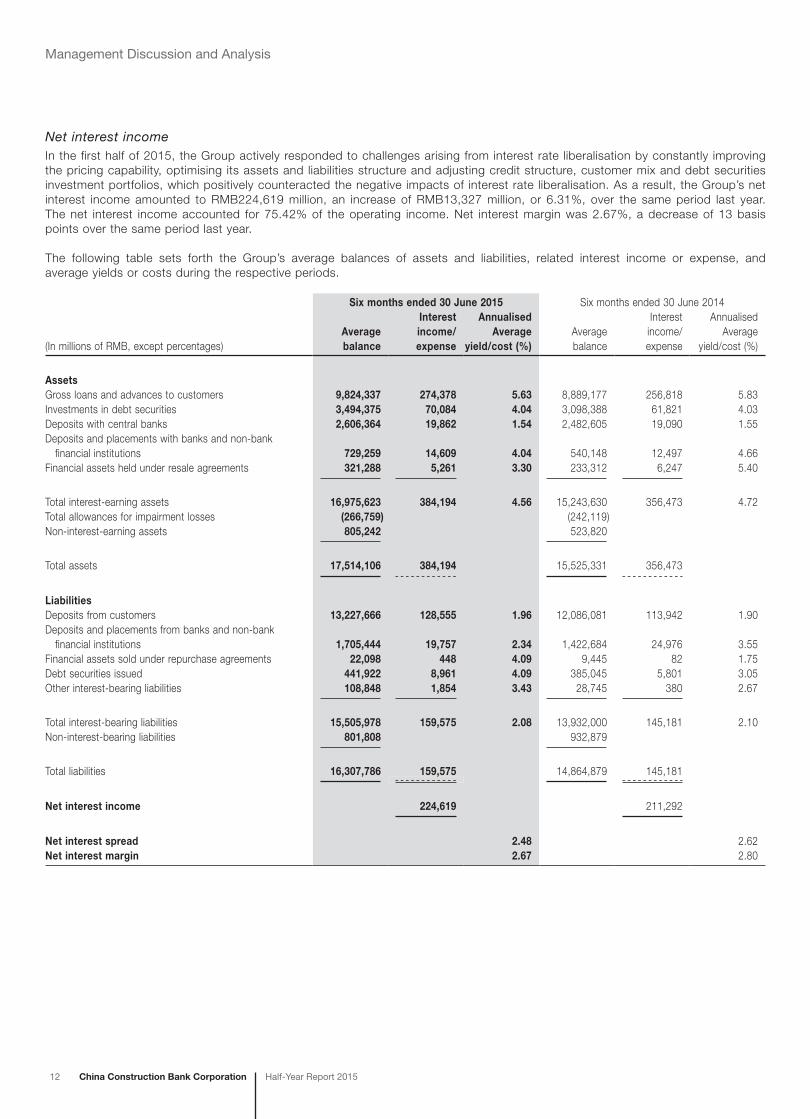
Net interest incomeIn the first half of 2015, the Group actively responded to challenges arising from interest rate liberalisation by constantly improving the pricing capability, optimising its assets and liabilities structure and adjusting credit structure, customer mix and debt securities investment portfolios, which positively counteracted the negative impacts of interest rate liberalisation. As a result, the Group’s net interest income amounted to RMB224,619 million, an increase of RMB13,327 million, or 6.31%, over the same period last year. The net interest income accounted for 75.42% of the operating income. Net interest margin was 2.67%, a decrease of 13 basis points over the same period last year.
The following table sets forth the Group’s average balances of assets and liabilities, related interest income or expense, and average yields or costs during the respective periods.
Six months ended 30 June 2015 Six months ended 30 June 2014
(In millions of RMB, except percentages)Average balance
Interest income/expense
Annualised Average
yield/cost (%)Average balance
Interest income/expense
Annualised Average
yield/cost (%)
AssetsGross loans and advances to customers 9,824,337 274,378 5.63 8,889,177 256,818 5.83Investments in debt securities 3,494,375 70,084 4.04 3,098,388 61,821 4.03Deposits with central banks 2,606,364 19,862 1.54 2,482,605 19,090 1.55Deposits and placements with banks and non-bank financial institutions 729,259 14,609 4.04 540,148 12,497 4.66Financial assets held under resale agreements 321,288 5,261 3.30 233,312 6,247 5.40
Total interest-earning assets 16,975,623 384,194 4.56 15,243,630 356,473 4.72Total allowances for impairment losses (266,759) (242,119)Non-interest-earning assets 805,242 523,820
Total assets 17,514,106 384,194 15,525,331 356,473
LiabilitiesDeposits from customers 13,227,666 128,555 1.96 12,086,081 113,942 1.90Deposits and placements from banks and non-bank financial institutions 1,705,444 19,757 2.34 1,422,684 24,976 3.55Financial assets sold under repurchase agreements 22,098 448 4.09 9,445 82 1.75Debt securities issued 441,922 8,961 4.09 385,045 5,801 3.05Other interest-bearing liabilities 108,848 1,854 3.43 28,745 380 2.67
Total interest-bearing liabilities 15,505,978 159,575 2.08 13,932,000 145,181 2.10Non-interest-bearing liabilities 801,808 932,879
Total liabilities 16,307,786 159,575 14,864,879 145,181
Net interest income 224,619 211,292
Net interest spread 2.48 2.62Net interest margin 2.67 2.80
China Construction Bank CorporationHalf-Year Report 2015 13
Management Discussion and Analysis
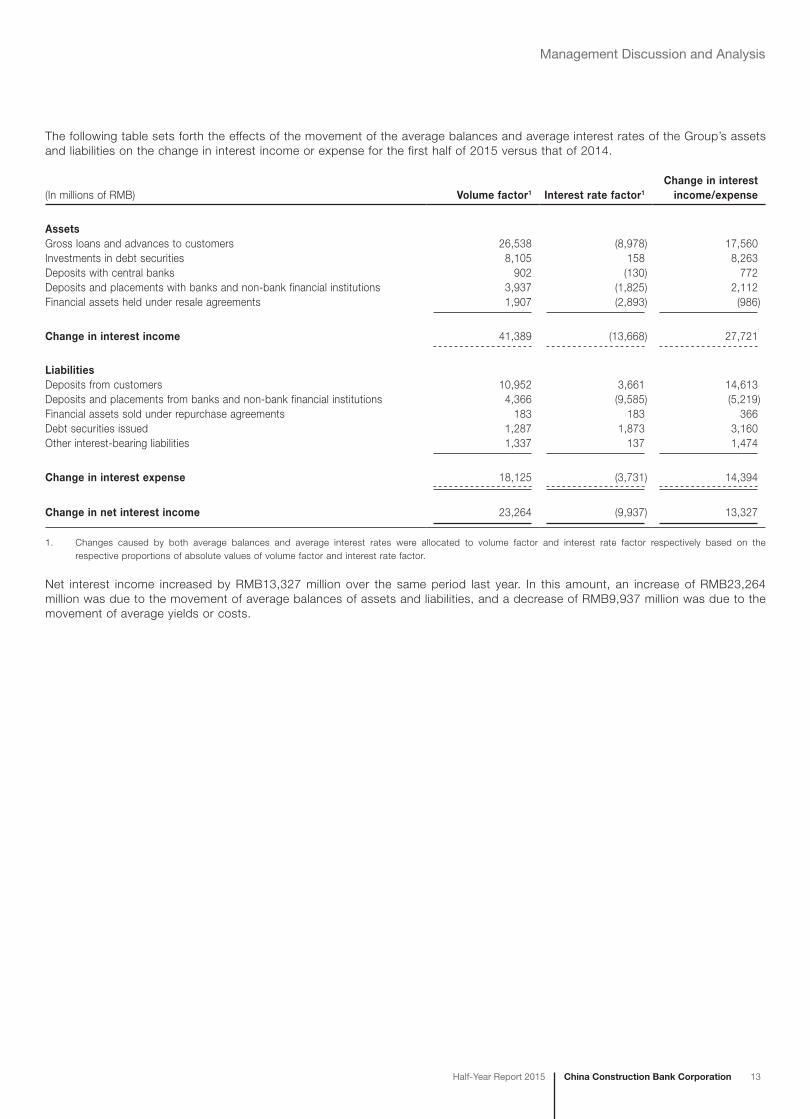
The following table sets forth the effects of the movement of the average balances and average interest rates of the Group’s assets and liabilities on the change in interest income or expense for the first half of 2015 versus that of 2014.
(In millions of RMB) Volume factor1 Interest rate factor1
Change in interest income/expense
AssetsGross loans and advances to customers 26,538 (8,978) 17,560Investments in debt securities 8,105 158 8,263Deposits with central banks 902 (130) 772Deposits and placements with banks and non-bank financial institutions 3,937 (1,825) 2,112Financial assets held under resale agreements 1,907 (2,893) (986)
Change in interest income 41,389 (13,668) 27,721
LiabilitiesDeposits from customers 10,952 3,661 14,613Deposits and placements from banks and non-bank financial institutions 4,366 (9,585) (5,219)Financial assets sold under repurchase agreements 183 183 366Debt securities issued 1,287 1,873 3,160Other interest-bearing liabilities 1,337 137 1,474
Change in interest expense 18,125 (3,731) 14,394
Change in net interest income 23,264 (9,937) 13,327
1. Changes caused by both average balances and average interest rates were allocated to volume factor and interest rate factor respectively based on the respective proportions of absolute values of volume factor and interest rate factor.
Net interest income increased by RMB13,327 million over the same period last year. In this amount, an increase of RMB23,264 million was due to the movement of average balances of assets and liabilities, and a decrease of RMB9,937 million was due to the movement of average yields or costs.
14 China Construction Bank Corporation Half-Year Report 2015
Management Discussion and Analysis
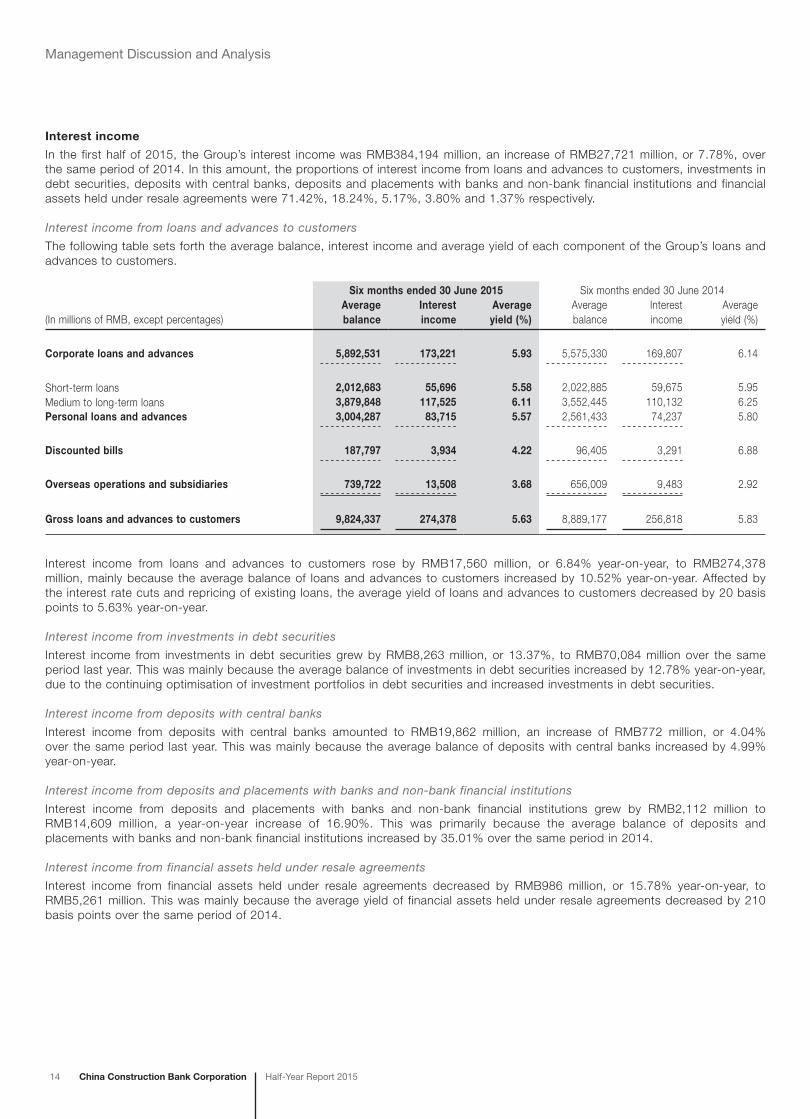
Interest income
In the first half of 2015, the Group’s interest income was RMB384,194 million, an increase of RMB27,721 million, or 7.78%, over the same period of 2014. In this amount, the proportions of interest income from loans and advances to customers, investments in debt securities, deposits with central banks, deposits and placements with banks and non-bank financial institutions and financial assets held under resale agreements were 71.42%, 18.24%, 5.17%, 3.80% and 1.37% respectively.
Interest income from loans and advances to customers
The following table sets forth the average balance, interest income and average yield of each component of the Group’s loans and advances to customers.
Six months ended 30 June 2015 Six months ended 30 June 2014
(In millions of RMB, except percentages)Average balance
Interest income
Average yield (%)
Average balance
Interest income
Average yield (%)
Corporate loans and advances 5,892,531 173,221 5.93 5,575,330 169,807 6.14
Short-term loans 2,012,683 55,696 5.58 2,022,885 59,675 5.95Medium to long-term loans 3,879,848 117,525 6.11 3,552,445 110,132 6.25Personal loans and advances 3,004,287 83,715 5.57 2,561,433 74,237 5.80
Discounted bills 187,797 3,934 4.22 96,405 3,291 6.88
Overseas operations and subsidiaries 739,722 13,508 3.68 656,009 9,483 2.92
Gross loans and advances to customers 9,824,337 274,378 5.63 8,889,177 256,818 5.83
Interest income from loans and advances to customers rose by RMB17,560 million, or 6.84% year-on-year, to RMB274,378 million, mainly because the average balance of loans and advances to customers increased by 10.52% year-on-year. Affected by the interest rate cuts and repricing of existing loans, the average yield of loans and advances to customers decreased by 20 basis points to 5.63% year-on-year.
Interest income from investments in debt securities
Interest income from investments in debt securities grew by RMB8,263 million, or 13.37%, to RMB70,084 million over the same period last year. This was mainly because the average balance of investments in debt securities increased by 12.78% year-on-year, due to the continuing optimisation of investment portfolios in debt securities and increased investments in debt securities.
Interest income from deposits with central banks
Interest income from deposits with central banks amounted to RMB19,862 million, an increase of RMB772 million, or 4.04% over the same period last year. This was mainly because the average balance of deposits with central banks increased by 4.99% year-on-year.
Interest income from deposits and placements with banks and non-bank financial institutions
Interest income from deposits and placements with banks and non-bank financial institutions grew by RMB2,112 million to RMB14,609 million, a year-on-year increase of 16.90%. This was primarily because the average balance of deposits and placements with banks and non-bank financial institutions increased by 35.01% over the same period in 2014.
Interest income from financial assets held under resale agreements
Interest income from financial assets held under resale agreements decreased by RMB986 million, or 15.78% year-on-year, to RMB5,261 million. This was mainly because the average yield of financial assets held under resale agreements decreased by 210 basis points over the same period of 2014.

China Construction Bank CorporationHalf-Year Report 2015 15
Management Discussion and Analysis
Interest expense
In the first half of 2015, the Group’s interest expense was RMB159,575 million, a year-on-year increase of RMB14,394 million, or 9.91%.
Interest expense on deposits from customers
The following table sets forth the average balance, interest expense and average cost of each component of the Group’s deposits from customers during the respective periods.
Six months ended 30 June 2015 Six months ended 30 June 2014
(In millions of RMB, except percentages)Average balance
Interest expense
Average cost (%)
Average balance
Interest expense
Average cost (%)
Corporate deposits 6,695,242 59,326 1.79 6,214,771 55,888 1.81
Demand deposits 3,835,815 14,418 0.76 3,676,242 13,601 0.75Time deposits 2,859,427 44,908 3.14 2,538,529 42,287 3.34Personal deposits 6,126,074 64,867 2.14 5,567,911 55,265 2.00
Demand deposits 2,283,485 4,008 0.35 2,422,319 4,456 0.36Time deposits 3,842,589 60,859 3.17 3,145,592 50,809 3.24Overseas operations and subsidiaries 406,350 4,362 2.16 303,399 2,789 1.86
Total deposits from customers 13,227,666 128,555 1.96 12,086,081 113,942 1.90
Interest expense on deposits from customers amounted to RMB128,555 million, representing an increase of RMB14,613 million, or 12.82%, over the same period of 2014, mainly because the average balance of deposits from customers rose by 9.45% year-on-year. The average cost increased by six basis points to 1.96% over the same period last year, mainly because the proportion of rising interest rates of deposits from customers increased with the deepening of interest rate liberalisation.
Interest expense on deposits and placements from banks and non-bank financial institutions
Interest expense on deposits and placements from banks and non-bank financial institutions reached RMB19,757 million, a decrease of RMB5,219 million, or 20.90%, over the same period in 2014, largely because the average cost of deposits and placements from banks and non-bank financial institutions decreased by 121 basis points over the same period last year.
Interest expense on financial assets sold under repurchase agreements
Interest expense on financial assets sold under repurchase agreements increased by RMB366 million or 446.34% year-on-year to RMB448 million. This was primarily because the average balance of financial assets sold under repurchase agreements increased by 133.97% and the average cost increased by 234 basis points to 4.09% over the same period last year.
16 China Construction Bank Corporation Half-Year Report 2015
Management Discussion and Analysis
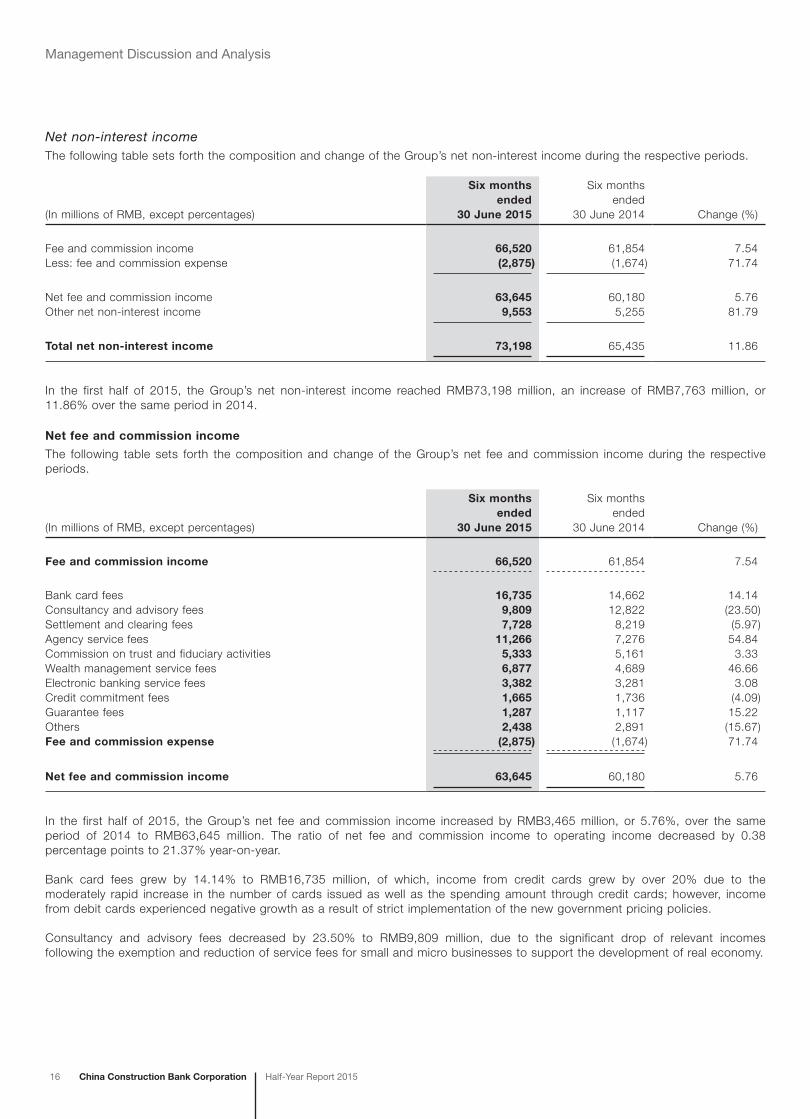
Net non-interest incomeThe following table sets forth the composition and change of the Group’s net non-interest income during the respective periods.
(In millions of RMB, except percentages)
Six months ended
30 June 2015
Six months ended
30 June 2014 Change (%)
Fee and commission income 66,520 61,854 7.54Less: fee and commission expense (2,875) (1,674) 71.74
Net fee and commission income 63,645 60,180 5.76Other net non-interest income 9,553 5,255 81.79
Total net non-interest income 73,198 65,435 11.86
In the first half of 2015, the Group’s net non-interest income reached RMB73,198 million, an increase of RMB7,763 million, or 11.86% over the same period in 2014.
Net fee and commission income
The following table sets forth the composition and change of the Group’s net fee and commission income during the respective periods.
(In millions of RMB, except percentages)
Six months ended
30 June 2015
Six months ended
30 June 2014 Change (%)
Fee and commission income 66,520 61,854 7.54
Bank card fees 16,735 14,662 14.14Consultancy and advisory fees 9,809 12,822 (23.50)Settlement and clearing fees 7,728 8,219 (5.97)Agency service fees 11,266 7,276 54.84Commission on trust and fiduciary activities 5,333 5,161 3.33Wealth management service fees 6,877 4,689 46.66Electronic banking service fees 3,382 3,281 3.08Credit commitment fees 1,665 1,736 (4.09)Guarantee fees 1,287 1,117 15.22Others 2,438 2,891 (15.67)Fee and commission expense (2,875) (1,674) 71.74
Net fee and commission income 63,645 60,180 5.76
In the first half of 2015, the Group’s net fee and commission income increased by RMB3,465 million, or 5.76%, over the same period of 2014 to RMB63,645 million. The ratio of net fee and commission income to operating income decreased by 0.38 percentage points to 21.37% year-on-year.
Bank card fees grew by 14.14% to RMB16,735 million, of which, income from credit cards grew by over 20% due to the moderately rapid increase in the number of cards issued as well as the spending amount through credit cards; however, income from debit cards experienced negative growth as a result of strict implementation of the new government pricing policies.
Consultancy and advisory fees decreased by 23.50% to RMB9,809 million, due to the significant drop of relevant incomes following the exemption and reduction of service fees for small and micro businesses to support the development of real economy.
China Construction Bank CorporationHalf-Year Report 2015 17
Management Discussion and Analysis
Settlement and clearing fees decreased by 5.97% to RMB7,728 million, mainly due to the downshift of standard rates for certain settlement services, compared with the same period last year, as a result of strict implementation of the new government pricing policies.
Agency service fees increased by 54.84% to RMB11,266 million. It was mainly because businesses such as agency fund sales and bancassurance grew well.
Commission on trust and fiduciary activities increased by 3.33% to RMB5,333 million. In this amount, securities investment funds under custody increased at a moderately fast pace in terms of both size and income, and the traditionally advantageous businesses such as financial services for housing reform grew steadily.
Wealth management service fees increased by 46.66% to RMB6,877 million. It was mainly because the size and proportion of higher-yield assets increased compared with the same period last year, due to the Group’s optimisation of the allocation and structure of its wealth management assets.
Electronic banking service fees grew by 3.08% to RMB3,382 million. Despite the relatively rapid growth of the transaction volume through electronic channels, relevant incomes increased in a limited manner due to the proactive downshift of standard rates for certain electronic banking services in view of the new government pricing policies.
Going forward, the Group will remain focused on product innovation and delivering better services, continue to expand its customer base and business volume and further improve customer experience by paying close attention to market changes and business opportunities, so as to maintain the steady growth of its fee and commission income.
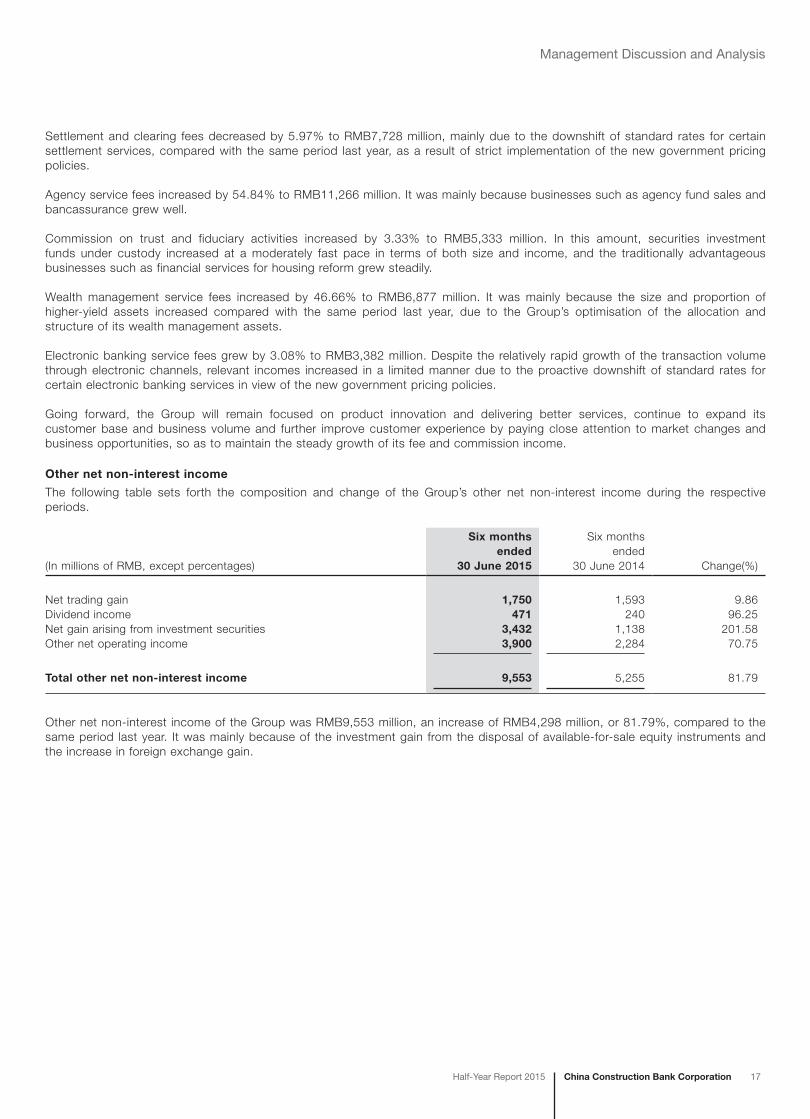
Other net non-interest income
The following table sets forth the composition and change of the Group’s other net non-interest income during the respective periods.
(In millions of RMB, except percentages)
Six months ended
30 June 2015
Six months ended
30 June 2014 Change(%)
Net trading gain 1,750 1,593 9.86Dividend income 471 240 96.25Net gain arising from investment securities 3,432 1,138 201.58Other net operating income 3,900 2,284 70.75
Total other net non-interest income 9,553 5,255 81.79
Other net non-interest income of the Group was RMB9,553 million, an increase of RMB4,298 million, or 81.79%, compared to the same period last year. It was mainly because of the investment gain from the disposal of available-for-sale equity instruments and the increase in foreign exchange gain.

18 China Construction Bank Corporation Half-Year Report 2015
Management Discussion and Analysis
Operating expensesThe following table sets forth the composition of the Group’s operating expenses during the respective periods.
(In millions of RMB, except percentages)
Six months ended
30 June 2015
Six months ended
30 June 2014
Staff costs 40,861 38,957Premises and equipment expenses 14,727 13,760Business taxes and surcharges 18,234 17,231Others 13,607 14,191
Total operating expenses 87,429 84,139
Cost-to-income ratio 23.23% 24.18%
In the first half of 2015, the Group enhanced cost management, and optimised expenses structure. Cost-to-income ratio fell by 0.95 percentage points to 23.23% year-on-year. The Group’s operating expenses were RMB87,429 million, a year-on-year increase of RMB3,290 million, or 3.91%. In this amount, staff costs were RMB40,861 million, a year-on-year increase of RMB1,904 million, or 4.89%. Premises and equipment expenses were RMB14,727 million, a year-on-year increase of RMB967 million, or 7.03%. Other operating expenses were RMB13,607 million, a year-on-year decrease of RMB584 million or 4.12%, which was mainly due to the decrease of administrative and operating expenses following strengthened control over key expenditure items.
Impairment lossesThe following table sets forth the composition of the Group’s impairment losses during respective periods.
(In millions of RMB)
Six months ended
30 June 2015
Six months ended
30 June 2014
Loans and advances to customers 40,441 21,286
Investments (141) 421
Available-for-sale financial assets (320) 17Held-to-maturity investments 172 320Receivables 7 84Others 949 1,415
Total impairment losses 41,249 23,122
In the first half of 2015, the Group’s impairment losses were RMB41,249 million, an increase of RMB18,127 million year-on-year. In this amount, impairment losses on loans and advances to customers were RMB40,441 million, an increase of RMB19,155 million year-on-year. Impairment losses on investments were reversed at an amount of RMB141 million, a decrease of RMB562 million over the same period last year.
Income tax expenseIn the first half of 2015, the Group’s income tax expense was RMB36,963 million, down by RMB1,583 million over the same period last year. This was mainly due to the increase of tax-exempt interest income from the PRC government bonds as well as the decrease of income tax adjustments carried forward from previous years compared with the same period last year. The effective income tax rate was 21.84%, lower than the statutory rate of 25%.
China Construction Bank CorporationHalf-Year Report 2015 19
Management Discussion and Analysis
Statement of Financial Position Analysis
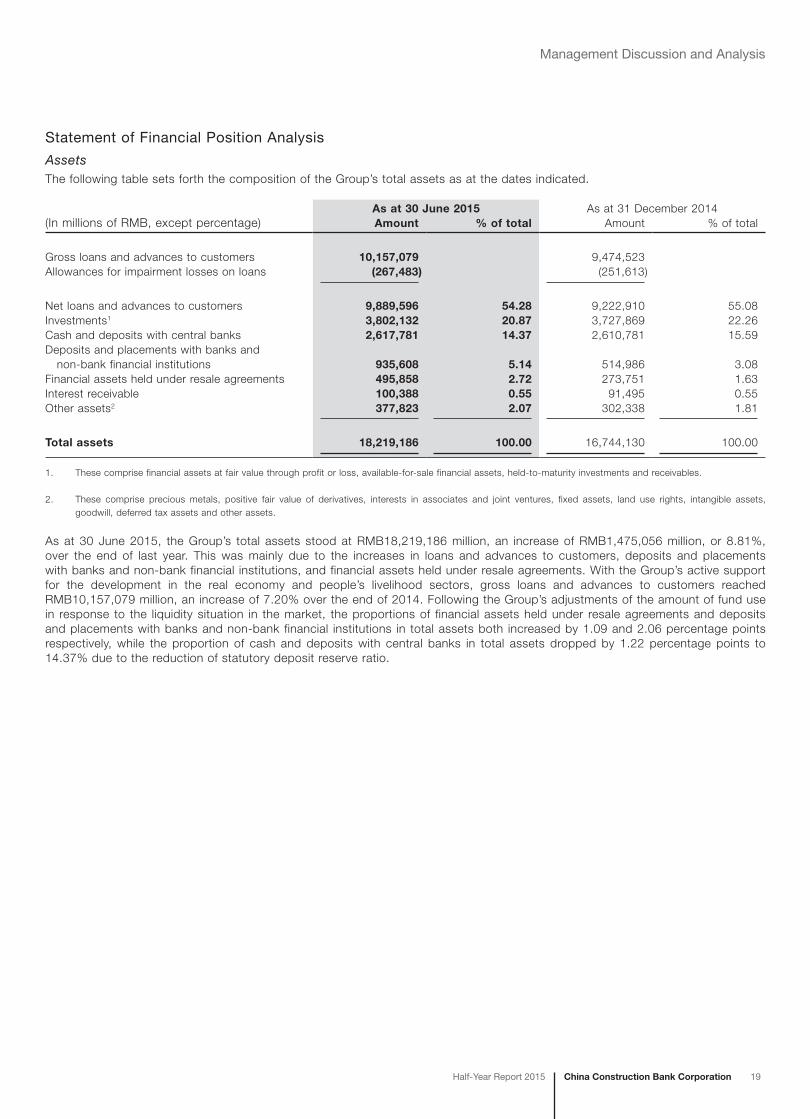
AssetsThe following table sets forth the composition of the Group’s total assets as at the dates indicated.
(In millions of RMB, except percentage)As at 30 June 2015 As at 31 December 2014Amount % of total Amount % of total
Gross loans and advances to customers 10,157,079 9,474,523Allowances for impairment losses on loans (267,483) (251,613)
Net loans and advances to customers 9,889,596 54.28 9,222,910 55.08Investments1 3,802,132 20.87 3,727,869 22.26Cash and deposits with central banks 2,617,781 14.37 2,610,781 15.59Deposits and placements with banks and non-bank financial institutions 935,608 5.14 514,986 3.08Financial assets held under resale agreements 495,858 2.72 273,751 1.63Interest receivable 100,388 0.55 91,495 0.55Other assets2 377,823 2.07 302,338 1.81
Total assets 18,219,186 100.00 16,744,130 100.00
1. These comprise financial assets at fair value through profit or loss, available-for-sale financial assets, held-to-maturity investments and receivables.
2. These comprise precious metals, positive fair value of derivatives, interests in associates and joint ventures, fixed assets, land use rights, intangible assets, goodwill, deferred tax assets and other assets.
As at 30 June 2015, the Group’s total assets stood at RMB18,219,186 million, an increase of RMB1,475,056 million, or 8.81%, over the end of last year. This was mainly due to the increases in loans and advances to customers, deposits and placements with banks and non-bank financial institutions, and financial assets held under resale agreements. With the Group’s active support for the development in the real economy and people’s livelihood sectors, gross loans and advances to customers reached RMB10,157,079 million, an increase of 7.20% over the end of 2014. Following the Group’s adjustments of the amount of fund use in response to the liquidity situation in the market, the proportions of financial assets held under resale agreements and deposits and placements with banks and non-bank financial institutions in total assets both increased by 1.09 and 2.06 percentage points respectively, while the proportion of cash and deposits with central banks in total assets dropped by 1.22 percentage points to 14.37% due to the reduction of statutory deposit reserve ratio.

20 China Construction Bank Corporation Half-Year Report 2015
Management Discussion and Analysis
Loans and advances to customers
The following table sets forth the composition of the Group’s loans and advances to customers as at the dates indicated.
(In millions of RMB, except percentages)As at 30 June 2015 As at 31 December 2014Amount % of total Amount % of total
Corporate loans and advances 5,960,132 58.68 5,760,406 60.80
Short-term loans 1,950,854 19.21 1,907,304 20.13Medium to long-term loans 4,009,278 39.47 3,853,102 40.67Personal loans and advances 3,135,923 30.87 2,884,146 30.44
Residential mortgages 2,470,379 24.32 2,253,815 23.79Credit card loans 358,028 3.52 329,164 3.47Personal consumer loans 57,444 0.57 58,040 0.61Personal business loans 70,886 0.70 75,002 0.79Other loans1 179,186 1.76 168,125 1.78Discounted bills 251,142 2.47 168,923 1.78
Overseas operations and subsidiaries 809,882 7.98 661,048 6.98
Gross loans and advances to customers 10,157,079 100.00 9,474,523 100.00
1. These comprise individual commercial property mortgage loans, home equity loans and educational loans.
As at 30 June 2015, the Group’s gross loans and advances to customers rose by RMB682,556 million, or 7.20% over the end of last year, to RMB10,157,079 million.
Domestic corporate loans and advances of the Bank reached RMB5,960,132 million, an increase of RMB199,726 million, or 3.47% over the end of last year, mainly extended to infrastructure and other sectors. In this amount, short-term loans increased by RMB43,550 million, or 2.28%, and medium to long-term loans increased by RMB156,176 million, or 4.05%.
Domestic personal loans and advances of the Bank increased by RMB251,777 million, or 8.73% over the end of last year, to RMB3,135,923 million. In this amount, residential mortgages increased by RMB216,564 million, or 9.61%, mainly to support the financing needs for residential purpose. Personal consumer loans and personal business loans decreased as a result of the enhancement of loan risk control and adjustment of loan product structure.
Discounted bills increased by RMB82,219 million, or 48.67%, to RMB251,142 million over the end of last year, mainly used to meet the short-term financing needs of targeted prime customers.
Loans and advances to customers of overseas entities and subsidiaries increased by RMB148,834 million, or 22.51% over the end of last year, to RMB809,882 million, mainly attributable to the strengthened domestic and overseas business collaboration and the loan increase of domestic subsidiaries.

China Construction Bank CorporationHalf-Year Report 2015 21
Management Discussion and Analysis
Distribution of loans by type of collaterals
The following table sets forth the distribution of loans and advances by type of collateral as at the dates indicated.
(In millions of RMB, except percentages)As at 30 June 2015 As at 31 December 2014Amount % of total Amount % of total
Unsecured loans 2,795,410 27.52 2,544,820 26.86Guaranteed loans 1,928,849 18.99 1,826,894 19.28Loans secured by tangible assets other than monetary assets 4,443,704 43.75 4,223,844 44.58Loans secured by monetary assets 989,116 9.74 878,965 9.28
Gross loans and advances to customers 10,157,079 100.00 9,474,523 100.00
Allowances for impairment losses on loans and advances to customers
(In millions of RMB)
Six months ended 30 June 2015
Allowances for loans and
advances which are collectively
assessed
Allowances for impaired loans and advances
Total
Which are collectively
assessed
Which are individually
assessed
As at 1 January 186,252 7,588 57,773 251,613Charge for the period 4,248 3,922 37,754 45,924Release during the period – (4) (5,479) (5,483)Unwinding of discount – – (1,355) (1,355)Transfers out (586) (16) (14,322) (14,924)Write-offs – (1,247) (7,809) (9,056)Recoveries – 76 688 764
As at 30 June 189,914 10,319 67,250 267,483
The Group adhered to the prudent principle by fully considering the impact of changes in external environment including macro economy and government regulatory policies on credit asset quality, and made full allowances for impairment losses on loans and advances to customers. As at 30 June 2015, the allowances for impairment losses on loans and advances to customers were RMB267,483 million, an increase of RMB15,870 million over the end of last year. The ratio of allowances to NPLs was 185.29%, a decrease of 37.04 percentage points over the end of last year. The ratio of allowances to total loans stood at 2.63%, 0.03 percentage points lower than that of the end of last year.
22 China Construction Bank Corporation Half-Year Report 2015
Management Discussion and Analysis
Investments
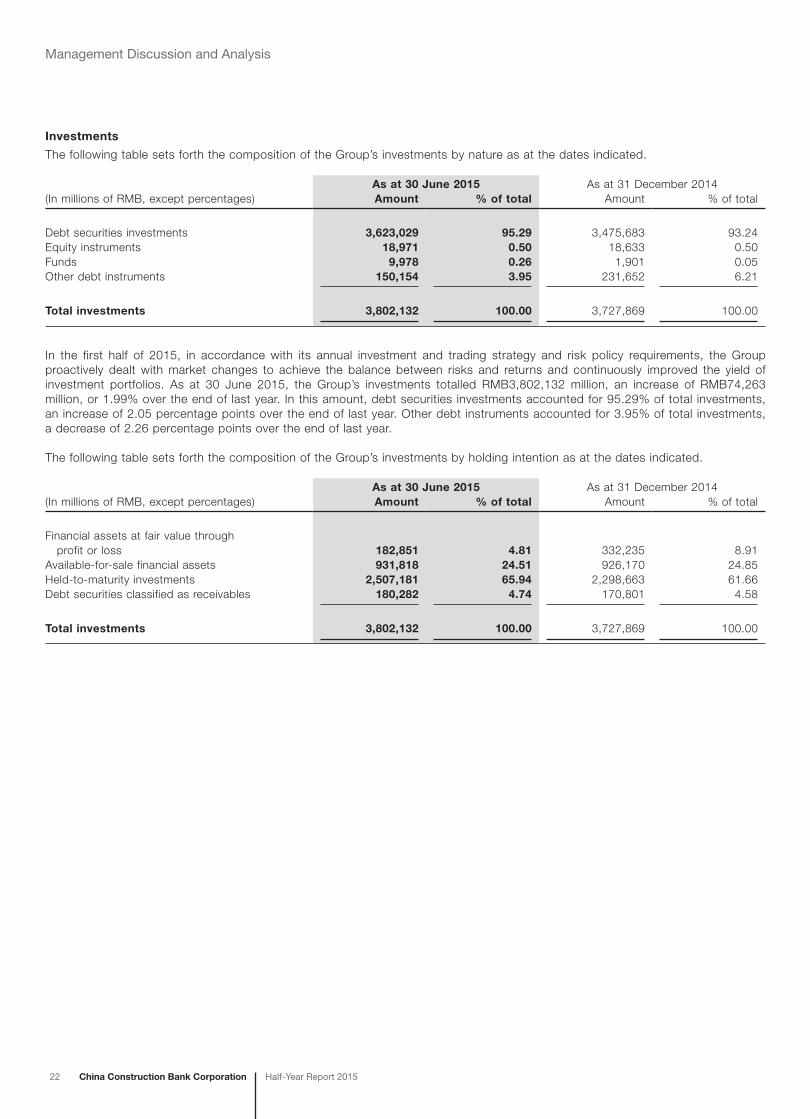
The following table sets forth the composition of the Group’s investments by nature as at the dates indicated.
(In millions of RMB, except percentages)As at 30 June 2015 As at 31 December 2014Amount % of total Amount % of total
Debt securities investments 3,623,029 95.29 3,475,683 93.24Equity instruments 18,971 0.50 18,633 0.50Funds 9,978 0.26 1,901 0.05Other debt instruments 150,154 3.95 231,652 6.21
Total investments 3,802,132 100.00 3,727,869 100.00
In the first half of 2015, in accordance with its annual investment and trading strategy and risk policy requirements, the Group proactively dealt with market changes to achieve the balance between risks and returns and continuously improved the yield of investment portfolios. As at 30 June 2015, the Group’s investments totalled RMB3,802,132 million, an increase of RMB74,263 million, or 1.99% over the end of last year. In this amount, debt securities investments accounted for 95.29% of total investments, an increase of 2.05 percentage points over the end of last year. Other debt instruments accounted for 3.95% of total investments, a decrease of 2.26 percentage points over the end of last year.
The following table sets forth the composition of the Group’s investments by holding intention as at the dates indicated.
(In millions of RMB, except percentages)As at 30 June 2015 As at 31 December 2014Amount % of total Amount % of total
Financial assets at fair value through profit or loss 182,851 4.81 332,235 8.91Available-for-sale financial assets 931,818 24.51 926,170 24.85Held-to-maturity investments 2,507,181 65.94 2,298,663 61.66Debt securities classified as receivables 180,282 4.74 170,801 4.58
Total investments 3,802,132 100.00 3,727,869 100.00
China Construction Bank CorporationHalf-Year Report 2015 23
Management Discussion and Analysis
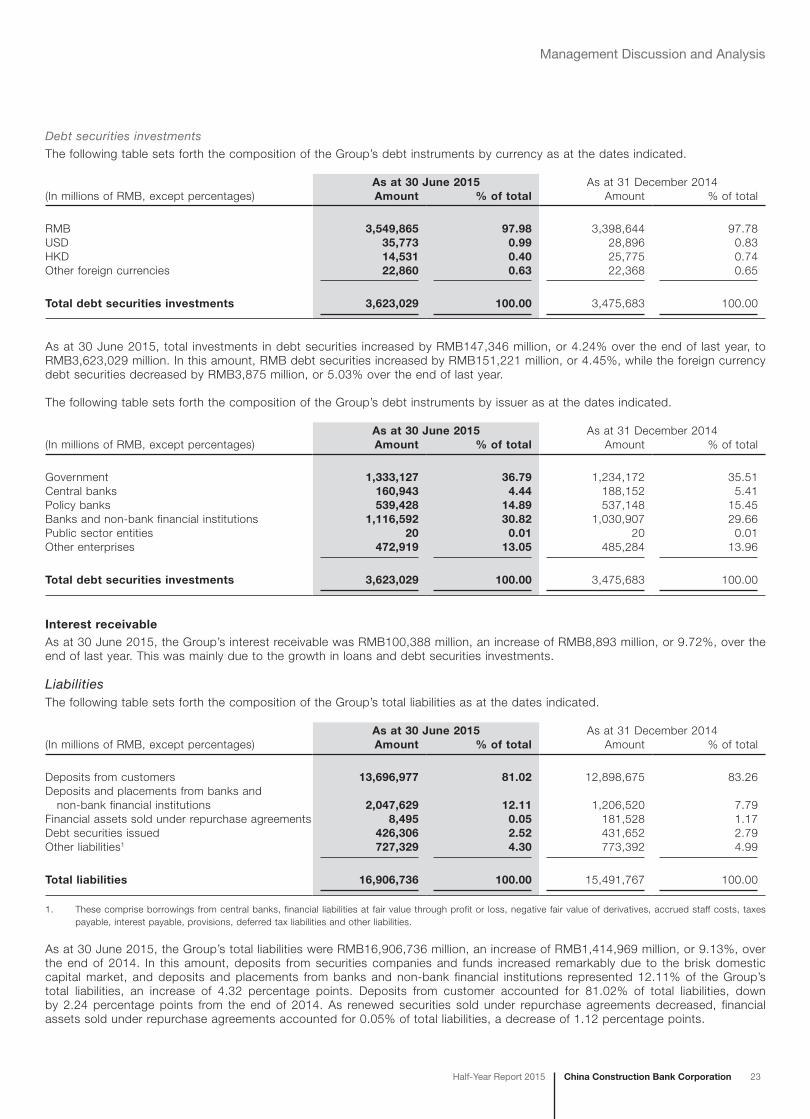
Debt securities investments
The following table sets forth the composition of the Group’s debt instruments by currency as at the dates indicated.
(In millions of RMB, except percentages)As at 30 June 2015 As at 31 December 2014Amount % of total Amount % of total
RMB 3,549,865 97.98 3,398,644 97.78USD 35,773 0.99 28,896 0.83HKD 14,531 0.40 25,775 0.74Other foreign currencies 22,860 0.63 22,368 0.65
Total debt securities investments 3,623,029 100.00 3,475,683 100.00
As at 30 June 2015, total investments in debt securities increased by RMB147,346 million, or 4.24% over the end of last year, to RMB3,623,029 million. In this amount, RMB debt securities increased by RMB151,221 million, or 4.45%, while the foreign currency debt securities decreased by RMB3,875 million, or 5.03% over the end of last year.
The following table sets forth the composition of the Group’s debt instruments by issuer as at the dates indicated.
(In millions of RMB, except percentages)As at 30 June 2015 As at 31 December 2014Amount % of total Amount % of total
Government 1,333,127 36.79 1,234,172 35.51Central banks 160,943 4.44 188,152 5.41Policy banks 539,428 14.89 537,148 15.45Banks and non-bank financial institutions 1,116,592 30.82 1,030,907 29.66Public sector entities 20 0.01 20 0.01Other enterprises 472,919 13.05 485,284 13.96
Total debt securities investments 3,623,029 100.00 3,475,683 100.00
Interest receivableAs at 30 June 2015, the Group’s interest receivable was RMB100,388 million, an increase of RMB8,893 million, or 9.72%, over the end of last year. This was mainly due to the growth in loans and debt securities investments.
LiabilitiesThe following table sets forth the composition of the Group’s total liabilities as at the dates indicated.
(In millions of RMB, except percentages)As at 30 June 2015 As at 31 December 2014Amount % of total Amount % of total
Deposits from customers 13,696,977 81.02 12,898,675 83.26Deposits and placements from banks and non-bank financial institutions 2,047,629 12.11 1,206,520 7.79Financial assets sold under repurchase agreements 8,495 0.05 181,528 1.17Debt securities issued 426,306 2.52 431,652 2.79Other liabilities1 727,329 4.30 773,392 4.99
Total liabilities 16,906,736 100.00 15,491,767 100.00
1. These comprise borrowings from central banks, financial liabilities at fair value through profit or loss, negative fair value of derivatives, accrued staff costs, taxes payable, interest payable, provisions, deferred tax liabilities and other liabilities.
As at 30 June 2015, the Group’s total liabilities were RMB16,906,736 million, an increase of RMB1,414,969 million, or 9.13%, over the end of 2014. In this amount, deposits from securities companies and funds increased remarkably due to the brisk domestic capital market, and deposits and placements from banks and non-bank financial institutions represented 12.11% of the Group’s total liabilities, an increase of 4.32 percentage points. Deposits from customer accounted for 81.02% of total liabilities, down by 2.24 percentage points from the end of 2014. As renewed securities sold under repurchase agreements decreased, financial assets sold under repurchase agreements accounted for 0.05% of total liabilities, a decrease of 1.12 percentage points.
24 China Construction Bank Corporation Half-Year Report 2015
Management Discussion and Analysis
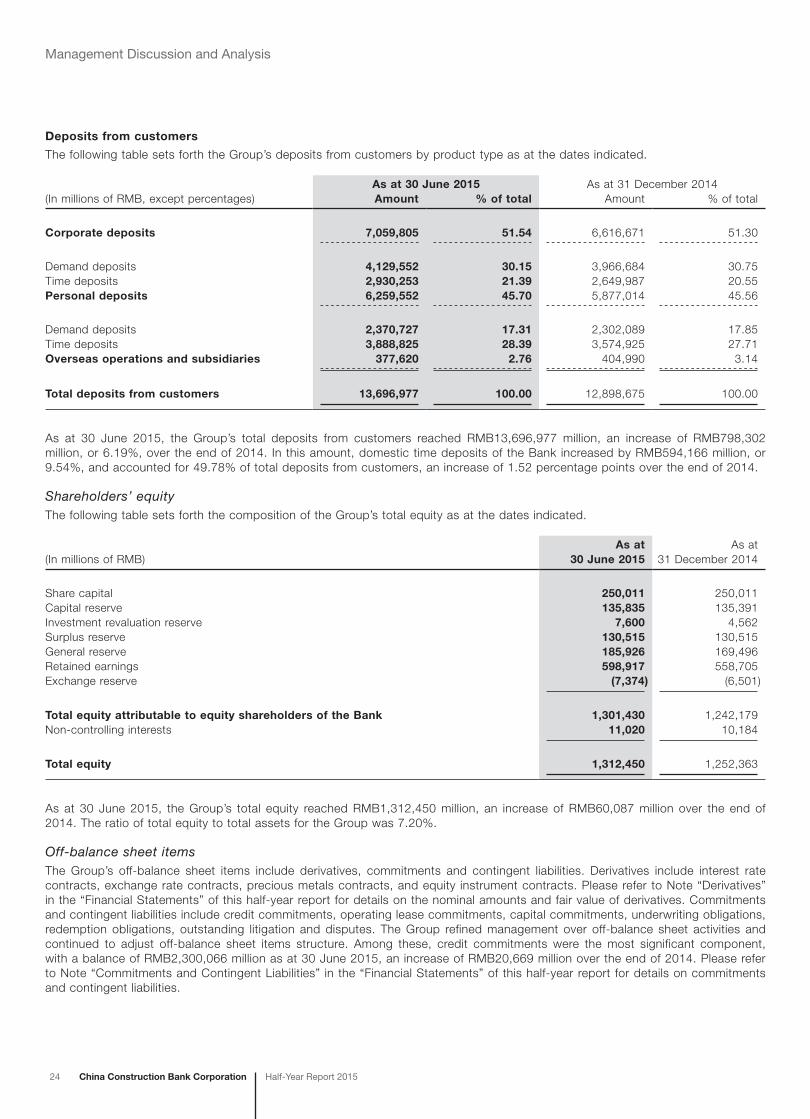
Deposits from customers
The following table sets forth the Group’s deposits from customers by product type as at the dates indicated.
(In millions of RMB, except percentages)As at 30 June 2015 As at 31 December 2014Amount % of total Amount % of total
Corporate deposits 7,059,805 51.54 6,616,671 51.30
Demand deposits 4,129,552 30.15 3,966,684 30.75Time deposits 2,930,253 21.39 2,649,987 20.55Personal deposits 6,259,552 45.70 5,877,014 45.56
Demand deposits 2,370,727 17.31 2,302,089 17.85Time deposits 3,888,825 28.39 3,574,925 27.71Overseas operations and subsidiaries 377,620 2.76 404,990 3.14
Total deposits from customers 13,696,977 100.00 12,898,675 100.00
As at 30 June 2015, the Group’s total deposits from customers reached RMB13,696,977 million, an increase of RMB798,302 million, or 6.19%, over the end of 2014. In this amount, domestic time deposits of the Bank increased by RMB594,166 million, or 9.54%, and accounted for 49.78% of total deposits from customers, an increase of 1.52 percentage points over the end of 2014.
Shareholders’ equityThe following table sets forth the composition of the Group’s total equity as at the dates indicated.
(In millions of RMB)As at
30 June 2015As at
31 December 2014
Share capital 250,011 250,011Capital reserve 135,835 135,391Investment revaluation reserve 7,600 4,562Surplus reserve 130,515 130,515General reserve 185,926 169,496Retained earnings 598,917 558,705Exchange reserve (7,374) (6,501)
Total equity attributable to equity shareholders of the Bank 1,301,430 1,242,179Non-controlling interests 11,020 10,184
Total equity 1,312,450 1,252,363
As at 30 June 2015, the Group’s total equity reached RMB1,312,450 million, an increase of RMB60,087 million over the end of 2014. The ratio of total equity to total assets for the Group was 7.20%.
Off-balance sheet itemsThe Group’s off-balance sheet items include derivatives, commitments and contingent liabilities. Derivatives include interest rate contracts, exchange rate contracts, precious metals contracts, and equity instrument contracts. Please refer to Note “Derivatives” in the “Financial Statements” of this half-year report for details on the nominal amounts and fair value of derivatives. Commitments and contingent liabilities include credit commitments, operating lease commitments, capital commitments, underwriting obligations, redemption obligations, outstanding litigation and disputes. The Group refined management over off-balance sheet activities and continued to adjust off-balance sheet items structure. Among these, credit commitments were the most significant component, with a balance of RMB2,300,066 million as at 30 June 2015, an increase of RMB20,669 million over the end of 2014. Please refer to Note “Commitments and Contingent Liabilities” in the “Financial Statements” of this half-year report for details on commitments and contingent liabilities.

China Construction Bank CorporationHalf-Year Report 2015 25
Management Discussion and Analysis
Loan Quality Analysis
Distribution of loans by the five-category classificationThe following table sets forth, as at the dates indicated, the distribution of the Group’s loans by the five-category loan classification under which NPLs include substandard, doubtful and loss categories.
(In millions of RMB, except percentages)As at 30 June 2015 As at 31 December 2014Amount % of total Amount % of total
Normal 9,729,625 95.79 9,079,893 95.84Special mention 283,095 2.79 281,459 2.97Substandard 79,409 0.78 55,059 0.58Doubtful 54,707 0.54 48,239 0.51Loss 10,243 0.10 9,873 0.10
Gross loans and advances to customers 10,157,079 100.00 9,474,523 100.00
Non-performing loans 144,359 113,171Non-performing loan ratio 1.42 1.19
In the first half of 2015, the Group conducted specified risk inspection for key industries, regions and products, and maintained basically stable credit asset quality through increased efforts in customer risk prevention and mitigation as well as intensified disposal of NPLs by leveraging on market-driven methods. As at 30 June 2015, the Group’s NPLs were RMB144,359 million, an increase of RMB31,188 million over the end of 2014, while the NPL ratio stood at 1.42%, up by 0.23 percentage points over the end of 2014. The proportion of special mention loans was 2.79%, down by 0.18 percentage points over the end of 2014.
Distribution of loans and NPLs by product typeThe following table sets forth the Group’s loans and NPLs by product type as at the dates indicated.
(In millions of RMB, except percentages)
As at 30 June 2015 As at 31 December 2014
Loans NPLsNPL
ratio (%) Loans NPLsNPL
ratio (%)
Corporate loans and advances 5,960,132 123,895 2.08 5,760,406 95,886 1.66
Short-term loans 1,950,854 84,184 4.32 1,907,304 66,894 3.51Medium to long-term loans 4,009,278 39,711 0.99 3,853,102 28,992 0.75Personal loans and advances 3,135,923 15,224 0.49 2,884,146 11,067 0.38
Residential mortgages 2,470,379 6,450 0.26 2,253,815 4,806 0.21Credit card loans 358,028 3,867 1.08 329,164 2,783 0.85Personal consumer loans 57,444 991 1.73 58,040 848 1.46Personal business loans 70,886 2,311 3.26 75,002 1,535 2.05Other loans1 179,186 1,605 0.90 168,125 1,095 0.65Discounted bills 251,142 – – 168,923 – –
Overseas operations and subsidiaries 809,882 5,240 0.65 661,048 6,218 0.94
Gross loans and advances to customers 10,157,079 144,359 1.42 9,474,523 113,171 1.19
1. These comprise individual commercial property mortgage loans, home equity loans and educational loans.
As at 30 June 2015, the NPL ratio for domestic corporate loans and advances was 2.08%, an increase of 0.42 percentage points over the end of 2014, and that for personal loans and advances was 0.49%, an increase of 0.11 percentage points over the end of 2014. The NPL ratio for overseas entities and subsidiaries decreased by 0.29 percentage points to 0.65% over the end of last year.
26 China Construction Bank Corporation Half-Year Report 2015
Management Discussion and Analysis
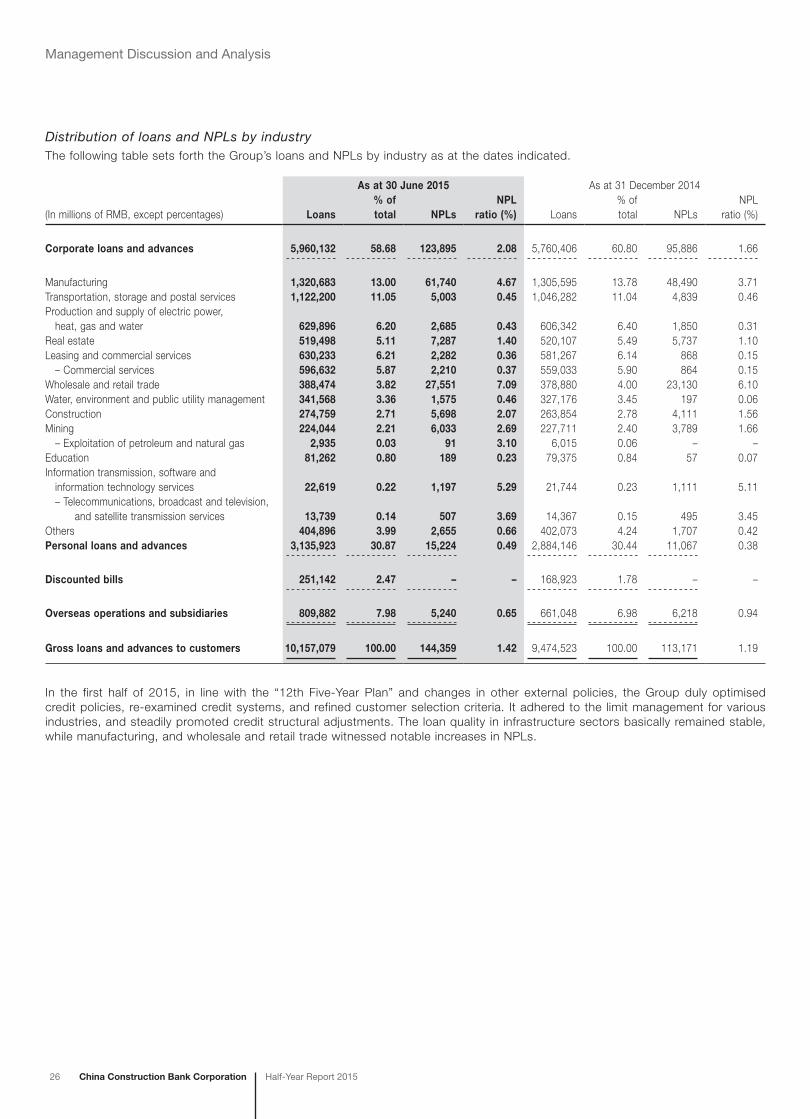
Distribution of loans and NPLs by industryThe following table sets forth the Group’s loans and NPLs by industry as at the dates indicated.
(In millions of RMB, except percentages)
As at 30 June 2015 As at 31 December 2014
Loans% of total NPLs
NPL ratio (%) Loans
% of total NPLs
NPL ratio (%)
Corporate loans and advances 5,960,132 58.68 123,895 2.08 5,760,406 60.80 95,886 1.66
Manufacturing 1,320,683 13.00 61,740 4.67 1,305,595 13.78 48,490 3.71Transportation, storage and postal services 1,122,200 11.05 5,003 0.45 1,046,282 11.04 4,839 0.46Production and supply of electric power, heat, gas and water 629,896 6.20 2,685 0.43 606,342 6.40 1,850 0.31Real estate 519,498 5.11 7,287 1.40 520,107 5.49 5,737 1.10Leasing and commercial services 630,233 6.21 2,282 0.36 581,267 6.14 868 0.15 – Commercial services 596,632 5.87 2,210 0.37 559,033 5.90 864 0.15Wholesale and retail trade 388,474 3.82 27,551 7.09 378,880 4.00 23,130 6.10Water, environment and public utility management 341,568 3.36 1,575 0.46 327,176 3.45 197 0.06Construction 274,759 2.71 5,698 2.07 263,854 2.78 4,111 1.56Mining 224,044 2.21 6,033 2.69 227,711 2.40 3,789 1.66 – Exploitation of petroleum and natural gas 2,935 0.03 91 3.10 6,015 0.06 – –Education 81,262 0.80 189 0.23 79,375 0.84 57 0.07Information transmission, software and information technology services 22,619 0.22 1,197 5.29 21,744 0.23 1,111 5.11 – Telecommunications, broadcast and television, and satellite transmission services 13,739 0.14 507 3.69 14,367 0.15 495 3.45Others 404,896 3.99 2,655 0.66 402,073 4.24 1,707 0.42Personal loans and advances 3,135,923 30.87 15,224 0.49 2,884,146 30.44 11,067 0.38
Discounted bills 251,142 2.47 – – 168,923 1.78 – –
Overseas operations and subsidiaries 809,882 7.98 5,240 0.65 661,048 6.98 6,218 0.94
Gross loans and advances to customers 10,157,079 100.00 144,359 1.42 9,474,523 100.00 113,171 1.19
In the first half of 2015, in line with the “12th Five-Year Plan” and changes in other external policies, the Group duly optimised credit policies, re-examined credit systems, and refined customer selection criteria. It adhered to the limit management for various industries, and steadily promoted credit structural adjustments. The loan quality in infrastructure sectors basically remained stable, while manufacturing, and wholesale and retail trade witnessed notable increases in NPLs.
China Construction Bank CorporationHalf-Year Report 2015 27
Management Discussion and Analysis
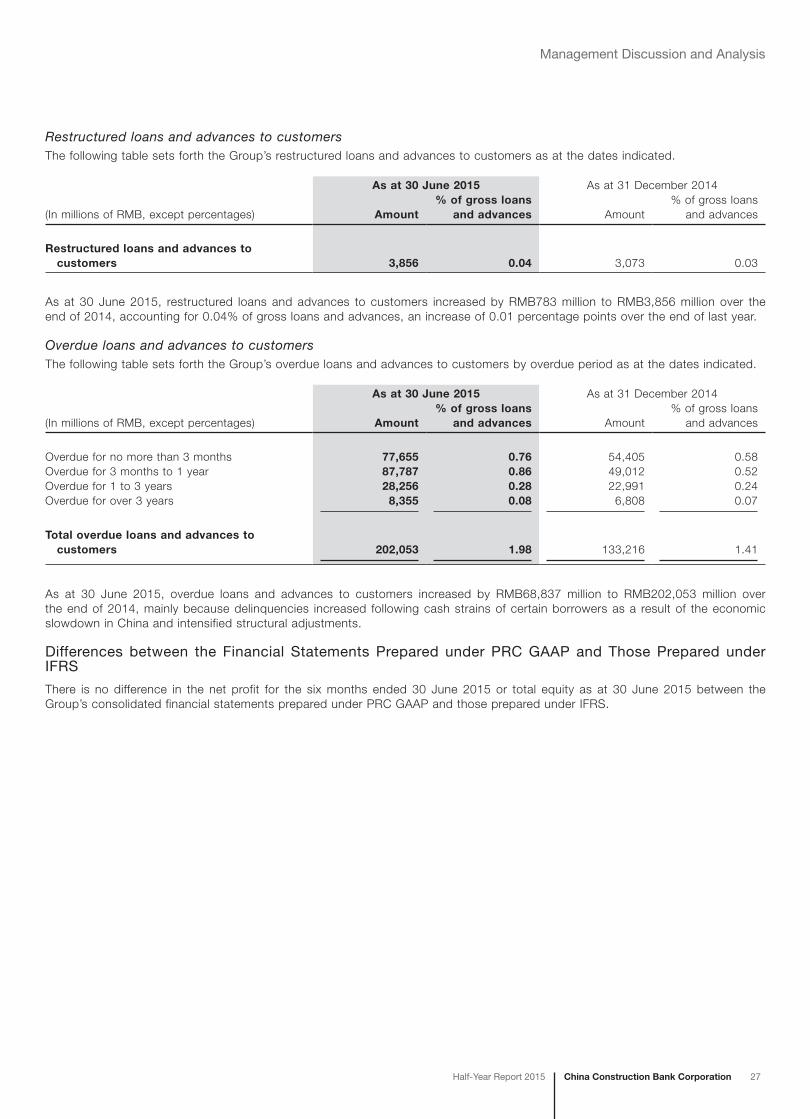
Restructured loans and advances to customersThe following table sets forth the Group’s restructured loans and advances to customers as at the dates indicated.
(In millions of RMB, except percentages)
As at 30 June 2015 As at 31 December 2014
Amount% of gross loans
and advances Amount% of gross loans
and advances
Restructured loans and advances to customers 3,856 0.04 3,073 0.03
As at 30 June 2015, restructured loans and advances to customers increased by RMB783 million to RMB3,856 million over the end of 2014, accounting for 0.04% of gross loans and advances, an increase of 0.01 percentage points over the end of last year.
Overdue loans and advances to customersThe following table sets forth the Group’s overdue loans and advances to customers by overdue period as at the dates indicated.
(In millions of RMB, except percentages)
As at 30 June 2015 As at 31 December 2014
Amount% of gross loans
and advances Amount% of gross loans
and advances
Overdue for no more than 3 months 77,655 0.76 54,405 0.58Overdue for 3 months to 1 year 87,787 0.86 49,012 0.52Overdue for 1 to 3 years 28,256 0.28 22,991 0.24Overdue for over 3 years 8,355 0.08 6,808 0.07
Total overdue loans and advances to customers 202,053 1.98 133,216 1.41
As at 30 June 2015, overdue loans and advances to customers increased by RMB68,837 million to RMB202,053 million over the end of 2014, mainly because delinquencies increased following cash strains of certain borrowers as a result of the economic slowdown in China and intensified structural adjustments.
Differences between the Financial Statements Prepared under PRC GAAP and Those Prepared under IFRS
There is no difference in the net profit for the six months ended 30 June 2015 or total equity as at 30 June 2015 between the Group’s consolidated financial statements prepared under PRC GAAP and those prepared under IFRS.
28 China Construction Bank Corporation Half-Year Report 2015
Management Discussion and Analysis
Business Review
The Group’s major business segments are corporate banking, personal banking, treasury business, and others including overseas operations and subsidiaries.
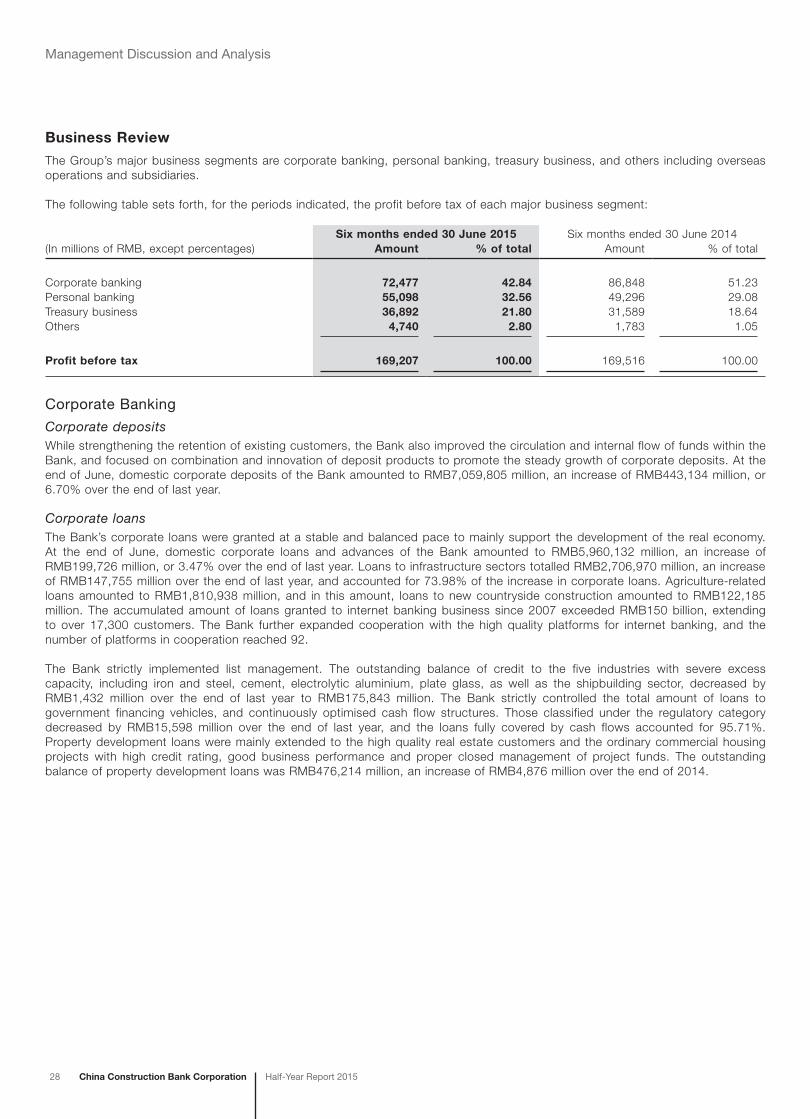
The following table sets forth, for the periods indicated, the profit before tax of each major business segment:
(In millions of RMB, except percentages)Six months ended 30 June 2015 Six months ended 30 June 2014
Amount % of total Amount % of total
Corporate banking 72,477 42.84 86,848 51.23Personal banking 55,098 32.56 49,296 29.08Treasury business 36,892 21.80 31,589 18.64Others 4,740 2.80 1,783 1.05
Profit before tax 169,207 100.00 169,516 100.00
Corporate Banking
Corporate depositsWhile strengthening the retention of existing customers, the Bank also improved the circulation and internal flow of funds within the Bank, and focused on combination and innovation of deposit products to promote the steady growth of corporate deposits. At the end of June, domestic corporate deposits of the Bank amounted to RMB7,059,805 million, an increase of RMB443,134 million, or 6.70% over the end of last year.
Corporate loansThe Bank’s corporate loans were granted at a stable and balanced pace to mainly support the development of the real economy. At the end of June, domestic corporate loans and advances of the Bank amounted to RMB5,960,132 million, an increase of RMB199,726 million, or 3.47% over the end of last year. Loans to infrastructure sectors totalled RMB2,706,970 million, an increase of RMB147,755 million over the end of last year, and accounted for 73.98% of the increase in corporate loans. Agriculture-related loans amounted to RMB1,810,938 million, and in this amount, loans to new countryside construction amounted to RMB122,185 million. The accumulated amount of loans granted to internet banking business since 2007 exceeded RMB150 billion, extending to over 17,300 customers. The Bank further expanded cooperation with the high quality platforms for internet banking, and the number of platforms in cooperation reached 92.
The Bank strictly implemented list management. The outstanding balance of credit to the five industries with severe excess capacity, including iron and steel, cement, electrolytic aluminium, plate glass, as well as the shipbuilding sector, decreased by RMB1,432 million over the end of last year to RMB175,843 million. The Bank strictly controlled the total amount of loans to government financing vehicles, and continuously optimised cash flow structures. Those classified under the regulatory category decreased by RMB15,598 million over the end of last year, and the loans fully covered by cash flows accounted for 95.71%. Property development loans were mainly extended to the high quality real estate customers and the ordinary commercial housing projects with high credit rating, good business performance and proper closed management of project funds. The outstanding balance of property development loans was RMB476,214 million, an increase of RMB4,876 million over the end of 2014.
China Construction Bank CorporationHalf-Year Report 2015 29
Management Discussion and Analysis
Small enterprise businessThe Bank regards small and micro enterprise business as an important strategic business in support of the real economy, and constantly promotes its subdivided, standardised and intensified business transformation and development. In the first half of 2015, the Bank leveraged big data technologies to analyse and identify customer needs, offered small credit loans to small and micro enterprises, and expanded the coverage of customer services. The Bank selected high-quality customers in batches through business communities, industrial chains and enterprise clusters, and cooperated with government bodies, such as the Ministry of Industry and Information Technology (MIIT), and local governments at various levels to establish platforms for enhancing credit, and vigorously promoted new business models including “Credit Cooperation Loan” and ratio-based re-guarantee financing. Relying on the building of integrated outlets, the Bank propelled marketing and service to familiar small and micro enterprises and increased accessibility to customers through outlets. It continued to improve internet service channels and optimise the business function of “E-banking revolving loan” so as to provide better self-service in applications, withdrawals and repayment for customers. At the end of June, according to the categorisation policy of small and medium-sized enterprises (SMEs) jointly issued by four ministries and commissions including MIIT in 2011 as well as the CBRC’s latest regulatory requirements, loans to small and micro enterprises were RMB1,215,551 million, an increase of RMB72,623 million from the end of 2014; the number of loan customers reached 247,053, an increase of 4,978; and the availability rate of loan applications of small and micro enterprises was 83.72%, higher than that of the same period last year.
Cost advisory serviceCost advisory service is the Bank’s unique fee-based business product with a strong brand. It has had a history of more than 60 years since it emerged and developed along with the Bank’s long-term practices of investment in fixed assets and being the agency of the state financial functions. The Bank’s 36 tier-one branches had the grade-A qualification for engineering cost advisory service issued by the Ministry of Housing and Urban-Rural Development, and 223 tier-two branches set up specialised units for cost advisory service. In the first half of 2015, the Bank reinforced fundamental management, pushed forward business transformation, improved specialised institutions and innovated businesses and products, contributing to continuously improved industry position and brand image. Income from cost advisory service amounted to RMB5,355 million.
Institutional businessThe Bank vigorously promoted its updated “Minben Tongda” comprehensive financial services brand. With a focus on key high quality customers in areas of education, health, social security, culture and environmental protection, the Bank further expanded the range of comprehensive services. The Bank signed strategic cooperation agreements with National Tourism Administration, Huazhong University of Science and Technology, and other parties. It studied and formulated the Guidelines for Comprehensive Marketing in Support of Vocational Education Modernisation and Guidelines for Comprehensive Financial Services to County-level Public Hospitals. The application of social security products continuously expanded and 30 branches in total issued financial social security card. It ranked first among peer banks in terms of the number of customers of the central finance authorised payment and non-tax revenue collection agency service. The accumulative issuance of civil service credit card in units with financial budget continued to lead the market and the Bank was the first one among peers to pilot electronic online central non-tax revenue collection under the requirements of the Ministry of Finance. The Bank was among the first batch to become a general member of the Shanghai Clearing House to engage in foreign exchange clearing services and launched client clearing services for RMB-FX Transaction central counterparty clearing business. The Bank also established correspondent bank relationship with nine domestic banks, and further consolidated and expanded inter-bank customer base. At the end of June, the number of “Xincunguan” customers whose securities deposits managed by the Bank as a third party totalled 30.76 million, and assets under management amounted to RMB741,741 million, both ranking first among peers. The number of futures companies with “through-train” banking services reached 153, achieving 100% coverage.

30 China Construction Bank Corporation Half-Year Report 2015
Management Discussion and Analysis
International businessInternational business maintained sound growth momentum. Another breakthrough was achieved in expanding its RMB clearing network, as the Bank became the RMB clearing bank in Chile, the first RMB clearing bank designated by the PBOC in South America. Through products collaboratively innovated by domestic and overseas entities, such as “risk participation in trade financing assets” and “export entrusted payment”, the Bank made further progress in broadening its financing channels and reducing financing costs for enterprises. The Bank became an industry leader for business development in special economic zones including Shanghai Free Trade Zone. More specifically, it led the market in terms of deposit balance, loan balance and cross-border financing amount under Free Trade Accounting Unit (FTU) of Shanghai Free Trade Zone. The Bank also actively participated in business innovation of China (Hangzhou) Cross-Border E-commerce Comprehensive Pilot Zone and became one of the first bank partners of the Zone. The Bank steadily expanded correspondent bank network and established head office level correspondent bank relationship with 1,479 commercial banks, covering 139 countries and regions. In the first half of 2015, international settlement volume of the Bank amounted to US$607,873 million, a year-on-year increase of 8.70%; cross-border RMB settlement volume totalled RMB834,147 million, a year-on-year increase of 17.38%.
Asset custodial businessThe Bank actively developed new businesses and products to drive the rapid development of its asset custodial business. At the end of June, the Bank’s assets under custody increased by 19.19% over the end of 2014 to RMB5.10 trillion. Securities investment funds under custody increased by 49.65% over the end of 2014 to RMB1.42 trillion. The total number of securities investment funds under custody was 514 and the number of new funds under custody was 79, both ranking first in the market. Insurance assets under custody totalled RMB1.10 trillion, up by 15.92% over the end of 2014. The Bank was the only bank among the first entities qualified as mainland sales agent for Hong Kong funds.
Pension businessPension business developed well with positive progress in product innovation. The Bank innovatively launched Employee Stock Ownership Plan named “Yangyipuhui” and received its first order. It strengthened strategic collaboration with subsidiaries, including cooperation with CCB Life in organising the promotion meetings of two products, namely “Yangyiwuyou” and “Yangyiankang”. At the end of June, the pension assets under trusteeship in operation amounted to RMB63,586 million, up by 14.94% over the end of last year. The pension assets under custody in operation amounted to RMB153,549 million, up by 13.93% over the end of last year. The number of personal pension accounts in operation amounted to 4,235,300, an increase of 10.24% over the end of last year.
Treasury management and settlement businessTreasury management and settlement business maintained steady development. With sustained efforts made in product innovation and marketing to propel corporate treasury management and settlement products, the Bank innovatively launched more account services including online appointment for account opening, extensively developed global treasury management business, and vigorously promoted the application of mobilised, intelligentised and self-service treasury management and settlement products and services. The market share of the Bank’s strategic products including multi-model cash pool, bank notes pool and UnionPay corporate settlement card was constantly expanded, and the market influence of its treasury management service branded as “Yudao” was further promoted. At the end of June, the Bank had 5,270,200 corporate RMB settlement accounts, an increase of 410,300 over the end of last year. Settlement business volume amounted to RMB170.25 trillion, a year-on-year increase of 17.15%. The Bank had 642,800 active treasury management customers.
China Construction Bank CorporationHalf-Year Report 2015 31
Management Discussion and Analysis
Personal Banking
Personal depositsThe Bank enhanced the capacity to attract deposits through high quality and highly effective products and services, maintaining a steady growth of personal deposits. At the end of June, domestic personal deposits of the Bank increased by RMB382,538 million, or 6.51%, to RMB6,259,552 million over the end of last year. In this amount, demand deposits picked up by 2.98% and time deposits increased by 8.78%.
Personal loansThe Bank’s personal loans proactively met credit demands in people’s livelihood sectors. It accelerated the pace of product innovation, and steadily improved customer service ability. At the end of June, domestic personal loans of the Bank increased by RMB251,777 million to RMB3,135,923 million. In this amount, residential mortgages were primarily granted to support customers to buy ordinary apartments for residential purpose, with a loan balance of RMB2,470,379 million, an increase of RMB216,564 million or 9.61% over the end of last year, with the balance and the increment both ranking first among peers. Relying on “internet +” and the application of big data, the Bank was the first among its peers to introduce the one-stop personal online self-service loan product – CCB “Quick Loan”, which was highly praised by customers. Personal consumer loans were RMB57,444 million, personal business loans were RMB70,886 million and personal agriculture-related loans totalled RMB9,171 million.
Bank cards business
Credit card business
Credit card business maintained rapid development with core business indicators leading the market among peers. Its brand influence, market competitiveness, risk control ability, profitability and customer satisfaction were further improved. By building its consumer financial service ecosystem, the Bank primarily developed merchants engaged in living and productive consumption in tourism, catering, education, culture, and health care, which were closely linked to the everyday life of customers. The Bank accelerated the promotion and application of credit cards in people’s livelihood sectors including electronic toll collection (ETC), medical treatment, education, and social security. By leveraging on the platform products such as global payment credit card, hot purchase Long card and automobile Long card, the Bank conducted large promotion activities such as “Credit Card Talent” and “Saturday of Long Card” for brand card owners, to enhance customer card-using experience. The Bank actively promoted revolving and instalment payment business, optimised the business process of instalment purchase of vehicles, and steadily expanded instalment payment for housing renovation. It accelerated internet-based credit card innovation to explore internet service channels in card issuance and marketing, consumer loans, and merchant operations, promoted the application of card-free payment, mobile payment, QR code payment and cloud payment, and made full use of the intelligent marketing systems at outlets to improve identification of customers and promotion of products. The Bank continued to advance the building of its “Smart Customer Service” platform to improve the all-round customer service capability. At the end of June, the number of credit cards issued totalled 74.26 million, an increase of 8.33 million over the end of last year. The spending amount through credit cards reached RMB1,007,297 million, a year-on-year increase of 32.91%, and the loan balance was RMB358,028 million. The asset quality remained sound.
Debit card business
The Bank strengthened innovation in mobile payment and other products, by introducing “Suixinyong” mobile payment APP and “Tiexinchong” payment function, to meet customers’ needs for secure and convenient payment. It vigorously expanded business cooperation in key industries including social security, medical and health care, public transportation, community finance, culture and education, to promote the application of financial IC debit cards and E-cash Quick Pass. The Bank continued to consolidate the development base of bank card business by organising a variety of marketing activities and optimising service processes and system functions. At the end of June, the number of debit cards issued totalled 682 million, and the spending amount through debit cards reached RMB2,911,823 million. The number of financial IC debit cards issued totalled 252 million. The number of express settlement cards issued totalled 23.42 million, an increase of 8.52 million, targeted at individual business proprietors for their payment and settlement demands.
32 China Construction Bank Corporation Half-Year Report 2015
Management Discussion and Analysis
Private bankingDriven by the needs of customers themselves, their families and enterprises, private banking business focuses on wealth management, integrated finance and exclusive value-added services (including non-financial business), and strives to provide full-range, one-stop services for its private banking customers by fully integrating resources of the Group. In line with customer demands in wealth management and assets allocation, the Bank vigorously developed exclusive and customised wealth management products (WMPs), family trusts and agency service of various investment products, and optimised the platform for third-party products. In response to the comprehensive financial needs of customers themselves, their families and enterprises, the Bank integrated all kinds of financial service tools, improved functions of private banking cards and wealth management cards, innovatively launched “Sixianghuanqiu” cross-border integrated financial business, and energetically developed “Jinguanjia” personal customer (family) cash management services. To meet customer needs in family wealth inheritance and share, the Bank offered innovative advisory services in investment immigration, marital family wealth planning and family wealth inheritance, and provided selective non-financial exclusive value-added services in medical care, overseas education and international rescue. The Bank aimed to provide professional services by enhancing service capability for private banking customers, strengthening customer marketing and full-range relationship management and optimising all-channel services for private banking customers. At the end of June, the number of private banking customers with financial assets above RMB10 million grew by 12.32% over the end of last year, and the total amount customers’ financial assets increased by 20.79%.
Entrusted housing finance businessAdhering to the philosophy of “supporting housing reform and serving common people”, the Bank proactively responded to the service needs of housing fund management departments by further strengthening the promotion of scientific systems, so as to provide comprehensive and high quality financial services for housing reform. At the end of June, housing fund deposits were RMB733,104 million, while personal provident housing fund loans amounted to RMB1,298,199 million. The Bank accelerated the expansion of provident fund co-branded card, by issuing 34.83 million cards in total. The Bank steadily promoted financial services for the indemnificatory housing market, accumulatively granted personal indemnificatory housing loans of RMB95,136 million to 605,600 low and middle-income residents, and accumulatively provided housing provident fund project loans of RMB49,265 million to 212 indemnificatory housing trial projects.
Treasury Business
Financial market businessIn the first half of 2015, the Bank continued to promote the transformation and development of financial market business, focused on increasing transaction activity and the influence of financial market, and strengthened customer development and business innovation, contributing to the steadily improved profitability and risk management and control.
Money market business
By closely monitoring its liquidity position, the Bank reasonably arranged transaction maturities, anticipated cash inflow with advance planning, properly adjusted the size of its money market portfolio, and intensified fund use in the time of having adequate liquidity to increase gains from the money market. On the other side, the Bank strengthened liquidity reserve at critical time points to effectively mitigate position fluctuation and ensure liquidity safety.
Investments in debt securities
The Bank actively studied and judged the market trend, reasonably arranged investment progress, conducted trading by seizing opportunities in market moves, adjusted and optimised its investment portfolio structure to effectively generate stable returns. It closely monitored the changes in the qualifications of debt securities issuers to mitigate credit risk in the bond market. The Bank realised a sharp lead in the yield of trading accounts over the total inter-bank bond index (full price) by flexibly adjusting market making and trading strategies on its trading book.
Customer-driven foreign exchange and interest rate trading business
The Bank fully tapped its business potentials and customer needs, strengthened customer marketing and exploration, improved its market-making capabilities, and upgraded its market influence through active transactions. In the first half of 2015, the trading volume of customer-driven foreign exchange and interest rate trading business amounted to US$284,091 million, up by 25.90% over the same period last year. The Bank also maintained its leading position in the interbank foreign exchange market in terms of comprehensive ranking.

China Construction Bank CorporationHalf-Year Report 2015 33
Management Discussion and Analysis
Precious metals
The Bank constantly strengthened product innovation and customer marketing, and adopted numerous measures to increase customer transaction activity. It diversified its product offerings, completed innovation in products including the bulk commodity hedging business denominated and settled in RMB, and expanded the varieties of tradable bulk commodities to 17, including precious metals, base metals, energy and agricultural products. The Bank officially launched its PC client for precious metals trading to improve customer experience. In the first half of 2015, the total trading volume of precious metals of the Bank reached 28,000 tonnes, up by 84.05% over the same period last year.
Assets management businessThe Bank accelerated the transformation and innovation of assets management business, and constantly improved customer experience and its brand image. It innovatively introduced seven categories of WMPs, including WMPs linked to gold option, WMPs linked to CSI 300 Index and structured shares pledged repo investment WMPs, to meet the wealth management needs of middle-end and high-end customers. The Bank also issued its first Public-Private-Partnership (“PPP”) products and “BT-to-VAT” planning products to meet the diversified financing needs of customers. In the first half of 2015, the Bank independently issued 3,355 batches of WMPs with a total amount of RMB2,731,467 million to effectively meet the investment needs of customers. The balance of WMPs was RMB1,098,384 million. In this amount, the balance of non-principal-guaranteed WMPs was RMB942,759 million and the balance of principal-guaranteed WMPs was RMB155,625 million.
Investment banking businessThe Bank transformed its investment banking business from a pure fund supplier to a provider of comprehensive fund operation and management services. In various business fields, including PPP, mixed ownership reform, government debt restructuring, urbanisation and mergers and acquisitions, the Bank mobilised government and non-government funds and capitalised market opportunities by setting up fund of funds (FOFs) at the head office and sub-funds at branches. In the first half of 2015, the underwriting amount of debt financing instruments for non-financial enterprises was RMB237,476 million and the underwriting amount of local government bonds amounted to RMB124,937 million. Income from financial advisory services of the Bank reached RMB3,068 million. In this amount, income from new financial advisory services totalled RMB2,600 million.
Overseas Commercial Bank Business
In the first half of 2015, the Group accelerated the expansion of overseas presence. Paris Branch, Amsterdam Branch, Barcelona Branch and Milan Branch under CCB Europe opened for business simultaneously on 30 June, with Chinese Premier of State Council Li Keqiang and French Prime Minister Manuel Valls attending the opening ceremony for CCB Europe Paris Branch to jointly unveil its nameplate. Chile Branch obtained the banking license issued by The Superintendency of Banks and Financial Institutions of Chile. London Branch officially commenced its business operation. Applications and preparations for the establishment of institutions including Zurich Branch and a subsidiary bank in Malaysia were simultaneously pushed forward. At the end of June, the Group had 18 overseas tier-one branches in Hong Kong, Singapore, Frankfurt, Johannesburg, Tokyo, Seoul, New York, Ho Chi Minh City, Sydney, Taipei, Luxembourg, Macau, Toronto, London, Paris, Amsterdam, Barcelona and Milan, six wholly-owned operating subsidiaries in Hong Kong, London, Russia, Dubai, Luxembourg and New Zealand, and a holding subsidiary bank in Brazil. Its overseas entities covered 24 countries and regions. At the end of June, the total assets of the Group’s overseas commercial banks were RMB1,046,508 million, up by 10.38% over the end of last year, and the profit before tax was RMB2,118 million, a year-on-year increase of 35.61%.
Integrated Operation Subsidiaries
The Group has established a preliminary comprehensive operating framework, and progressively improved comprehensive financial services. The Group has several domestic subsidiaries in non-banking financial sectors, including CCB Principal Asset Management, CCB Financial Leasing, CCB Trust, CCB Life, CCB Futures and CCB International. The Group has set up several subsidiary banks providing professional and differentiated services in specific industries and regions, including Sino-German Bausparkasse and 27 rural banks. The Group enhanced cross-selling and business collaboration between parent bank and subsidiaries, and actively promoted synergistic collaboration in terms of channels, customers and products, resulting in further optimised business synergy mechanism between parent bank and subsidiaries. The overall business development of integrated operation subsidiaries was in a good shape with steady business expansion. At the end of June, the total assets of integrated operation subsidiaries were RMB242,447 million, up by 27.91% over the end of last year, and the net profit reached RMB2,160 million, a year-on-year increase of 47.62%.
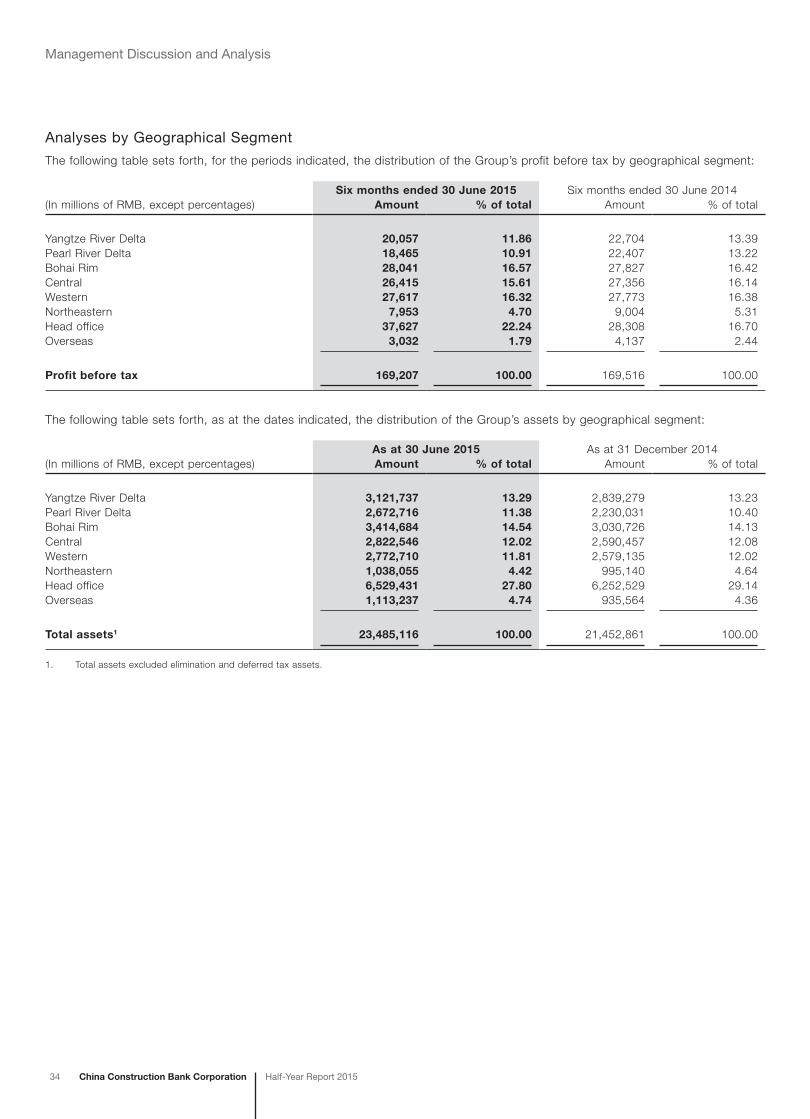
34 China Construction Bank Corporation Half-Year Report 2015
Management Discussion and Analysis
Analyses by Geographical Segment
The following table sets forth, for the periods indicated, the distribution of the Group’s profit before tax by geographical segment:
(In millions of RMB, except percentages)Six months ended 30 June 2015 Six months ended 30 June 2014
Amount % of total Amount % of total
Yangtze River Delta 20,057 11.86 22,704 13.39Pearl River Delta 18,465 10.91 22,407 13.22Bohai Rim 28,041 16.57 27,827 16.42Central 26,415 15.61 27,356 16.14Western 27,617 16.32 27,773 16.38Northeastern 7,953 4.70 9,004 5.31Head office 37,627 22.24 28,308 16.70Overseas 3,032 1.79 4,137 2.44
Profit before tax 169,207 100.00 169,516 100.00
The following table sets forth, as at the dates indicated, the distribution of the Group’s assets by geographical segment:
(In millions of RMB, except percentages)As at 30 June 2015 As at 31 December 2014Amount % of total Amount % of total
Yangtze River Delta 3,121,737 13.29 2,839,279 13.23Pearl River Delta 2,672,716 11.38 2,230,031 10.40Bohai Rim 3,414,684 14.54 3,030,726 14.13Central 2,822,546 12.02 2,590,457 12.08Western 2,772,710 11.81 2,579,135 12.02Northeastern 1,038,055 4.42 995,140 4.64Head office 6,529,431 27.80 6,252,529 29.14Overseas 1,113,237 4.74 935,564 4.36
Total assets1 23,485,116 100.00 21,452,861 100.00
1. Total assets excluded elimination and deferred tax assets.

China Construction Bank CorporationHalf-Year Report 2015 35
Management Discussion and Analysis
The following table sets forth, as at the dates indicated, the distribution of the Group’s loans and NPLs by geographical segment:
As at 30 June 2015 As at 31 December 2014(In millions of RMB, except percentages)
Loans and advances
% of total NPLs
NPL ratio (%)
Loans and advances
% of total NPLs
NPL ratio (%)
Yangtze River Delta 1,950,372 19.20 46,959 2.41 1,877,906 19.82 39,321 2.09Pearl River Delta 1,396,008 13.74 26,226 1.88 1,299,615 13.72 17,719 1.36Bohai Rim 1,728,682 17.02 14,848 0.86 1,633,965 17.25 10,860 0.66Central 1,672,413 16.47 16,307 0.98 1,552,809 16.39 14,671 0.94Western 1,752,831 17.26 18,727 1.07 1,641,394 17.32 13,039 0.79Northeastern 595,695 5.86 12,214 2.05 562,403 5.94 8,471 1.51Head office 370,740 3.65 4,333 1.17 342,476 3.61 3,250 0.95Overseas 690,338 6.80 4,745 0.69 563,955 5.95 5,840 1.04
Gross loans and advances to customers 10,157,079 100.00 144,359 1.42 9,474,523 100.00 113,171 1.19
The following table sets forth, as at the dates indicated, the distribution of the Group’s deposits by geographical segment:
(In millions of RMB, except percentages)As at 30 June 2015 As at 31 December 2014Amount % of total Amount % of total
Yangtze River Delta 2,494,050 18.21 2,401,640 18.62Pearl River Delta 2,048,015 14.95 1,873,077 14.52Bohai Rim 2,562,877 18.71 2,344,928 18.18Central 2,632,860 19.22 2,457,370 19.05Western 2,597,889 18.97 2,457,312 19.05Northeastern 965,170 7.05 932,976 7.23Head office 36,302 0.26 43,358 0.34Overseas 359,814 2.63 388,014 3.01
Total deposits from customers 13,696,977 100.00 12,898,675 100.00

36 China Construction Bank Corporation Half-Year Report 2015
Management Discussion and Analysis
Distribution Channels and Transformation of Outlets
Channels ConstructionThe Bank has an extensive distribution network. Through branches and sub-branches, self-service facilities, specialised service entities across the country and electronic banking service platform, the Bank provides its customers with convenient and high quality banking services.
At the end of June, the Bank had a total of 14,877 domestic operating outlets, including the head office, 37 tier-one branches, 328 tier-two branches, 11,799 sub-branches, 2,711 entities under the sub-branches and one specialised credit card centre at the head office. The number of operating outlets increased by 21 over the end of last year. The operating outlets were mainly distributed in large cities, central cities, top counties and rich towns. In the first half of 2015, the Bank accumulatively started 363 renovation projects of outlets, further improving physical environment and customer experience at the outlets and optimising the laying-out of outlets.
At the end of June, the Bank’s total number of private banking centres and wealth management centres in operation reached 338; the number of small business operating centres in the form of “Credit Factory” reached 288, covering 227 cities at the prefecture level; the number of personal loan centres exceeded 1,500, and the overall layout was improved with growing brand influence. Following the example of its first smart bank in Qianhai, Shenzhen, the Bank successfully opened more smart banks in 11 cities across China, including Beijing, Shanghai and Guangzhou, delivering unprecedented experience to customers at outlets.
The Bank strove to develop electronic banking under the principle of being “intelligent, ubiquitous and cross-industry”, focused foremost on mobile banking in product deployment and customer development, and reinforced channel synergy and business collaboration at the enterprise level, aiming for complete coverage of all customers and all-round enhancement of customer service capability. The electronic banking business has maintained fast and sound development. At the end of June, the volume of accounting transactions through electronic banking and self-service channel accounted for 94.32% of that through all channels, up by 6.29 percentage points over the end of last year.
Mobile finance
With the additional functions of e-account and “e-lutong for bank-securities”, the Bank supported purchase of wealth management products and opening of stock trading accounts through personal mobile banking. The Bank added new options for users to choose their favoured payment items in the “Joy Life” module. The Bank also launched Pad banking and corporate mobile banking services. At the end of June, the number of mobile banking customers was 163.63 million, up by 11.47% over the end of last year; the transaction volume was RMB5.78 trillion, a year-on-year increase of 82.18%; and the number of transactions was 2,827 million, a year-on-year increase of 167.08%. The number of SMS financial service customers reached 267.44 million, an increase of 9.97% over the end of last year. The number of WeChat banking customers was 20.66 million, of which 13.67 million customers followed the Bank’s WeChat official account and attached their bank accounts.
Online banking
The Bank’s personal online banking added new functions including large-denomination certificates of deposit, integrated personal assets and liabilities statement and donation to designated accounts, and optimised the transfer and modification contracting functions of “Xincunguan” module to support one-to-many transactions of accounts. For corporate online banking, the Bank launched an exclusive version for major customers to meet their special demands. Moreover, the Bank steadily advanced its overseas online banking presence with the offering of online customer service through the online banking portal of Macau Branch. At the end of June, the number of personal online banking customers increased by 8.19% to 193.32 million over the end of last year; the transaction volume was RMB23.70 trillion, a year-on-year increase of 21.16%; and the number of transactions was 6,907 million, a year-on-year increase of 179.32%. The number of corporate online banking customers reached 3.66 million, an increase of 10.78% over the end of last year; the transaction volume was RMB82.31 trillion, a year-on-year increase of 38.09%; and the number of transactions was 1.34 billion, a year-on-year increase of 29.09%.

China Construction Bank CorporationHalf-Year Report 2015 37
Management Discussion and Analysis
E.ccb.com
The “e.ccb.com” website introduced its exquisite mobile platform by formally launching the mobile APP of retail mall, i.e., “CCB e-commerce Mall”. It introduced the function of direct shopping with credit card bonus points, which was widely promoted on the Bank’s internet website and in the online banking advertisements. At the end of June, “e.ccb.com” developed 57.20 thousand merchants and 11.93 million members accumulatively. The transaction volume totalled RMB29,404 million in the first half of 2015, a year-on-year increase of 53.56%.
Telephone banking
The Bank proactively built its telephone banking service system at the enterprise level, focused on promoting diversified service channels and intelligentised service modes, continuously optimised business structure and enriched service offerings. At the end of June, the number of telephone banking customers was 189.99 million, an increase of 15.97 million, or 9.18% over the end of last year.
Self-service banking
The Bank continuously expanded the self-service channels, accelerated the deployment of self-service equipment in the counties, optimised the layout of channels, and extended the scope of services. The Bank refined the management over self-service equipment and optimised equipment functions. At the end of June, there were 84,616 ATMs with cash service in operation, an increase of 3,549 over the end of last year. There were 22,541 self-service banks in operation, an increase of 1,267.
Transformation of OutletsThe Bank vigorously pushed forward the building of integrated outlets, alleviated the burden for thousands of frontline staff and promoted the transformation of comprehensive marketing services. By making innovations in integrated management of outlets, the Bank effectively enhanced resource utilisation efficiency of outlets and comprehensively improved their financial service capability and customer satisfaction.
Centring on the customers, the Bank strove to develop the platform of outlets with comprehensive services. The Bank pushed forward the transformation of its single-function business outlets and promoted the integrated teller system to provide more accessible and convenient services for its customers. At the end of June, the integrated outlets increased to 14,400, and the percentage of integrated teller rose to 84%. Customers can enjoy the convenient and comfortable “one-stop” services at the transformed outlets.
With its coordination mechanism as a guarantee, the Bank developed an outlet service system featuring “targeted marketing, collaborative services, and integrated solutions”. At the end of June, the Bank established 19,934 integrated marketing teams to carry out collaborative marketing and established the foundational collaborative marketing mechanism among posts within outlets, teams, outlets and their supervising authorities, and specialised centres. As a result, the comprehensive marketing service ability was significantly strengthened at the outlets; customers can enjoy the thoughtful, “all-round” and “high-quality” services at the outlets.
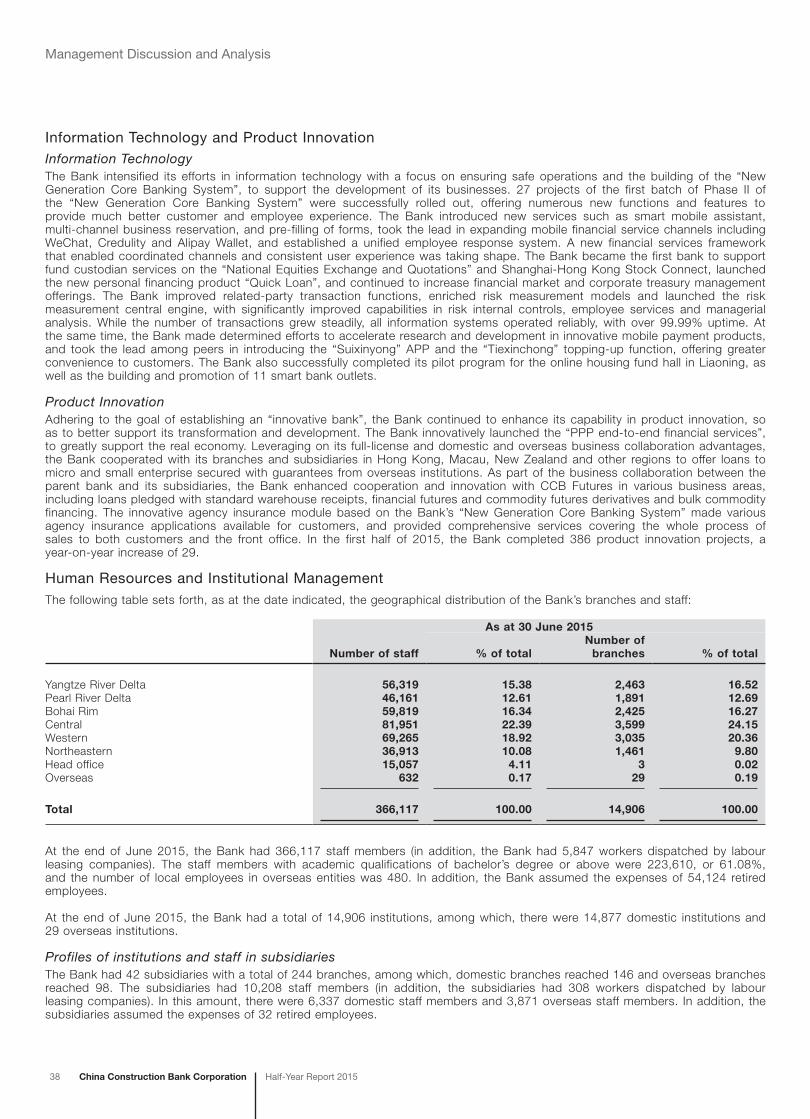
38 China Construction Bank Corporation Half-Year Report 2015
Management Discussion and Analysis
Information Technology and Product InnovationInformation TechnologyThe Bank intensified its efforts in information technology with a focus on ensuring safe operations and the building of the “New Generation Core Banking System”, to support the development of its businesses. 27 projects of the first batch of Phase II of the “New Generation Core Banking System” were successfully rolled out, offering numerous new functions and features to provide much better customer and employee experience. The Bank introduced new services such as smart mobile assistant, multi-channel business reservation, and pre-filling of forms, took the lead in expanding mobile financial service channels including WeChat, Credulity and Alipay Wallet, and established a unified employee response system. A new financial services framework that enabled coordinated channels and consistent user experience was taking shape. The Bank became the first bank to support fund custodian services on the “National Equities Exchange and Quotations” and Shanghai-Hong Kong Stock Connect, launched the new personal financing product “Quick Loan”, and continued to increase financial market and corporate treasury management offerings. The Bank improved related-party transaction functions, enriched risk measurement models and launched the risk measurement central engine, with significantly improved capabilities in risk internal controls, employee services and managerial analysis. While the number of transactions grew steadily, all information systems operated reliably, with over 99.99% uptime. At the same time, the Bank made determined efforts to accelerate research and development in innovative mobile payment products, and took the lead among peers in introducing the “Suixinyong” APP and the “Tiexinchong” topping-up function, offering greater convenience to customers. The Bank also successfully completed its pilot program for the online housing fund hall in Liaoning, as well as the building and promotion of 11 smart bank outlets.
Product InnovationAdhering to the goal of establishing an “innovative bank”, the Bank continued to enhance its capability in product innovation, so as to better support its transformation and development. The Bank innovatively launched the “PPP end-to-end financial services”, to greatly support the real economy. Leveraging on its full-license and domestic and overseas business collaboration advantages, the Bank cooperated with its branches and subsidiaries in Hong Kong, Macau, New Zealand and other regions to offer loans to micro and small enterprise secured with guarantees from overseas institutions. As part of the business collaboration between the parent bank and its subsidiaries, the Bank enhanced cooperation and innovation with CCB Futures in various business areas, including loans pledged with standard warehouse receipts, financial futures and commodity futures derivatives and bulk commodity financing. The innovative agency insurance module based on the Bank’s “New Generation Core Banking System” made various agency insurance applications available for customers, and provided comprehensive services covering the whole process of sales to both customers and the front office. In the first half of 2015, the Bank completed 386 product innovation projects, a year-on-year increase of 29.
Human Resources and Institutional ManagementThe following table sets forth, as at the date indicated, the geographical distribution of the Bank’s branches and staff:
As at 30 June 2015
Number of staff % of totalNumber of
branches % of total
Yangtze River Delta 56,319 15.38 2,463 16.52Pearl River Delta 46,161 12.61 1,891 12.69Bohai Rim 59,819 16.34 2,425 16.27Central 81,951 22.39 3,599 24.15Western 69,265 18.92 3,035 20.36Northeastern 36,913 10.08 1,461 9.80Head office 15,057 4.11 3 0.02Overseas 632 0.17 29 0.19
Total 366,117 100.00 14,906 100.00
At the end of June 2015, the Bank had 366,117 staff members (in addition, the Bank had 5,847 workers dispatched by labour leasing companies). The staff members with academic qualifications of bachelor’s degree or above were 223,610, or 61.08%, and the number of local employees in overseas entities was 480. In addition, the Bank assumed the expenses of 54,124 retired employees.
At the end of June 2015, the Bank had a total of 14,906 institutions, among which, there were 14,877 domestic institutions and 29 overseas institutions.
Profiles of institutions and staff in subsidiariesThe Bank had 42 subsidiaries with a total of 244 branches, among which, domestic branches reached 146 and overseas branches reached 98. The subsidiaries had 10,208 staff members (in addition, the subsidiaries had 308 workers dispatched by labour leasing companies). In this amount, there were 6,337 domestic staff members and 3,871 overseas staff members. In addition, the subsidiaries assumed the expenses of 32 retired employees.
China Construction Bank CorporationHalf-Year Report 2015 39
Management Discussion and Analysis
Risk Management
In the first half of 2015, the Bank made solid efforts in enhancing its comprehensive risk management, firmly held the bottom lines for systematic and regional risks, further improved the level of professionalism in managing various risks, and maintained a stable and controllable risk status at the Group level.
Credit Risk Management
Credit risk represents the potential loss that may arise from the failure of a debtor or counterparty to meet its obligation or commitment to the Bank.
In the first half of 2015, the Bank reinforced its management and control over credit risk, continuously optimised credit policies, improved credit procedures and systems, and enhanced credit risk management capability.
Optimising credit policies and systems and adjusting credit structures. Pursuant to the three major strategies of “One Belt and One Road”, “Coordinated Development for the Beijing-Tianjin-Hebei Region”, and “Yangtze River Economic Belt”, the Bank formulated and implemented credit policies supportive to the major national strategies. The Bank pushed ahead with the construction of loan review and disbursement centres, improved the system of end-to-end lending process, and strengthened the building of credit system. By applying differentiated management of 21 industries in different regions, the Bank improved the refined management of its credit policies. The Bank also further identified its key areas of credit lending and strengthened credit support to small enterprises
Improving credit approval mechanism and processes to enhance management and control over risks in credit granting. The Bank established a unified limit management mechanism at the Group level to prevent several-for-one and excessive credit granting. It further improved the system of authorisation over credit approval for overseas institutions, to strike the balance between overseas business expansion and risk management. The Bank continued to promote the specialisation of credit approval, and comprehensively implemented refined management of loan withdrawal approval. It also strengthened the monitoring and supervision over credit operations, made greater efforts for dynamic management of authorisation over credit approval and further enhanced risk management and control in key areas.
Reinforcing the disposal of NPLs to increase the stability of asset quality. The Bank employed a variety of methods in NPLs disposal, with an emphasis on increasing the proportion of cash recoverability, revitalising and upgrading NPLs. The Bank also improved the disposal efficiency by leveraging on the scale effect of batch disposal and market-driven disposal and setting feasible goals for overall write-offs. The Bank complied with laws and regulations, introduced early involvement of audit and adopted long-term management solutions based on experience and case studies, so as to facilitate the constant improvement of business process and management system.
Optimising risk measuring tools and techniques to promote transformation and development. The Bank optimised its customer-rating model to more accurately reflect changes in customers’ risk profiles under the economic “new normal”. The Bank strengthened its capacity of information technology control of risks, by enhancing the support of its IT system for risk measurement and business development and transformation. The Bank carried out multi-dimensional comprehensive and specialised stress tests to reinforce prevention and control of systemic risk. It optimised the economic capital measurement and limit management system, and effectively communicated its risk appetite to promote structural adjustments and risk returns.
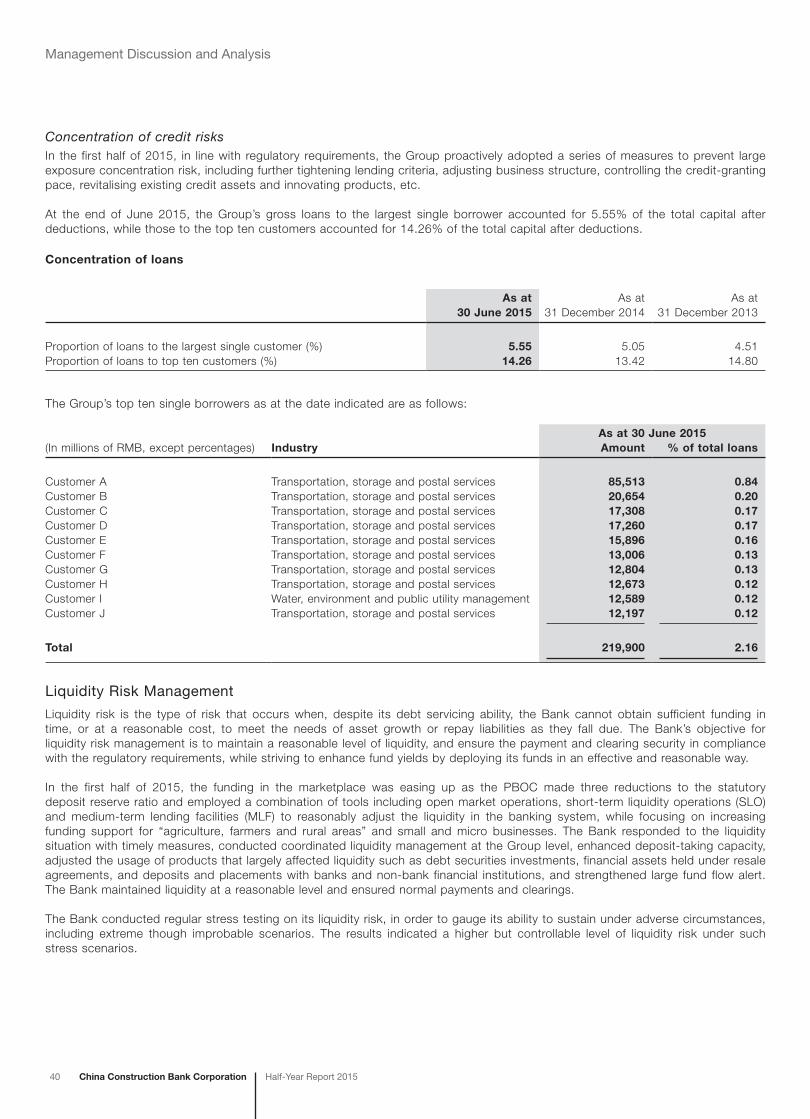
40 China Construction Bank Corporation Half-Year Report 2015
Management Discussion and Analysis
Concentration of credit risksIn the first half of 2015, in line with regulatory requirements, the Group proactively adopted a series of measures to prevent large exposure concentration risk, including further tightening lending criteria, adjusting business structure, controlling the credit-granting pace, revitalising existing credit assets and innovating products, etc.
At the end of June 2015, the Group’s gross loans to the largest single borrower accounted for 5.55% of the total capital after deductions, while those to the top ten customers accounted for 14.26% of the total capital after deductions.
Concentration of loans
As at 30 June 2015
As at 31 December 2014
As at 31 December 2013
Proportion of loans to the largest single customer (%) 5.55 5.05 4.51Proportion of loans to top ten customers (%) 14.26 13.42 14.80
The Group’s top ten single borrowers as at the date indicated are as follows:
(In millions of RMB, except percentages) IndustryAs at 30 June 2015Amount % of total loans
Customer A Transportation, storage and postal services 85,513 0.84Customer B Transportation, storage and postal services 20,654 0.20Customer C Transportation, storage and postal services 17,308 0.17Customer D Transportation, storage and postal services 17,260 0.17Customer E Transportation, storage and postal services 15,896 0.16Customer F Transportation, storage and postal services 13,006 0.13Customer G Transportation, storage and postal services 12,804 0.13Customer H Transportation, storage and postal services 12,673 0.12Customer I Water, environment and public utility management 12,589 0.12Customer J Transportation, storage and postal services 12,197 0.12
Total 219,900 2.16
Liquidity Risk Management
Liquidity risk is the type of risk that occurs when, despite its debt servicing ability, the Bank cannot obtain sufficient funding in time, or at a reasonable cost, to meet the needs of asset growth or repay liabilities as they fall due. The Bank’s objective for liquidity risk management is to maintain a reasonable level of liquidity, and ensure the payment and clearing security in compliance with the regulatory requirements, while striving to enhance fund yields by deploying its funds in an effective and reasonable way.
In the first half of 2015, the funding in the marketplace was easing up as the PBOC made three reductions to the statutory deposit reserve ratio and employed a combination of tools including open market operations, short-term liquidity operations (SLO) and medium-term lending facilities (MLF) to reasonably adjust the liquidity in the banking system, while focusing on increasing funding support for “agriculture, farmers and rural areas” and small and micro businesses. The Bank responded to the liquidity situation with timely measures, conducted coordinated liquidity management at the Group level, enhanced deposit-taking capacity, adjusted the usage of products that largely affected liquidity such as debt securities investments, financial assets held under resale agreements, and deposits and placements with banks and non-bank financial institutions, and strengthened large fund flow alert. The Bank maintained liquidity at a reasonable level and ensured normal payments and clearings.
The Bank conducted regular stress testing on its liquidity risk, in order to gauge its ability to sustain under adverse circumstances, including extreme though improbable scenarios. The results indicated a higher but controllable level of liquidity risk under such stress scenarios.

China Construction Bank CorporationHalf-Year Report 2015 41
Management Discussion and Analysis
The following table sets forth the liquidity ratios and liquidity coverage ratio of the Group as at the dates indicated:
(%)Regulatory
standardAs at
30 June 2015As at
31 December 2014As at
31 December 2013
Liquidity ratio 1 RMB ≥25 43.93 48.88 46.57Foreign currency ≥25 60.41 57.03 55.20
Liquidity coverage ratio 2, 3 RMB and foreign currency 126.47 N/A N/A
1. Calculated by dividing current assets by current liabilities in accordance with the requirements of the CBRC.
2. Monthly liquidity coverage ratio was calculated by dividing qualified and high quality liquid assets by net cash outflow in the next 30 days. The average of monthly liquidity coverage ratio in this quarter was calculated in compliance with the current applicable regulatory requirements, definition and accounting standards; comparative figures were not adjusted retrospectively.
3. In accordance with the requirements of the Administrative Measures for Liquidity Risk Management of Commercial Banks (Provisional), the liquidity coverage ratio of commercial banks shall reach 100% by the end of 2018. During the transitional period, such ratio shall reach 70%, 80% and 90% by the end of 2015, 2016 and 2017 respectively.
The analysis of the remaining maturities of the Group’s assets and liabilities as at the balance sheet date is set out below:
(In millions of RMB) IndefiniteRepayable on
demandWithin one
month
Between one and
three months
Between three months and one year
Between one and
five yearsMore than five years Total
Long/(short) position as at 30 June 2015 2,677,682 (8,135,732) (550,932) (68,545) 345,763 2,628,418 4,415,796 1,312,450
Long/(short) position as at 31 December 2014 2,753,260 (6,860,135) (812,721) (516,913) (235,800) 2,738,043 4,186,629 1,252,363
The Group regularly monitors the gap between its assets and liabilities under various maturities classes in order to assess its liquidity risk during different periods. As at 30 June 2015, the accumulated gap of various maturities classes of the Group was RMB1,312,450 million, an increase of RMB60,087 million over the end of 2014. Despite the negative gap for repayment on demand totalling RMB8,135,732 million, the Group was expected to enjoy a stable funding source and maintain stable liquidity in the future given its strong and expansive deposit customer base, relatively stable core demand deposits, and steady growth in deposits.
Market Risk Management
Market risk is the risk of loss in respect of the Group’s on and off-balance sheet activities, arising from adverse movements in market rates, including interest rates, foreign exchange rates, commodity prices and stock prices.
In the first half of 2015, the Bank strengthened efforts in the transformation of market risk management by optimising policies and systems, innovating management methods and improving management tools, and constantly enhanced its market risk management capability. Specifically, the Bank enacted market risk policies and limit management schemes for the year 2015, clarified the orientation of market risk policies and risk tolerance limits, and optimised policies and procedures for trader management, market risk limit management and market risk emergency management; continuously advanced analyses and control of risk events for financial market business, established whole-process proactive risk management models and improved risk assessment of new products in the financial market; strengthened early warning and monitoring of key market risk events, provided timely risk warnings and put forward countermeasures in line with business situations; established and improved the risk management system for trading business, completed verification of supporting system for internal models approach and structured product pricing models, and improved its overall capability for market risk measurement.

42 China Construction Bank Corporation Half-Year Report 2015
Management Discussion and Analysis
Value at Risk analysisThe Bank divides on and off-balance sheet assets and liabilities into two major categories, namely the trading book and the banking book. The Bank performs VaR analysis on its trading portfolio to measure and monitor the potential losses that could occur on risk positions taken, due to movements in market interest rates, foreign exchange rates and other market prices. The Bank calculates the VaR of RMB and foreign currency trading portfolios on a daily basis (at a confidence level of 99% and with a holding period of one-day).
The VaR analysis on the Bank’s trading portfolio as at the balance sheet dates and for relevant periods is as follows:
Six months ended 30 June 2015 Six months ended 30 June 2014
(In millions of RMB)As at
30 June Average Maximum MinimumAs at
30 June Average Maximum Minimum
VaR of trading portfolio 68 76 197 49 47 84 137 47 – Interest rate risk 48 37 172 17 24 31 115 9 – Foreign exchange risk 64 62 104 13 39 75 119 38 – Commodity risk 3 2 9 – – 1 5 –
Interest rate risk managementInterest rate risk is the risk of loss in the overall income and economic value of the banking book as a result of adverse movements in interest rates, term structure and other interest-related factors. Repricing risk and basis risk arising from mismatch of term structure and pricing basis of assets and liabilities are the primary sources of interest rate risk for the Bank, while yield curve risk and option risk have relatively less impact. The overall objective of the Bank’s interest rate risk management is to minimise the decrease of net interest income caused by interest rate changes, while keeping interest rate risk within a tolerable range in accordance with the risk appetite and risk management capability.
In the first half of 2015, the Bank kept close watch on the trends and changes in policies and market and proactively responded to the challenges of interest rate liberalisation. The Bank increased efforts in building its comprehensive pricing models and developing multi-layered comprehensive pricing applications to transform from single product-based pricing to comprehensive product pricing; continuously expanded the application of Loan Prime Rate (LPR) for more types of customers and products, narrowed the gap between LPR-based quotation and actual market interest rates, and improved the pass-through mechanism of loan interest rates; enriched channels to initiate liabilities by successfully launching products designed for interest rate liberalisation, such as large-denomination certificates of deposit. Meanwhile, the Bank measured interest rate risk by employing a host of methods such as interest rate sensitivity gap, net interest income sensitivity analysis and stress testing, conducted regular analysis and net interest income prediction, and reasonably designed the term structure and product structure of asset and liability portfolios, in order to maintain the overall interest rate risk within the set tolerable range.
Interest rate sensitivity gap analysis
The Group’s interest rate sensitivity gap, as at the dates indicated, by the next expected repricing dates or maturity dates (whichever occur earlier) is set out below:
(In millions of RMB)Non-interest-
bearingLess than
three months
Between three months and one year
Between one year and
five yearsMore than five years Total
Interest rate sensitivity gap as at 30 June 2015 77,721 (4,677,243) 4,832,702 (42,910) 1,122,180 1,312,450
Interest rate sensitivity gap as at 31 December 2014 5,990 (1,691,636) 1,720,743 153,774 1,063,492 1,252,363
As at 30 June 2015, the repricing gap of the Group’s assets and liabilities for a period less than one year was RMB155,459 million, an increase of RMB126,352 million over the end of last year, due to the decrease of re-pricing trading financial liabilities for a period less than one year and borrowings from the central banks. The Group’s positive gap for a period more than one year was RMB1,079,270 million, a decrease of RMB137,996 million, mainly due to the growth of long-term deposits.
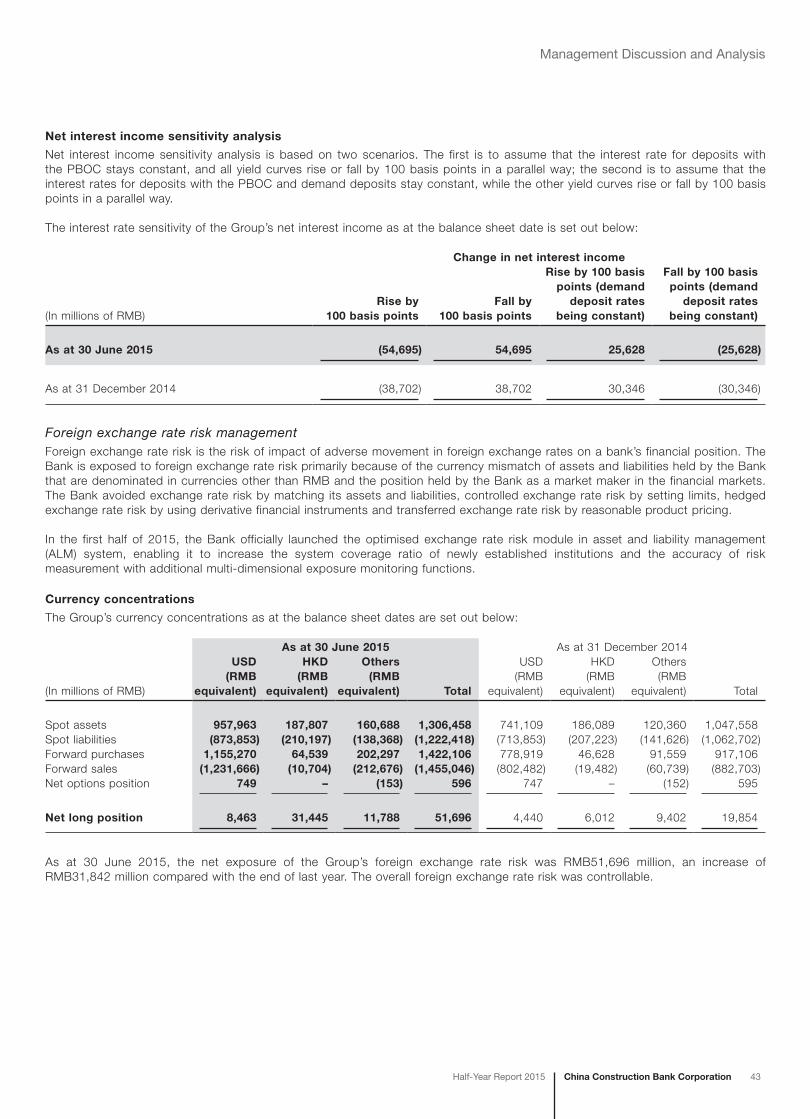
China Construction Bank CorporationHalf-Year Report 2015 43
Management Discussion and Analysis
Net interest income sensitivity analysis
Net interest income sensitivity analysis is based on two scenarios. The first is to assume that the interest rate for deposits with the PBOC stays constant, and all yield curves rise or fall by 100 basis points in a parallel way; the second is to assume that the interest rates for deposits with the PBOC and demand deposits stay constant, while the other yield curves rise or fall by 100 basis points in a parallel way.
The interest rate sensitivity of the Group’s net interest income as at the balance sheet date is set out below:
Change in net interest income
(In millions of RMB)Rise by
100 basis pointsFall by
100 basis points
Rise by 100 basis points (demand
deposit rates being constant)
Fall by 100 basis points (demand
deposit rates being constant)
As at 30 June 2015 (54,695) 54,695 25,628 (25,628)
As at 31 December 2014 (38,702) 38,702 30,346 (30,346)
Foreign exchange rate risk managementForeign exchange rate risk is the risk of impact of adverse movement in foreign exchange rates on a bank’s financial position. The Bank is exposed to foreign exchange rate risk primarily because of the currency mismatch of assets and liabilities held by the Bank that are denominated in currencies other than RMB and the position held by the Bank as a market maker in the financial markets. The Bank avoided exchange rate risk by matching its assets and liabilities, controlled exchange rate risk by setting limits, hedged exchange rate risk by using derivative financial instruments and transferred exchange rate risk by reasonable product pricing.
In the first half of 2015, the Bank officially launched the optimised exchange rate risk module in asset and liability management (ALM) system, enabling it to increase the system coverage ratio of newly established institutions and the accuracy of risk measurement with additional multi-dimensional exposure monitoring functions.
Currency concentrations
The Group’s currency concentrations as at the balance sheet dates are set out below:
As at 30 June 2015 As at 31 December 2014
(In millions of RMB)
USD (RMB
equivalent)
HKD (RMB
equivalent)
Others (RMB
equivalent) Total
USD (RMB
equivalent)
HKD (RMB
equivalent)
Others (RMB
equivalent) Total
Spot assets 957,963 187,807 160,688 1,306,458 741,109 186,089 120,360 1,047,558Spot liabilities (873,853) (210,197) (138,368) (1,222,418) (713,853) (207,223) (141,626) (1,062,702)Forward purchases 1,155,270 64,539 202,297 1,422,106 778,919 46,628 91,559 917,106Forward sales (1,231,666) (10,704) (212,676) (1,455,046) (802,482) (19,482) (60,739) (882,703)Net options position 749 – (153) 596 747 – (152) 595
Net long position 8,463 31,445 11,788 51,696 4,440 6,012 9,402 19,854
As at 30 June 2015, the net exposure of the Group’s foreign exchange rate risk was RMB51,696 million, an increase of RMB31,842 million compared with the end of last year. The overall foreign exchange rate risk was controllable.
44 China Construction Bank Corporation Half-Year Report 2015
Management Discussion and Analysis
Operational Risk Management
Operational risk is the risk of loss due to inadequate or flawed internal processes, staff and systems, or external events.
In the first half of 2015, the Bank continued to standardise and strengthen its operational risk management. The Bank constantly re-examined and dynamically adjusted incompatible positions (responsibilities) in response to risk changes, business innovations and process adjustments, and continuously strengthened the check and balance mechanism across departments and positions. The Bank further intensified the application of operational risk management tools, standardised and upgraded its ability in loss data management, continued to build and improve the system for monitoring and early warning of key risk indicators, and strengthened risk management and control of key risk areas and processes. The Bank conducted self-assessment of its overall business continuity management, and promoted business impact analysis of the new generation core banking system across the Bank, to ensure the safe and stable operation of its various business lines.
Anti-money LaunderingIn the first half of 2015, the Bank strictly enforced various anti-money laundering (AML) laws and regulations and regulatory policies, strengthened efforts in customer due diligence and reporting of large and suspicious transactions, actively launched AML training and publicity, and established preliminary mechanism for Group-wide AML risk assessment.
Reputational Risk Management
Reputational risk refers to the risk of negative impacts on or damages to the Bank’s overall image, reputation and brand value, arising when the Bank’s operational, managerial and other behaviours or contingencies are noticed or covered by the media.
In the first half of 2015, the Bank further enhanced its reputational risk management. In line with its transformation and development strategies, the Bank planned and implemented a “Foundation Consolidation Project” for reputational risk management, which involved a range of programmes aiming to improve policies and procedures, strengthen screening of reputational risk origins, enhance the overall response capability to public opinion, and provide reputational risk education and training for all staff members. The Bank also strengthened reputational risk studies and the formulation of early warnings and plans, established innovative ways to convey positive messages to the public, expanded channels and platforms, and actively communicated “Stories about CCB” to society, to create an open forum for public opinion.
Consolidated Management
Consolidated management means the Bank performs comprehensive and sustained management and control over corporate governance, capital and finance of the Group and its subsidiaries, with effective identification, measurement, monitoring and control of the Group’s overall risk profile.
In the first half of 2015, in accordance with the requirements of Guidelines on Consolidated Management and Supervision of Commercial Banks promulgated by the CBRC, the Bank continued to improve the overall consolidated management planning, constantly refined the management mechanism, tools, methods and systems, and enhanced the capability of consolidated management so as to effectively prevent risks arising from the Group’s cross-border and cross-sector activities. The Bank refined the organisational structure of consolidated management at the Group level, implemented the requirements for each and every consolidated management element, and regularly updated and released the consolidation management scope. The Bank strengthened the comprehensive risk management at the Group level, formulated the Group’s risk appetite, and established unified credit management system; optimised its annual plan for industry limit management, and strengthened concentration management over risks at the Group level; established internal transaction management system, and improved internal transaction management policies and procedures; reinforced guidance to subsidiaries with respect to capital management, and conducted continuous monitoring and analyses of the capital adequacy ratios of the Group; intensified monitoring of indicators of the Group’s liquidity risk limit to make overall fund allocation; and developed risk isolation system and improved mechanism to prevent risk contagion within the Group.
China Construction Bank CorporationHalf-Year Report 2015 45
Management Discussion and Analysis
Internal Audit
The Bank adheres to a relatively independent and vertically managed internal audit system. In order to promote the establishment of a sound and effective risk management mechanism, internal control system and corporate governance procedures, the Bank’s internal audit department evaluates the effectiveness of the internal controls and risk management, the effect of corporate governance procedures, the efficiency of business operations, and the economic responsibilities of relevant personnel, and puts forward suggestions for improvement based on its internal audit results.
In the first half of 2015, in accordance with the strategic transformation and changes in the operating environment, the internal audit department organised and carried out systemic audit projects, including dynamic audit and investigation of credit business, audit of connected relations of credit customers and related risks, audit of bad loans write-offs and packaged disposals, audit and investigation of effective customers marketing based on understanding of new characteristics in the movements of non-government funds, audit of main business operations and management of overseas institutions and subsidiaries, and audit of implementation of internal capital adequacy assessment procedures. Audit offices conducted selected audit projects based on actual situations of local branches, further expanding the coverage of audit projects. The internal audit department also made active efforts to explore opportunities for its own transformation and development, with greater focus on integration with the Bank’s operation and management, strengthened early warning and forecast of risks, and continued to enhance the quality of its audit recommendations to facilitate process optimisation, mechanism improvement and problem solving. It devoted greater efforts to promote the follow-up auditing on rectification and identification of accountability, so as to support the Bank’s transformation and development in a more effective way.
Capital Management
The Group has implemented the comprehensive capital management, which covers regulatory capital, economic capital and accounting capital management, including but not limited to management of capital adequacy ratio, capital planning, capital raising and economic capital.
In the first half of 2015, the Group continuously strengthened the fundamental capability of capital management and proactively promoted its business transformation towards more intensive utilisation of capital. As a result, the guiding and restraint functions of capital on business development were further upgraded.
The Group constantly enhanced its management over the execution of policies for the advanced approaches, and continued to deepen and broaden the application of internal rating results, pushing forward the constant improvement of refined capital management. By taking the opportunity arising from enhancing the implementation and application ability of the advanced approaches, the Group further improved the guiding and restraint mechanism of capital, performed in-depth analysis on the items of capital occupation and risk-weighted assets, pushed forward business structural optimisation, reduced ineffective capital occupation and constantly improved capital utilisation efficiency.
Analysis of Capital Adequacy Ratio
In accordance with the regulatory requirements, the Group has to calculate and disclose capital adequacy ratios simultaneously in accordance with the Capital Rules for Commercial Banks (Provisional) and the Measures for the Management of Capital Adequacy Ratios of Commercial Banks. The scope for calculating capital adequacy ratios includes both the Bank’s domestic and overseas branches and sub-branches, and financial subsidiaries (insurance companies excluded).
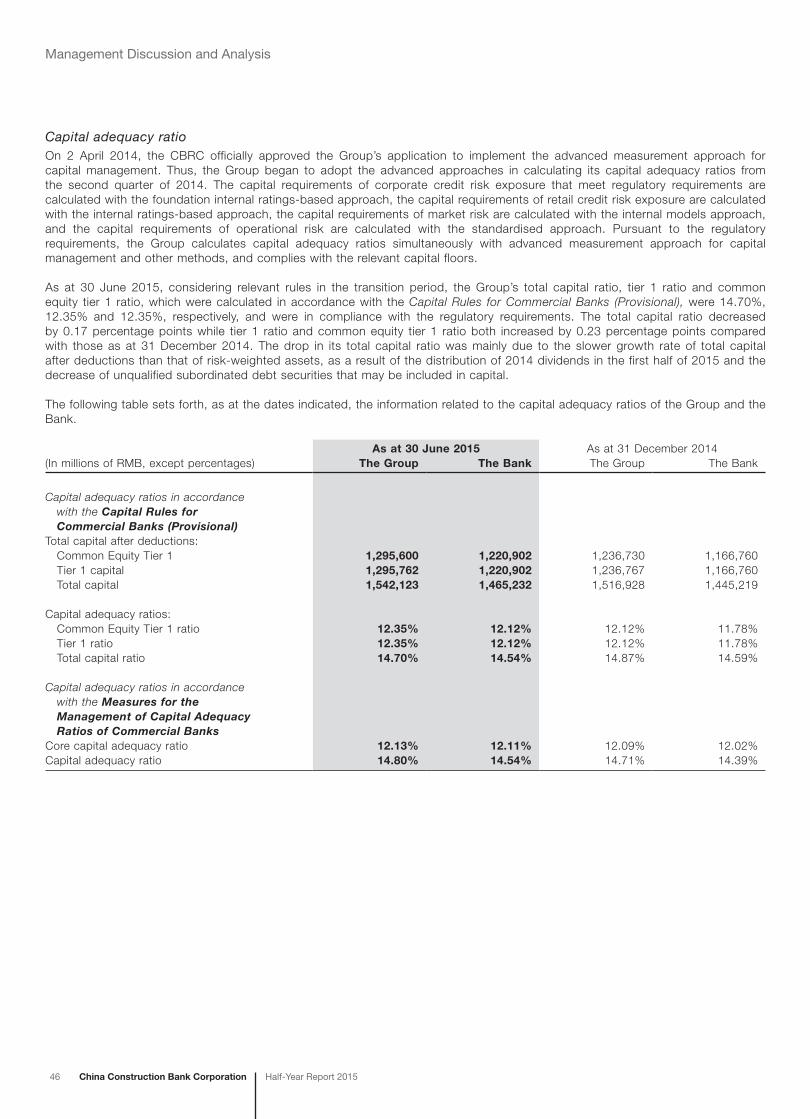
46 China Construction Bank Corporation Half-Year Report 2015
Management Discussion and Analysis
Capital adequacy ratioOn 2 April 2014, the CBRC officially approved the Group’s application to implement the advanced measurement approach for capital management. Thus, the Group began to adopt the advanced approaches in calculating its capital adequacy ratios from the second quarter of 2014. The capital requirements of corporate credit risk exposure that meet regulatory requirements are calculated with the foundation internal ratings-based approach, the capital requirements of retail credit risk exposure are calculated with the internal ratings-based approach, the capital requirements of market risk are calculated with the internal models approach, and the capital requirements of operational risk are calculated with the standardised approach. Pursuant to the regulatory requirements, the Group calculates capital adequacy ratios simultaneously with advanced measurement approach for capital management and other methods, and complies with the relevant capital floors.
As at 30 June 2015, considering relevant rules in the transition period, the Group’s total capital ratio, tier 1 ratio and common equity tier 1 ratio, which were calculated in accordance with the Capital Rules for Commercial Banks (Provisional), were 14.70%, 12.35% and 12.35%, respectively, and were in compliance with the regulatory requirements. The total capital ratio decreased by 0.17 percentage points while tier 1 ratio and common equity tier 1 ratio both increased by 0.23 percentage points compared with those as at 31 December 2014. The drop in its total capital ratio was mainly due to the slower growth rate of total capital after deductions than that of risk-weighted assets, as a result of the distribution of 2014 dividends in the first half of 2015 and the decrease of unqualified subordinated debt securities that may be included in capital.
The following table sets forth, as at the dates indicated, the information related to the capital adequacy ratios of the Group and the Bank.
(In millions of RMB, except percentages)As at 30 June 2015 As at 31 December 2014
The Group The Bank The Group The Bank
Capital adequacy ratios in accordance with the Capital Rules for Commercial Banks (Provisional)Total capital after deductions: Common Equity Tier 1 1,295,600 1,220,902 1,236,730 1,166,760 Tier 1 capital 1,295,762 1,220,902 1,236,767 1,166,760 Total capital 1,542,123 1,465,232 1,516,928 1,445,219
Capital adequacy ratios: Common Equity Tier 1 ratio 12.35% 12.12% 12.12% 11.78% Tier 1 ratio 12.35% 12.12% 12.12% 11.78% Total capital ratio 14.70% 14.54% 14.87% 14.59%
Capital adequacy ratios in accordance with the Measures for the Management of Capital Adequacy Ratios of Commercial BanksCore capital adequacy ratio 12.13% 12.11% 12.09% 12.02%Capital adequacy ratio 14.80% 14.54% 14.71% 14.39%
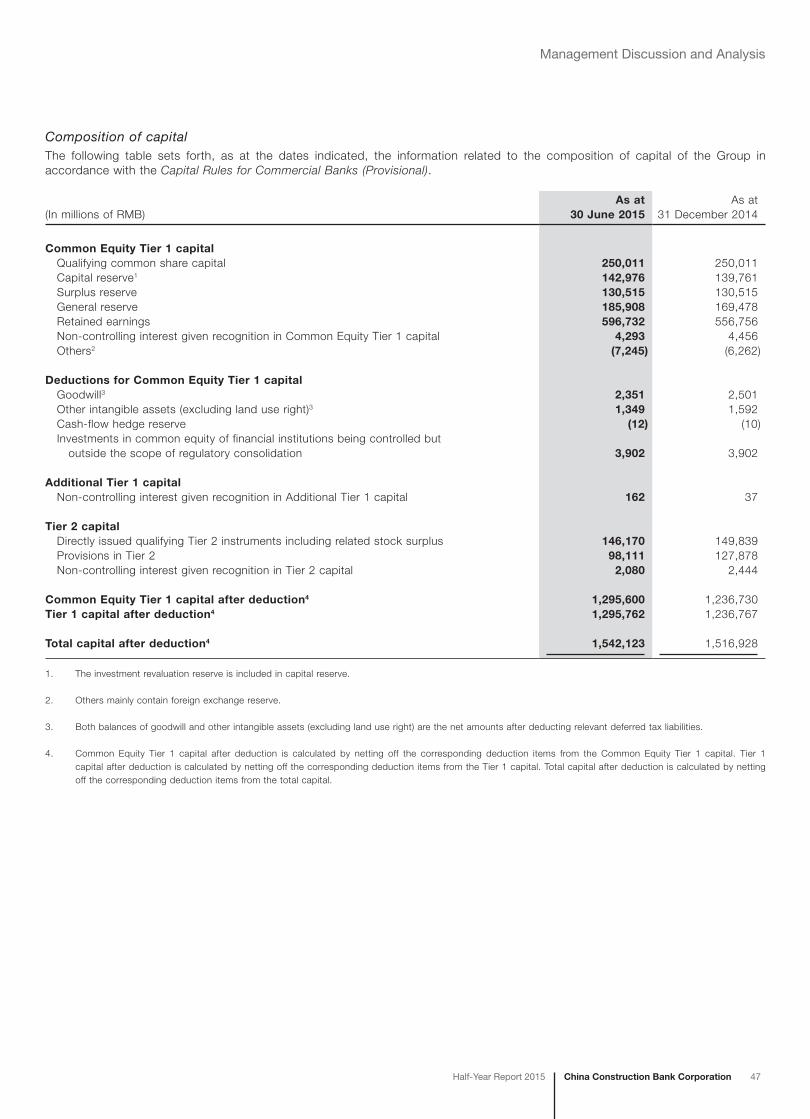
China Construction Bank CorporationHalf-Year Report 2015 47
Management Discussion and Analysis
Composition of capitalThe following table sets forth, as at the dates indicated, the information related to the composition of capital of the Group in accordance with the Capital Rules for Commercial Banks (Provisional).
(In millions of RMB)As at
30 June 2015As at
31 December 2014
Common Equity Tier 1 capital Qualifying common share capital 250,011 250,011 Capital reserve1 142,976 139,761 Surplus reserve 130,515 130,515 General reserve 185,908 169,478 Retained earnings 596,732 556,756 Non-controlling interest given recognition in Common Equity Tier 1 capital 4,293 4,456 Others2 (7,245) (6,262)
Deductions for Common Equity Tier 1 capital Goodwill3 2,351 2,501 Other intangible assets (excluding land use right)3 1,349 1,592 Cash-flow hedge reserve (12) (10) Investments in common equity of financial institutions being controlled but outside the scope of regulatory consolidation 3,902 3,902
Additional Tier 1 capital Non-controlling interest given recognition in Additional Tier 1 capital 162 37
Tier 2 capital Directly issued qualifying Tier 2 instruments including related stock surplus 146,170 149,839 Provisions in Tier 2 98,111 127,878 Non-controlling interest given recognition in Tier 2 capital 2,080 2,444
Common Equity Tier 1 capital after deduction4 1,295,600 1,236,730Tier 1 capital after deduction4 1,295,762 1,236,767
Total capital after deduction4 1,542,123 1,516,928
1. The investment revaluation reserve is included in capital reserve.
2. Others mainly contain foreign exchange reserve.
3. Both balances of goodwill and other intangible assets (excluding land use right) are the net amounts after deducting relevant deferred tax liabilities.
4. Common Equity Tier 1 capital after deduction is calculated by netting off the corresponding deduction items from the Common Equity Tier 1 capital. Tier 1 capital after deduction is calculated by netting off the corresponding deduction items from the Tier 1 capital. Total capital after deduction is calculated by netting off the corresponding deduction items from the total capital.

48 China Construction Bank Corporation Half-Year Report 2015
Management Discussion and Analysis
Risk-weighted assetsThe following table sets forth, as at the dates indicated, the information related to the risk-weighted assets of the Group in accordance with the Capital Rules for Commercial Banks (Provisional).
(In millions of RMB)As at
30 June 2015As at
31 December 2014
Credit risk-weighted assets 9,347,290 8,739,574
Covered by internal ratings-based approach 7,250,643 7,020,935 Uncovered by internal ratings-based approach 2,096,647 1,718,639
Market risk-weighted assets 62,373 54,302
Covered by internal models approach 34,771 35,137 Uncovered by internal models approach 27,602 19,165
Operational risk-weighted assets 915,727 915,727
Additional risk-weighted assets arising from the application of capital floors 165,259 494,040
Total risk-weighted assets 10,490,649 10,203,643
Credit risk exposureThe following table sets forth, as at the dates indicated, the information related to the credit risk exposure of the Group in accordance with the Capital Rules for Commercial Banks (Provisional).
(In millions of RMB)As at
30 June 2015As at
31 December 2014
Exposure at default
Exposure at default
Covered by internal ratings-based approach 10,233,798 9,751,490
Corporate risk exposure 7,089,169 6,869,764 Retail risk exposure 3,144,629 2,881,726
Risk exposure Risk exposureUncovered by internal ratings-based approach 9,727,038 8,564,059
On-balance sheet credit risks exposure 9,446,434 8,347,294 Of which: Securitisation risk exposure 4,155 5,304 Off-balance sheet credit risk exposure 235,885 188,639 Counterparty credit risk exposure 44,719 28,126

China Construction Bank CorporationHalf-Year Report 2015 49
Management Discussion and Analysis
Capital requirements of market risksThe Group’s capital requirements of market risks are calculated with the internal models approach. Requirements uncovered by the internal models approach are calculated with the standardised approach. The following table sets forth, as at the dates indicated, the information related to capital requirements of various market risks.
(In millions of RMB)
As at 30 June 2015
As at 31 December 2014
Capital requirements Capital requirements
Covered by internal models approach 2,782 2,811
Uncovered by internal models approach 2,208 1,533
Interest rate risk 686 1,052 Equity position risk 137 142 Foreign exchange risk 1,385 339 Commodity risk – – Option risk – –
Total 4,990 4,344
The following table sets forth, for the six months ended 30 June 2015, the information related to the value at risk (VaR) and stressed value at risk (stressed VaR) of market risks calculated with the internal models approach. The VaR and stressed VaR are calculated with historical simulation approach, whose historical observation periods are both one year with a holding period of ten days and at a confidence level of 99%. VaR and stressed VaR respectively reflect the maximum losses with probability calculated with the latest historical scenario and one-year historical scenario that exerts significant pressure on the Bank’s assets.
Six months ended 30 June 2015(In millions of RMB) Average Highest Lowest Period end
Value at risk (VaR) 286 1,432 115 232Stressed value at risk (Stressed VaR) 578 1,432 256 616
Equity risk exposure of banking bookThe following table sets forth, as at the dates indicated, the information related to the equity risk exposure of banking book and the unrealised potential risk gains or losses of the Group.
(In millions of RMB) As at 30 June 2015 As at 31 December 2014
Invested institution categories
Publicly traded
equity risk exposures1
Non-publicly traded
equity risk exposures1
Unrealised potential
risk gains or losses2
Publicly traded
equity risk exposures1
Non-publicly traded
equity risk exposures1
Unrealised potential
risk gains or losses2
Financial institutions 2,140 1,555 1,100 2,036 1,566 1,030Non-financial institutions 2,974 5,432 1,586 4,583 5,466 2,071
Total 5,114 6,987 2,686 6,619 7,032 3,101
1. Publicly traded equity risk exposures are the equity risk exposures of invested institutions that are listed companies. Non-publicly traded equity risk exposures are the equity risk exposures of invested institutions that are unlisted companies.
2. Unrealised potential risk gains or losses are the portion of gains or losses that have been recognised in the balance sheet but not in the income statement.
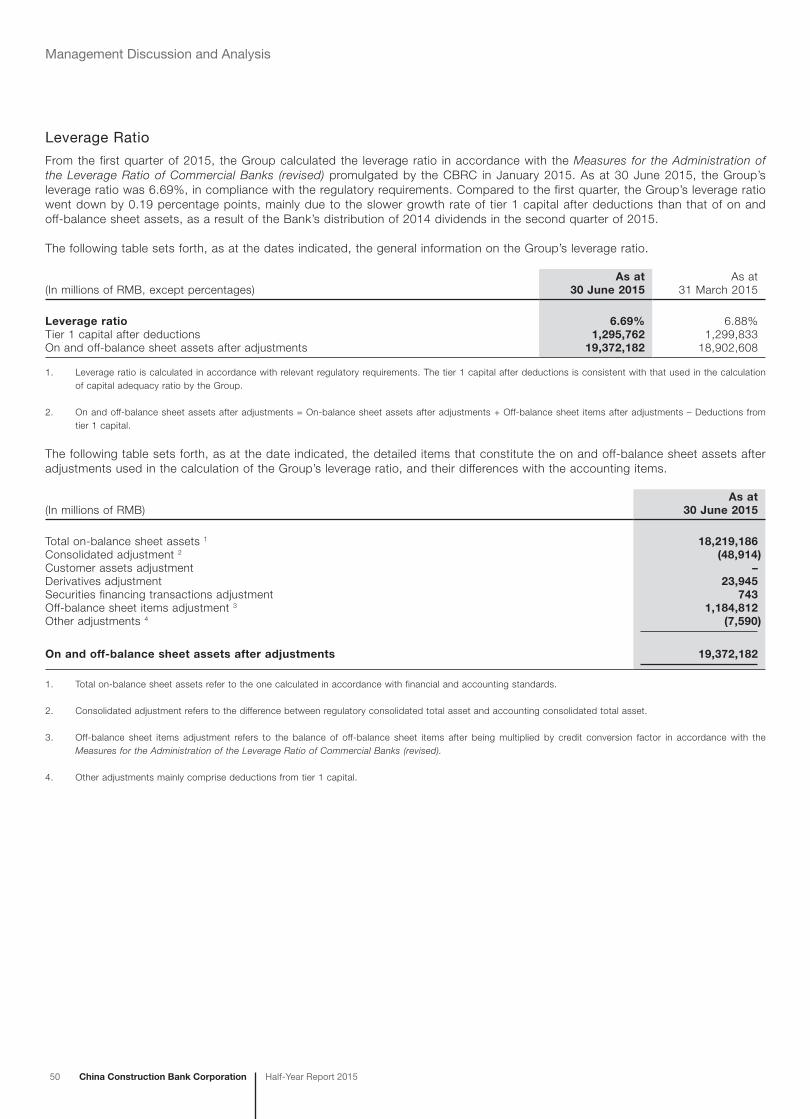
50 China Construction Bank Corporation Half-Year Report 2015
Management Discussion and Analysis
Leverage Ratio
From the first quarter of 2015, the Group calculated the leverage ratio in accordance with the Measures for the Administration of the Leverage Ratio of Commercial Banks (revised) promulgated by the CBRC in January 2015. As at 30 June 2015, the Group’s leverage ratio was 6.69%, in compliance with the regulatory requirements. Compared to the first quarter, the Group’s leverage ratio went down by 0.19 percentage points, mainly due to the slower growth rate of tier 1 capital after deductions than that of on and off-balance sheet assets, as a result of the Bank’s distribution of 2014 dividends in the second quarter of 2015.
The following table sets forth, as at the dates indicated, the general information on the Group’s leverage ratio.
(In millions of RMB, except percentages)As at
30 June 2015As at
31 March 2015
Leverage ratio 6.69% 6.88%Tier 1 capital after deductions 1,295,762 1,299,833On and off-balance sheet assets after adjustments 19,372,182 18,902,608
1. Leverage ratio is calculated in accordance with relevant regulatory requirements. The tier 1 capital after deductions is consistent with that used in the calculation of capital adequacy ratio by the Group.
2. On and off-balance sheet assets after adjustments = On-balance sheet assets after adjustments + Off-balance sheet items after adjustments – Deductions from tier 1 capital.
The following table sets forth, as at the date indicated, the detailed items that constitute the on and off-balance sheet assets after adjustments used in the calculation of the Group’s leverage ratio, and their differences with the accounting items.
(In millions of RMB)As at
30 June 2015
Total on-balance sheet assets 1 18,219,186Consolidated adjustment 2 (48,914)Customer assets adjustment –Derivatives adjustment 23,945Securities financing transactions adjustment 743Off-balance sheet items adjustment 3 1,184,812Other adjustments 4 (7,590)
On and off-balance sheet assets after adjustments 19,372,182
1. Total on-balance sheet assets refer to the one calculated in accordance with financial and accounting standards.
2. Consolidated adjustment refers to the difference between regulatory consolidated total asset and accounting consolidated total asset.
3. Off-balance sheet items adjustment refers to the balance of off-balance sheet items after being multiplied by credit conversion factor in accordance with the Measures for the Administration of the Leverage Ratio of Commercial Banks (revised).
4. Other adjustments mainly comprise deductions from tier 1 capital.
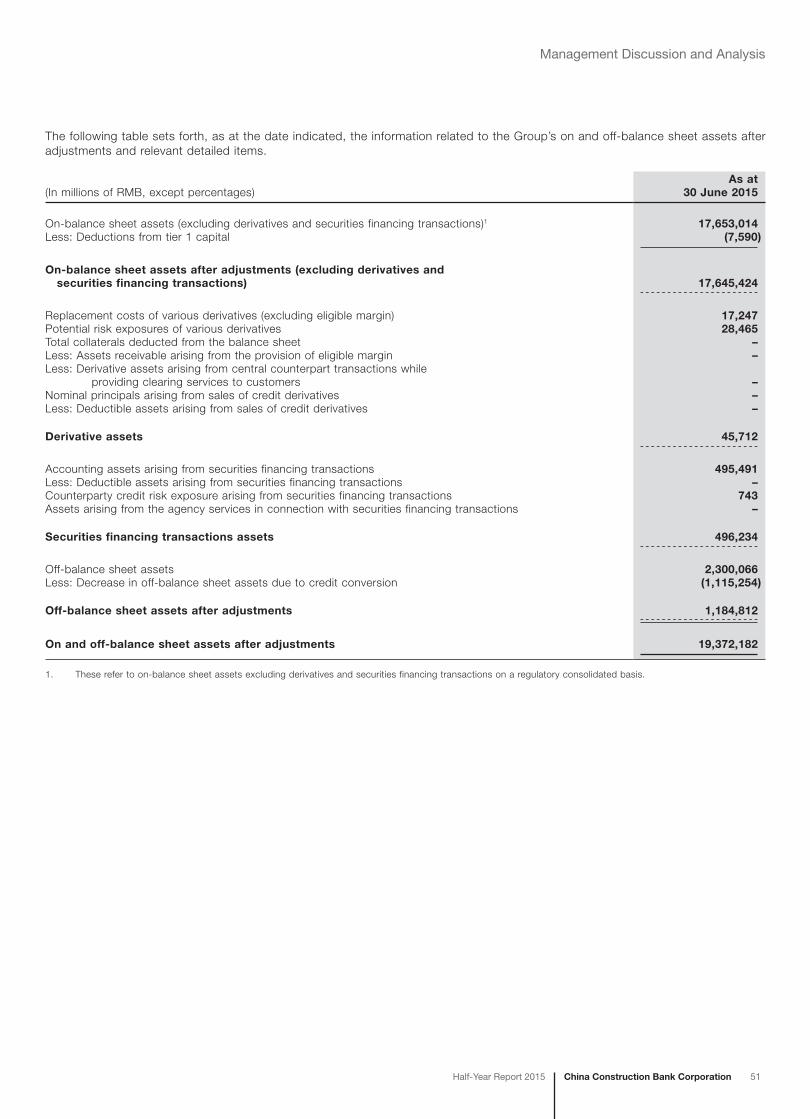
China Construction Bank CorporationHalf-Year Report 2015 51
Management Discussion and Analysis
The following table sets forth, as at the date indicated, the information related to the Group’s on and off-balance sheet assets after adjustments and relevant detailed items.
(In millions of RMB, except percentages)As at
30 June 2015
On-balance sheet assets (excluding derivatives and securities financing transactions)1 17,653,014Less: Deductions from tier 1 capital (7,590)
On-balance sheet assets after adjustments (excluding derivatives and securities financing transactions) 17,645,424
Replacement costs of various derivatives (excluding eligible margin) 17,247Potential risk exposures of various derivatives 28,465Total collaterals deducted from the balance sheet –Less: Assets receivable arising from the provision of eligible margin –Less: Derivative assets arising from central counterpart transactions while providing clearing services to customers –Nominal principals arising from sales of credit derivatives –Less: Deductible assets arising from sales of credit derivatives –
Derivative assets 45,712
Accounting assets arising from securities financing transactions 495,491Less: Deductible assets arising from securities financing transactions –Counterparty credit risk exposure arising from securities financing transactions 743Assets arising from the agency services in connection with securities financing transactions –
Securities financing transactions assets 496,234
Off-balance sheet assets 2,300,066Less: Decrease in off-balance sheet assets due to credit conversion (1,115,254)
Off-balance sheet assets after adjustments 1,184,812
On and off-balance sheet assets after adjustments 19,372,182
1. These refer to on-balance sheet assets excluding derivatives and securities financing transactions on a regulatory consolidated basis.
52 China Construction Bank Corporation Half-Year Report 2015
Management Discussion and Analysis
Prospects
In the second half of 2015, the global economy as a whole will continue its recovery, with complexity and differentiation being the main characteristics of world economic development in a relatively long period. Against the background of global adjustment, Chinese economy enters a “new normal” featuring the transformation of economic development model and economic structural adjustments. With the gradual unfolding of the influence of a series of national policies aiming at promoting steady growth and development, Chinese economy is expected to grow by 7% this year.
The banking industry faces both challenges and opportunities. With respect to challenges, as the economic growth slows down and certain businesses and industries suffer operational difficulties, the banking industry comes under pressure for maintaining the asset quality. Interest spread shows evident narrowing trend with greater pressure in profitability due to the promotion of interest rate liberalisation. Both foreign exchange risk and market risk increase as a result of volatile exchange rates and bulk commodity prices. On the other hand, the implementation of major strategies, such as “One Belt and One Road”, “Going Global”, “Coordinated Development for the Beijing-Tianjin-Hebei Region”, “Yangtze River Economic Belt”, free trade zones and regional revitalisation schemes, brings enormous business potentials and opportunities. The internationalisation of RMB facilitates the development of international and overseas businesses. The rapid development of domestic financial market creates new opportunities in asset management, transaction-related businesses, agency and intermediary services as well as subsidiary business for the banking industry.
In the second half of 2015, the Group will adhere to the strategy that focuses on customers and transformation to be better positioned to take advantages of opportunities arising from economic transformation and upgrading as well as introduction of various new policies, and further improve its ability in value creation and service delivery. Efforts will be made in the following areas. First, the Group will further deepen reforms and push forward the implementation of its transformation and development strategy. It will endeavor to provide comprehensive financial services for customers and accelerate the development of key businesses in financial market, asset management, treasury management, investment custody, credit card, pension and underwriting of debt securities. Second, the Group will continue to optimise its business operations and reasonably arrange the size and structure of its asset and liability portfolio. It will provide stronger support to the real economy by leveraging on its traditional competitive advantages to support the construction of national major projects and in key areas. Third, the Group will strengthen management to improve its pricing and innovation capabilities and enhance its service quality. Fourth, the Group will firmly hold the risk bottom line and strengthen risk management, to realise the transformation from passively responding to risk situations to proactively managing risks. With intensified efforts in risk screening and early warning, the Group will strive to mitigate risks while maintaining steady growth.
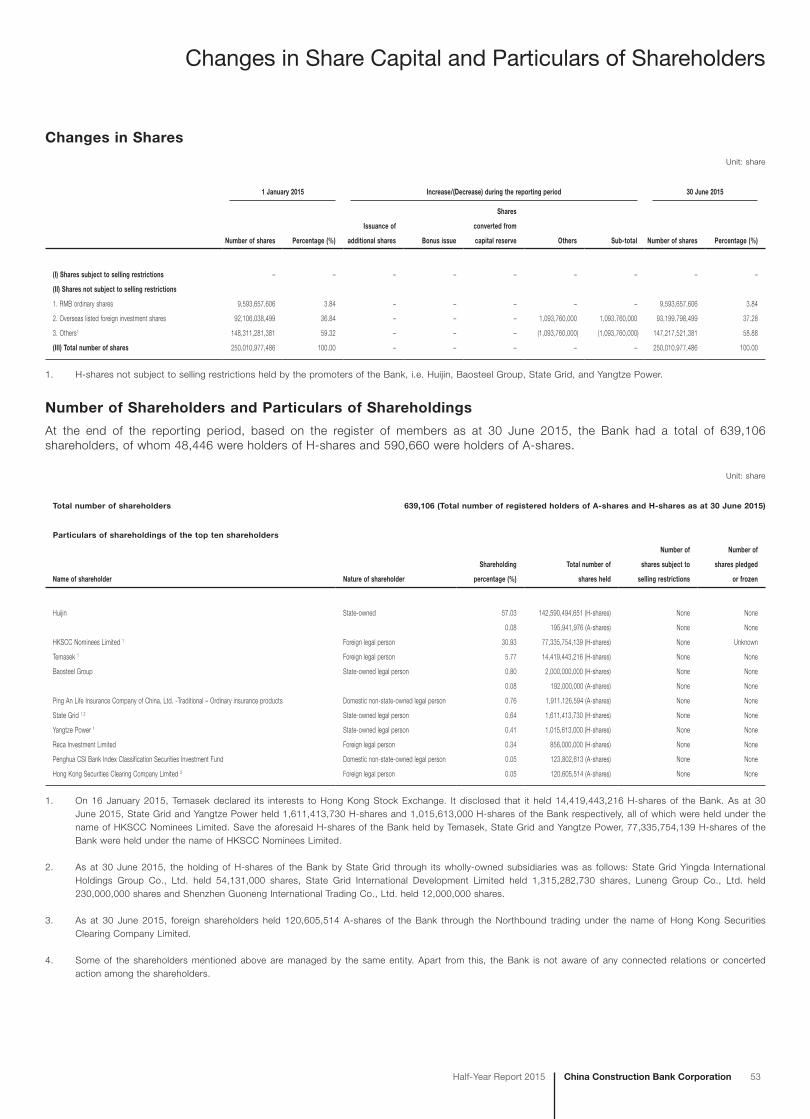
Changes in Share Capital and Particulars of Shareholders
China Construction Bank CorporationHalf-Year Report 2015 53
Changes in Shares
Unit: share
1 January 2015 Increase/(Decrease) during the reporting period 30 June 2015
Number of shares Percentage (%)
Issuance of
additional shares Bonus issue
Shares
converted from
capital reserve Others Sub-total Number of shares Percentage (%)
(I) Shares subject to selling restrictions – – – – – – – – –
(II) Shares not subject to selling restrictions
1. RMB ordinary shares 9,593,657,606 3.84 – – – – – 9,593,657,606 3.84
2. Overseas listed foreign investment shares 92,106,038,499 36.84 – – – 1,093,760,000 1,093,760,000 93,199,798,499 37.28
3. Others1 148,311,281,381 59.32 – – – (1,093,760,000) (1,093,760,000) 147,217,521,381 58.88
(III) Total number of shares 250,010,977,486 100.00 – – – – – 250,010,977,486 100.00
1. H-shares not subject to selling restrictions held by the promoters of the Bank, i.e. Huijin, Baosteel Group, State Grid, and Yangtze Power.
Number of Shareholders and Particulars of Shareholdings
At the end of the reporting period, based on the register of members as at 30 June 2015, the Bank had a total of 639,106 shareholders, of whom 48,446 were holders of H-shares and 590,660 were holders of A-shares.
Unit: share
Total number of shareholders 639,106 (Total number of registered holders of A-shares and H-shares as at 30 June 2015)
Particulars of shareholdings of the top ten shareholders
Name of shareholder Nature of shareholder
Shareholding
percentage (%)
Total number of
shares held
Number of
shares subject to
selling restrictions
Number of
shares pledged
or frozen
Huijin State-owned 57.03 142,590,494,651 (H-shares) None None
0.08 195,941,976 (A-shares) None None
HKSCC Nominees Limited 1 Foreign legal person 30.93 77,335,754,139 (H-shares) None Unknown
Temasek 1 Foreign legal person 5.77 14,419,443,216 (H-shares) None None
Baosteel Group State-owned legal person 0.80 2,000,000,000 (H-shares) None None
0.08 192,000,000 (A-shares) None None
Ping An Life Insurance Company of China, Ltd. -Traditional – Ordinary insurance products Domestic non-state-owned legal person 0.76 1,911,126,594 (A-shares) None None
State Grid 1,2 State-owned legal person 0.64 1,611,413,730 (H-shares) None None
Yangtze Power 1 State-owned legal person 0.41 1,015,613,000 (H-shares) None None
Reca Investment Limited Foreign legal person 0.34 856,000,000 (H-shares) None None
Penghua CSI Bank Index Classification Securities Investment Fund Domestic non-state-owned legal person 0.05 123,802,613 (A-shares) None None
Hong Kong Securities Clearing Company Limited 3 Foreign legal person 0.05 120,605,514 (A-shares) None None
1. On 16 January 2015, Temasek declared its interests to Hong Kong Stock Exchange. It disclosed that it held 14,419,443,216 H-shares of the Bank. As at 30 June 2015, State Grid and Yangtze Power held 1,611,413,730 H-shares and 1,015,613,000 H-shares of the Bank respectively, all of which were held under the name of HKSCC Nominees Limited. Save the aforesaid H-shares of the Bank held by Temasek, State Grid and Yangtze Power, 77,335,754,139 H-shares of the Bank were held under the name of HKSCC Nominees Limited.
2. As at 30 June 2015, the holding of H-shares of the Bank by State Grid through its wholly-owned subsidiaries was as follows: State Grid Yingda International Holdings Group Co., Ltd. held 54,131,000 shares, State Grid International Development Limited held 1,315,282,730 shares, Luneng Group Co., Ltd. held 230,000,000 shares and Shenzhen Guoneng International Trading Co., Ltd. held 12,000,000 shares.
3. As at 30 June 2015, foreign shareholders held 120,605,514 A-shares of the Bank through the Northbound trading under the name of Hong Kong Securities Clearing Company Limited.
4. Some of the shareholders mentioned above are managed by the same entity. Apart from this, the Bank is not aware of any connected relations or concerted action among the shareholders.

54 China Construction Bank Corporation Half-Year Report 2015
Changes in Share Capital and Particulars of Shareholders
Changes in Controlling Shareholders and Actual Controlling Parties
During the reporting period, there had been no change in controlling shareholders and actual controlling parties.
Material Interests and Short Positions
As at 30 June 2015, the interests and short positions of substantial shareholders and other persons in the shares and underlying shares of the Bank as recorded in the register required to be kept under section 336 of the SFO of Hong Kong were as follows:
NameType of shares
Interests in shares and
short positions Nature
% of A-shares or H-shares
issued% of total
shares issued
Huijin1 A-share 492,631,014 Long position 5.13 0.20Huijin2 H-share 133,262,144,534 Long position 59.31 57.03Temasek3 H-share 14,419,443,216 Long position 5.99 5.77
1. On 17 June 2013, Huijin declared its interests to Hong Kong Stock Exchange. It disclosed that it held the interests of 492,631,014 A-shares of the Bank, accounting for 5.13% and 0.20% of the A-shares issued (9,593,657,606 shares) and total shares issued (250,010,977,486 shares) at that time respectively. As at 30 June 2015, according to the A-share register of members of the Bank, Huijin directly held 195,941,976 A-shares of the Bank, accounting for 2.04% and 0.08% of the A-shares issued (9,593,657,606 shares) and total shares issued (250,010,977,486 shares) at the end of the period respectively.
2. On 26 May 2009, Huijin declared its interests to Hong Kong Stock Exchange. It disclosed that it held the interests of 133,262,144,534 H-shares of the Bank, accounting for 59.31% and 57.03% of the H-shares issued (224,689,084,000 shares) and total shares issued (233,689,084,000 shares) at that time respectively. As at 30 June 2015, according to the H-share register of members of the Bank, Huijin directly held 142,590,494,651 H-shares of the Bank, accounting for 59.31% and 57.03% of the H-shares issued (240,417,319,880 shares) and total shares issued (250,010,977,486 shares) at the end of the period respectively.
3. On 13 January 2015, Temasek adjusted its shareholding in the Bank and declared interests to Hong Kong Stock Exchange on 16 January 2015. According to this declaration, Temasek held 14,419,443,216 H-shares (long position) of the Bank, accounting for 5.99% and 5.77% of the H-shares issued and total shares issued by the Bank respectively.
Profiles of Directors, Supervisors, and Senior Management
China Construction Bank CorporationHalf-Year Report 2015 55
Particulars of Directors, Supervisors and Senior Management
Directors of the Bank
Members of the Bank’s Board included executive directors: Mr. Wang Hongzhang, Mr. Wang Zuji, Mr. Pang Xiusheng and Mr. Zhang Gengsheng; non-executive directors: Ms. Chen Yuanling, Ms. Hao Aiqun, Mr. Xu Tie, Mr. Guo Yanpeng and Mr. Dong Shi; and independent non-executive directors: Mr. Zhang Long, Ms. Elaine La Roche, Mr. Chung Shui Ming Timpson, Mr. Wim Kok, Mr. Murray Horn and Ms. Margaret Leung Ko May Yee.
Supervisors of the Bank
Members of the Bank’s board of supervisors included shareholder representative supervisors: Mr. Guo You, Ms. Liu Jin and Ms. Li Xiaoling; employee representative supervisors: Mr. Jin Panshi, Mr. Zhang Huajian and Mr. Wang Lin; and external supervisors: Mr. Wang Xinmin and Mr. Bai Jianjun.
Senior Management of the Bank
Senior management of the Bank included Mr. Wang Zuji, Mr. Pang Xiusheng, Mr. Zhang Gengsheng, Mr. Yang Wensheng, Mr. Huang Yi, Mr. Yu Jingbo, Mr. Zeng Jianhua, Mr. Xu Yiming and Mr. Chen Caihong.
Changes in Directors, Supervisors and Senior Management
Upon election at the 2014 annual general meeting of the Bank, from 15 June 2015, Mr. Wang Hongzhang was re-elected executive director of the Bank and Ms. Elaine La Roche continued to serve as independent non-executive director of the Bank.
Upon review at the 2014 annual general meeting of the Bank and approval of the CBRC, from 9 July 2015, Mr. Wang Zuji commenced his position as executive director of the Bank. Upon review at the Board meeting of the Bank on 12 June 2015 and approval of the CBRC, from 9 July 2015, Mr. Wang Zuji commenced his positions as vice chairman and president of the Bank.
Upon election at the 2014 annual general meeting of the Bank and approval of the CBRC, from 7 August 2015, Mr. Pang Xiusheng commenced his position as executive director of the Bank; from 7 August 2015, Mr. Zhang Gengsheng commenced his position as executive director of the Bank; from 30 July 2015, Ms. Hao Aiqun commenced her position as non-executive director of the Bank.
The Bank published an announcement on 5 January 2015, pursuant to which, Mr. Hu Zheyi tendered his resignation to the Board as executive director and vice president of the Bank due to his age.
The Bank published an announcement on 10 March 2015, pursuant to which, Mr. Zhu Hongbo tendered his resignation to the Board as executive director and vice president of the Bank due to change of job.
The Bank published an announcement on 12 June 2015, pursuant to which, Mr. Zhang Jianguo tendered his resignation to the Board as vice chairman, executive director and president of the Bank due to work arrangement.

56 China Construction Bank Corporation Half-Year Report 2015
Profiles of Directors, Supervisors, and Senior Management
Directors’ and Supervisors’ Interests and Short Positions in Shares, Underlying Shares and Debentures of the Bank
Mr. Zhang Gengsheng, director of the Bank, indirectly held 19,304 H-shares through participating in the employee stock incentive plan before he was appointed as director, Mr. Zhang Long, director of the Bank, held 235,400 A-shares and Ms. Margaret Leung Ko May Yee, director of the Bank, held 100,000 H-shares of the Bank. Mr. Zhang Huajian and Mr. Wang Lin, supervisors of the Bank, indirectly held 18,999 H-shares and 19,304 H-shares of the Bank respectively, through participating in the employee stock incentive plan before they were appointed as supervisors. Save as disclosed above, as at 30 June 2015, none of the directors and supervisors of the Bank had any interests or short positions in the shares, underlying shares and debentures of the Bank or its associated corporations (within the meaning of Part XV of the SFO of Hong Kong) as recorded in the register required to be kept under Section 352 of the SFO of Hong Kong or as otherwise notified to the Bank and Hong Kong Stock Exchange pursuant to Model Code for Securities Transactions by Directors of Listed Issuers in Appendix 10 to the Listing Rules of Hong Kong Stock Exchange.
As of 30 June 2015, except for the employee stock incentive plan, the Bank had not granted its directors or supervisors, or their respective spouses or children below the age of 18, any other rights to subscribe for the shares or debentures of the Bank or any of its associated corporations.
Directors and Supervisors’ Securities Transactions
The Bank has adopted a code of practice in relation to securities transactions by directors and supervisors as set out in the Model Code for Securities Transactions by Directors of Listed Issuers in Appendix 10 to the Listing Rules of Hong Kong Stock Exchange. All directors and supervisors had complied with the provisions of this code during the six months ended 30 June 2015.
Shares of the Bank held by Directors, Supervisors and Senior Management
During the reporting period, Mr. Zhang Gengsheng, director of the Bank, indirectly held 19,304 H-shares of the Bank via employee stock incentive plan before he assumed the current position. Mr. Zhang Long, director of the Bank, held 235,400 A-shares of the Bank, and Ms. Margaret Leung Ko May Yee, director of the Bank, held 100,000 H-shares of the Bank. Some of the Bank’s supervisors and senior executives indirectly held H-shares of the Bank via employee stock incentive plan before they assumed their current positions. Mr. Zhang Huajian held 18,999 H-shares, Mr. Wang Lin held 19,304 H-shares, Mr. Yang Wensheng held 10,845 H-shares, Mr. Yu Jingbo held 22,567 H-shares, Mr. Zeng Jianhua held 25,838 H-shares, Mr. Xu Yiming held 17,925 H-shares and Mr. Chen Caihong held 19,417 H-shares. Apart from the above, none of the directors, supervisors or senior executives of the Bank held any shares of the Bank.
Major Issues
China Construction Bank CorporationHalf-Year Report 2015 57
Corporate Governance
The Bank continued to improve its corporate governance structure in strict compliance with the Company Law of the People’s Republic of China, the Law of the People’s Republic of China on Commercial Banks and other laws and regulations, as well as the listing rules of the relevant stock exchanges, based on its practical conditions, in order to enhance its corporate governance.
During the reporting period, the general meeting of the Bank reviewed and approved the resolutions of electing directors. In order to achieve the strategic goals of the Bank, promote sustainable development and diversify the composition of the Board, the Bank formulated the Diversity Policy for the Board of Directors in August 2013. For nomination of directors, the Board should consider both professional capabilities and working ethics of the candidates, and at the same time, take into account the requirements under the diversity policy. The candidates should be selected as complementary to one another, with diversified backgrounds in terms of gender, age, cultural and educational background, professional experience, specialty, knowledge and term of service. The final decision should be based on candidates’ overall competence and possible contributions to the Board. Nomination and Remuneration Committee supervises the implementation of the Diversity Policy for the Board of Directors.
The Bank has complied with the code provisions of the Corporate Governance Code and Corporate Governance Report as set out in Appendix 14 to the Listing Rules of Hong Kong Stock Exchange. The Bank has also substantially complied with the recommended best practices therein.
Formulation and Implementation of Cash Dividend Policy
As approved by the 2014 annual general meeting of the Bank, the Bank distributed the 2014 cash dividend of RMB0.301 per share (including tax), totalling RMB2,888 million, on 1 July 2015 to all of its holders of A-shares whose names appeared on the register of members on 30 June 2015. It distributed the 2014 cash dividend of RMB0.301 per share (including tax), totalling RMB72,365 million, on 24 July 2015 to all of its holders of H-shares whose names appeared on the register of members on 30 June 2015. The Bank would not distribute 2015 interim dividend nor did it propose any capitalisation of capital reserve into share capital during the reporting period.
Pursuant to the Articles of Association of the Bank, the after-tax profits of the Bank shall be distributed in accordance with the following order: making up for the losses of the previous year, allocating the statutory reserve fund, allocating general reserve fund, allocating discretionary reserve fund and paying the dividend to the shareholders. The dividend may be distributed in the form of cash, shares or a combination of cash and shares.
The Bank has sound procedures and mechanism for the decision-making of profit distribution. During the process of drafting the profit distribution plan, the Board extensively collected the opinions and requests from the shareholders, protected the legal rights and interests of the small and medium investors, and submitted the profit distribution plan to the general meeting for approval. The independent directors conducted due diligence and played their due roles diligently in the decision-making process of the profit distribution plan. The Bank attaches great importance to the return of shareholders, and constantly pays cash dividends to the shareholders.
Performance of Undertakings Given by the Bank or Shareholders Holding 5% or More of the Shares
In September 2004, Huijin made a commitment of “non-competition within the industry”, i.e., as long as Huijin continued to hold any shares of the Bank, or was defined as a controlling shareholder or a related party of a controlling shareholder of the Bank in accordance with related laws of the People’s Republic of China or listing rules of the Bank’s listing venues, Huijin would not engage or participate in any competing commercial banking businesses, including but not limited to extending loans, taking deposits and providing settlement, and providing fund custody, bank card and currency exchange services. However, Huijin may still engage or participate in competing businesses through investing in other commercial banks. Accordingly, Huijin agreed to: (1) fairly weigh its investments in commercial banks, and not abuse its shareholder position in the Bank or the information it obtained through its shareholder position in the Bank to make decisions detrimental to the Bank but beneficial to others; (2) exercise its shareholder’s rights in the best interests of the Bank. As at 30 June 2015, Huijin had not breached any of the above undertakings.
On 8 July 2015, the Bank received a notice from Huijin, pursuant to which, Huijin has undertaken not to cut any shareholdings in listed companies during the period of unusual price fluctuations in the stock market.
Apart from the above, the Bank and shareholders holding 5% or more of the shares did not give new undertakings.

58 China Construction Bank Corporation Half-Year Report 2015
Major Issues
Progress of Implementation of Employee Stock Incentive PlanDuring the reporting period, pursuant to the requirements of relevant PRC policies, the Bank did not implement a new round of employee stock incentive plan.
Issuance of Preference SharesOn 12 December 2014, the Board of the Bank reviewed and approved the proposals on Plan of Issuance of Domestic Preference Shares by China Construction Bank Corporation (“Domestic Issuance Plan”) and Plan of Issuance of Offshore Preference Shares by China Construction Bank Corporation (“Offshore Issuance Plan”). On 15 June 2015, the 2014 annual general meeting, the first A-shareholders class meeting of 2015 and the first H-shareholders class meeting of 2015 of the Bank reviewed and approved the Domestic Issuance Plan and the Offshore Issuance Plan, pursuant to which, the Bank proposed to issue preference shares with an aggregate of no more than RMB80 billion (inclusive) or its equivalent in domestic and offshore markets, including no more than RMB60 billion (inclusive) domestic preference shares and no more than RMB20 billion (inclusive) offshore preference shares or its equivalent. All proceeds from the issuance of domestic and offshore preference shares, after deduction of expenses relating to the issuance, will be used to replenish additional Tier 1 capital of the Bank. The proposal for the issuance of preference shares is subject to approvals by relevant regulatory authorities.
Acquisition and Sale of Major Assets and Merger of EnterprisesDuring the reporting period, there was no acquisition or sale of major assets, or merger of enterprises.
Use of ProceedsDuring the reporting period, the Bank issued US$2 billion off-shore Tier-2 capital bonds. All proceeds, after deduction of expenses relating to issuance, were used to replenish the capital base of the Bank in accordance with the undertaking of the Bank.
Material Investment with Funds other than Raised ProceedsDuring the reporting period, there was no material investment with funds other than raised proceeds.
Material Litigations, Arbitrations and Matters Questioned by the Major MediaDuring the reporting period, there was no material litigation or arbitration of the Bank, or matter in relation to the Bank that was questioned by the major media.
Material Related Party TransactionsDuring the reporting period, there was no material related party transaction of the Bank.
Material Contracts and Their PerformanceDuring the reporting period, the Bank did not enter into any material arrangement for custody, contracting or lease of other companies’ assets, or allow its assets to be subject to such arrangements by other companies. The guarantee business is an off-balance sheet service in the ordinary course of the Bank’s business, and the Bank did not have any material guarantee that should be disclosed except for the financial guarantee services within its business scope as approved by the regulators. The Bank did not entrust management of any material cash assets to others during the reporting period.
Purchase, Sale and Redemption of SharesDuring the reporting period, there was no purchase, sale or redemption of the shares of the Bank by the Bank or any of its subsidiaries.
PenaltiesDuring the reporting period, neither the Bank, the directors, the supervisors, the senior management nor the actual controller was subject to investigations by relevant authorities, coercive measures by judicial or disciplinary inspection departments, transfer to judicial organs or criminal investigation and punishment, investigation or administrative penalty by the CSRC, restricted access to market, identification as unqualified, penalty by other administrative authorities or public reprimand by the stock exchanges.
Review of Half-Year ReportThe Group’s 2015 half-year financial statements prepared under PRC GAAP have been reviewed by PricewaterhouseCoopers Zhong Tian LLP and the Group’s 2015 half-year financial statements prepared under IFRS have been reviewed by PricewaterhouseCoopers.
The Group’s half-year report has been reviewed by the audit committee of the Bank.
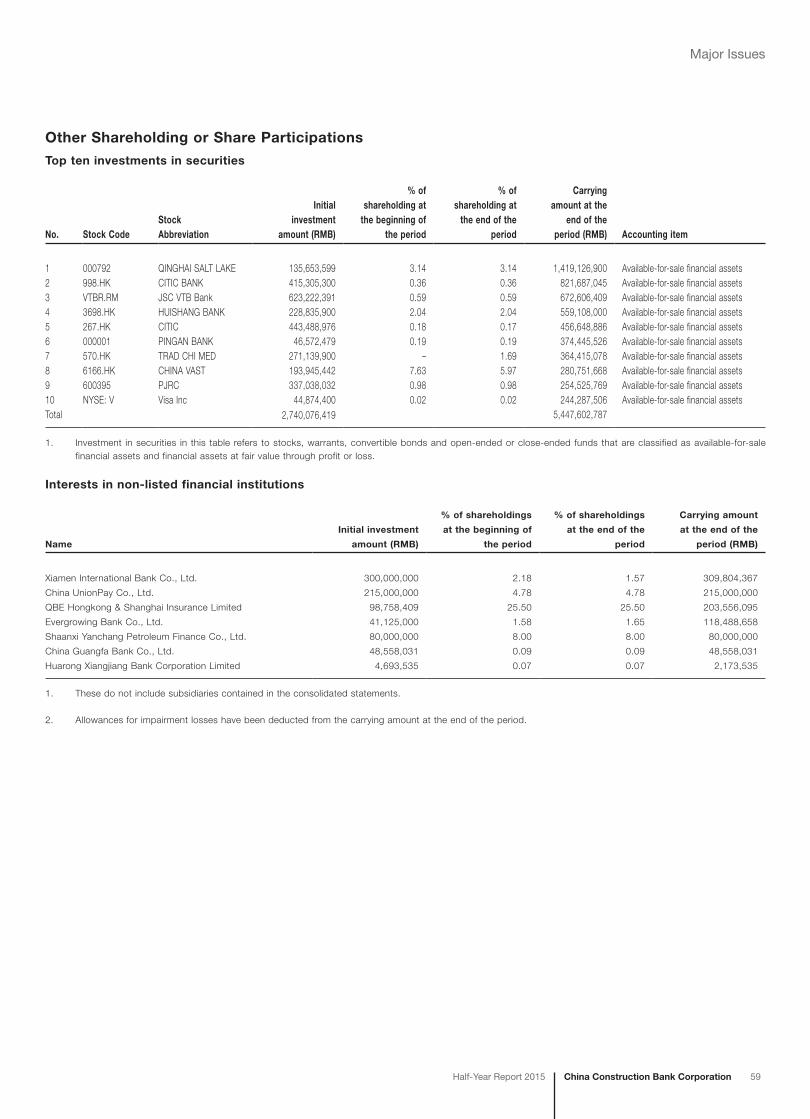
China Construction Bank CorporationHalf-Year Report 2015 59
Major Issues
Other Shareholding or Share Participations
Top ten investments in securities
No. Stock CodeStock Abbreviation
Initial investment
amount (RMB)
% of shareholding at
the beginning of the period
% of shareholding at
the end of the period
Carrying amount at the
end of the period (RMB) Accounting item
1 000792 QINGHAI SALT LAKE 135,653,599 3.14 3.14 1,419,126,900 Available-for-sale financial assets2 998.HK CITIC BANK 415,305,300 0.36 0.36 821,687,045 Available-for-sale financial assets3 VTBR.RM JSC VTB Bank 623,222,391 0.59 0.59 672,606,409 Available-for-sale financial assets4 3698.HK HUISHANG BANK 228,835,900 2.04 2.04 559,108,000 Available-for-sale financial assets5 267.HK CITIC 443,488,976 0.18 0.17 456,648,886 Available-for-sale financial assets6 000001 PINGAN BANK 46,572,479 0.19 0.19 374,445,526 Available-for-sale financial assets7 570.HK TRAD CHI MED 271,139,900 – 1.69 364,415,078 Available-for-sale financial assets8 6166.HK CHINA VAST 193,945,442 7.63 5.97 280,751,668 Available-for-sale financial assets9 600395 PJRC 337,038,032 0.98 0.98 254,525,769 Available-for-sale financial assets10 NYSE: V Visa Inc 44,874,400 0.02 0.02 244,287,506 Available-for-sale financial assetsTotal 2,740,076,419 5,447,602,787
1. Investment in securities in this table refers to stocks, warrants, convertible bonds and open-ended or close-ended funds that are classified as available-for-sale financial assets and financial assets at fair value through profit or loss.
Interests in non-listed financial institutions
Name
Initial investment
amount (RMB)
% of shareholdings
at the beginning of
the period
% of shareholdings
at the end of the
period
Carrying amount
at the end of the
period (RMB)
Xiamen International Bank Co., Ltd. 300,000,000 2.18 1.57 309,804,367
China UnionPay Co., Ltd. 215,000,000 4.78 4.78 215,000,000
QBE Hongkong & Shanghai Insurance Limited 98,758,409 25.50 25.50 203,556,095
Evergrowing Bank Co., Ltd. 41,125,000 1.58 1.65 118,488,658
Shaanxi Yanchang Petroleum Finance Co., Ltd. 80,000,000 8.00 8.00 80,000,000
China Guangfa Bank Co., Ltd. 48,558,031 0.09 0.09 48,558,031
Huarong Xiangjiang Bank Corporation Limited 4,693,535 0.07 0.07 2,173,535
1. These do not include subsidiaries contained in the consolidated statements.
2. Allowances for impairment losses have been deducted from the carrying amount at the end of the period.
Report on Review of Interim Financial Statements
60 China Construction Bank Corporation Half-Year Report 2015
To the Board of Directors of China Construction Bank Corporation(a joint stock company incorporated in the People’s Republic of China with limited liability)
IntroductionWe have reviewed the interim financial information set out on pages 61 to 166, which comprises the consolidated and Bank’s statements of financial position of China Construction Bank Corporation (the “Bank”) and its subsidiaries (together, the “Group”) as at 30 June 2015 and the related consolidated statement of comprehensive income, the consolidated and the Bank’s statements of changes in equity and the consolidated statement of cash flows for the six-month period then ended, and a summary of significant accounting policies and other explanatory notes. The Rules Governing the Listing of Securities on The Stock Exchange of Hong Kong Limited require the preparation of a report on interim financial information to be in compliance with the relevant provisions thereof and International Accounting Standard 34” Interim Financial Reporting”. The directors of the Bank are responsible for the preparation and presentation of this interim financial information in accordance with International Accounting Standard 34 “Interim Financial Reporting”. Our responsibility is to express a conclusion on this interim financial information based on our review and to report our conclusion solely to you, as a body, in accordance with our agreed terms of engagement and for no other purpose. We do not assume responsibility towards or accept liability to any other person for the contents of this report.
Scope of ReviewWe conducted our review in accordance with Hong Kong Standard on Review Engagements 2410, “Review of Interim Financial Information Performed by the Independent Auditor of the Entity” issued by the Hong Kong Institute of Certified Public Accountants. A review of interim financial information consists of making inquiries, primarily of persons responsible for financial and accounting matters, and applying analytical and other review procedures. A review is substantially less in scope than an audit conducted in accordance with Hong Kong Standards on Auditing and consequently does not enable us to obtain assurance that we would become aware of all significant matters that might be identified in an audit. Accordingly, we do not express an audit opinion.
ConclusionBased on our review, nothing has come to our attention that causes us to believe that the interim financial information is not prepared, in all material respects, in accordance with International Accounting Standard 34 “Interim Financial Reporting”.
PricewaterhouseCoopersCertified Public Accountants
Hong Kong, 28 August 2015
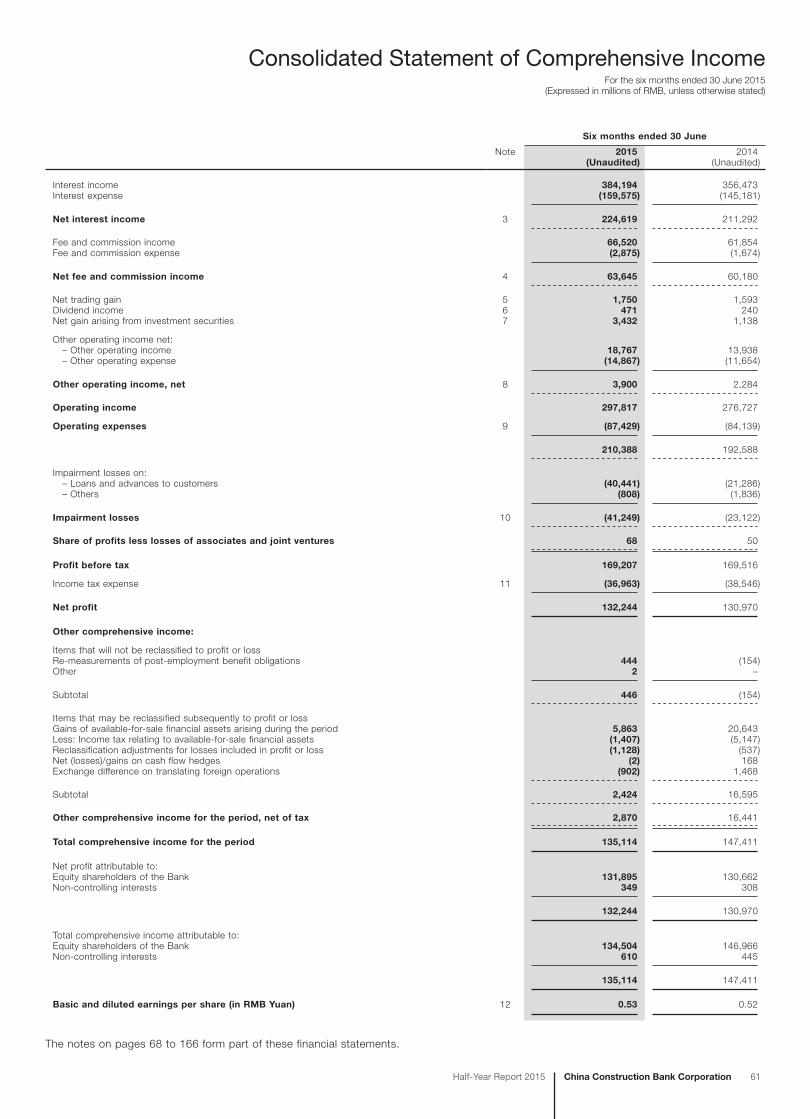
Consolidated Statement of Comprehensive IncomeFor the six months ended 30 June 2015
(Expressed in millions of RMB, unless otherwise stated)
China Construction Bank CorporationHalf-Year Report 2015 61
Six months ended 30 June
Note 2015 2014(Unaudited) (Unaudited)
Interest income 384,194 356,473Interest expense (159,575) (145,181)
Net interest income 3 224,619 211,292
Fee and commission income 66,520 61,854Fee and commission expense (2,875) (1,674)
Net fee and commission income 4 63,645 60,180
Net trading gain 5 1,750 1,593Dividend income 6 471 240Net gain arising from investment securities 7 3,432 1,138
Other operating income net: – Other operating income 18,767 13,938 – Other operating expense (14,867) (11,654)
Other operating income, net 8 3,900 2,284
Operating income 297,817 276,727
Operating expenses 9 (87,429) (84,139)
210,388 192,588
Impairment losses on: – Loans and advances to customers (40,441) (21,286) – Others (808) (1,836)
Impairment losses 10 (41,249) (23,122)
Share of profits less losses of associates and joint ventures 68 50
Profit before tax 169,207 169,516
Income tax expense 11 (36,963) (38,546)
Net profit 132,244 130,970
Other comprehensive income:
Items that will not be reclassified to profit or lossRe-measurements of post-employment benefit obligations 444 (154)Other 2 –
Subtotal 446 (154)
Items that may be reclassified subsequently to profit or lossGains of available-for-sale financial assets arising during the period 5,863 20,643Less: Income tax relating to available-for-sale financial assets (1,407) (5,147)Reclassification adjustments for losses included in profit or loss (1,128) (537)Net (losses)/gains on cash flow hedges (2) 168Exchange difference on translating foreign operations (902) 1,468
Subtotal 2,424 16,595
Other comprehensive income for the period, net of tax 2,870 16,441
Total comprehensive income for the period 135,114 147,411
Net profit attributable to:Equity shareholders of the Bank 131,895 130,662Non-controlling interests 349 308
132,244 130,970
Total comprehensive income attributable to:Equity shareholders of the Bank 134,504 146,966Non-controlling interests 610 445
135,114 147,411
Basic and diluted earnings per share (in RMB Yuan) 12 0.53 0.52
The notes on pages 68 to 166 form part of these financial statements.
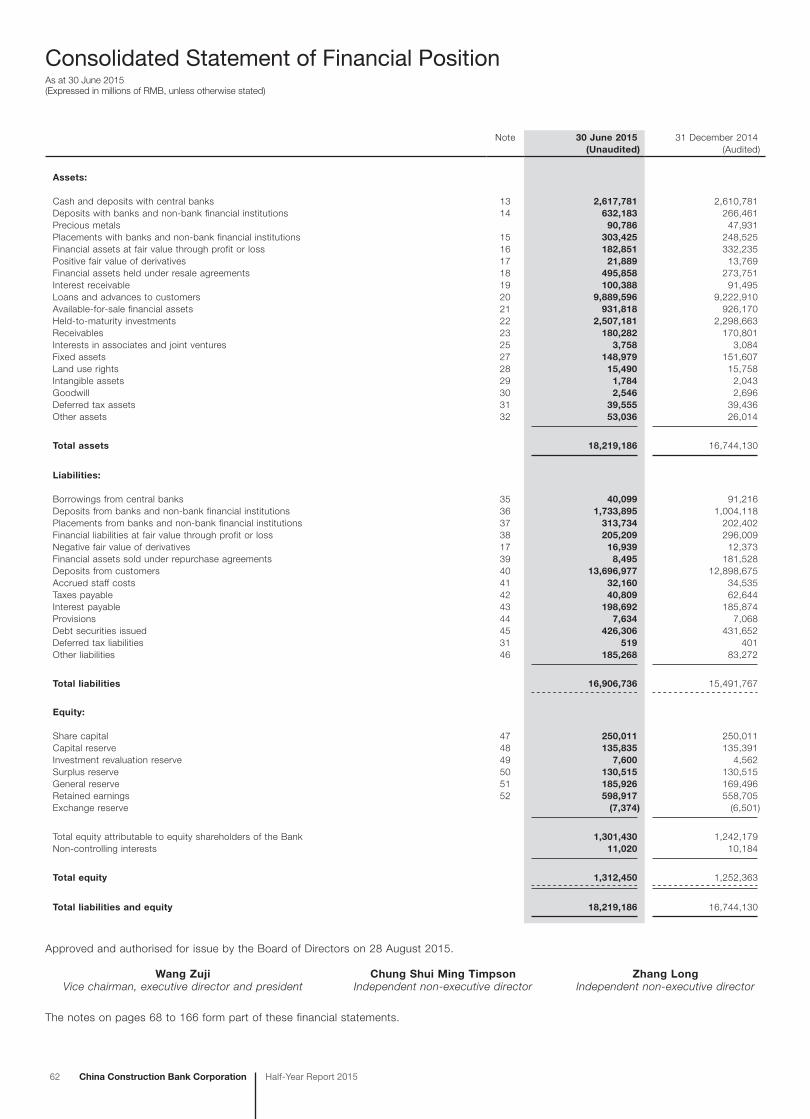
Consolidated Statement of Financial PositionAs at 30 June 2015(Expressed in millions of RMB, unless otherwise stated)
62 China Construction Bank Corporation Half-Year Report 2015
Note 30 June 2015 31 December 2014(Unaudited) (Audited)
Assets:
Cash and deposits with central banks 13 2,617,781 2,610,781Deposits with banks and non-bank financial institutions 14 632,183 266,461Precious metals 90,786 47,931Placements with banks and non-bank financial institutions 15 303,425 248,525Financial assets at fair value through profit or loss 16 182,851 332,235Positive fair value of derivatives 17 21,889 13,769Financial assets held under resale agreements 18 495,858 273,751Interest receivable 19 100,388 91,495Loans and advances to customers 20 9,889,596 9,222,910Available-for-sale financial assets 21 931,818 926,170Held-to-maturity investments 22 2,507,181 2,298,663Receivables 23 180,282 170,801Interests in associates and joint ventures 25 3,758 3,084Fixed assets 27 148,979 151,607Land use rights 28 15,490 15,758Intangible assets 29 1,784 2,043Goodwill 30 2,546 2,696Deferred tax assets 31 39,555 39,436Other assets 32 53,036 26,014
Total assets 18,219,186 16,744,130
Liabilities:
Borrowings from central banks 35 40,099 91,216Deposits from banks and non-bank financial institutions 36 1,733,895 1,004,118Placements from banks and non-bank financial institutions 37 313,734 202,402Financial liabilities at fair value through profit or loss 38 205,209 296,009Negative fair value of derivatives 17 16,939 12,373Financial assets sold under repurchase agreements 39 8,495 181,528Deposits from customers 40 13,696,977 12,898,675Accrued staff costs 41 32,160 34,535Taxes payable 42 40,809 62,644Interest payable 43 198,692 185,874Provisions 44 7,634 7,068Debt securities issued 45 426,306 431,652Deferred tax liabilities 31 519 401Other liabilities 46 185,268 83,272
Total liabilities 16,906,736 15,491,767
Equity:
Share capital 47 250,011 250,011Capital reserve 48 135,835 135,391Investment revaluation reserve 49 7,600 4,562Surplus reserve 50 130,515 130,515General reserve 51 185,926 169,496Retained earnings 52 598,917 558,705Exchange reserve (7,374) (6,501)
Total equity attributable to equity shareholders of the Bank 1,301,430 1,242,179Non-controlling interests 11,020 10,184
Total equity 1,312,450 1,252,363
Total liabilities and equity 18,219,186 16,744,130
Approved and authorised for issue by the Board of Directors on 28 August 2015.
Wang Zuji Chung Shui Ming Timpson Zhang LongVice chairman, executive director and president Independent non-executive director Independent non-executive director
The notes on pages 68 to 166 form part of these financial statements.

Statement of Financial PositionAs at 30 June 2015
(Expressed in millions of RMB, unless otherwise stated)
China Construction Bank CorporationHalf-Year Report 2015 63
Note 30 June 2015 31 December 2014(Unaudited) (Audited)
Assets:
Cash and deposits with central banks 13 2,607,981 2,600,028Deposits with banks and non-bank financial institutions 14 636,613 280,848Precious metals 90,786 47,931Placements with banks and non-bank financial institutions 15 323,059 247,606Financial assets at fair value through profit or loss 16 171,944 320,452Positive fair value of derivatives 17 16,867 9,880Financial assets held under resale agreements 18 495,321 273,444Interest receivable 19 97,559 88,930Loans and advances to customers 20 9,524,791 8,876,246Available-for-sale financial assets 21 836,789 844,914Held-to-maturity investments 22 2,502,655 2,294,723Receivables 23 160,036 154,576Investments in subsidiaries 24 29,911 26,794Fixed assets 27 137,301 141,880Land use rights 28 15,073 15,341Intangible assets 29 1,270 1,506Deferred tax assets 31 38,560 38,115Other assets 32 80,699 56,569
Total assets 17,767,215 16,319,783
Liabilities:
Borrowings from central banks 35 39,360 90,409Deposits from banks and non-bank financial institutions 36 1,739,033 1,008,746Placements from banks and non-bank financial institutions 37 254,364 152,152Financial liabilities at fair value through profit or loss 38 203,564 292,642Negative fair value of derivatives 17 14,556 10,612Financial assets sold under repurchase agreements 39 634 177,256Deposits from customers 40 13,469,744 12,654,493Accrued staff costs 41 30,655 33,234Taxes payable 42 39,912 61,881Interest payable 43 197,494 184,627Provisions 44 6,142 5,399Debt securities issued 45 355,491 367,504Deferred tax liabilities 31 19 43Other liabilities 46 126,966 48,549
Total liabilities 16,477,934 15,087,547
Equity:
Share capital 47 250,011 250,011Capital reserve 48 135,832 135,387Investment revaluation reserve 49 6,613 4,288Surplus reserve 50 130,515 130,515General reserve 51 182,308 165,916Retained earnings 52 585,681 547,542Exchange reserve (1,679) (1,423)
Total equity 1,289,281 1,232,236
Total liabilities and equity 17,767,215 16,319,783
Approved and authorised for issue by the Board of Directors on 28 August 2015.
Wang Zuji Chung Shui Ming Timpson Zhang LongVice chairman, executive director and president Independent non-executive director Independent non-executive director
The notes on pages 68 to 166 form part of these financial statements.
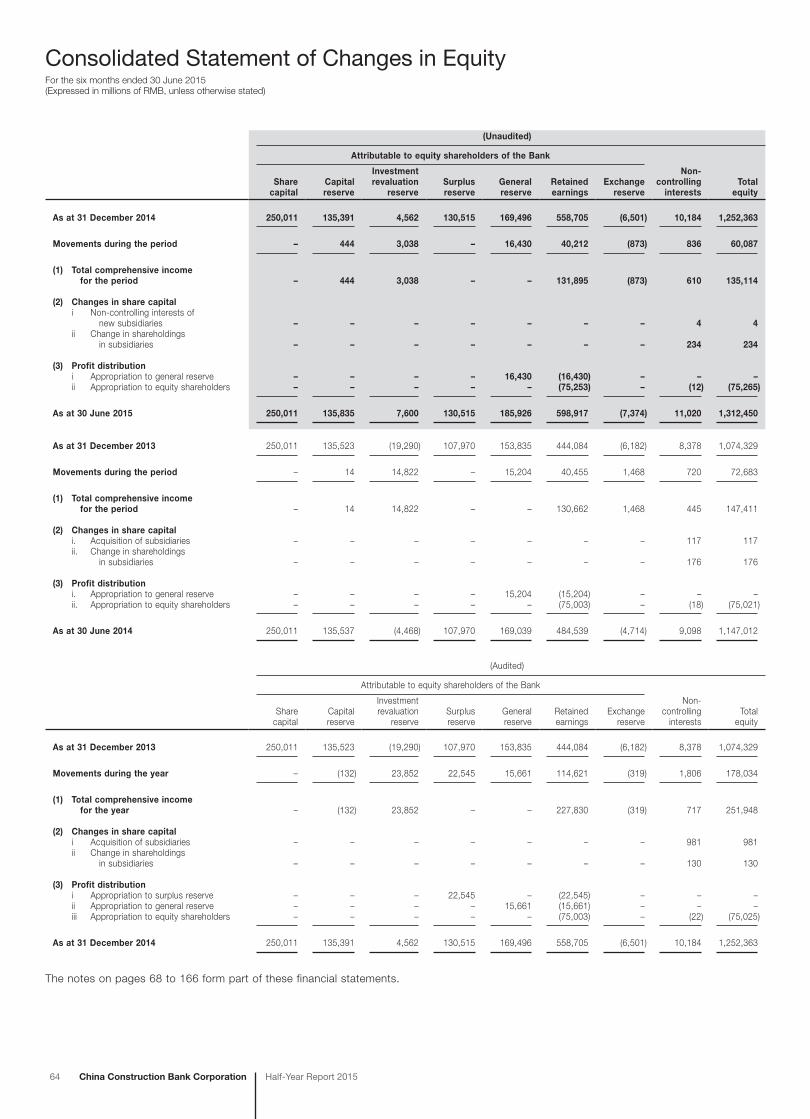
Consolidated Statement of Changes in EquityFor the six months ended 30 June 2015(Expressed in millions of RMB, unless otherwise stated)
64 China Construction Bank Corporation Half-Year Report 2015
(Unaudited)
Attributable to equity shareholders of the Bank
Share capital
Capital reserve
Investment revaluation
reserveSurplus reserve
General reserve
Retained earnings
Exchange reserve
Non-controlling
interestsTotal
equity
As at 31 December 2014 250,011 135,391 4,562 130,515 169,496 558,705 (6,501) 10,184 1,252,363
Movements during the period – 444 3,038 – 16,430 40,212 (873) 836 60,087
(1) Total comprehensive income for the period – 444 3,038 – – 131,895 (873) 610 135,114
(2) Changes in share capitali Non-controlling interests of
new subsidiaries – – – – – – – 4 4ii Change in shareholdings
in subsidiaries – – – – – – – 234 234
(3) Profit distributioni Appropriation to general reserve – – – – 16,430 (16,430) – – –ii Appropriation to equity shareholders – – – – – (75,253) – (12) (75,265)
As at 30 June 2015 250,011 135,835 7,600 130,515 185,926 598,917 (7,374) 11,020 1,312,450
As at 31 December 2013 250,011 135,523 (19,290) 107,970 153,835 444,084 (6,182) 8,378 1,074,329
Movements during the period – 14 14,822 – 15,204 40,455 1,468 720 72,683
(1) Total comprehensive income for the period – 14 14,822 – – 130,662 1,468 445 147,411
(2) Changes in share capitali. Acquisition of subsidiaries – – – – – – – 117 117ii. Change in shareholdings
in subsidiaries – – – – – – – 176 176
(3) Profit distributioni. Appropriation to general reserve – – – – 15,204 (15,204) – – –ii. Appropriation to equity shareholders – – – – – (75,003) – (18) (75,021)
As at 30 June 2014 250,011 135,537 (4,468) 107,970 169,039 484,539 (4,714) 9,098 1,147,012
(Audited)
Attributable to equity shareholders of the Bank
Share capital
Capital reserve
Investment revaluation
reserveSurplus reserve
General reserve
Retained earnings
Exchange reserve
Non-controlling
interestsTotal
equity
As at 31 December 2013 250,011 135,523 (19,290) 107,970 153,835 444,084 (6,182) 8,378 1,074,329
Movements during the year – (132) 23,852 22,545 15,661 114,621 (319) 1,806 178,034
(1) Total comprehensive income for the year – (132) 23,852 – – 227,830 (319) 717 251,948
(2) Changes in share capitali Acquisition of subsidiaries – – – – – – – 981 981ii Change in shareholdings
in subsidiaries – – – – – – – 130 130
(3) Profit distributioni Appropriation to surplus reserve – – – 22,545 – (22,545) – – –ii Appropriation to general reserve – – – – 15,661 (15,661) – – –iii Appropriation to equity shareholders – – – – – (75,003) – (22) (75,025)
As at 31 December 2014 250,011 135,391 4,562 130,515 169,496 558,705 (6,501) 10,184 1,252,363
The notes on pages 68 to 166 form part of these financial statements.

Statement of Changes in EquityFor the six months ended 30 June 2015
(Expressed in millions of RMB, unless otherwise stated)
China Construction Bank CorporationHalf-Year Report 2015 65
(Unaudited)
Share capital
Capital reserve
Investment revaluation
reserveSurplus reserve
General reserve
Retained earnings
Exchange reserve
Total equity
As at 31 December 2014 250,011 135,387 4,288 130,515 165,916 547,542 (1,423) 1,232,236
Movements during the period – 445 2,325 – 16,392 38,139 (256) 57,045
(1) Total comprehensive income for the period – 445 2,325 – – 129,784 (256) 132,298
(2) Profit distributioni Appropriation to general reserve – – – – 16,392 (16,392) – –ii Appropriation to equity shareholders – – – – – (75,253) – (75,253)
As at 30 June 2015 250,011 135,832 6,613 130,515 182,308 585,681 (1,679) 1,289,281
As at 31 December 2013 250,011 135,508 (19,275) 107,970 150,675 434,877 (1,165) 1,058,601
Movements during the period – 14 14,782 – 15,259 39,293 293 69,641
(1) Total comprehensive income for the period – 14 14,782 – – 129,555 293 144,644
(2) Profit distributioni Appropriation to general reserve – – – – 15,259 (15,259) – –ii Appropriation to equity shareholders – – – – – (75,003) – (75,003)
As at 30 June 2014 250,011 135,522 (4,493) 107,970 165,934 474,170 (872) 1,128,242
(Audited)
Share capital
Capital reserve
Investment revaluation
reserveSurplus reserve
General reserve
Retained earnings
Exchange reserve
Total equity
As at 31 December 2013 250,011 135,508 (19,275) 107,970 150,675 434,877 (1,165) 1,058,601
Movements during the year – (121) 23,563 22,545 15,241 112,665 (258) 173,635
(1) Total comprehensive income for the year – (121) 23,563 – – 225,454 (258) 248,638
(2) Profit distributioni Appropriation to surplus reserve – – – 22,545 – (22,545) – –ii Appropriation to general reserve – – – – 15,241 (15,241) – –iii Appropriation to equity shareholders – – – – – (75,003) – (75,003)
As at 31 December 2014 250,011 135,387 4,288 130,515 165,916 547,542 (1,423) 1,232,236
The notes on pages 68 to 166 form part of these financial statements.
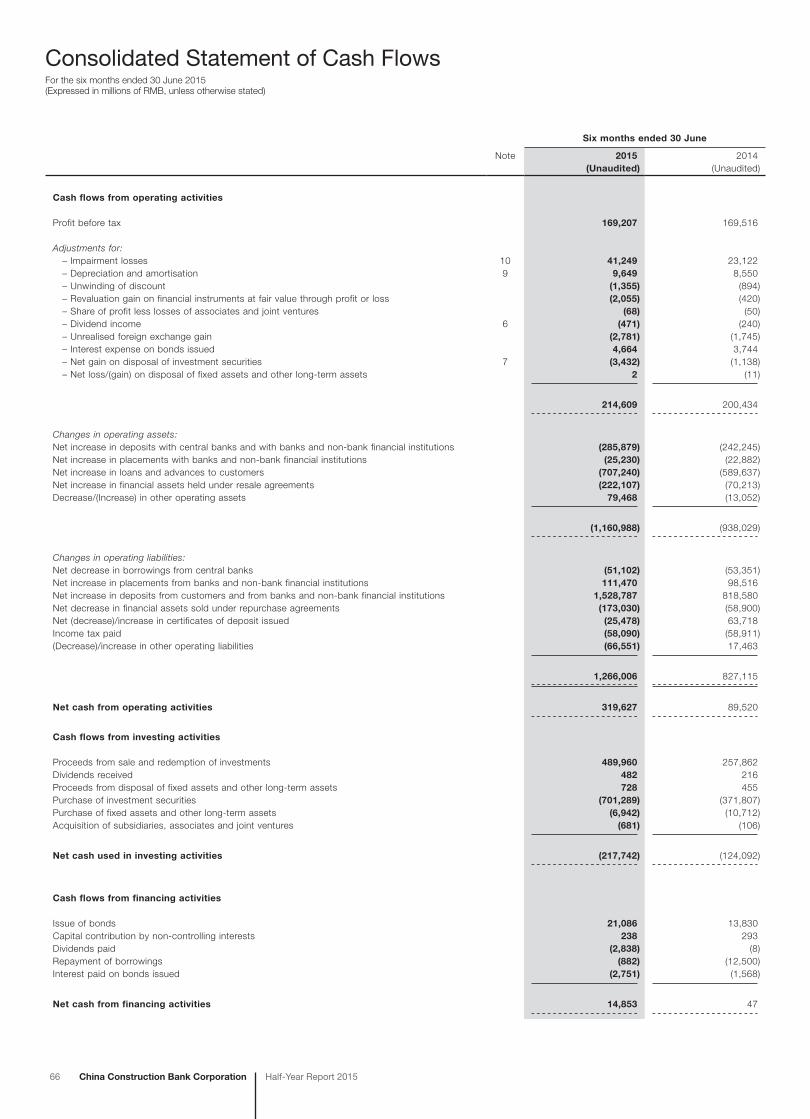
Consolidated Statement of Cash FlowsFor the six months ended 30 June 2015(Expressed in millions of RMB, unless otherwise stated)
66 China Construction Bank Corporation Half-Year Report 2015
Six months ended 30 June
Note 2015 2014(Unaudited) (Unaudited)
Cash flows from operating activities
Profit before tax 169,207 169,516
Adjustments for: – Impairment losses 10 41,249 23,122 – Depreciation and amortisation 9 9,649 8,550 – Unwinding of discount (1,355) (894) – Revaluation gain on financial instruments at fair value through profit or loss (2,055) (420) – Share of profit less losses of associates and joint ventures (68) (50) – Dividend income 6 (471) (240) – Unrealised foreign exchange gain (2,781) (1,745) – Interest expense on bonds issued 4,664 3,744 – Net gain on disposal of investment securities 7 (3,432) (1,138) – Net loss/(gain) on disposal of fixed assets and other long-term assets 2 (11)
214,609 200,434
Changes in operating assets:Net increase in deposits with central banks and with banks and non-bank financial institutions (285,879) (242,245)Net increase in placements with banks and non-bank financial institutions (25,230) (22,882)Net increase in loans and advances to customers (707,240) (589,637)Net increase in financial assets held under resale agreements (222,107) (70,213)Decrease/(Increase) in other operating assets 79,468 (13,052)
(1,160,988) (938,029)
Changes in operating liabilities:Net decrease in borrowings from central banks (51,102) (53,351)Net increase in placements from banks and non-bank financial institutions 111,470 98,516Net increase in deposits from customers and from banks and non-bank financial institutions 1,528,787 818,580Net decrease in financial assets sold under repurchase agreements (173,030) (58,900)Net (decrease)/increase in certificates of deposit issued (25,478) 63,718Income tax paid (58,090) (58,911)(Decrease)/increase in other operating liabilities (66,551) 17,463
1,266,006 827,115
Net cash from operating activities 319,627 89,520
Cash flows from investing activities
Proceeds from sale and redemption of investments 489,960 257,862Dividends received 482 216Proceeds from disposal of fixed assets and other long-term assets 728 455Purchase of investment securities (701,289) (371,807)Purchase of fixed assets and other long-term assets (6,942) (10,712)Acquisition of subsidiaries, associates and joint ventures (681) (106)
Net cash used in investing activities (217,742) (124,092)
Cash flows from financing activities
Issue of bonds 21,086 13,830Capital contribution by non-controlling interests 238 293Dividends paid (2,838) (8)Repayment of borrowings (882) (12,500)Interest paid on bonds issued (2,751) (1,568)
Net cash from financing activities 14,853 47
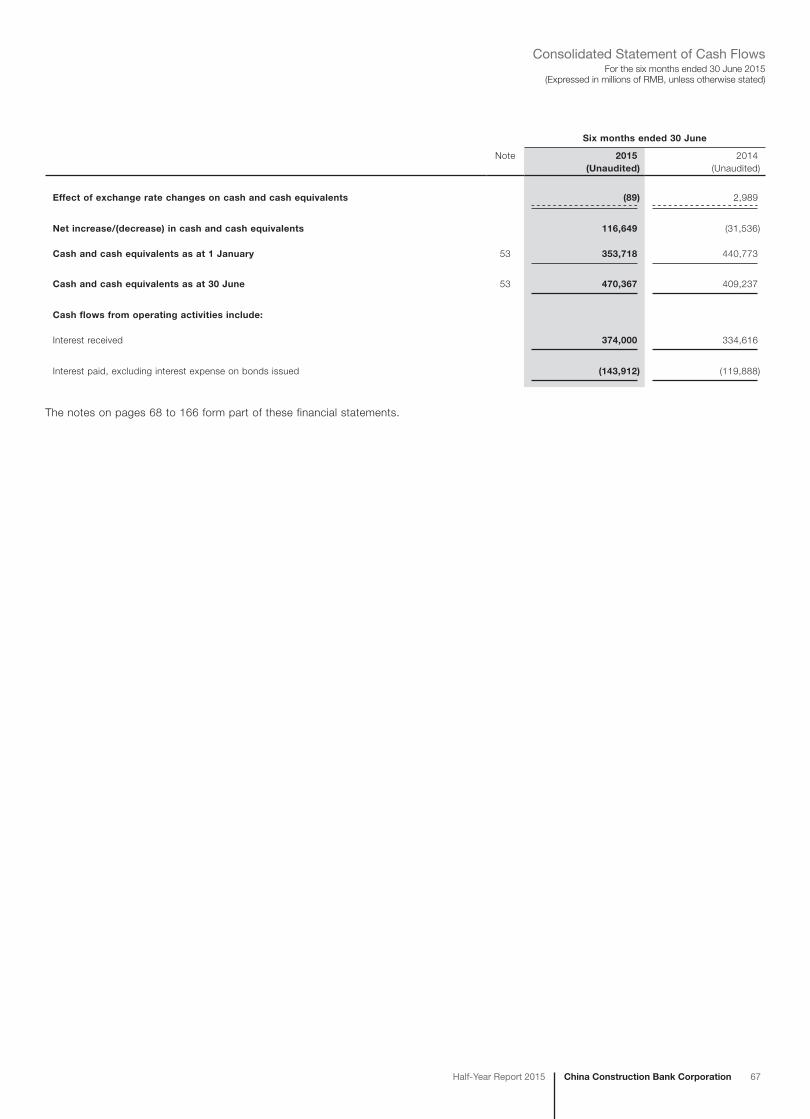
China Construction Bank CorporationHalf-Year Report 2015 67
For the six months ended 30 June 2015(Expressed in millions of RMB, unless otherwise stated)
Consolidated Statement of Cash Flows
Six months ended 30 June
Note 2015 2014(Unaudited) (Unaudited)
Effect of exchange rate changes on cash and cash equivalents (89) 2,989
Net increase/(decrease) in cash and cash equivalents 116,649 (31,536)
Cash and cash equivalents as at 1 January 53 353,718 440,773
Cash and cash equivalents as at 30 June 53 470,367 409,237
Cash flows from operating activities include:
Interest received 374,000 334,616
Interest paid, excluding interest expense on bonds issued (143,912) (119,888)
The notes on pages 68 to 166 form part of these financial statements.
Notes to the Financial Statements(Expressed in millions of RMB, unless otherwise stated)
68 China Construction Bank Corporation Half-Year Report 2015
1 Company informationThe history of China Construction Bank Corporation (the “Bank”) dates back to 1954, which was previously known as the People’s Construction Bank of China when it was established. It administered and disbursed government funds for construction and infrastructure related projects under the state economic plan. The People’s Construction Bank of China gradually became a full service commercial bank following the establishment of China Development Bank in 1994 to assume its policy lending functions. In 1996, the People’s Construction Bank of China changed its name to China Construction Bank (“CCB”). On 17 September 2004, China Construction Bank Corporation was formed as a joint-stock commercial bank in the People’s Republic of China (the “PRC”) as a result of a separation procedure undertaken by our predecessor, China Construction Bank. In October 2005 and September 2007, the Bank’s H-shares and A-shares were listed on Hong Kong Stock Exchange (Stock Code: 939) and Shanghai Stock Exchange (Stock Code: 601939) respectively.
The Bank obtained its finance permit No.B0004H111000001 from the China Banking Regulatory Commission (the “CBRC”) of the PRC. The Bank obtained its business license No.100000000039122 from the State Administration for Industry and Commerce of the PRC. The registered office of the Bank is located at No.25, Finance Street, Xicheng District, Beijing, the PRC.
The principal activities of the Bank and its subsidiaries (collectively the “Group”) are the provision of corporate and personal banking services, conducting treasury business, the provision of asset management, trustee, finance leasing, investment banking, insurance and other financial services. The Group operates in Mainland China and also has several overseas branches and subsidiaries. For the purpose of these financial statements, Mainland China refers to the PRC excluding Hong Kong Special Administrative Region of the PRC (“Hong Kong”), Macau Special Administrative Region of the PRC (“Macau”) and Taiwan. Overseas refers to countries and regions other than Mainland China.
The Bank is under the supervision of the banking regulatory bodies empowered by the State Council of the PRC (the “State Council”). The overseas financial operations of the Bank are under the supervision of their respective local jurisdictions. Central Huijin Investments Ltd. (“Huijin”), a wholly owned subsidiary of China Investment Corporation (“CIC”), exercises the rights and obligations as an investor on behalf of the PRC government.
2 Basis of preparation and significant accounting policies(1) Basis of preparation
The interim financial statements have been prepared in accordance with International Accounting Standard (“IAS”) 34 “Interim Financial Reporting” and with all applicable disclosure provisions of the Rules Governing the Listing of Securities on the Stock Exchange of Hong Kong Limited.
The unaudited interim financial statements contain selected explanatory notes, which provide explanations of events and transactions that are significant to the understanding of the changes in financial position and performance of the Group since the financial statements for the year ended 31 December 2014. The selected notes do not include all of the information and disclosures required for a full set of financial statements prepared in accordance with International Financial Reporting Standards (“IFRSs”), and should be read in conjunction with the Group’s annual financial statements for the year ended 31 December 2014.
(2) Use of estimates and assumptionsThe preparation of the interim financial statements requires management to make judgements, estimates and assumptions that affect the application of policies and reported amounts of assets and liabilities, income and expenses. Actual results in the future may differ from those reported as a result of the use of estimates and assumptions about future conditions.
(3) ConsolidationThe interim financial statements comprise the Bank and its subsidiaries and the Group’s interests in associates and joint ventures.
The financial results and performance of subsidiaries are included in the consolidated financial statements from the date that control commences until the date that control ceases. Necessary adjustments on the accounting period and accounting policies of subsidiaries are made to comply with those of the Bank. Intragroup balances and transactions, and any profits or losses arising from intragroup transactions are eliminated in full in preparing the consolidated financial statements.
The Group’s interest in associates or joint ventures is included from the date that significant influence or joint control commences until the date that significant influence or joint control ceases. Profits and losses resulting from transactions between the Group and its associates or joint ventures are eliminated to the extent of the Group’s interest in the associates or joint ventures.
(4) Significant accounting policiesIn the current interim period, the Group has adopted amendment to IAS 19 (Employee Benefits), annual improvements 2012 and annual improvements 2013, amended by International Accounting Standards Board (“IASB”). The adoption of the accounting standards has no significant impact to the interim financial statements.
Except for the facts as described above, the accounting policies adopted by the Group for the interim financial statements are consistent with those applied in the preparation of the Group’s annual financial statements for the year ended 31 December 2014.
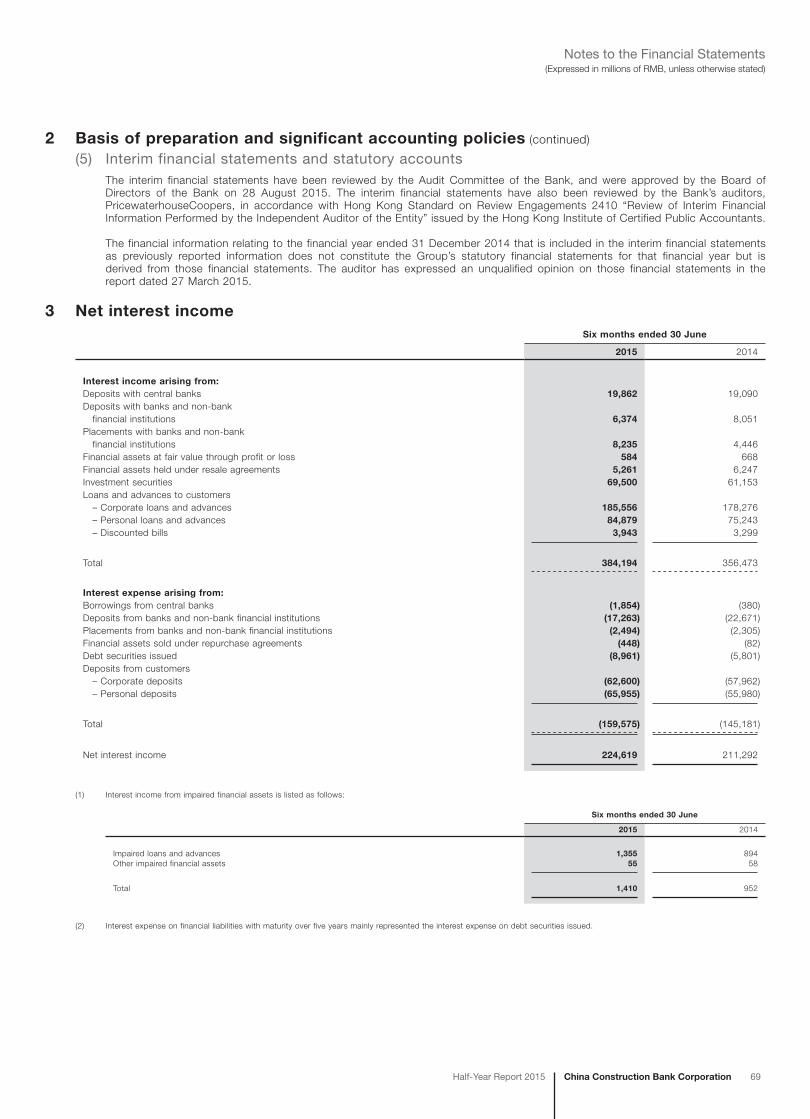
China Construction Bank CorporationHalf-Year Report 2015 69
(Expressed in millions of RMB, unless otherwise stated)Notes to the Financial Statements
2 Basis of preparation and significant accounting policies (continued)
(5) Interim financial statements and statutory accountsThe interim financial statements have been reviewed by the Audit Committee of the Bank, and were approved by the Board of Directors of the Bank on 28 August 2015. The interim financial statements have also been reviewed by the Bank’s auditors, PricewaterhouseCoopers, in accordance with Hong Kong Standard on Review Engagements 2410 “Review of Interim Financial Information Performed by the Independent Auditor of the Entity” issued by the Hong Kong Institute of Certified Public Accountants.
The financial information relating to the financial year ended 31 December 2014 that is included in the interim financial statements as previously reported information does not constitute the Group’s statutory financial statements for that financial year but is derived from those financial statements. The auditor has expressed an unqualified opinion on those financial statements in the report dated 27 March 2015.
3 Net interest incomeSix months ended 30 June
2015 2014
Interest income arising from:Deposits with central banks 19,862 19,090Deposits with banks and non-bank financial institutions 6,374 8,051Placements with banks and non-bank financial institutions 8,235 4,446Financial assets at fair value through profit or loss 584 668Financial assets held under resale agreements 5,261 6,247Investment securities 69,500 61,153Loans and advances to customers – Corporate loans and advances 185,556 178,276 – Personal loans and advances 84,879 75,243 – Discounted bills 3,943 3,299
Total 384,194 356,473
Interest expense arising from:Borrowings from central banks (1,854) (380)Deposits from banks and non-bank financial institutions (17,263) (22,671)Placements from banks and non-bank financial institutions (2,494) (2,305)Financial assets sold under repurchase agreements (448) (82)Debt securities issued (8,961) (5,801)Deposits from customers – Corporate deposits (62,600) (57,962) – Personal deposits (65,955) (55,980)
Total (159,575) (145,181)
Net interest income 224,619 211,292
(1) Interest income from impaired financial assets is listed as follows:
Six months ended 30 June
2015 2014
Impaired loans and advances 1,355 894Other impaired financial assets 55 58
Total 1,410 952
(2) Interest expense on financial liabilities with maturity over five years mainly represented the interest expense on debt securities issued.
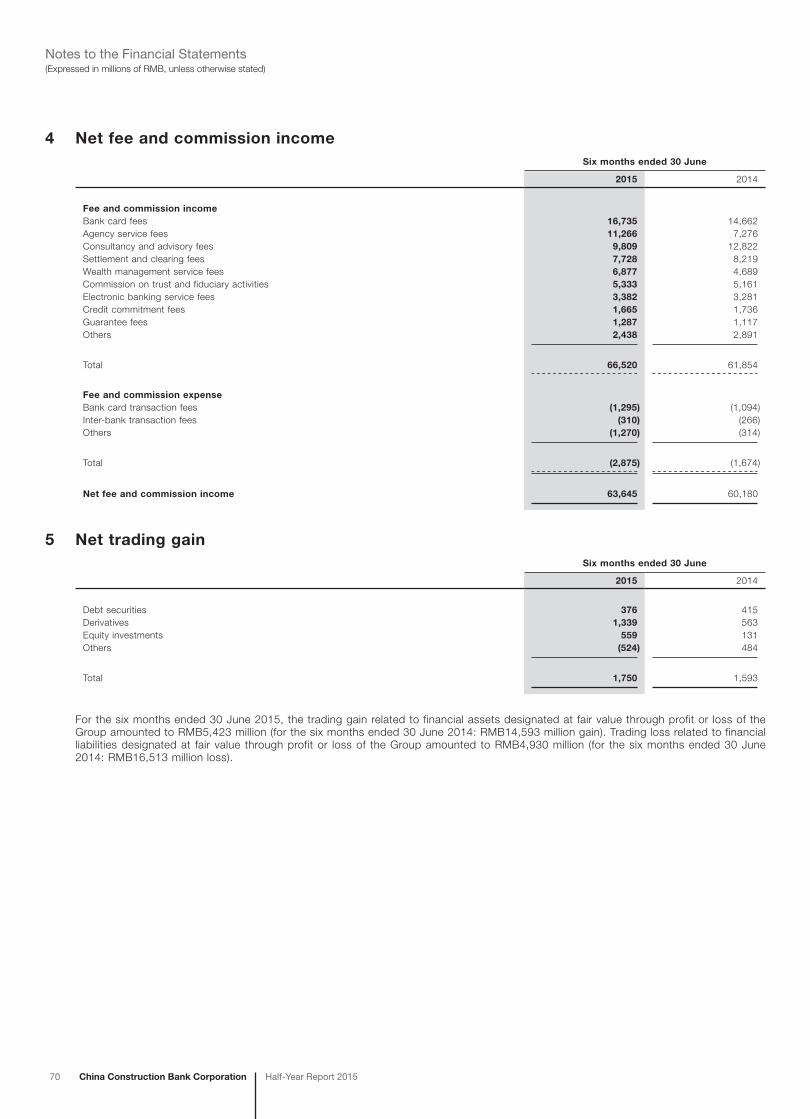
70 China Construction Bank Corporation Half-Year Report 2015
(Expressed in millions of RMB, unless otherwise stated)Notes to the Financial Statements
4 Net fee and commission incomeSix months ended 30 June
2015 2014
Fee and commission incomeBank card fees 16,735 14,662Agency service fees 11,266 7,276Consultancy and advisory fees 9,809 12,822Settlement and clearing fees 7,728 8,219Wealth management service fees 6,877 4,689Commission on trust and fiduciary activities 5,333 5,161Electronic banking service fees 3,382 3,281Credit commitment fees 1,665 1,736Guarantee fees 1,287 1,117Others 2,438 2,891
Total 66,520 61,854
Fee and commission expenseBank card transaction fees (1,295) (1,094)Inter-bank transaction fees (310) (266)Others (1,270) (314)
Total (2,875) (1,674)
Net fee and commission income 63,645 60,180
5 Net trading gainSix months ended 30 June
2015 2014
Debt securities 376 415Derivatives 1,339 563Equity investments 559 131Others (524) 484
Total 1,750 1,593
For the six months ended 30 June 2015, the trading gain related to financial assets designated at fair value through profit or loss of the Group amounted to RMB5,423 million (for the six months ended 30 June 2014: RMB14,593 million gain). Trading loss related to financial liabilities designated at fair value through profit or loss of the Group amounted to RMB4,930 million (for the six months ended 30 June 2014: RMB16,513 million loss).
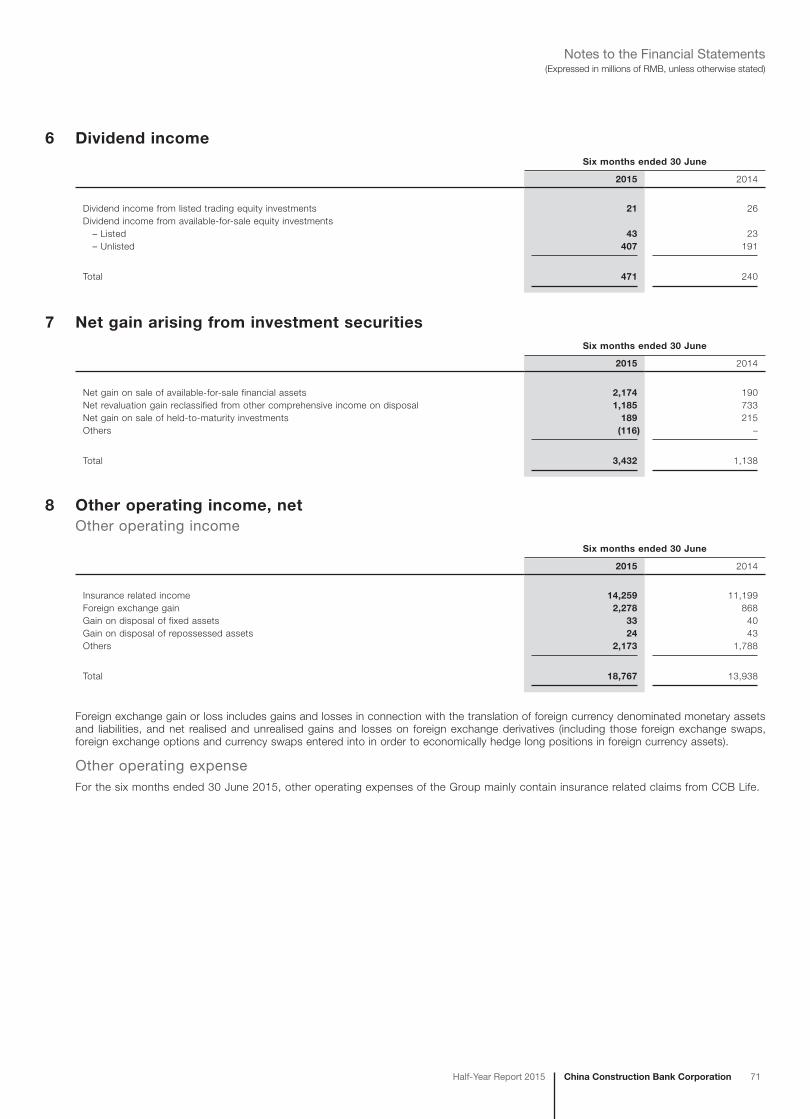
China Construction Bank CorporationHalf-Year Report 2015 71
(Expressed in millions of RMB, unless otherwise stated)Notes to the Financial Statements
6 Dividend incomeSix months ended 30 June
2015 2014
Dividend income from listed trading equity investments 21 26Dividend income from available-for-sale equity investments – Listed 43 23 – Unlisted 407 191
Total 471 240
7 Net gain arising from investment securitiesSix months ended 30 June
2015 2014
Net gain on sale of available-for-sale financial assets 2,174 190Net revaluation gain reclassified from other comprehensive income on disposal 1,185 733Net gain on sale of held-to-maturity investments 189 215Others (116) –
Total 3,432 1,138
8 Other operating income, netOther operating income
Six months ended 30 June
2015 2014
Insurance related income 14,259 11,199Foreign exchange gain 2,278 868Gain on disposal of fixed assets 33 40Gain on disposal of repossessed assets 24 43Others 2,173 1,788
Total 18,767 13,938
Foreign exchange gain or loss includes gains and losses in connection with the translation of foreign currency denominated monetary assets and liabilities, and net realised and unrealised gains and losses on foreign exchange derivatives (including those foreign exchange swaps, foreign exchange options and currency swaps entered into in order to economically hedge long positions in foreign currency assets).
Other operating expenseFor the six months ended 30 June 2015, other operating expenses of the Group mainly contain insurance related claims from CCB Life.

72 China Construction Bank Corporation Half-Year Report 2015
(Expressed in millions of RMB, unless otherwise stated)Notes to the Financial Statements
9 Operating expensesSix months ended 30 June
2015 2014
Staff costs – Salaries, bonuses, allowances and subsidies 27,213 25,718 – Other social insurance and welfare 3,516 3,670 – Housing funds 3,040 2,794 – Union running costs and employee education costs 977 1,062 – Defined contribution plans accrued 6,060 5,684 – Early retirement expenses 51 26 – Compensation to employees for termination of employment relationship 4 3
40,861 38,957
Premises and equipment expenses – Depreciation charges 8,409 7,358 – Rent and property management expenses 4,164 3,691 – Maintenance 923 1,086 – Utilities 988 913 – Others 243 712
14,727 13,760
Business taxes and surcharges 18,234 17,231Amortisation expenses 1,240 1,192Audit fees 71 72Other general and administrative expenses 12,296 12,927
Total 87,429 84,139
10 Impairment lossesSix months ended 30 June
2015 2014
Loans and advances to customers 40,441 21,286 – Additions 45,924 26,365 – Releases (5,483) (5,079)Available-for-sale debt securities (320) 22Held-to-maturity investments 172 320Receivables 7 84Others 949 1,410
Total 41,249 23,122

China Construction Bank CorporationHalf-Year Report 2015 73
(Expressed in millions of RMB, unless otherwise stated)Notes to the Financial Statements
11 Income tax expense(1) Income tax expense
Six months ended 30 June
2015 2014
Current tax 39,211 36,191 – Mainland China 38,370 35,970 – Hong Kong 582 93 – Other countries and regions 259 128Adjustments for prior years (1,216) 113Deferred tax (1,032) 2,242
Total 36,963 38,546
The provisions of income taxes for Mainland China and Hong Kong are calculated at 25% and 16.5% of the estimated taxable income from Mainland China and Hong Kong operations for the period respectively. Taxation for other overseas operations is charged at the appropriate current rates of taxation ruling in the relevant tax jurisdictions.
(2) Reconciliation between income tax expense and accounting profitSix months ended 30 June
Note 2015 2014
Profit before tax 169,207 169,516
Income tax calculated at statutory tax rates at 25% 42,302 42,379
Non-deductible expenses (i) 1,968 1,048Non-taxable income (ii) (6,091) (4,994)Adjustments on income tax for prior years which affect profit or loss (1,216) 113
Income tax expense 36,963 38,546
(i) Non-deductible expenses primarily include losses resulting from write-off of loans, staff costs and entertainment expenses in excess of those deductible under the relevant PRC tax regulations.
(ii) Non-taxable income primarily includes interest income from PRC government bonds.
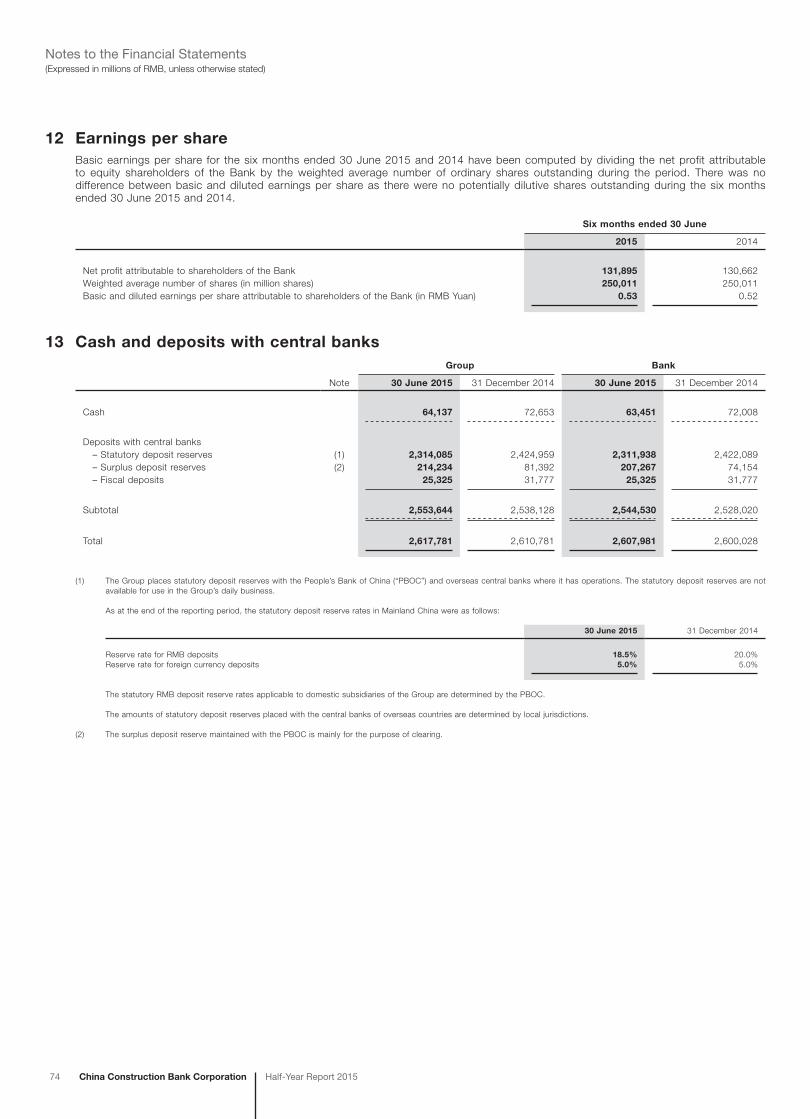
74 China Construction Bank Corporation Half-Year Report 2015
(Expressed in millions of RMB, unless otherwise stated)Notes to the Financial Statements
12 Earnings per shareBasic earnings per share for the six months ended 30 June 2015 and 2014 have been computed by dividing the net profit attributable to equity shareholders of the Bank by the weighted average number of ordinary shares outstanding during the period. There was no difference between basic and diluted earnings per share as there were no potentially dilutive shares outstanding during the six months ended 30 June 2015 and 2014.
Six months ended 30 June
2015 2014
Net profit attributable to shareholders of the Bank 131,895 130,662Weighted average number of shares (in million shares) 250,011 250,011Basic and diluted earnings per share attributable to shareholders of the Bank (in RMB Yuan) 0.53 0.52
13 Cash and deposits with central banksGroup Bank
Note 30 June 2015 31 December 2014 30 June 2015 31 December 2014
Cash 64,137 72,653 63,451 72,008
Deposits with central banks – Statutory deposit reserves (1) 2,314,085 2,424,959 2,311,938 2,422,089 – Surplus deposit reserves (2) 214,234 81,392 207,267 74,154 – Fiscal deposits 25,325 31,777 25,325 31,777
Subtotal 2,553,644 2,538,128 2,544,530 2,528,020
Total 2,617,781 2,610,781 2,607,981 2,600,028
(1) The Group places statutory deposit reserves with the People’s Bank of China (“PBOC”) and overseas central banks where it has operations. The statutory deposit reserves are not available for use in the Group’s daily business.
As at the end of the reporting period, the statutory deposit reserve rates in Mainland China were as follows:
30 June 2015 31 December 2014
Reserve rate for RMB deposits 18.5% 20.0%Reserve rate for foreign currency deposits 5.0% 5.0%
The statutory RMB deposit reserve rates applicable to domestic subsidiaries of the Group are determined by the PBOC.
The amounts of statutory deposit reserves placed with the central banks of overseas countries are determined by local jurisdictions.
(2) The surplus deposit reserve maintained with the PBOC is mainly for the purpose of clearing.
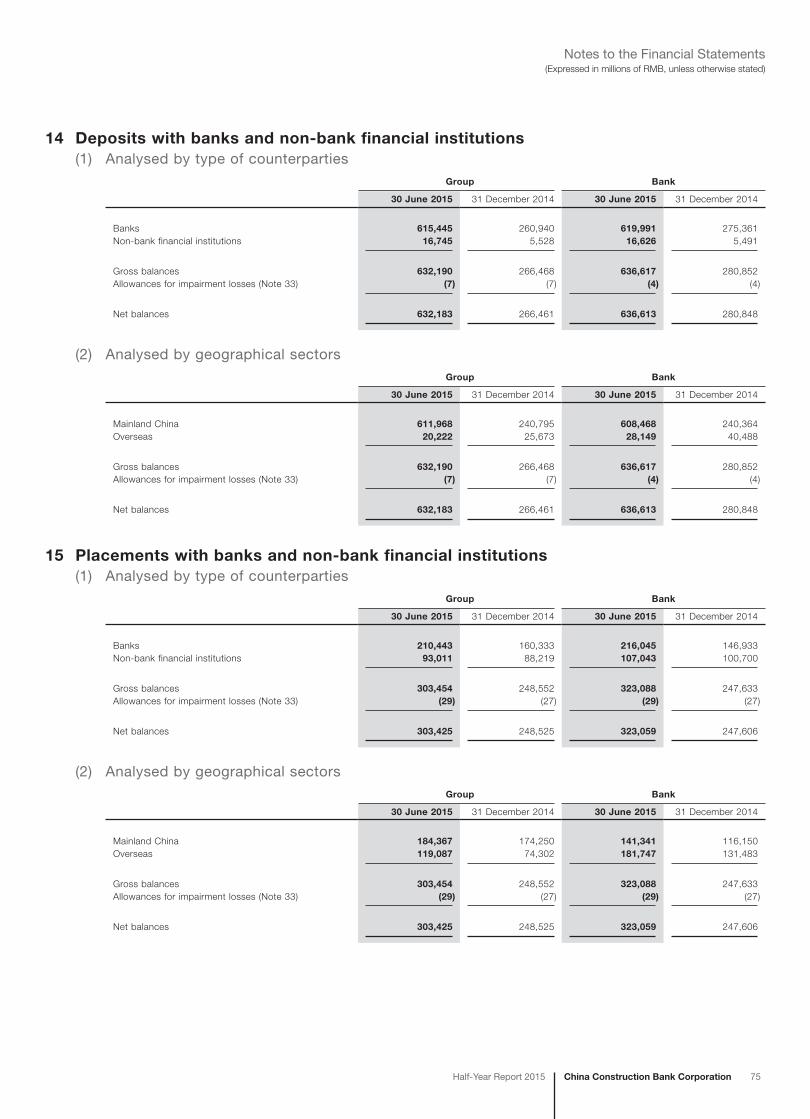
China Construction Bank CorporationHalf-Year Report 2015 75
(Expressed in millions of RMB, unless otherwise stated)Notes to the Financial Statements
14 Deposits with banks and non-bank financial institutions(1) Analysed by type of counterparties
Group Bank
30 June 2015 31 December 2014 30 June 2015 31 December 2014
Banks 615,445 260,940 619,991 275,361Non-bank financial institutions 16,745 5,528 16,626 5,491
Gross balances 632,190 266,468 636,617 280,852Allowances for impairment losses (Note 33) (7) (7) (4) (4)
Net balances 632,183 266,461 636,613 280,848
(2) Analysed by geographical sectorsGroup Bank
30 June 2015 31 December 2014 30 June 2015 31 December 2014
Mainland China 611,968 240,795 608,468 240,364Overseas 20,222 25,673 28,149 40,488
Gross balances 632,190 266,468 636,617 280,852Allowances for impairment losses (Note 33) (7) (7) (4) (4)
Net balances 632,183 266,461 636,613 280,848
15 Placements with banks and non-bank financial institutions(1) Analysed by type of counterparties
Group Bank
30 June 2015 31 December 2014 30 June 2015 31 December 2014
Banks 210,443 160,333 216,045 146,933Non-bank financial institutions 93,011 88,219 107,043 100,700
Gross balances 303,454 248,552 323,088 247,633Allowances for impairment losses (Note 33) (29) (27) (29) (27)
Net balances 303,425 248,525 323,059 247,606
(2) Analysed by geographical sectorsGroup Bank
30 June 2015 31 December 2014 30 June 2015 31 December 2014
Mainland China 184,367 174,250 141,341 116,150Overseas 119,087 74,302 181,747 131,483
Gross balances 303,454 248,552 323,088 247,633Allowances for impairment losses (Note 33) (29) (27) (29) (27)
Net balances 303,425 248,525 323,059 247,606
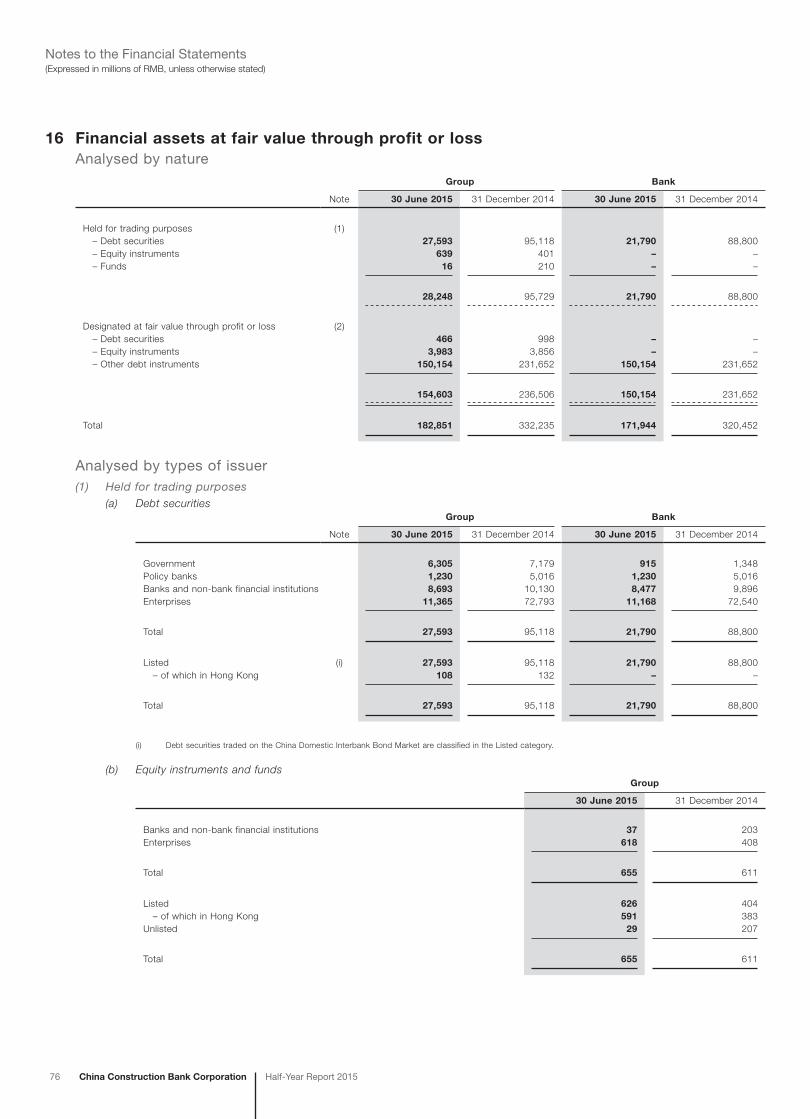
76 China Construction Bank Corporation Half-Year Report 2015
(Expressed in millions of RMB, unless otherwise stated)Notes to the Financial Statements
16 Financial assets at fair value through profit or lossAnalysed by nature
Group Bank
Note 30 June 2015 31 December 2014 30 June 2015 31 December 2014
Held for trading purposes (1) – Debt securities 27,593 95,118 21,790 88,800 – Equity instruments 639 401 – – – Funds 16 210 – –
28,248 95,729 21,790 88,800
Designated at fair value through profit or loss (2) – Debt securities 466 998 – – – Equity instruments 3,983 3,856 – – – Other debt instruments 150,154 231,652 150,154 231,652
154,603 236,506 150,154 231,652
Total 182,851 332,235 171,944 320,452
Analysed by types of issuer(1) Held for trading purposes
(a) Debt securitiesGroup Bank
Note 30 June 2015 31 December 2014 30 June 2015 31 December 2014
Government 6,305 7,179 915 1,348Policy banks 1,230 5,016 1,230 5,016Banks and non-bank financial institutions 8,693 10,130 8,477 9,896Enterprises 11,365 72,793 11,168 72,540
Total 27,593 95,118 21,790 88,800
Listed (i) 27,593 95,118 21,790 88,800 – of which in Hong Kong 108 132 – –
Total 27,593 95,118 21,790 88,800
(i) Debt securities traded on the China Domestic Interbank Bond Market are classified in the Listed category.
(b) Equity instruments and fundsGroup
30 June 2015 31 December 2014
Banks and non-bank financial institutions 37 203Enterprises 618 408
Total 655 611
Listed 626 404 – of which in Hong Kong 591 383Unlisted 29 207
Total 655 611

China Construction Bank CorporationHalf-Year Report 2015 77
(Expressed in millions of RMB, unless otherwise stated)Notes to the Financial Statements
16 Financial assets at fair value through profit or loss (continued)
Analysed by types of issuer (continued)
(2) Designated at fair value through profit or loss(a) Debt securities
Group
30 June 2015 31 December 2014
Enterprises 466 998
Total 466 998
Listed – 31 – of which in Hong Kong – 31Unlisted 466 967
Total 466 998
(b) Equity instrumentsGroup
30 June 2015 31 December 2014
Banks and non-bank financial institutions 937 1,035Enterprises 3,046 2,821
Total 3,983 3,856
Listed 1,873 1,904 – of which in Hong Kong 1,869 1,338Unlisted 2,110 1,952
Total 3,983 3,856
(c) Other debt instrumentsGroup Bank
30 June 2015 31 December 2014 30 June 2015 31 December 2014
Banks and non-bank financial institutions 148,866 231,592 148,866 231,592Enterprises 1,288 60 1,288 60
Total 150,154 231,652 150,154 231,652
Other debt instruments were mainly the deposits with banks invested by principal guaranteed wealth management products.
There was no significant limitation on the ability of the Group and the Bank to dispose of financial assets at fair value through profit or loss.

78 China Construction Bank Corporation Half-Year Report 2015
(Expressed in millions of RMB, unless otherwise stated)Notes to the Financial Statements
17 Derivatives and hedge accounting(1) Analysed by type of contract
Group30 June 2015 31 December 2014
Notionalamounts Assets Liabilities
Notionalamounts Assets Liabilities
Interest rate contracts 433,184 1,812 1,453 211,495 1,558 1,376Exchange rate contracts 2,263,820 17,171 15,187 1,560,367 10,825 10,323Other contracts 60,229 2,906 299 28,377 1,386 674
Total 2,757,233 21,889 16,939 1,800,239 13,769 12,373
Bank30 June 2015 31 December 2014
Notionalamounts Assets Liabilities
Notionalamounts Assets Liabilities
Interest rate contracts 421,559 1,759 1,393 207,392 1,541 1,357Exchange rate contracts 1,808,395 12,959 12,864 1,252,813 7,516 8,581Other contracts 57,962 2,149 299 26,347 823 674
Total 2,287,916 16,867 14,556 1,486,552 9,880 10,612
(2) Analysed by credit risk-weighted assetsGroup Bank
30 June 2015 31 December 2014 30 June 2015 31 December 2014
Counterparty credit default risk-weighted assets – Interest rate contracts 1,808 1,615 1,761 1,603 – Exchange rate contracts 24,909 16,211 20,919 11,618 – Other contracts 2,484 1,564 1,555 915
Subtotal 29,201 19,390 24,235 14,136
Credit value adjustment 13,070 7,921 11,208 6,415
Total 42,271 27,311 35,443 20,551
The notional amounts of derivatives only represent the unsettled transaction volumes as at the end of the reporting period, instead of the amounts of risk assets. Since 1 January 2013 the Group has adopted Administrative Measures for the Capital of Commercial Banks (for Trial Implementation) and other related policies. According to the new rules set out by the CBRC, the credit risk-weighted assets included credit valuation adjustments, with the considerations of the status of counterparties, maturity characteristics and back-to-back client-driven transactions.
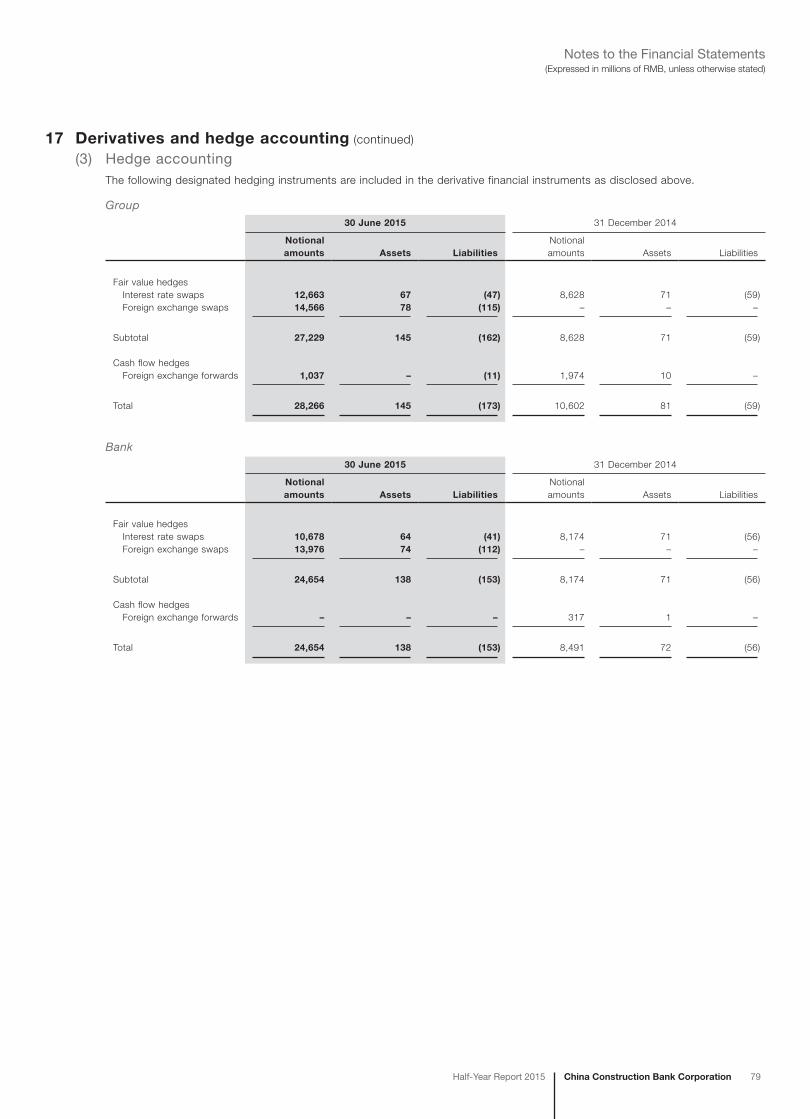
China Construction Bank CorporationHalf-Year Report 2015 79
(Expressed in millions of RMB, unless otherwise stated)Notes to the Financial Statements
17 Derivatives and hedge accounting (continued)
(3) Hedge accountingThe following designated hedging instruments are included in the derivative financial instruments as disclosed above.
Group30 June 2015 31 December 2014
Notionalamounts Assets Liabilities
Notionalamounts Assets Liabilities
Fair value hedges Interest rate swaps 12,663 67 (47) 8,628 71 (59) Foreign exchange swaps 14,566 78 (115) – – –
Subtotal 27,229 145 (162) 8,628 71 (59)
Cash flow hedges Foreign exchange forwards 1,037 – (11) 1,974 10 –
Total 28,266 145 (173) 10,602 81 (59)
Bank30 June 2015 31 December 2014
Notionalamounts Assets Liabilities
Notionalamounts Assets Liabilities
Fair value hedges Interest rate swaps 10,678 64 (41) 8,174 71 (56) Foreign exchange swaps 13,976 74 (112) – – –
Subtotal 24,654 138 (153) 8,174 71 (56)
Cash flow hedges Foreign exchange forwards – – – 317 1 –
Total 24,654 138 (153) 8,491 72 (56)

80 China Construction Bank Corporation Half-Year Report 2015
(Expressed in millions of RMB, unless otherwise stated)Notes to the Financial Statements
17 Derivatives and hedge accounting (continued)
(3) Hedge accounting (continued)
(a) Fair value hedgeThe Group uses interest rate swaps and foreign exchange swaps to hedge against changes in fair value of available-for-sale financial assets, certificates of deposit issued, loans and advances to customers arising from changes in interest rates and exchange rates.
Gains or losses on fair value hedges are as follows:
The Group and the Bank
Six months ended 30 June
2015 2014
Net (losses)/gains on – hedging instruments (25) 27 – hedged items 25 (27)
The gain and loss arising from ineffective portion of fair value hedge was immaterial for the six month ended 30 June 2014 and 2015.
(b) Cash flow hedgeThe Group uses foreign exchange forwards to hedge against exposures to cash flow variability primarily from foreign exchange risks of loans and advances to customers. The maturities of hedging instruments and hedged items are both within one year.
For the six month ended 30 June 2015, the Group’s and the Bank’s net loss from the cash flow hedge of RMB2 million and RMB1 million respectively were recognised in other comprehensive income (for six month ended 30 June 2014: net gain 168 million) and the gain and loss arising from ineffective portion of cash flow hedge was immaterial for six months ended 30 June 2015.
There were no transactions for which cash flow hedge accounting had to be ceased for the six months ended 30 June 2015, as a result of the highly probable cash flows no longer being expected to occur.
18 Financial assets held under resale agreementsFinancial assets held under resale agreements by underlying assets are shown as follows:
Group Bank
30 June 2015 31 December 2014 30 June 2015 31 December 2014
Debt securities – Government bonds 34,282 22,251 34,115 22,198 – D ebt securities issued by banks and non-bank financial
institutions 103,350 67,930 102,980 67,676
Subtotal 137,632 90,181 137,095 89,874
Discounted bills 358,226 183,570 358,226 183,570
Total and net balances 495,858 273,751 495,321 273,444
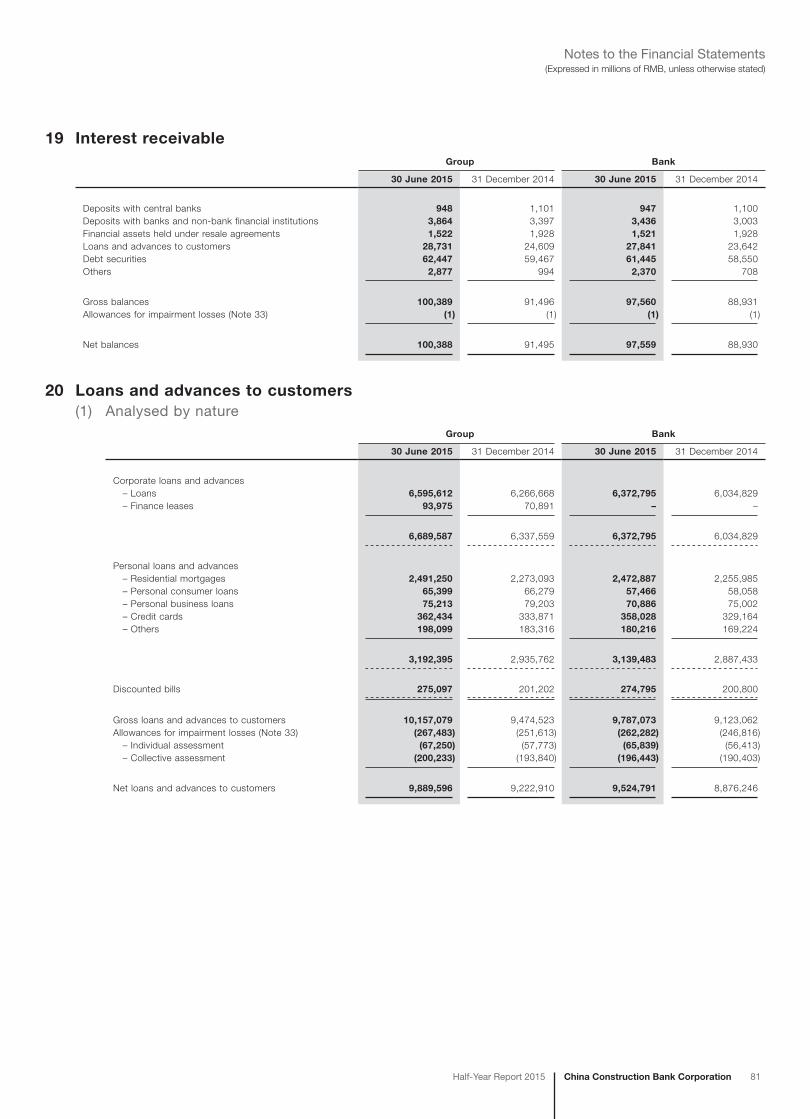
China Construction Bank CorporationHalf-Year Report 2015 81
(Expressed in millions of RMB, unless otherwise stated)Notes to the Financial Statements
19 Interest receivableGroup Bank
30 June 2015 31 December 2014 30 June 2015 31 December 2014
Deposits with central banks 948 1,101 947 1,100Deposits with banks and non-bank financial institutions 3,864 3,397 3,436 3,003Financial assets held under resale agreements 1,522 1,928 1,521 1,928Loans and advances to customers 28,731 24,609 27,841 23,642Debt securities 62,447 59,467 61,445 58,550Others 2,877 994 2,370 708
Gross balances 100,389 91,496 97,560 88,931Allowances for impairment losses (Note 33) (1) (1) (1) (1)
Net balances 100,388 91,495 97,559 88,930
20 Loans and advances to customers(1) Analysed by nature
Group Bank
30 June 2015 31 December 2014 30 June 2015 31 December 2014
Corporate loans and advances – Loans 6,595,612 6,266,668 6,372,795 6,034,829 – Finance leases 93,975 70,891 – –
6,689,587 6,337,559 6,372,795 6,034,829
Personal loans and advances – Residential mortgages 2,491,250 2,273,093 2,472,887 2,255,985 – Personal consumer loans 65,399 66,279 57,466 58,058 – Personal business loans 75,213 79,203 70,886 75,002 – Credit cards 362,434 333,871 358,028 329,164 – Others 198,099 183,316 180,216 169,224
3,192,395 2,935,762 3,139,483 2,887,433
Discounted bills 275,097 201,202 274,795 200,800
Gross loans and advances to customers 10,157,079 9,474,523 9,787,073 9,123,062Allowances for impairment losses (Note 33) (267,483) (251,613) (262,282) (246,816) – Individual assessment (67,250) (57,773) (65,839) (56,413) – Collective assessment (200,233) (193,840) (196,443) (190,403)
Net loans and advances to customers 9,889,596 9,222,910 9,524,791 8,876,246
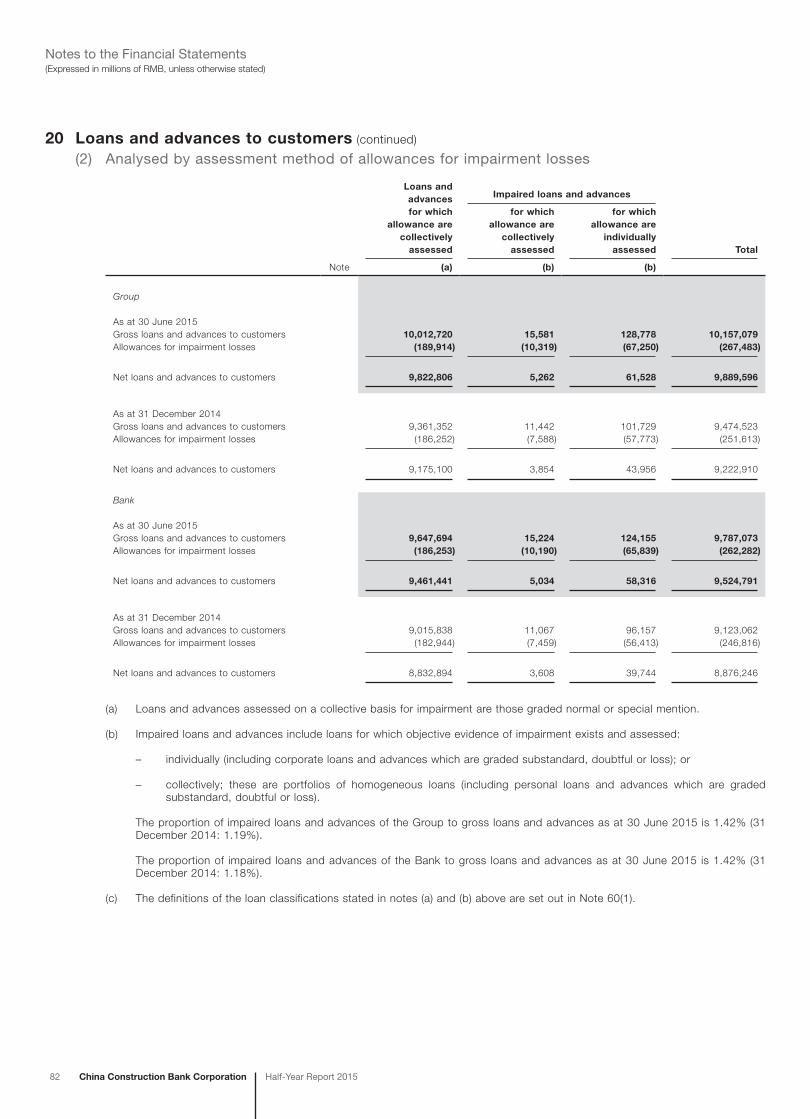
82 China Construction Bank Corporation Half-Year Report 2015
(Expressed in millions of RMB, unless otherwise stated)Notes to the Financial Statements
20 Loans and advances to customers (continued)
(2) Analysed by assessment method of allowances for impairment losses
Loans andadvancesfor which
allowance arecollectively
assessed
Impaired loans and advances
Total
for whichallowance are
collectivelyassessed
for whichallowance are
individuallyassessed
Note (a) (b) (b)
Group
As at 30 June 2015Gross loans and advances to customers 10,012,720 15,581 128,778 10,157,079Allowances for impairment losses (189,914) (10,319) (67,250) (267,483)
Net loans and advances to customers 9,822,806 5,262 61,528 9,889,596
As at 31 December 2014Gross loans and advances to customers 9,361,352 11,442 101,729 9,474,523Allowances for impairment losses (186,252) (7,588) (57,773) (251,613)
Net loans and advances to customers 9,175,100 3,854 43,956 9,222,910
Bank
As at 30 June 2015Gross loans and advances to customers 9,647,694 15,224 124,155 9,787,073Allowances for impairment losses (186,253) (10,190) (65,839) (262,282)
Net loans and advances to customers 9,461,441 5,034 58,316 9,524,791
As at 31 December 2014Gross loans and advances to customers 9,015,838 11,067 96,157 9,123,062Allowances for impairment losses (182,944) (7,459) (56,413) (246,816)
Net loans and advances to customers 8,832,894 3,608 39,744 8,876,246
(a) Loans and advances assessed on a collective basis for impairment are those graded normal or special mention.
(b) Impaired loans and advances include loans for which objective evidence of impairment exists and assessed:
– individually (including corporate loans and advances which are graded substandard, doubtful or loss); or
– collectively; these are portfolios of homogeneous loans (including personal loans and advances which are graded substandard, doubtful or loss).
The proportion of impaired loans and advances of the Group to gross loans and advances as at 30 June 2015 is 1.42% (31 December 2014: 1.19%).
The proportion of impaired loans and advances of the Bank to gross loans and advances as at 30 June 2015 is 1.42% (31 December 2014: 1.18%).
(c) The definitions of the loan classifications stated in notes (a) and (b) above are set out in Note 60(1).
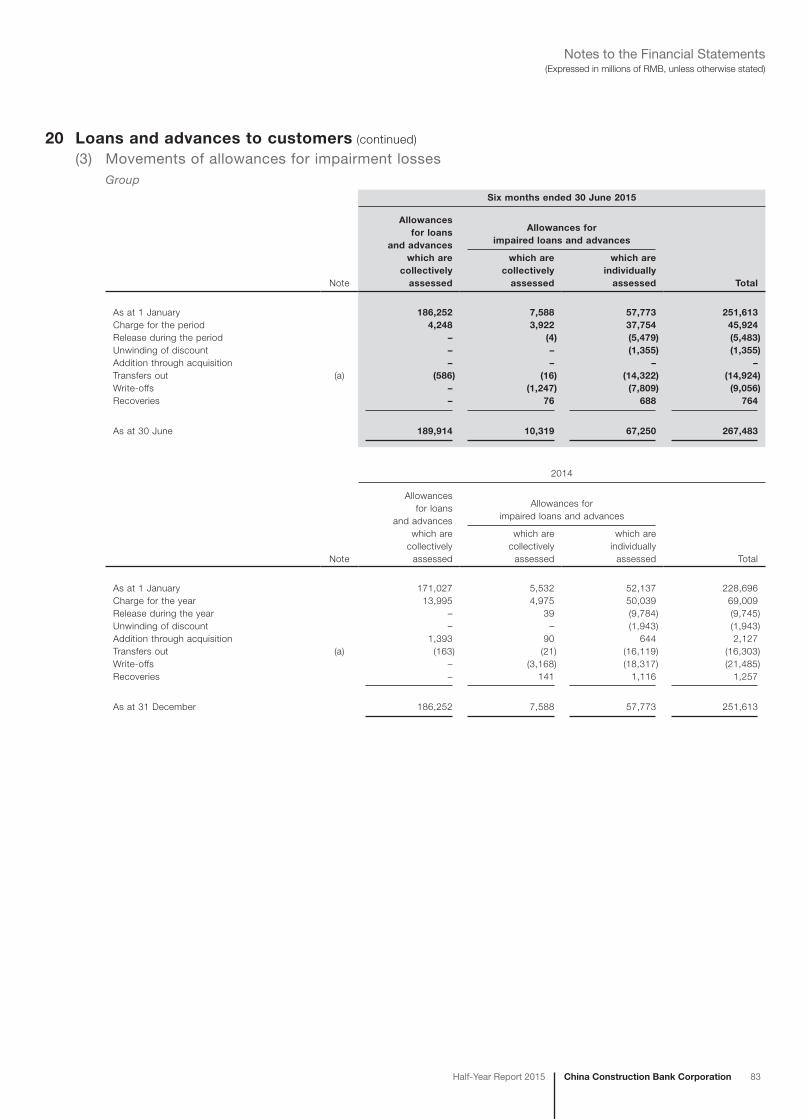
China Construction Bank CorporationHalf-Year Report 2015 83
(Expressed in millions of RMB, unless otherwise stated)Notes to the Financial Statements
20 Loans and advances to customers (continued)
(3) Movements of allowances for impairment lossesGroup
Six months ended 30 June 2015
Note
Allowancesfor loans
and advanceswhich are
collectivelyassessed
Allowances for impaired loans and advances
Total
which arecollectively
assessed
which areindividually
assessed
As at 1 January 186,252 7,588 57,773 251,613Charge for the period 4,248 3,922 37,754 45,924Release during the period – (4) (5,479) (5,483)Unwinding of discount – – (1,355) (1,355)Addition through acquisition – – – –Transfers out (a) (586) (16) (14,322) (14,924)Write-offs – (1,247) (7,809) (9,056)Recoveries – 76 688 764
As at 30 June 189,914 10,319 67,250 267,483
2014
Note
Allowancesfor loans
and advanceswhich are
collectivelyassessed
Allowances for impaired loans and advances
Total
which arecollectively
assessed
which areindividually
assessed
As at 1 January 171,027 5,532 52,137 228,696Charge for the year 13,995 4,975 50,039 69,009Release during the year – 39 (9,784) (9,745)Unwinding of discount – – (1,943) (1,943)Addition through acquisition 1,393 90 644 2,127Transfers out (a) (163) (21) (16,119) (16,303)Write-offs – (3,168) (18,317) (21,485)Recoveries – 141 1,116 1,257
As at 31 December 186,252 7,588 57,773 251,613
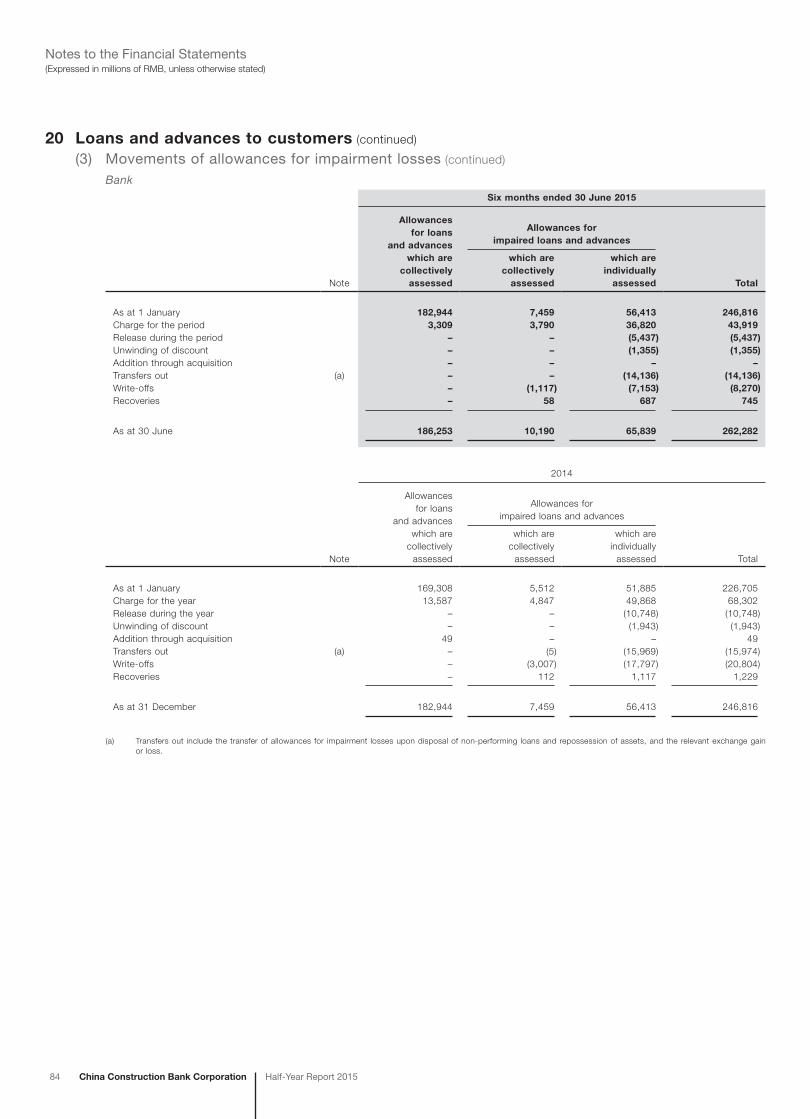
84 China Construction Bank Corporation Half-Year Report 2015
(Expressed in millions of RMB, unless otherwise stated)Notes to the Financial Statements
20 Loans and advances to customers (continued)
(3) Movements of allowances for impairment losses (continued)
BankSix months ended 30 June 2015
Note
Allowancesfor loans
and advanceswhich are
collectivelyassessed
Allowances for impaired loans and advances
Total
which arecollectively
assessed
which areindividually
assessed
As at 1 January 182,944 7,459 56,413 246,816Charge for the period 3,309 3,790 36,820 43,919Release during the period – – (5,437) (5,437)Unwinding of discount – – (1,355) (1,355)Addition through acquisition – – – –Transfers out (a) – – (14,136) (14,136)Write-offs – (1,117) (7,153) (8,270)Recoveries – 58 687 745
As at 30 June 186,253 10,190 65,839 262,282
2014
Note
Allowancesfor loans
and advanceswhich are
collectivelyassessed
Allowances forimpaired loans and advances
Total
which arecollectively
assessed
which areindividually
assessed
As at 1 January 169,308 5,512 51,885 226,705Charge for the year 13,587 4,847 49,868 68,302Release during the year – – (10,748) (10,748)Unwinding of discount – – (1,943) (1,943)Addition through acquisition 49 – – 49Transfers out (a) – (5) (15,969) (15,974)Write-offs – (3,007) (17,797) (20,804)Recoveries – 112 1,117 1,229
As at 31 December 182,944 7,459 56,413 246,816
(a) Transfers out include the transfer of allowances for impairment losses upon disposal of non-performing loans and repossession of assets, and the relevant exchange gain or loss.
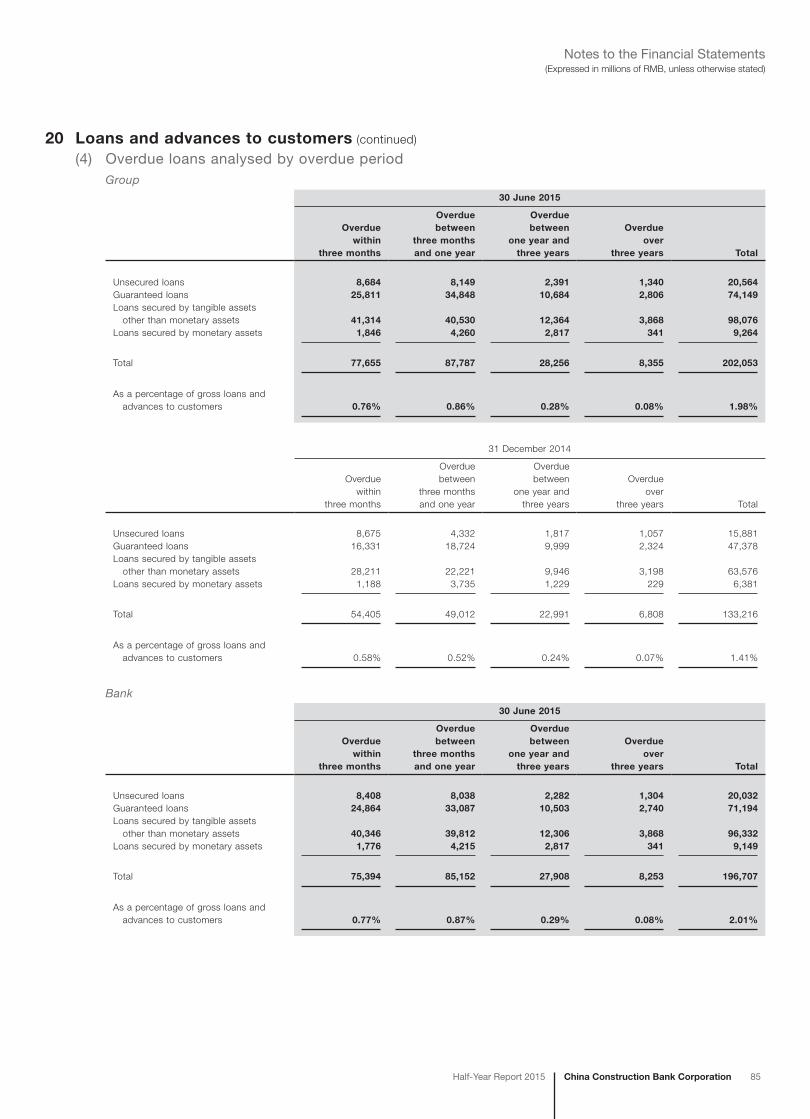
China Construction Bank CorporationHalf-Year Report 2015 85
(Expressed in millions of RMB, unless otherwise stated)Notes to the Financial Statements
20 Loans and advances to customers (continued)
(4) Overdue loans analysed by overdue periodGroup
30 June 2015
Overduewithin
three months
Overduebetween
three monthsand one year
Overduebetween
one year andthree years
Overdueover
three years Total
Unsecured loans 8,684 8,149 2,391 1,340 20,564Guaranteed loans 25,811 34,848 10,684 2,806 74,149Loans secured by tangible assets other than monetary assets 41,314 40,530 12,364 3,868 98,076Loans secured by monetary assets 1,846 4,260 2,817 341 9,264
Total 77,655 87,787 28,256 8,355 202,053
As a percentage of gross loans and advances to customers 0.76% 0.86% 0.28% 0.08% 1.98%
31 December 2014
Overduewithin
three months
Overduebetween
three monthsand one year
Overduebetween
one year andthree years
Overdueover
three years Total
Unsecured loans 8,675 4,332 1,817 1,057 15,881Guaranteed loans 16,331 18,724 9,999 2,324 47,378Loans secured by tangible assets other than monetary assets 28,211 22,221 9,946 3,198 63,576Loans secured by monetary assets 1,188 3,735 1,229 229 6,381
Total 54,405 49,012 22,991 6,808 133,216
As a percentage of gross loans and advances to customers 0.58% 0.52% 0.24% 0.07% 1.41%
Bank30 June 2015
Overduewithin
three months
Overduebetween
three monthsand one year
Overduebetween
one year andthree years
Overdueover
three years Total
Unsecured loans 8,408 8,038 2,282 1,304 20,032Guaranteed loans 24,864 33,087 10,503 2,740 71,194Loans secured by tangible assets other than monetary assets 40,346 39,812 12,306 3,868 96,332Loans secured by monetary assets 1,776 4,215 2,817 341 9,149
Total 75,394 85,152 27,908 8,253 196,707
As a percentage of gross loans and advances to customers 0.77% 0.87% 0.29% 0.08% 2.01%
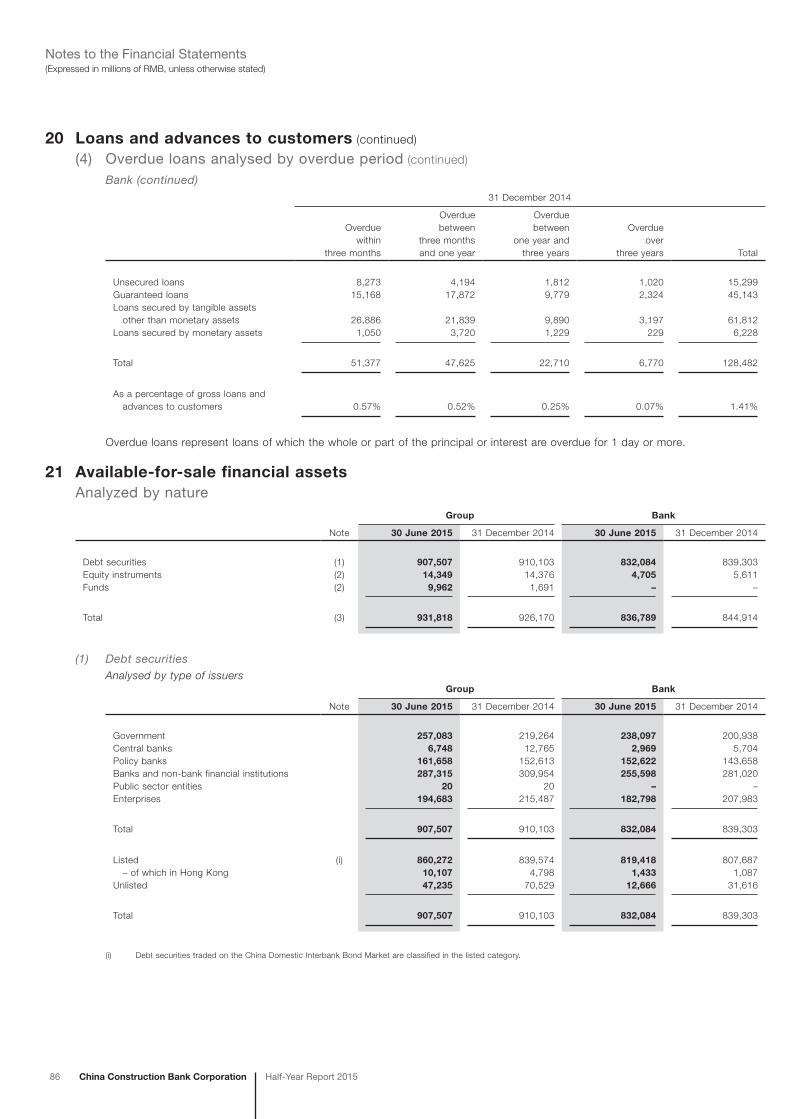
86 China Construction Bank Corporation Half-Year Report 2015
(Expressed in millions of RMB, unless otherwise stated)Notes to the Financial Statements
20 Loans and advances to customers (continued)
(4) Overdue loans analysed by overdue period (continued)
Bank (continued)31 December 2014
Overduewithin
three months
Overduebetween
three monthsand one year
Overduebetween
one year andthree years
Overdueover
three years Total
Unsecured loans 8,273 4,194 1,812 1,020 15,299Guaranteed loans 15,168 17,872 9,779 2,324 45,143Loans secured by tangible assets other than monetary assets 26,886 21,839 9,890 3,197 61,812Loans secured by monetary assets 1,050 3,720 1,229 229 6,228
Total 51,377 47,625 22,710 6,770 128,482
As a percentage of gross loans and advances to customers 0.57% 0.52% 0.25% 0.07% 1.41%
Overdue loans represent loans of which the whole or part of the principal or interest are overdue for 1 day or more.
21 Available-for-sale financial assetsAnalyzed by nature
Group Bank
Note 30 June 2015 31 December 2014 30 June 2015 31 December 2014
Debt securities (1) 907,507 910,103 832,084 839,303Equity instruments (2) 14,349 14,376 4,705 5,611Funds (2) 9,962 1,691 – –
Total (3) 931,818 926,170 836,789 844,914
(1) Debt securitiesAnalysed by type of issuers
Group Bank
Note 30 June 2015 31 December 2014 30 June 2015 31 December 2014
Government 257,083 219,264 238,097 200,938Central banks 6,748 12,765 2,969 5,704Policy banks 161,658 152,613 152,622 143,658Banks and non-bank financial institutions 287,315 309,954 255,598 281,020Public sector entities 20 20 – –Enterprises 194,683 215,487 182,798 207,983
Total 907,507 910,103 832,084 839,303
Listed (i) 860,272 839,574 819,418 807,687 – of which in Hong Kong 10,107 4,798 1,433 1,087Unlisted 47,235 70,529 12,666 31,616
Total 907,507 910,103 832,084 839,303
(i) Debt securities traded on the China Domestic Interbank Bond Market are classified in the listed category.

China Construction Bank CorporationHalf-Year Report 2015 87
(Expressed in millions of RMB, unless otherwise stated)Notes to the Financial Statements
21 Available-for-sale financial assets (continued)
Analyzed by nature (continued)
(2) Equity instruments and fundsGroup Bank
30 June 2015 31 December 2014 30 June 2015 31 December 2014
Debt equity swap (“DES”) investments 1,942 2,858 1,942 2,858Other equity instruments 12,407 11,518 2,763 2,753Funds 9,962 1,691 – –
Total 24,311 16,067 4,705 5,611
Listed 17,860 8,870 3,145 3,919 – of which in Hong Kong 2,635 2,134 833 842Unlisted 6,451 7,197 1,560 1,692
Total 24,311 16,067 4,705 5,611
Pursuant to the DES arrangement by the PRC government in 1999, the Group obtained equity interests of certain entities in lieu of repayments of loans granted to them. According to relevant requirements, the Group is prohibited from being involved in management of the operations of these entities. In substance, the Group does not have any control, joint control or significant influence over these entities.
(3) As at 30 June 2015, the Group’s and the Bank’s cost of available for sale debt securities was RMB901,361 million and RMB826,370 million respectively (as at 31 December 2014: RMB908,428 million and RMB837,868 million respectively). The Group’s and the Bank’s cost of available for sale equity instruments and funds was RMB24,831 million and RMB6,791 million respectively (as at 31 December 2014: RMB16,998 million and RMB7,182 million respectively).
22 Held-to-maturity investmentsAnalysed by types of issuers
Group Bank
Note 30 June 2015 31 December 2014 30 June 2015 31 December 2014
Government 1,057,348 957,788 1,056,436 957,134Central banks 154,196 175,387 154,196 175,387Policy banks 376,540 379,518 376,540 379,518Banks and non-bank financial institutions 719,333 625,052 718,733 624,453Enterprises 203,576 164,562 200,335 161,717
Gross balances 2,510,993 2,302,307 2,506,240 2,298,209
Allowances for impairment losses (Note 33) (3,812) (3,644) (3,585) (3,486)
Net balances 2,507,181 2,298,663 2,502,655 2,294,723
Listed (1) 2,497,751 2,289,217 2,494,745 2,286,730 – of which in Hong Kong 979 1,021 979 1,021Unlisted 9,430 9,446 7,910 7,993
Total 2,507,181 2,298,663 2,502,655 2,294,723
Market value of listed securities 2,539,042 2,314,122 2,536,036 2,311,611
(1) Debt securities traded on the China Domestic Interbank Bond Market are included in the Listed category.
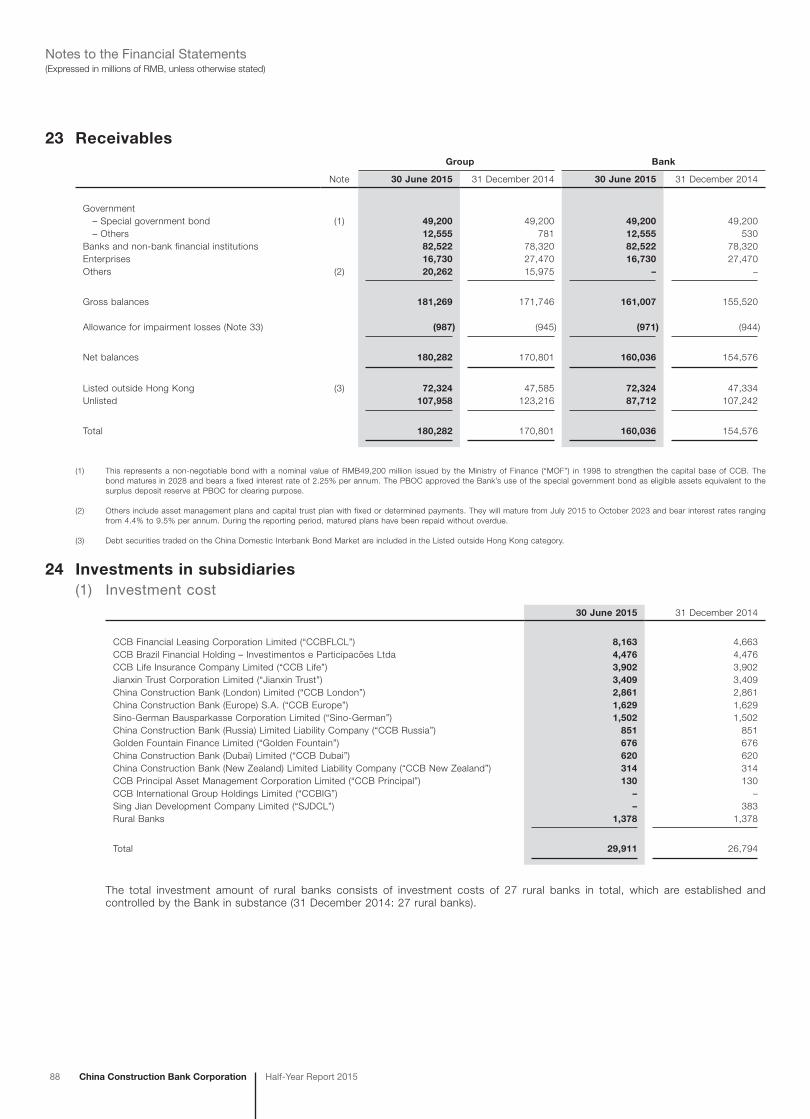
88 China Construction Bank Corporation Half-Year Report 2015
(Expressed in millions of RMB, unless otherwise stated)Notes to the Financial Statements
23 ReceivablesGroup Bank
Note 30 June 2015 31 December 2014 30 June 2015 31 December 2014
Government – Special government bond (1) 49,200 49,200 49,200 49,200 – Others 12,555 781 12,555 530Banks and non-bank financial institutions 82,522 78,320 82,522 78,320Enterprises 16,730 27,470 16,730 27,470Others (2) 20,262 15,975 – –
Gross balances 181,269 171,746 161,007 155,520
Allowance for impairment losses (Note 33) (987) (945) (971) (944)
Net balances 180,282 170,801 160,036 154,576
Listed outside Hong Kong (3) 72,324 47,585 72,324 47,334Unlisted 107,958 123,216 87,712 107,242
Total 180,282 170,801 160,036 154,576
(1) This represents a non-negotiable bond with a nominal value of RMB49,200 million issued by the Ministry of Finance (“MOF”) in 1998 to strengthen the capital base of CCB. The bond matures in 2028 and bears a fixed interest rate of 2.25% per annum. The PBOC approved the Bank’s use of the special government bond as eligible assets equivalent to the surplus deposit reserve at PBOC for clearing purpose.
(2) Others include asset management plans and capital trust plan with fixed or determined payments. They will mature from July 2015 to October 2023 and bear interest rates ranging from 4.4% to 9.5% per annum. During the reporting period, matured plans have been repaid without overdue.
(3) Debt securities traded on the China Domestic Interbank Bond Market are included in the Listed outside Hong Kong category.
24 Investments in subsidiaries(1) Investment cost
30 June 2015 31 December 2014
CCB Financial Leasing Corporation Limited (“CCBFLCL”) 8,163 4,663CCB Brazil Financial Holding – Investimentos e Participacões Ltda 4,476 4,476CCB Life Insurance Company Limited (“CCB Life”) 3,902 3,902Jianxin Trust Corporation Limited (“Jianxin Trust”) 3,409 3,409China Construction Bank (London) Limited (“CCB London”) 2,861 2,861China Construction Bank (Europe) S.A. (“CCB Europe”) 1,629 1,629Sino-German Bausparkasse Corporation Limited (“Sino-German”) 1,502 1,502China Construction Bank (Russia) Limited Liability Company (“CCB Russia”) 851 851Golden Fountain Finance Limited (“Golden Fountain”) 676 676China Construction Bank (Dubai) Limited (“CCB Dubai”) 620 620China Construction Bank (New Zealand) Limited Liability Company (“CCB New Zealand”) 314 314CCB Principal Asset Management Corporation Limited (“CCB Principal”) 130 130CCB International Group Holdings Limited (“CCBIG”) – –Sing Jian Development Company Limited (“SJDCL”) – 383Rural Banks 1,378 1,378
Total 29,911 26,794
The total investment amount of rural banks consists of investment costs of 27 rural banks in total, which are established and controlled by the Bank in substance (31 December 2014: 27 rural banks).
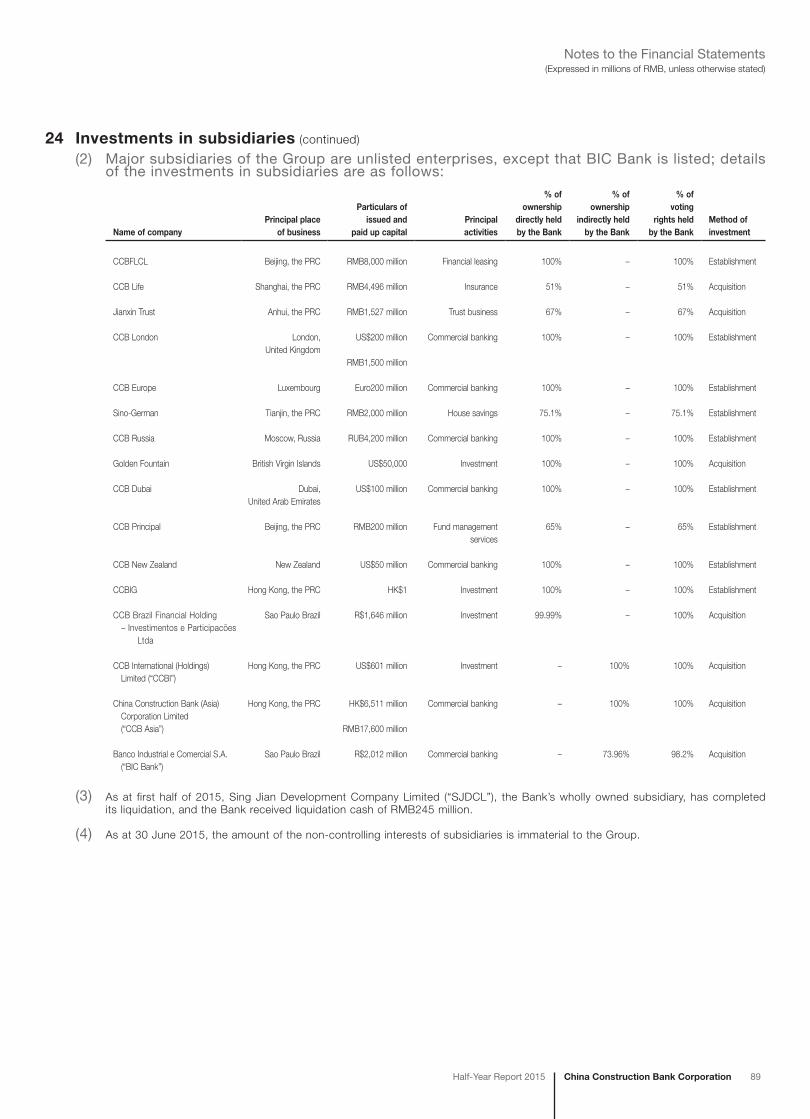
China Construction Bank CorporationHalf-Year Report 2015 89
(Expressed in millions of RMB, unless otherwise stated)Notes to the Financial Statements
24 Investments in subsidiaries (continued)
(2) Major subsidiaries of the Group are unlisted enterprises, except that BIC Bank is listed; details of the investments in subsidiaries are as follows:
Name of companyPrincipal place
of business
Particulars ofissued and
paid up capitalPrincipalactivities
% ofownership
directly heldby the Bank
% ofownership
indirectly heldby the Bank
% ofvoting
rights heldby the Bank
Method ofinvestment
CCBFLCL Beijing, the PRC RMB8,000 million Financial leasing 100% – 100% Establishment
CCB Life Shanghai, the PRC RMB4,496 million Insurance 51% – 51% Acquisition
Jianxin Trust Anhui, the PRC RMB1,527 million Trust business 67% – 67% Acquisition
CCB London London, United Kingdom
US$200 million
RMB1,500 million
Commercial banking 100% – 100% Establishment
CCB Europe Luxembourg Euro200 million Commercial banking 100% – 100% Establishment
Sino-German Tianjin, the PRC RMB2,000 million House savings 75.1% – 75.1% Establishment
CCB Russia Moscow, Russia RUB4,200 million Commercial banking 100% – 100% Establishment
Golden Fountain British Virgin Islands US$50,000 Investment 100% – 100% Acquisition
CCB Dubai Dubai, United Arab Emirates
US$100 million Commercial banking 100% – 100% Establishment
CCB Principal Beijing, the PRC RMB200 million Fund management services
65% – 65% Establishment
CCB New Zealand New Zealand US$50 million Commercial banking 100% – 100% Establishment
CCBIG Hong Kong, the PRC HK$1 Investment 100% – 100% Establishment
CCB Brazil Financial Holding – Investimentos e Participacões Ltda
Sao Paulo Brazil R$1,646 million Investment 99.99% – 100% Acquisition
CCB International (Holdings) Limited (“CCBI”)
Hong Kong, the PRC US$601 million Investment – 100% 100% Acquisition
China Construction Bank (Asia) Corporation Limited (“CCB Asia”)
Hong Kong, the PRC HK$6,511 million
RMB17,600 million
Commercial banking – 100% 100% Acquisition
Banco Industrial e Comercial S.A. (“BIC Bank”)
Sao Paulo Brazil R$2,012 million Commercial banking – 73.96% 98.2% Acquisition
(3) As at first half of 2015, Sing Jian Development Company Limited (“SJDCL”), the Bank’s wholly owned subsidiary, has completed its liquidation, and the Bank received liquidation cash of RMB245 million.
(4) As at 30 June 2015, the amount of the non-controlling interests of subsidiaries is immaterial to the Group.
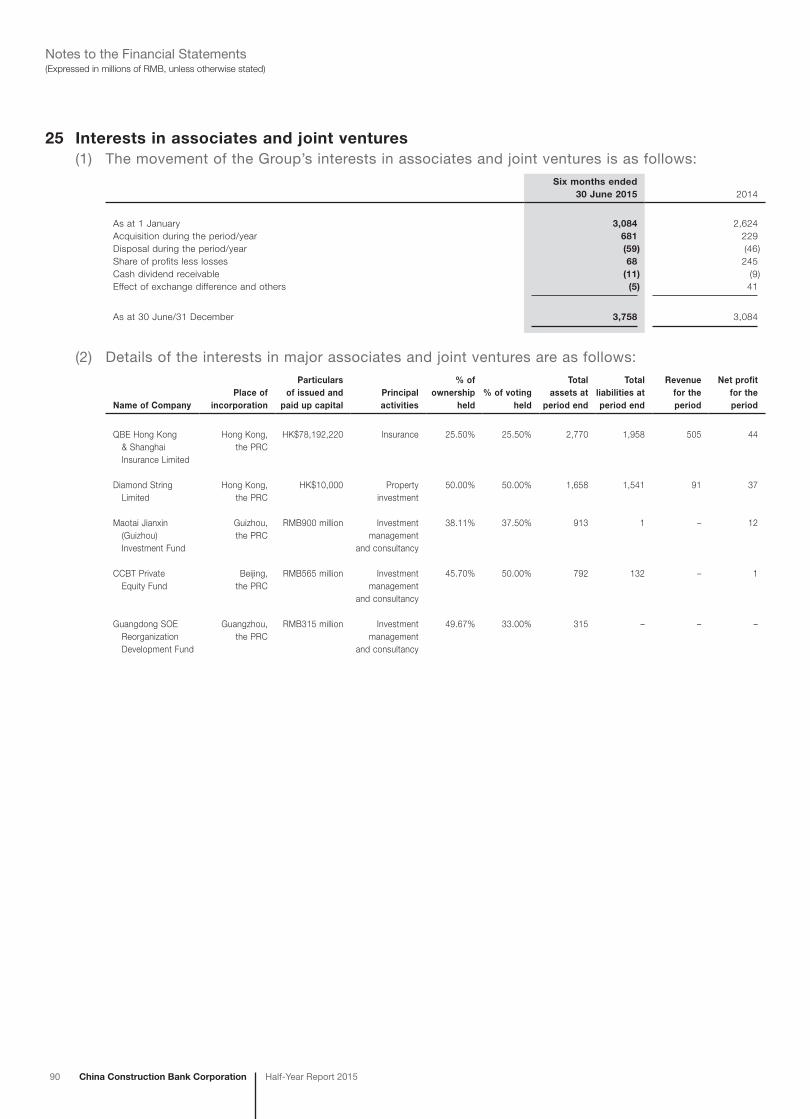
90 China Construction Bank Corporation Half-Year Report 2015
(Expressed in millions of RMB, unless otherwise stated)Notes to the Financial Statements
25 Interests in associates and joint ventures(1) The movement of the Group’s interests in associates and joint ventures is as follows:
Six months ended30 June 2015 2014
As at 1 January 3,084 2,624Acquisition during the period/year 681 229Disposal during the period/year (59) (46)Share of profits less losses 68 245Cash dividend receivable (11) (9)Effect of exchange difference and others (5) 41
As at 30 June/31 December 3,758 3,084
(2) Details of the interests in major associates and joint ventures are as follows:
Name of CompanyPlace of
incorporation
Particularsof issued and
paid up capitalPrincipalactivities
% of ownership
held% of voting
held
Total assets at
period end
Total liabilities at period end
Revenue for the period
Net profit for the period
QBE Hong Kong & Shanghai Insurance Limited
Hong Kong, the PRC
HK$78,192,220 Insurance 25.50% 25.50% 2,770 1,958 505 44
Diamond String Limited
Hong Kong, the PRC
HK$10,000 Property investment
50.00% 50.00% 1,658 1,541 91 37
Maotai Jianxin (Guizhou) Investment Fund
Guizhou, the PRC
RMB900 million Investment management
and consultancy
38.11% 37.50% 913 1 – 12
CCBT Private Equity Fund
Beijing, the PRC
RMB565 million Investment management
and consultancy
45.70% 50.00% 792 132 – 1
Guangdong SOE Reorganization Development Fund
Guangzhou, the PRC
RMB315 million Investment management
and consultancy
49.67% 33.00% 315 – – –
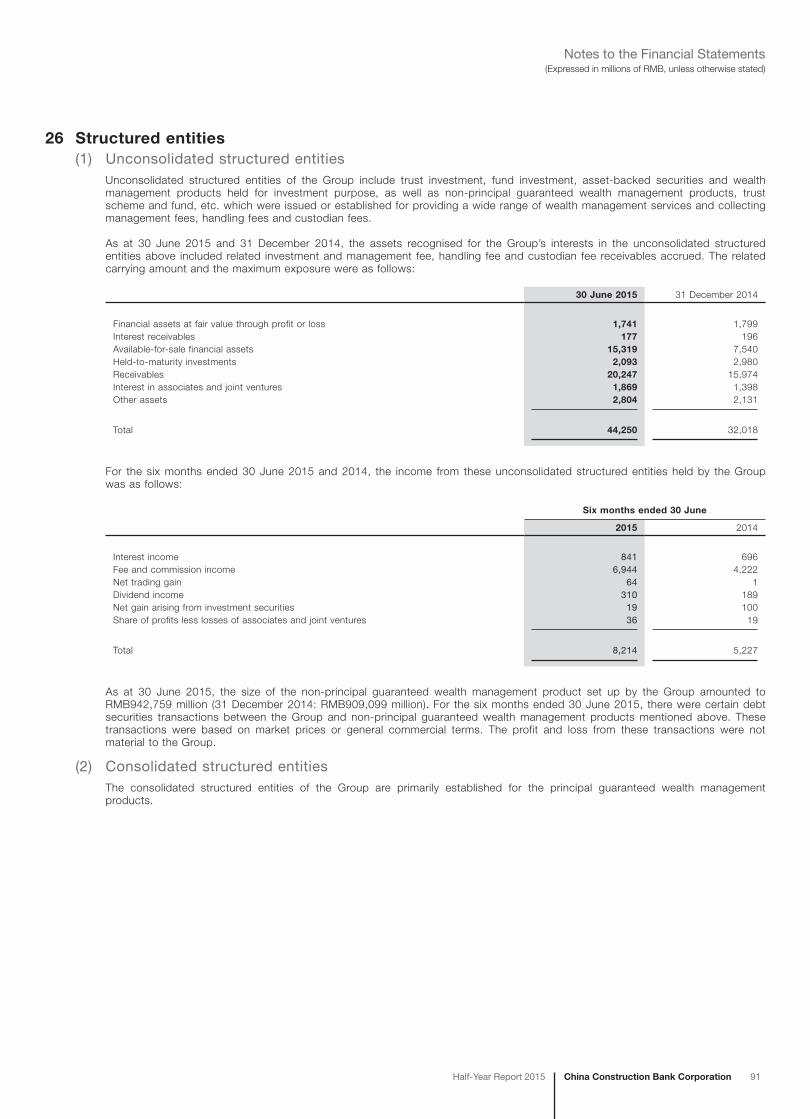
China Construction Bank CorporationHalf-Year Report 2015 91
(Expressed in millions of RMB, unless otherwise stated)Notes to the Financial Statements
26 Structured entities(1) Unconsolidated structured entities
Unconsolidated structured entities of the Group include trust investment, fund investment, asset-backed securities and wealth management products held for investment purpose, as well as non-principal guaranteed wealth management products, trust scheme and fund, etc. which were issued or established for providing a wide range of wealth management services and collecting management fees, handling fees and custodian fees.
As at 30 June 2015 and 31 December 2014, the assets recognised for the Group’s interests in the unconsolidated structured entities above included related investment and management fee, handling fee and custodian fee receivables accrued. The related carrying amount and the maximum exposure were as follows:
30 June 2015 31 December 2014
Financial assets at fair value through profit or loss 1,741 1,799Interest receivables 177 196Available-for-sale financial assets 15,319 7,540Held-to-maturity investments 2,093 2,980Receivables 20,247 15,974Interest in associates and joint ventures 1,869 1,398Other assets 2,804 2,131
Total 44,250 32,018
For the six months ended 30 June 2015 and 2014, the income from these unconsolidated structured entities held by the Group was as follows:
Six months ended 30 June
2015 2014
Interest income 841 696Fee and commission income 6,944 4,222Net trading gain 64 1Dividend income 310 189Net gain arising from investment securities 19 100Share of profits less losses of associates and joint ventures 36 19
Total 8,214 5,227
As at 30 June 2015, the size of the non-principal guaranteed wealth management product set up by the Group amounted to RMB942,759 million (31 December 2014: RMB909,099 million). For the six months ended 30 June 2015, there were certain debt securities transactions between the Group and non-principal guaranteed wealth management products mentioned above. These transactions were based on market prices or general commercial terms. The profit and loss from these transactions were not material to the Group.
(2) Consolidated structured entitiesThe consolidated structured entities of the Group are primarily established for the principal guaranteed wealth management products.

92 China Construction Bank Corporation Half-Year Report 2015
(Expressed in millions of RMB, unless otherwise stated)Notes to the Financial Statements
27 Fixed assetsGroup
Bank premisesConstruction
in progress Equipment Others Total
Cost/Deemed costAs at 1 January 2015 105,224 28,378 46,807 42,350 222,759Additions 711 1,904 1,025 2,848 6,488Transfer in/(out) 2,805 (3,593) 15 773 –Disposals (123) (382) (821) (980) (2,306)
As at 30 June 2015 108,617 26,307 47,026 44,991 226,941
Accumulated depreciationAs at 1 January 2015 (22,651) – (27,254) (20,743) (70,648)Charge for the period (1,878) – (3,615) (2,916) (8,409)Disposals 43 – 783 773 1,599
As at 30 June 2015 (24,486) – (30,086) (22,886) (77,458)
Allowances for impairment losses (Note 33)As at 1 January 2015 (424) – – (80) (504)
As at 30 June 2015 (424) – – (80) (504)
Net carrying valueAs at 1 January 2015 82,149 28,378 19,553 21,527 151,607
As at 30 June 2015 83,707 26,307 16,940 22,025 148,979
Bank premisesConstruction
in progress Equipment Others Total
Cost/Deemed costAs at 1 January 2014 89,877 28,425 42,444 36,857 197,603Additions through acquisitions 424 – 36 90 550Additions 4,458 14,477 8,689 4,770 32,394Transfer in/(out) 10,607 (13,348) 65 2,676 –Disposals (142) (1,176) (4,427) (2,043) (7,788)
As at 31 December 2014 105,224 28,378 46,807 42,350 222,759
Accumulated depreciationAs at 1 January 2014 (19,188) – (25,058) (17,191) (61,437)Additions through acquisitions (133) – (32) (37) (202)Charge for the year (3,423) – (6,427) (5,506) (15,356)Disposals 93 – 4,263 1,991 6,347
As at 31 December 2014 (22,651) – (27,254) (20,743) (70,648)
Allowances for impairment losses (Note 33)As at 1 January 2014 (425) – (1) (62) (488)Additions through acquisitions – – (2) (6) (8)Charge for the year – – – (17) (17)Disposals 1 – 3 5 9
As at 31 December 2014 (424) – – (80) (504)
Net carrying valueAs at 1 January 2014 70,264 28,425 17,385 19,604 135,678
As at 31 December 2014 82,149 28,378 19,553 21,527 151,607
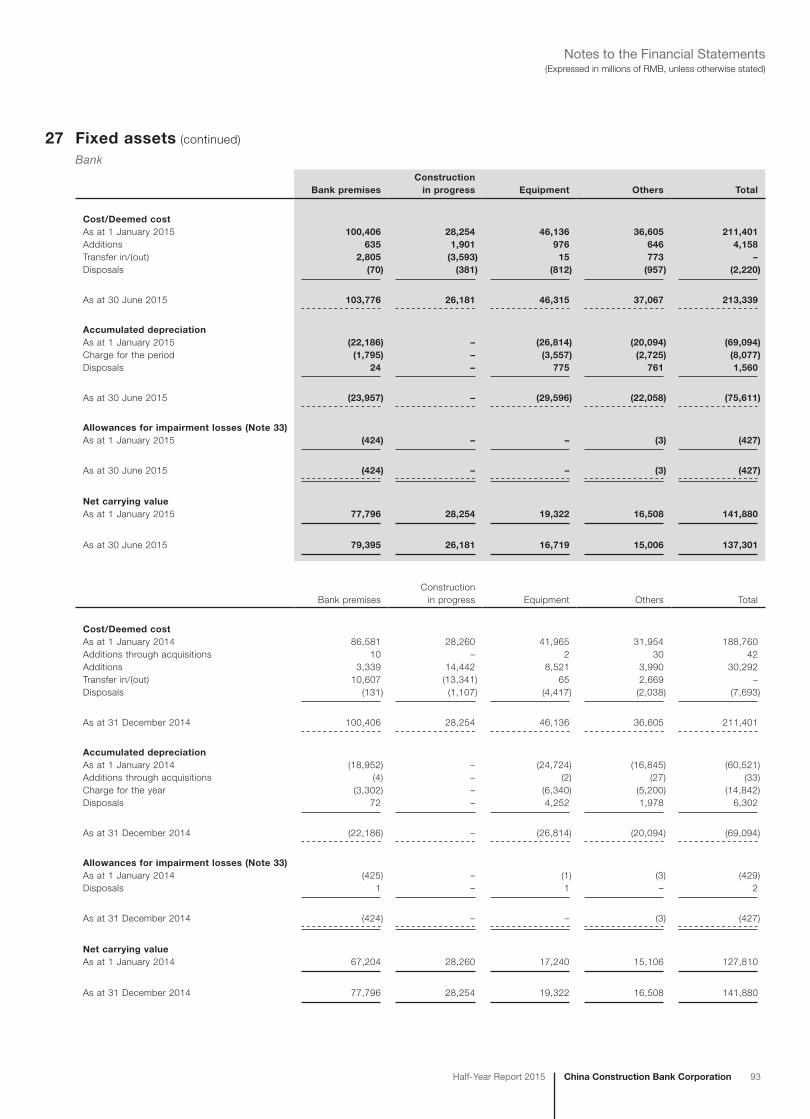
China Construction Bank CorporationHalf-Year Report 2015 93
(Expressed in millions of RMB, unless otherwise stated)Notes to the Financial Statements
27 Fixed assets (continued)
Bank
Bank premisesConstruction
in progress Equipment Others Total
Cost/Deemed costAs at 1 January 2015 100,406 28,254 46,136 36,605 211,401Additions 635 1,901 976 646 4,158Transfer in/(out) 2,805 (3,593) 15 773 –Disposals (70) (381) (812) (957) (2,220)
As at 30 June 2015 103,776 26,181 46,315 37,067 213,339
Accumulated depreciationAs at 1 January 2015 (22,186) – (26,814) (20,094) (69,094)Charge for the period (1,795) – (3,557) (2,725) (8,077)Disposals 24 – 775 761 1,560
As at 30 June 2015 (23,957) – (29,596) (22,058) (75,611)
Allowances for impairment losses (Note 33)As at 1 January 2015 (424) – – (3) (427)
As at 30 June 2015 (424) – – (3) (427)
Net carrying valueAs at 1 January 2015 77,796 28,254 19,322 16,508 141,880
As at 30 June 2015 79,395 26,181 16,719 15,006 137,301
Bank premisesConstruction
in progress Equipment Others Total
Cost/Deemed costAs at 1 January 2014 86,581 28,260 41,965 31,954 188,760Additions through acquisitions 10 – 2 30 42Additions 3,339 14,442 8,521 3,990 30,292Transfer in/(out) 10,607 (13,341) 65 2,669 –Disposals (131) (1,107) (4,417) (2,038) (7,693)
As at 31 December 2014 100,406 28,254 46,136 36,605 211,401
Accumulated depreciationAs at 1 January 2014 (18,952) – (24,724) (16,845) (60,521)Additions through acquisitions (4) – (2) (27) (33)Charge for the year (3,302) – (6,340) (5,200) (14,842)Disposals 72 – 4,252 1,978 6,302
As at 31 December 2014 (22,186) – (26,814) (20,094) (69,094)
Allowances for impairment losses (Note 33)As at 1 January 2014 (425) – (1) (3) (429)Disposals 1 – 1 – 2
As at 31 December 2014 (424) – – (3) (427)
Net carrying valueAs at 1 January 2014 67,204 28,260 17,240 15,106 127,810
As at 31 December 2014 77,796 28,254 19,322 16,508 141,880

94 China Construction Bank Corporation Half-Year Report 2015
(Expressed in millions of RMB, unless otherwise stated)Notes to the Financial Statements
27 Fixed assets (continued)Notes:
(1) As at 30 June 2015, the ownership documentation for the Group’s and the Bank’s bank premises with a net carrying value of RMB22,183 million (31 December 2014: RMB21,092 million) was still being finalised. However, management is of the view that the aforesaid matter would not affect the rights of the Group and the Bank to these assets nor have any significant impact on the business operation of the Group and the Bank.
(2) Analysed by remaining terms of the leases
The net carrying values of bank premises of the Group and the Bank as at the end of the reporting period are analysed by the remaining terms of the leases as follows:
Group Bank
30 June 2015 31 December 2014 30 June 2015 31 December 2014
Long term leases (over 50 years) held overseas 1,646 1,596 6 6Medium term leases (10-50 years) held overseas 2,185 2,246 295 314Short term leases (less than 10 years) held overseas 156 203 24 33Long term leases (over 50 years) held in Mainland China 6,109 4,945 6,108 4,944Medium term leases (10-50 years) held in Mainland China 71,951 70,333 71,302 69,673Short term leases (less than 10 years) held in Mainland China 1,660 2,826 1,660 2,826
Total 83,707 82,149 79,395 77,796
28 Land use rightsGroup
Six months ended30 June 2015 2014
Cost/Deemed costAs at 1 January 21,255 20,752Additions – 652Disposals (19) (149)
As at 30 June/31 December 21,236 21,255
AmortisationAs at 1 January (5,355) (4,879)Charge for the period/year (253) (512)Disposals 4 36
As at 30 June/31 December (5,604) (5,355)
Allowances for impairment losses (Note 33)As at 1 January (142) (142)
As at 30 June/31 December (142) (142)
Net carrying valueAs at 1 January 15,758 15,731
As at 30 June/31 December 15,490 15,758
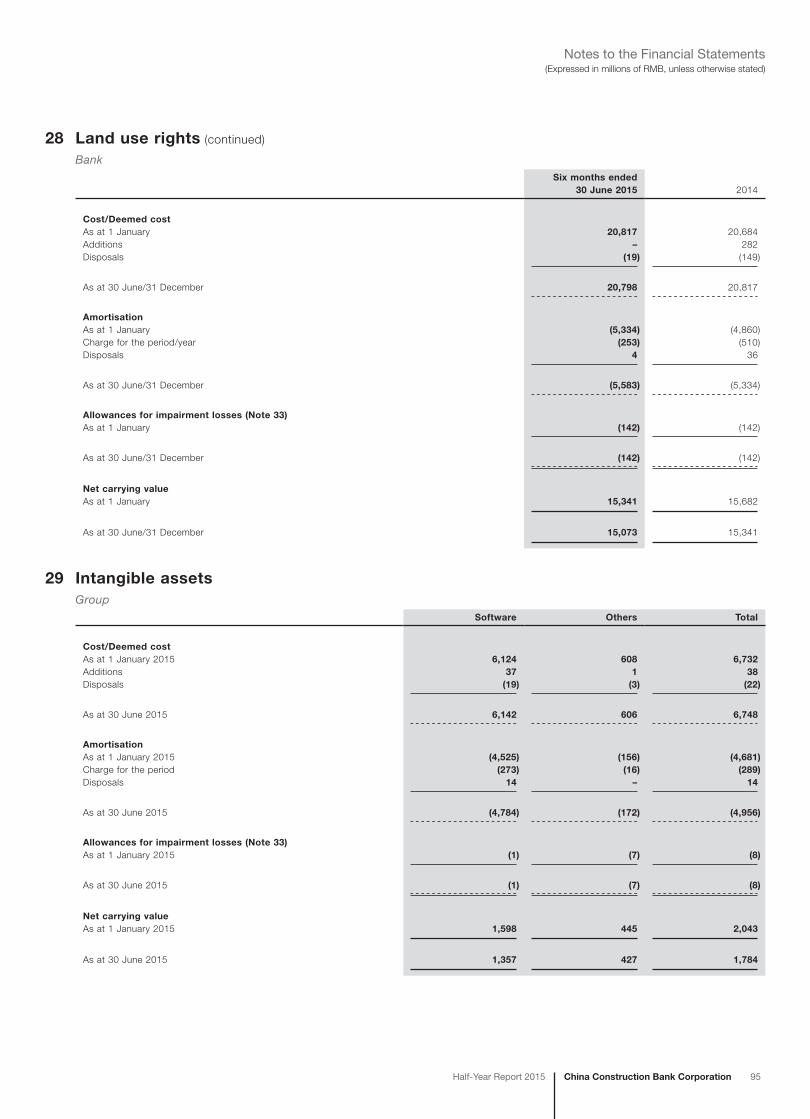
China Construction Bank CorporationHalf-Year Report 2015 95
(Expressed in millions of RMB, unless otherwise stated)Notes to the Financial Statements
28 Land use rights (continued)
BankSix months ended
30 June 2015 2014
Cost/Deemed costAs at 1 January 20,817 20,684Additions – 282Disposals (19) (149)
As at 30 June/31 December 20,798 20,817
AmortisationAs at 1 January (5,334) (4,860)Charge for the period/year (253) (510)Disposals 4 36
As at 30 June/31 December (5,583) (5,334)
Allowances for impairment losses (Note 33)As at 1 January (142) (142)
As at 30 June/31 December (142) (142)
Net carrying valueAs at 1 January 15,341 15,682
As at 30 June/31 December 15,073 15,341
29 Intangible assetsGroup
Software Others Total
Cost/Deemed costAs at 1 January 2015 6,124 608 6,732Additions 37 1 38Disposals (19) (3) (22)
As at 30 June 2015 6,142 606 6,748
AmortisationAs at 1 January 2015 (4,525) (156) (4,681)Charge for the period (273) (16) (289)Disposals 14 – 14
As at 30 June 2015 (4,784) (172) (4,956)
Allowances for impairment losses (Note 33)As at 1 January 2015 (1) (7) (8)
As at 30 June 2015 (1) (7) (8)
Net carrying valueAs at 1 January 2015 1,598 445 2,043
As at 30 June 2015 1,357 427 1,784
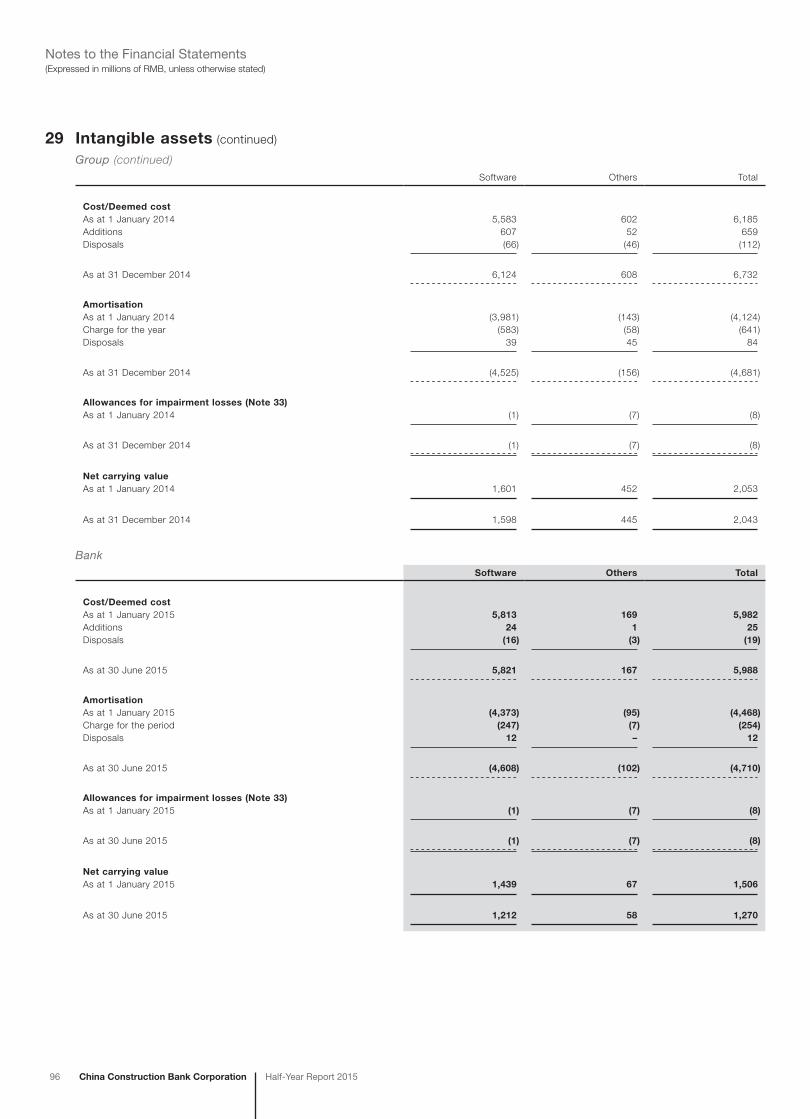
96 China Construction Bank Corporation Half-Year Report 2015
(Expressed in millions of RMB, unless otherwise stated)Notes to the Financial Statements
29 Intangible assets (continued)
Group (continued)Software Others Total
Cost/Deemed costAs at 1 January 2014 5,583 602 6,185Additions 607 52 659Disposals (66) (46) (112)
As at 31 December 2014 6,124 608 6,732
AmortisationAs at 1 January 2014 (3,981) (143) (4,124)Charge for the year (583) (58) (641)Disposals 39 45 84
As at 31 December 2014 (4,525) (156) (4,681)
Allowances for impairment losses (Note 33)As at 1 January 2014 (1) (7) (8)
As at 31 December 2014 (1) (7) (8)
Net carrying valueAs at 1 January 2014 1,601 452 2,053
As at 31 December 2014 1,598 445 2,043
BankSoftware Others Total
Cost/Deemed costAs at 1 January 2015 5,813 169 5,982Additions 24 1 25Disposals (16) (3) (19)
As at 30 June 2015 5,821 167 5,988
AmortisationAs at 1 January 2015 (4,373) (95) (4,468)Charge for the period (247) (7) (254)Disposals 12 – 12
As at 30 June 2015 (4,608) (102) (4,710)
Allowances for impairment losses (Note 33)As at 1 January 2015 (1) (7) (8)
As at 30 June 2015 (1) (7) (8)
Net carrying valueAs at 1 January 2015 1,439 67 1,506
As at 30 June 2015 1,212 58 1,270
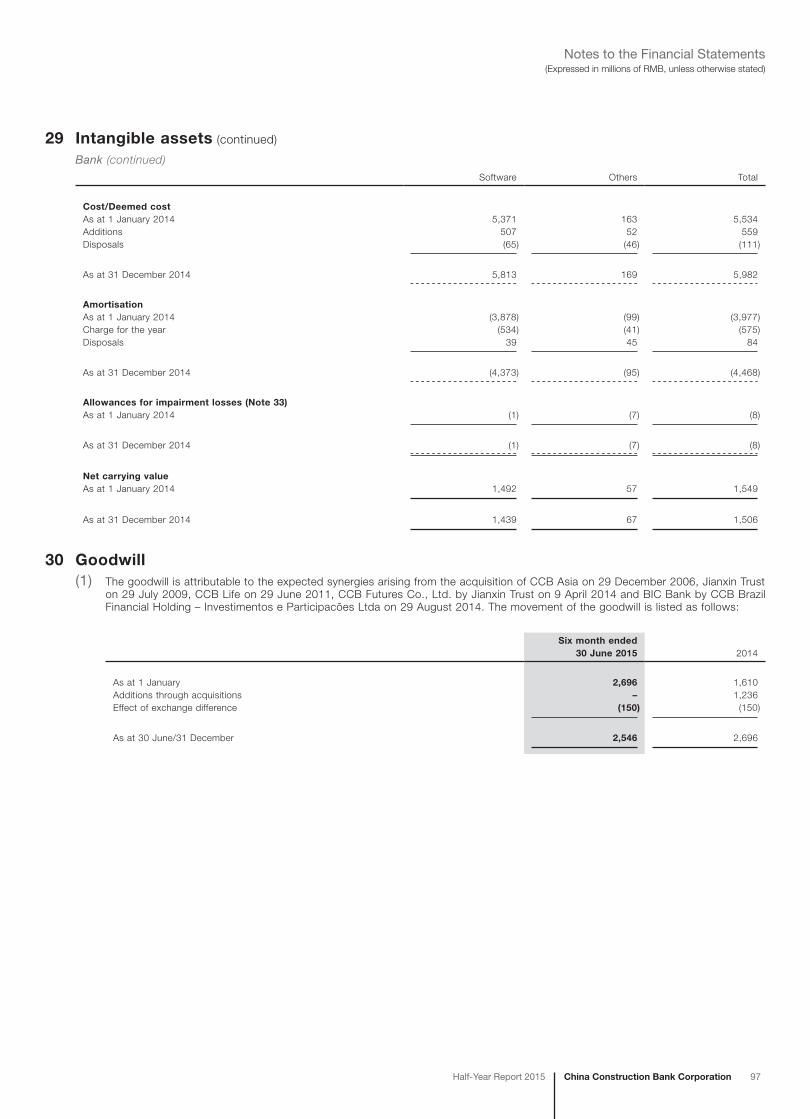
China Construction Bank CorporationHalf-Year Report 2015 97
(Expressed in millions of RMB, unless otherwise stated)Notes to the Financial Statements
29 Intangible assets (continued)
Bank (continued)Software Others Total
Cost/Deemed costAs at 1 January 2014 5,371 163 5,534Additions 507 52 559Disposals (65) (46) (111)
As at 31 December 2014 5,813 169 5,982
AmortisationAs at 1 January 2014 (3,878) (99) (3,977)Charge for the year (534) (41) (575)Disposals 39 45 84
As at 31 December 2014 (4,373) (95) (4,468)
Allowances for impairment losses (Note 33)As at 1 January 2014 (1) (7) (8)
As at 31 December 2014 (1) (7) (8)
Net carrying valueAs at 1 January 2014 1,492 57 1,549
As at 31 December 2014 1,439 67 1,506
30 Goodwill(1) The goodwill is attributable to the expected synergies arising from the acquisition of CCB Asia on 29 December 2006, Jianxin Trust
on 29 July 2009, CCB Life on 29 June 2011, CCB Futures Co., Ltd. by Jianxin Trust on 9 April 2014 and BIC Bank by CCB Brazil Financial Holding – Investimentos e Participacões Ltda on 29 August 2014. The movement of the goodwill is listed as follows:
Six month ended30 June 2015 2014
As at 1 January 2,696 1,610Additions through acquisitions – 1,236Effect of exchange difference (150) (150)
As at 30 June/31 December 2,546 2,696

98 China Construction Bank Corporation Half-Year Report 2015
(Expressed in millions of RMB, unless otherwise stated)Notes to the Financial Statements
30 Goodwill (continued)
(2) Acquisition of the BIC BankOn 29 August 2014, the Bank acquired BIC Bank via CCB Brazil Financial Holding – Investimentos e Participacões Ltda. At the acquisition date, the recognised values of identifiable net assets attributable to shareholders of the Bank, goodwill on acquisition and consideration transferred were as follows:
Acquisition dateRecognised values
Identifiable net assets attributable to shareholders of the Bank 2,938Goodwill on acquisition 1,226
Consideration transferred 4,164
The goodwill on acquisition is attributable to the significant synergies expected to arise.
According to the terms of the purchase price adjustment in the sale and purchase agreement, the purchase price can be adjusted after acquisition date based on the factors such as changes in net assets of BIC Bank from reference date to acquisition date. As of the date of this report, the negotiation between the former shareholders and the Bank is still in progress and any adjustment to the consideration has not been determined.
The fair value of the identifiable net assets on the acquisition date is provisional and the final valuations have not been determined.
As of 30 June 2015, the Bank has acquired 73.96% interests in BIC Bank. According to the Brazilian local applicable laws and related regulations, the Bank commits to implement a mandatory tender offer due to the acquisition of the relevant change of control right. In accordance with the relevant rules of the Brazilian Corporation Act and the bylaws of BIC Bank, the Bank will ensure that the non-controlling shareholders accepting the tender offer will have an option to enjoy the same treatment as will be available to the controlling shareholders.
(3) Impairment test for CGU containing goodwillThe Group calculated the recoverable amount of the CGU using cash flow projections based on financial forecasts approved by management. The average growth rate used by the Group is consistent with the forecasts included in industry reports. The discount rate used reflects specific risks relating to the relevant segments.
Based on the result of the impairment test, no impairment losses on goodwill were recognised as at 30 June 2015 (31 December 2014: nil).
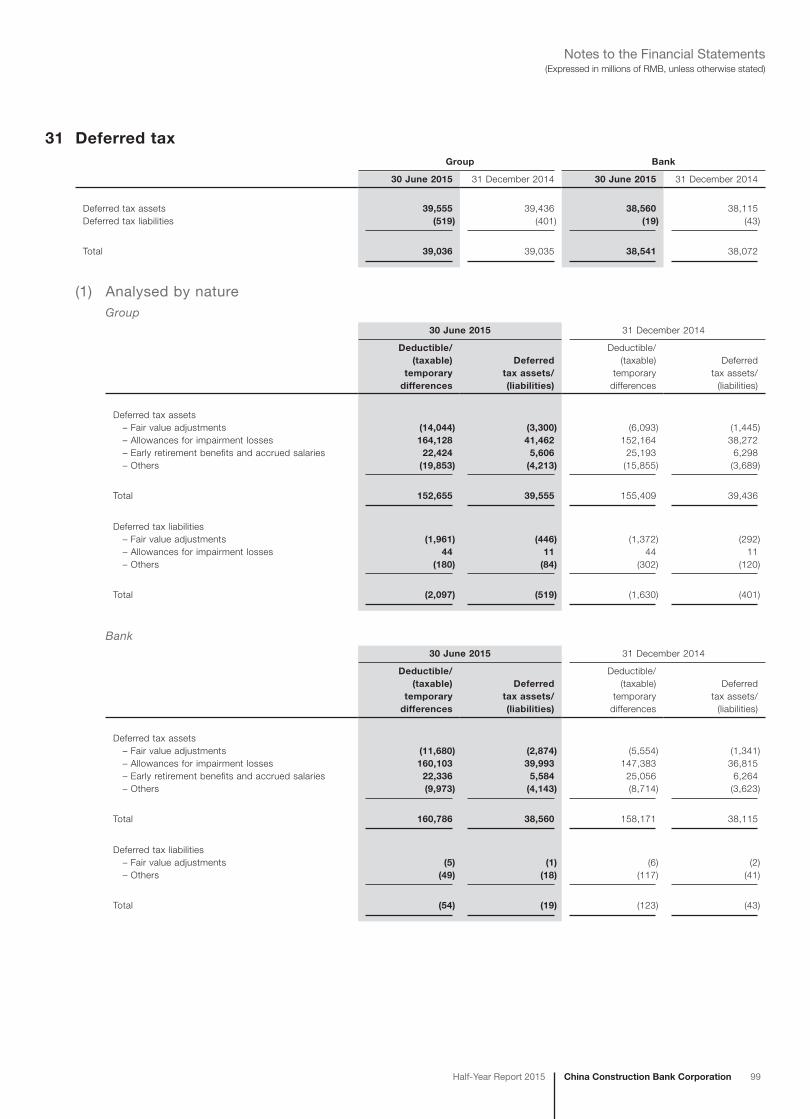
China Construction Bank CorporationHalf-Year Report 2015 99
(Expressed in millions of RMB, unless otherwise stated)Notes to the Financial Statements
31 Deferred taxGroup Bank
30 June 2015 31 December 2014 30 June 2015 31 December 2014
Deferred tax assets 39,555 39,436 38,560 38,115Deferred tax liabilities (519) (401) (19) (43)
Total 39,036 39,035 38,541 38,072
(1) Analysed by natureGroup
30 June 2015 31 December 2014
Deductible/(taxable)
temporarydifferences
Deferredtax assets/(liabilities)
Deductible/(taxable)
temporarydifferences
Deferredtax assets/
(liabilities)
Deferred tax assets – Fair value adjustments (14,044) (3,300) (6,093) (1,445) – Allowances for impairment losses 164,128 41,462 152,164 38,272 – Early retirement benefits and accrued salaries 22,424 5,606 25,193 6,298 – Others (19,853) (4,213) (15,855) (3,689)
Total 152,655 39,555 155,409 39,436
Deferred tax liabilities – Fair value adjustments (1,961) (446) (1,372) (292) – Allowances for impairment losses 44 11 44 11 – Others (180) (84) (302) (120)
Total (2,097) (519) (1,630) (401)
Bank30 June 2015 31 December 2014
Deductible/(taxable)
temporarydifferences
Deferredtax assets/(liabilities)
Deductible/(taxable)
temporarydifferences
Deferredtax assets/
(liabilities)
Deferred tax assets – Fair value adjustments (11,680) (2,874) (5,554) (1,341) – Allowances for impairment losses 160,103 39,993 147,383 36,815 – Early retirement benefits and accrued salaries 22,336 5,584 25,056 6,264 – Others (9,973) (4,143) (8,714) (3,623)
Total 160,786 38,560 158,171 38,115
Deferred tax liabilities – Fair value adjustments (5) (1) (6) (2) – Others (49) (18) (117) (41)
Total (54) (19) (123) (43)
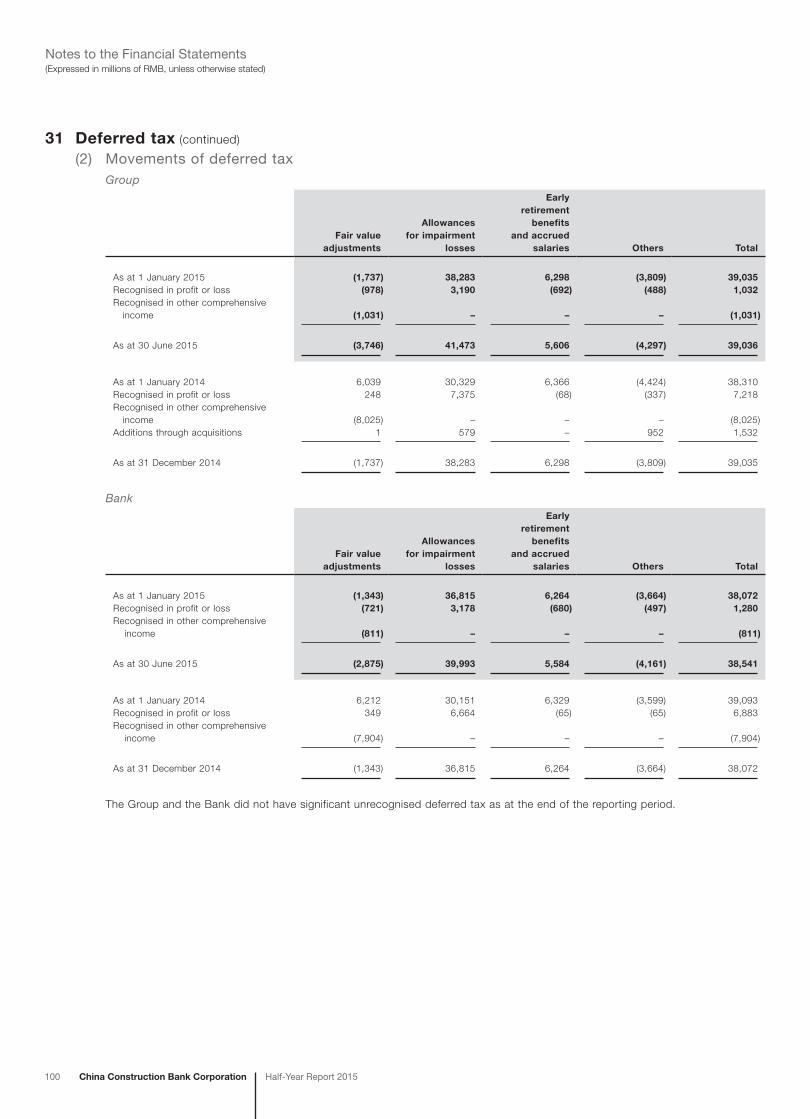
100 China Construction Bank Corporation Half-Year Report 2015
(Expressed in millions of RMB, unless otherwise stated)Notes to the Financial Statements
31 Deferred tax (continued)
(2) Movements of deferred taxGroup
Fair valueadjustments
Allowancesfor impairment
losses
Earlyretirement
benefitsand accrued
salaries Others Total
As at 1 January 2015 (1,737) 38,283 6,298 (3,809) 39,035Recognised in profit or loss (978) 3,190 (692) (488) 1,032Recognised in other comprehensive income (1,031) – – – (1,031)
As at 30 June 2015 (3,746) 41,473 5,606 (4,297) 39,036
As at 1 January 2014 6,039 30,329 6,366 (4,424) 38,310Recognised in profit or loss 248 7,375 (68) (337) 7,218Recognised in other comprehensive income (8,025) – – – (8,025)Additions through acquisitions 1 579 – 952 1,532
As at 31 December 2014 (1,737) 38,283 6,298 (3,809) 39,035
Bank
Fair valueadjustments
Allowancesfor impairment
losses
Earlyretirement
benefitsand accrued
salaries Others Total
As at 1 January 2015 (1,343) 36,815 6,264 (3,664) 38,072Recognised in profit or loss (721) 3,178 (680) (497) 1,280Re cognised in other comprehensive
income (811) – – – (811)
As at 30 June 2015 (2,875) 39,993 5,584 (4,161) 38,541
As at 1 January 2014 6,212 30,151 6,329 (3,599) 39,093Recognised in profit or loss 349 6,664 (65) (65) 6,883Re cognised in other comprehensive
income (7,904) – – – (7,904)
As at 31 December 2014 (1,343) 36,815 6,264 (3,664) 38,072
The Group and the Bank did not have significant unrecognised deferred tax as at the end of the reporting period.

China Construction Bank CorporationHalf-Year Report 2015 101
(Expressed in millions of RMB, unless otherwise stated)Notes to the Financial Statements
32 Other assetsGroup Bank
Note 30 June 2015 31 December 2014 30 June 2015 31 December 2014
Repossessed assets (1) – Buildings 1,812 1,748 1,812 1,748 – Land use rights 317 313 317 313 – Others 1,473 1,497 814 745
3,602 3,558 2,943 2,806
Clearing and settlement accounts 7,364 480 8,535 480Fee and commission receivables 6,082 4,054 5,576 3,636Insurance business related assets 4,921 369 – –Deferred expenses 3,397 3,156 3,106 3,000Leasehold improvements 2,975 3,138 2,946 3,102Receivables from CCBIG (2) – – 36,176 36,187Other receivables 28,460 14,952 24,755 10,586
Gross balance 56,801 29,707 84,037 59,797
Allowances for impairment losses (Note 33) – Repossessed assets (694) (660) (544) (480) – Others (3,071) (3,033) (2,794) (2,748)
Total 53,036 26,014 80,699 56,569
(1) During the six months ended 30 June 2015, the original cost of repossessed assets disposed of by the Group amounted to RMB220 million (for the six months ended 30 June 2014: RMB132 million). The Group intends to dispose of repossessed assets through various methods including auction, competitive bidding and disposal.
(2) Receivables from CCBIG represent lending to CCBIG, a wholly owned subsidiary, for acquisition of equity investments and capital injection to other subsidiaries. The receivables are unsecured, non-interest bearing and without fixed repayment term.
33 Movements of allowances for impairment lossesGroup
Six months ended 30 June 2015
Note As at 1 JanuaryCharge/
(Write-back)Transferin/(out) Write-offs As at 30 June
Deposits with banks and non-bank financial institutions 14 7 – – – 7Placements with banks and non-bank financial institutions 15 27 2 – – 29Interest receivable 19 1 – – – 1Loans and advances to customers 20(3) 251,613 40,441 (15,515) (9,056) 267,483Available for sale debt securities 1,409 (320) 5 – 1,094Available for sale equity instruments 4,413 – – (33) 4,380Held-to-maturity investments 22 3,644 172 – (4) 3,812Receivables 23 945 7 35 – 987Fixed assets 27 504 – – – 504Land use rights 28 142 – – – 142Intangible assets 29 8 – – – 8Other assets 32 3,693 158 – (86) 3,765
Total 266,406 40,460 (15,475) (9,179) 282,212
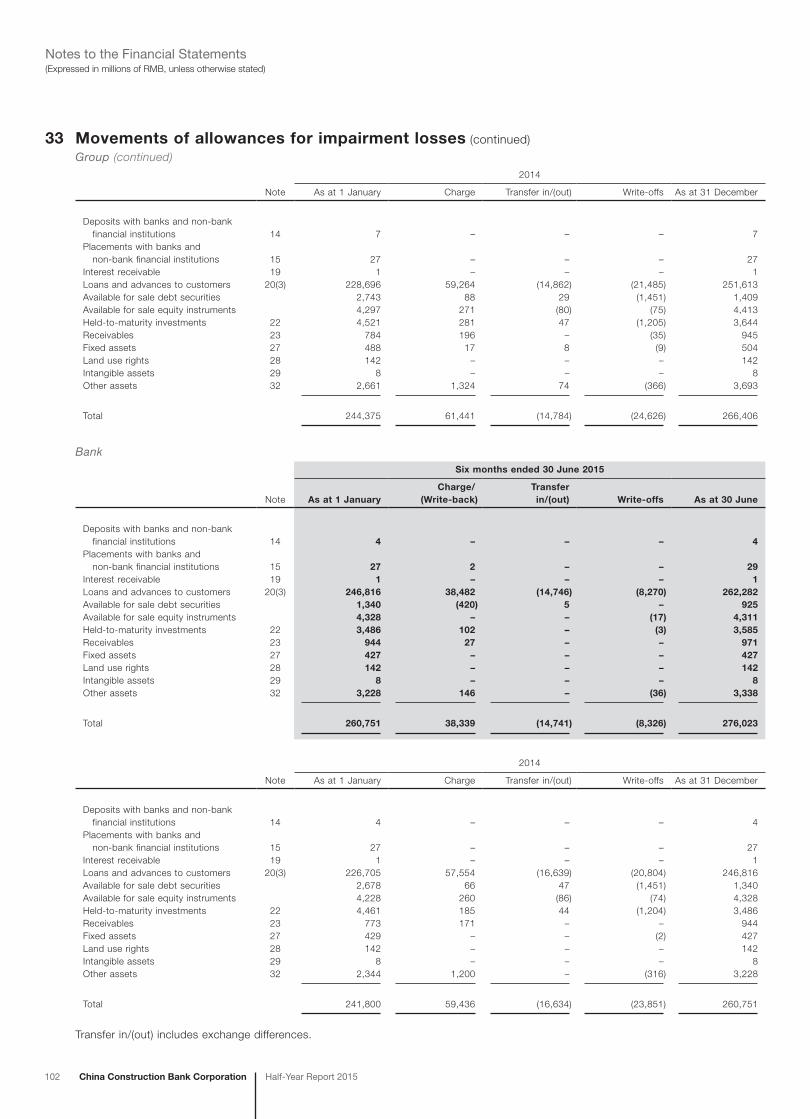
102 China Construction Bank Corporation Half-Year Report 2015
(Expressed in millions of RMB, unless otherwise stated)Notes to the Financial Statements
33 Movements of allowances for impairment losses (continued)Group (continued)
2014
Note As at 1 January Charge Transfer in/(out) Write-offs As at 31 December
Deposits with banks and non-bank financial institutions 14 7 – – – 7Placements with banks and non-bank financial institutions 15 27 – – – 27Interest receivable 19 1 – – – 1Loans and advances to customers 20(3) 228,696 59,264 (14,862) (21,485) 251,613Available for sale debt securities 2,743 88 29 (1,451) 1,409Available for sale equity instruments 4,297 271 (80) (75) 4,413Held-to-maturity investments 22 4,521 281 47 (1,205) 3,644Receivables 23 784 196 – (35) 945Fixed assets 27 488 17 8 (9) 504Land use rights 28 142 – – – 142Intangible assets 29 8 – – – 8Other assets 32 2,661 1,324 74 (366) 3,693
Total 244,375 61,441 (14,784) (24,626) 266,406
BankSix months ended 30 June 2015
Note As at 1 JanuaryCharge/
(Write-back)Transferin/(out) Write-offs As at 30 June
Deposits with banks and non-bank financial institutions 14 4 – – – 4Placements with banks and non-bank financial institutions 15 27 2 – – 29Interest receivable 19 1 – – – 1Loans and advances to customers 20(3) 246,816 38,482 (14,746) (8,270) 262,282Available for sale debt securities 1,340 (420) 5 – 925Available for sale equity instruments 4,328 – – (17) 4,311Held-to-maturity investments 22 3,486 102 – (3) 3,585Receivables 23 944 27 – – 971Fixed assets 27 427 – – – 427Land use rights 28 142 – – – 142Intangible assets 29 8 – – – 8Other assets 32 3,228 146 – (36) 3,338
Total 260,751 38,339 (14,741) (8,326) 276,023
2014
Note As at 1 January Charge Transfer in/(out) Write-offs As at 31 December
Deposits with banks and non-bank financial institutions 14 4 – – – 4Placements with banks and non-bank financial institutions 15 27 – – – 27Interest receivable 19 1 – – – 1Loans and advances to customers 20(3) 226,705 57,554 (16,639) (20,804) 246,816Available for sale debt securities 2,678 66 47 (1,451) 1,340Available for sale equity instruments 4,228 260 (86) (74) 4,328Held-to-maturity investments 22 4,461 185 44 (1,204) 3,486Receivables 23 773 171 – – 944Fixed assets 27 429 – – (2) 427Land use rights 28 142 – – – 142Intangible assets 29 8 – – – 8Other assets 32 2,344 1,200 – (316) 3,228
Total 241,800 59,436 (16,634) (23,851) 260,751
Transfer in/(out) includes exchange differences.

China Construction Bank CorporationHalf-Year Report 2015 103
(Expressed in millions of RMB, unless otherwise stated)Notes to the Financial Statements
34 Amounts due from/to subsidiariesAmounts due from subsidiaries of the Bank are analysed by assets category as follows:
30 June 2015 31 December 2014
Deposits with banks and non-bank financial institutions 19,139 13,717Placements with banks and non-bank financial institutions 142,992 105,861Interest receivable 243 235Loans and advances to customers 8,503 6,888Available-for-sale financial assets 60 60Other assets 35,579 36,895
Total 206,516 163,656
Amounts due to subsidiaries of the Bank are analysed by liabilities category as follows:
30 June 2015 31 December 2014
Deposits from banks and non-bank financial institutions 14,992 23,672Placements from banks and non-bank financial institutions 27,216 26,468Financial liabilities at fair value through profit or loss – 100Deposits from customers 7,573 5,075Interest payable 448 318Debt securities issued 1,878 724Other liabilities 32 3,639
Total 52,139 59,996
35 Borrowings from central banksGroup Bank
30 June 2015 31 December 2014 30 June 2015 31 December 2014
Mainland China 743 60,811 4 60,004Overseas 39,356 30,405 39,356 30,405
Total 40,099 91,216 39,360 90,409
36 Deposits from banks and non-bank financial institutions(1) Analysed by type of counterparties
Group Bank
30 June 2015 31 December 2014 30 June 2015 31 December 2014
Banks 236,789 105,056 237,514 108,686Non-bank financial institutions 1,497,106 899,062 1,501,519 900,060
Total 1,733,895 1,004,118 1,739,033 1,008,746
(2) Analysed by geographical sectorsGroup Bank
30 June 2015 31 December 2014 30 June 2015 31 December 2014
Mainland China 1,645,612 993,523 1,647,643 994,753Overseas 88,283 10,595 91,390 13,993
Total 1,733,895 1,004,118 1,739,033 1,008,746

104 China Construction Bank Corporation Half-Year Report 2015
(Expressed in millions of RMB, unless otherwise stated)Notes to the Financial Statements
37 Placements from banks and non-bank financial institutions(1) Analysed by type of counterparties
Group Bank
30 June 2015 31 December 2014 30 June 2015 31 December 2014
Banks 300,464 190,596 242,469 138,851Non-bank financial institutions 13,270 11,806 11,895 13,301
Total 313,734 202,402 254,364 152,152
(2) Analysed by geographical sectorsGroup Bank
30 June 2015 31 December 2014 30 June 2015 31 December 2014
Mainland China 133,431 79,254 66,064 25,789Overseas 180,303 123,148 188,300 126,363
Total 313,734 202,402 254,364 152,152
38 Financial liabilities at fair value through profit or lossGroup Bank
30 June 2015 31 December 2014 30 June 2015 31 December 2014
Principal guaranteed wealth management product 150,002 233,655 149,991 233,740Financial liabilities related to precious metals 34,827 36,891 34,827 36,891Structured financial instruments 20,380 25,463 18,746 22,011
Total 205,209 296,009 203,564 292,642
The Group’s and the Bank’s financial liabilities at fair value through profit or loss are those designated at fair value through profit or loss. As at the end of reporting period, the difference between the fair value of these financial liabilities and the contractual payables at maturity is not material. The amounts of changes in the fair value of these financial liabilities that are attributable to changes in credit risk are considered not significant during the period and year presented and cumulatively as at 30 June 2015 and 31 December 2014.
39 Financial assets sold under repurchase agreementsFinancial assets sold under repurchase agreements by underlying assets are shown as follows:
Group Bank
30 June 2015 31 December 2014 30 June 2015 31 December 2014
Securities – Bills issued by the PBOC – 50,000 – 50,000 – Government bonds 7,000 130,813 – 126,597 – Debt securities issued by banks and non-bank financial institutions 835 16 – –
Subtotal 7,835 180,829 – 176,597
Discounted bills 660 699 634 659
Total 8,495 181,528 634 177,256
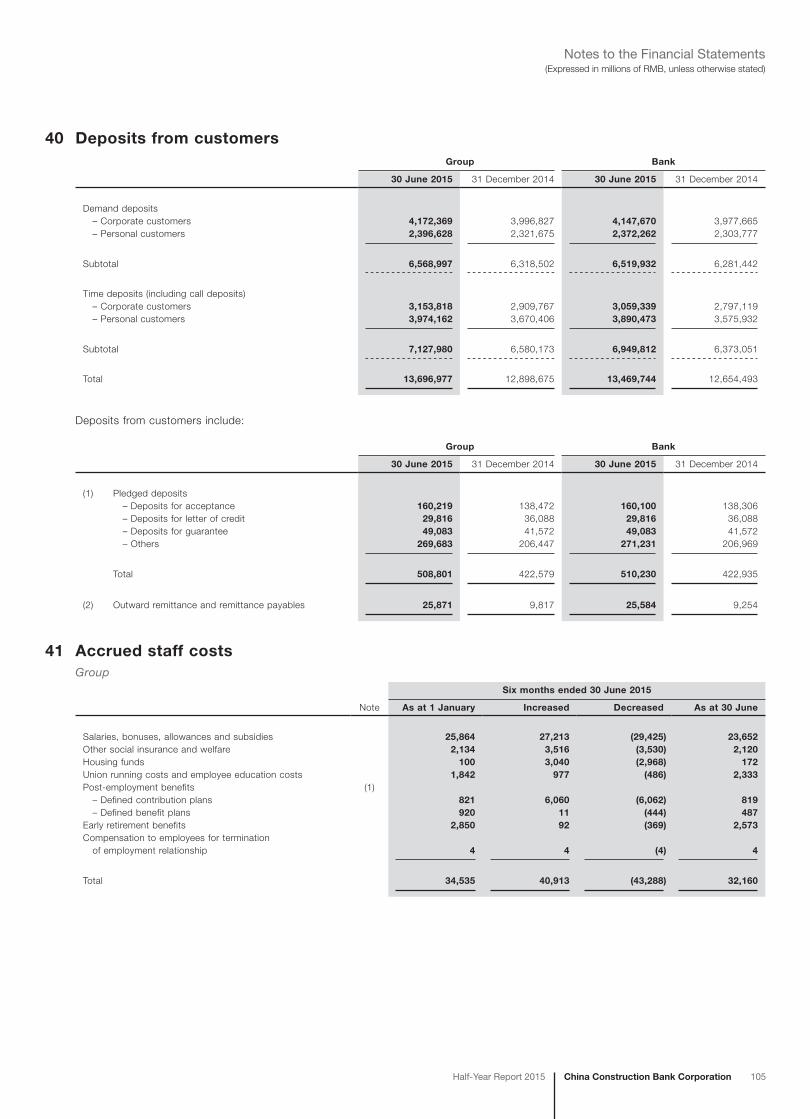
China Construction Bank CorporationHalf-Year Report 2015 105
(Expressed in millions of RMB, unless otherwise stated)Notes to the Financial Statements
40 Deposits from customersGroup Bank
30 June 2015 31 December 2014 30 June 2015 31 December 2014
Demand deposits – Corporate customers 4,172,369 3,996,827 4,147,670 3,977,665 – Personal customers 2,396,628 2,321,675 2,372,262 2,303,777
Subtotal 6,568,997 6,318,502 6,519,932 6,281,442
Time deposits (including call deposits) – Corporate customers 3,153,818 2,909,767 3,059,339 2,797,119 – Personal customers 3,974,162 3,670,406 3,890,473 3,575,932
Subtotal 7,127,980 6,580,173 6,949,812 6,373,051
Total 13,696,977 12,898,675 13,469,744 12,654,493
Deposits from customers include:
Group Bank
30 June 2015 31 December 2014 30 June 2015 31 December 2014
(1) Pledged deposits – Deposits for acceptance 160,219 138,472 160,100 138,306 – Deposits for letter of credit 29,816 36,088 29,816 36,088 – Deposits for guarantee 49,083 41,572 49,083 41,572 – Others 269,683 206,447 271,231 206,969
Total 508,801 422,579 510,230 422,935
(2) Outward remittance and remittance payables 25,871 9,817 25,584 9,254
41 Accrued staff costsGroup
Six months ended 30 June 2015
Note As at 1 January Increased Decreased As at 30 June
Salaries, bonuses, allowances and subsidies 25,864 27,213 (29,425) 23,652Other social insurance and welfare 2,134 3,516 (3,530) 2,120Housing funds 100 3,040 (2,968) 172Union running costs and employee education costs 1,842 977 (486) 2,333Post-employment benefits (1) – Defined contribution plans 821 6,060 (6,062) 819 – Defined benefit plans 920 11 (444) 487Early retirement benefits 2,850 92 (369) 2,573Compensation to employees for termination of employment relationship 4 4 (4) 4
Total 34,535 40,913 (43,288) 32,160

106 China Construction Bank Corporation Half-Year Report 2015
(Expressed in millions of RMB, unless otherwise stated)Notes to the Financial Statements
41 Accrued staff costs (continued)
Group (continued)2014
Note As at 1 January Increased Decreased As at 31 December
Salaries, bonuses, allowances and subsidies 25,189 60,268 (59,593) 25,864Other social insurance and welfare 2,233 9,653 (9,752) 2,134Housing funds 148 6,014 (6,062) 100Union running costs and employee education costs 1,533 2,561 (2,252) 1,842Post-employment benefits (1) – Defined contribution plans 766 12,995 (12,940) 821 – Defined benefit plans 609 311 – 920Early retirement benefits 3,596 182 (928) 2,850Compensation to employees for termination of employment relationship 6 8 (10) 4
Total 34,080 91,992 (91,537) 34,535
BankSix months ended 30 June 2015
Note As at 1 January Increased Decreased As at 30 June
Salaries, bonuses, allowances and subsidies 24,618 25,266 (27,640) 22,244Other social insurance and welfare 2,121 3,409 (3,437) 2,093Housing funds 99 3,003 (2,931) 171Union running costs and employee education costs 1,807 939 (475) 2,271Post-employment benefits (1) – Defined contribution plans 815 5,889 (5,892) 812 – Defined benefit plans 920 11 (444) 487Early retirement benefits 2,850 92 (369) 2,573Co mpensation to employees for termination of employment
relationship 4 4 (4) 4
Total 33,234 38,613 (41,192) 30,655
2014
Note As at 1 January Increased Decreased As at 31 December
Salaries, bonuses, allowances and subsidies 24,081 57,232 (56,695) 24,618Other social insurance and welfare 2,221 9,458 (9,558) 2,121Housing funds 148 5,943 (5,992) 99Union running costs and employee education costs 1,515 2,505 (2,213) 1,807Post-employment benefits (1) – Defined contribution plans 762 12,720 (12,667) 815 – Defined benefit plans 609 311 – 920Early retirement benefits 3,596 182 (928) 2,850Compensation to employees for termination of employment relationship 6 8 (10) 4
Total 32,938 88,359 (88,063) 33,234
The Group and the Bank has no overdue balance of accrued staff costs as at the end of the reporting period.
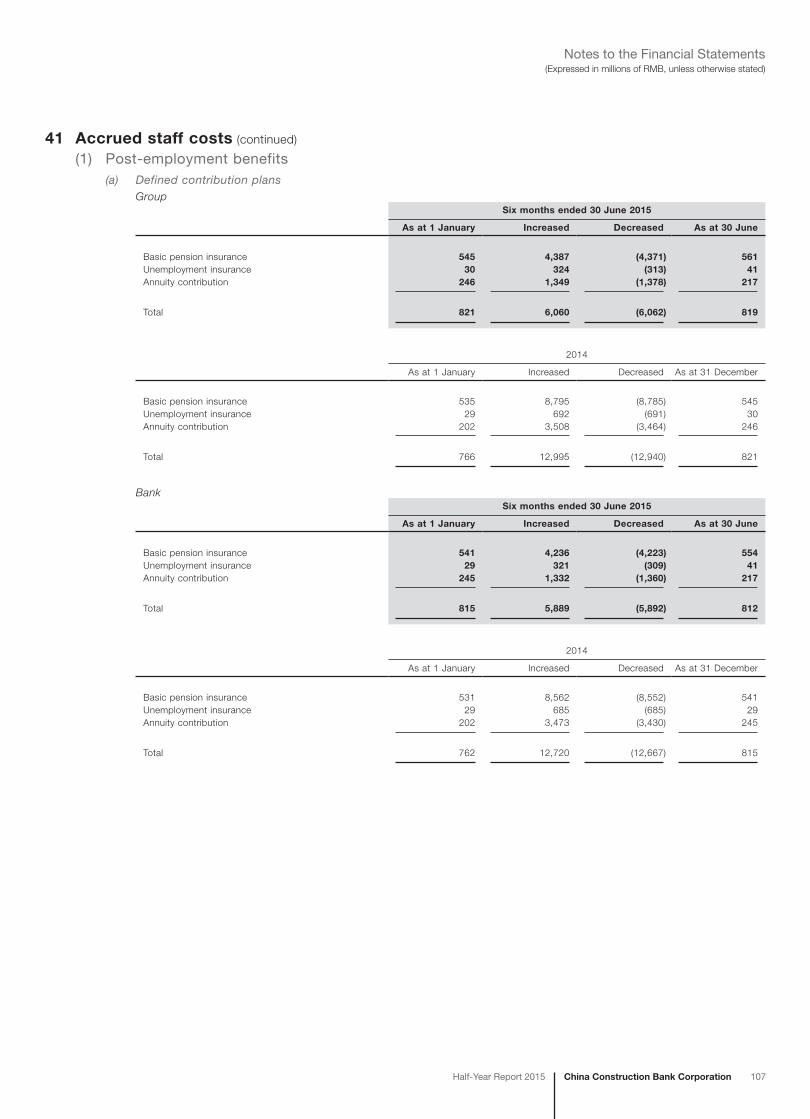
China Construction Bank CorporationHalf-Year Report 2015 107
(Expressed in millions of RMB, unless otherwise stated)Notes to the Financial Statements
41 Accrued staff costs (continued)
(1) Post-employment benefits(a) Defined contribution plans
GroupSix months ended 30 June 2015
As at 1 January Increased Decreased As at 30 June
Basic pension insurance 545 4,387 (4,371) 561Unemployment insurance 30 324 (313) 41Annuity contribution 246 1,349 (1,378) 217
Total 821 6,060 (6,062) 819
2014
As at 1 January Increased Decreased As at 31 December
Basic pension insurance 535 8,795 (8,785) 545Unemployment insurance 29 692 (691) 30Annuity contribution 202 3,508 (3,464) 246
Total 766 12,995 (12,940) 821
BankSix months ended 30 June 2015
As at 1 January Increased Decreased As at 30 June
Basic pension insurance 541 4,236 (4,223) 554Unemployment insurance 29 321 (309) 41Annuity contribution 245 1,332 (1,360) 217
Total 815 5,889 (5,892) 812
2014
As at 1 January Increased Decreased As at 31 December
Basic pension insurance 531 8,562 (8,552) 541Unemployment insurance 29 685 (685) 29Annuity contribution 202 3,473 (3,430) 245
Total 762 12,720 (12,667) 815
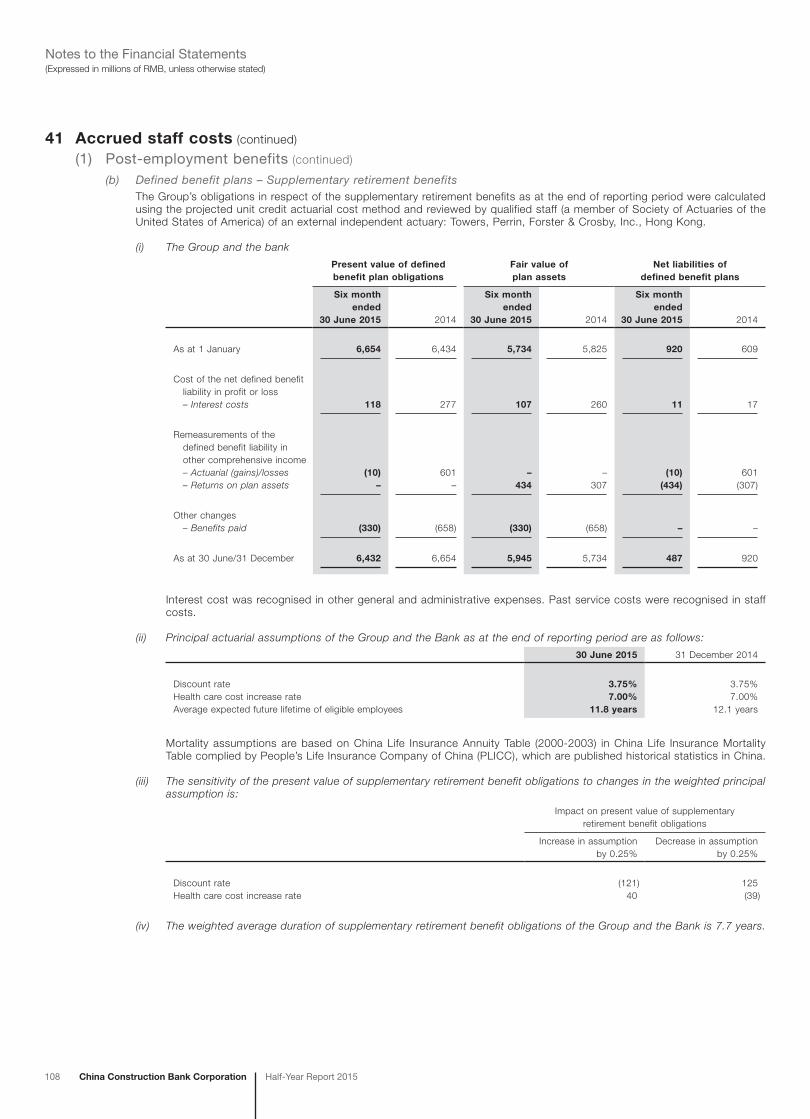
108 China Construction Bank Corporation Half-Year Report 2015
(Expressed in millions of RMB, unless otherwise stated)Notes to the Financial Statements
41 Accrued staff costs (continued)
(1) Post-employment benefits (continued)
(b) Defined benefit plans – Supplementary retirement benefitsThe Group’s obligations in respect of the supplementary retirement benefits as at the end of reporting period were calculated using the projected unit credit actuarial cost method and reviewed by qualified staff (a member of Society of Actuaries of the United States of America) of an external independent actuary: Towers, Perrin, Forster & Crosby, Inc., Hong Kong.
(i) The Group and the bank
Present value of defined benefit plan obligations
Fair value of plan assets
Net liabilities of defined benefit plans
Six month ended
30 June 2015 2014
Six month ended
30 June 2015 2014
Six month ended
30 June 2015 2014
As at 1 January 6,654 6,434 5,734 5,825 920 609
Cost of the net defined benefit liability in profit or loss – Interest costs 118 277 107 260 11 17
Remeasurements of the defined benefit liability in other comprehensive income – Actuarial (gains)/losses (10) 601 – – (10) 601 – Returns on plan assets – – 434 307 (434) (307)
Other changes – Benefits paid (330) (658) (330) (658) – –
As at 30 June/31 December 6,432 6,654 5,945 5,734 487 920
Interest cost was recognised in other general and administrative expenses. Past service costs were recognised in staff costs.
(ii) Principal actuarial assumptions of the Group and the Bank as at the end of reporting period are as follows:
30 June 2015 31 December 2014
Discount rate 3.75% 3.75%Health care cost increase rate 7.00% 7.00%Average expected future lifetime of eligible employees 11.8 years 12.1 years
Mortality assumptions are based on China Life Insurance Annuity Table (2000-2003) in China Life Insurance Mortality Table complied by People’s Life Insurance Company of China (PLICC), which are published historical statistics in China.
(iii) The sensitivity of the present value of supplementary retirement benefit obligations to changes in the weighted principal assumption is:
Impact on present value of supplementaryretirement benefit obligations
Increase in assumptionby 0.25%
Decrease in assumptionby 0.25%
Discount rate (121) 125Health care cost increase rate 40 (39)
(iv) The weighted average duration of supplementary retirement benefit obligations of the Group and the Bank is 7.7 years.
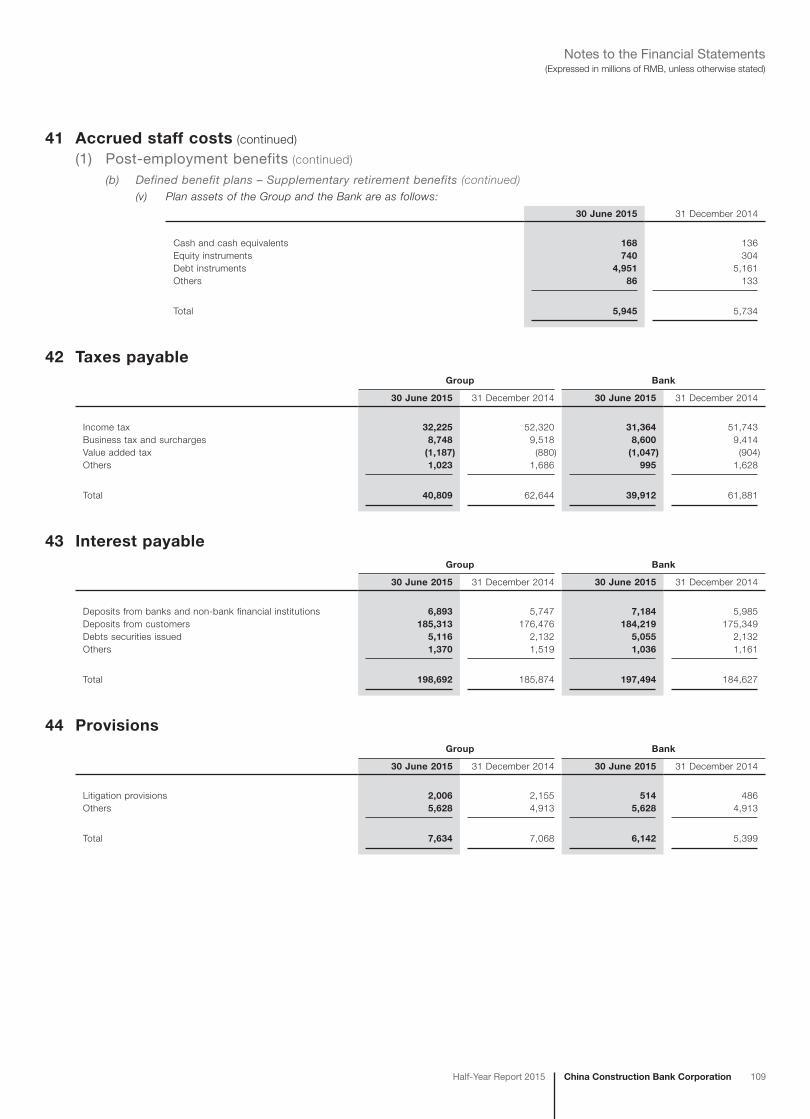
China Construction Bank CorporationHalf-Year Report 2015 109
(Expressed in millions of RMB, unless otherwise stated)Notes to the Financial Statements
41 Accrued staff costs (continued)
(1) Post-employment benefits (continued)
(b) Defined benefit plans – Supplementary retirement benefits (continued)(v) Plan assets of the Group and the Bank are as follows:
30 June 2015 31 December 2014
Cash and cash equivalents 168 136Equity instruments 740 304Debt instruments 4,951 5,161Others 86 133
Total 5,945 5,734
42 Taxes payableGroup Bank
30 June 2015 31 December 2014 30 June 2015 31 December 2014
Income tax 32,225 52,320 31,364 51,743Business tax and surcharges 8,748 9,518 8,600 9,414Value added tax (1,187) (880) (1,047) (904)Others 1,023 1,686 995 1,628
Total 40,809 62,644 39,912 61,881
43 Interest payableGroup Bank
30 June 2015 31 December 2014 30 June 2015 31 December 2014
Deposits from banks and non-bank financial institutions 6,893 5,747 7,184 5,985Deposits from customers 185,313 176,476 184,219 175,349Debts securities issued 5,116 2,132 5,055 2,132Others 1,370 1,519 1,036 1,161
Total 198,692 185,874 197,494 184,627
44 ProvisionsGroup Bank
30 June 2015 31 December 2014 30 June 2015 31 December 2014
Litigation provisions 2,006 2,155 514 486Others 5,628 4,913 5,628 4,913
Total 7,634 7,068 6,142 5,399
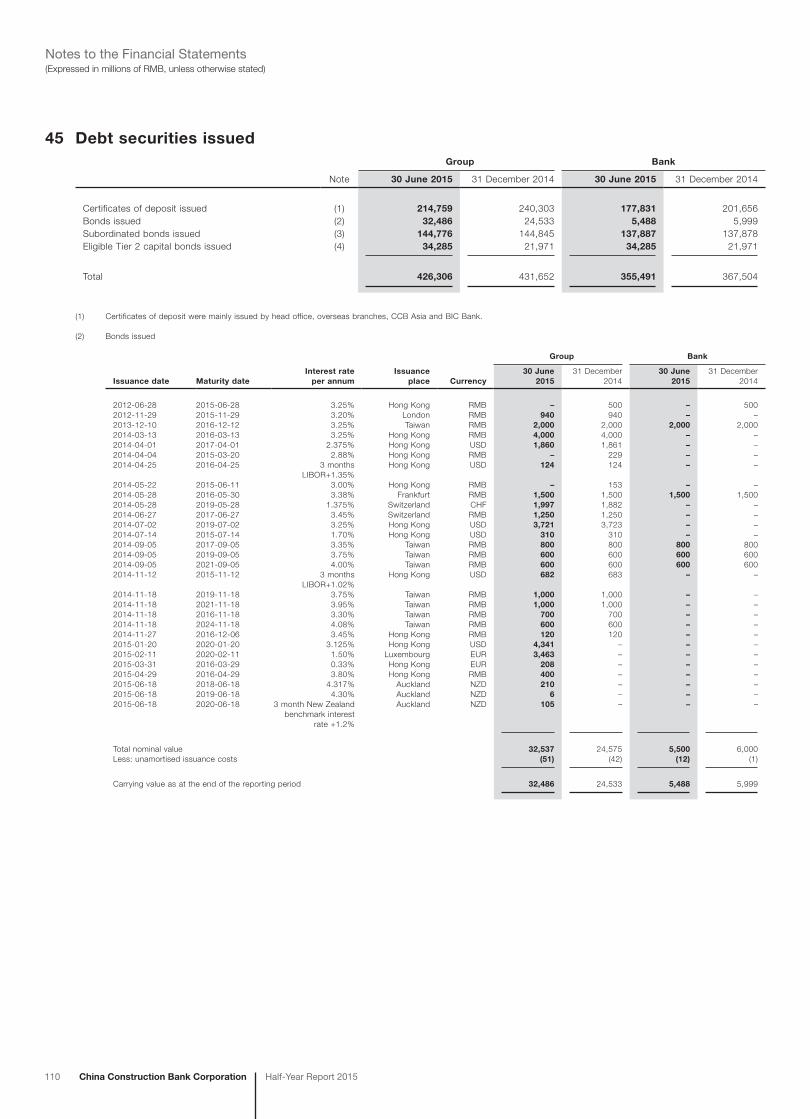
110 China Construction Bank Corporation Half-Year Report 2015
(Expressed in millions of RMB, unless otherwise stated)Notes to the Financial Statements
45 Debt securities issuedGroup Bank
Note 30 June 2015 31 December 2014 30 June 2015 31 December 2014
Certificates of deposit issued (1) 214,759 240,303 177,831 201,656Bonds issued (2) 32,486 24,533 5,488 5,999Subordinated bonds issued (3) 144,776 144,845 137,887 137,878Eligible Tier 2 capital bonds issued (4) 34,285 21,971 34,285 21,971
Total 426,306 431,652 355,491 367,504
(1) Certificates of deposit were mainly issued by head office, overseas branches, CCB Asia and BIC Bank.
(2) Bonds issued
Group Bank
Issuance date Maturity dateInterest rate
per annumIssuance
place Currency30 June
201531 December
201430 June
201531 December
2014
2012-06-28 2015-06-28 3.25% Hong Kong RMB – 500 – 5002012-11-29 2015-11-29 3.20% London RMB 940 940 – –2013-12-10 2016-12-12 3.25% Taiwan RMB 2,000 2,000 2,000 2,0002014-03-13 2016-03-13 3.25% Hong Kong RMB 4,000 4,000 – –2014-04-01 2017-04-01 2.375% Hong Kong USD 1,860 1,861 – –2014-04-04 2015-03-20 2.88% Hong Kong RMB – 229 – –2014-04-25 2016-04-25 3 months
LIBOR+1.35%Hong Kong USD 124 124 – –
2014-05-22 2015-06-11 3.00% Hong Kong RMB – 153 – –2014-05-28 2016-05-30 3.38% Frankfurt RMB 1,500 1,500 1,500 1,5002014-05-28 2019-05-28 1.375% Switzerland CHF 1,997 1,882 – –2014-06-27 2017-06-27 3.45% Switzerland RMB 1,250 1,250 – –2014-07-02 2019-07-02 3.25% Hong Kong USD 3,721 3,723 – –2014-07-14 2015-07-14 1.70% Hong Kong USD 310 310 – –2014-09-05 2017-09-05 3.35% Taiwan RMB 800 800 800 8002014-09-05 2019-09-05 3.75% Taiwan RMB 600 600 600 6002014-09-05 2021-09-05 4.00% Taiwan RMB 600 600 600 6002014-11-12 2015-11-12 3 months
LIBOR+1.02%Hong Kong USD 682 683 – –
2014-11-18 2019-11-18 3.75% Taiwan RMB 1,000 1,000 – –2014-11-18 2021-11-18 3.95% Taiwan RMB 1,000 1,000 – –2014-11-18 2016-11-18 3.30% Taiwan RMB 700 700 – –2014-11-18 2024-11-18 4.08% Taiwan RMB 600 600 – –2014-11-27 2016-12-06 3.45% Hong Kong RMB 120 120 – –2015-01-20 2020-01-20 3.125% Hong Kong USD 4,341 – – –2015-02-11 2020-02-11 1.50% Luxembourg EUR 3,463 – – –2015-03-31 2016-03-29 0.33% Hong Kong EUR 208 – – –2015-04-29 2016-04-29 3.80% Hong Kong RMB 400 – – –2015-06-18 2018-06-18 4.317% Auckland NZD 210 – – –2015-06-18 2019-06-18 4.30% Auckland NZD 6 – – –2015-06-18 2020-06-18 3 month New Zealand
benchmark interest rate +1.2%
Auckland NZD 105 – – –
Total nominal value 32,537 24,575 5,500 6,000Less: unamortised issuance costs (51) (42) (12) (1)
Carrying value as at the end of the reporting period 32,486 24,533 5,488 5,999
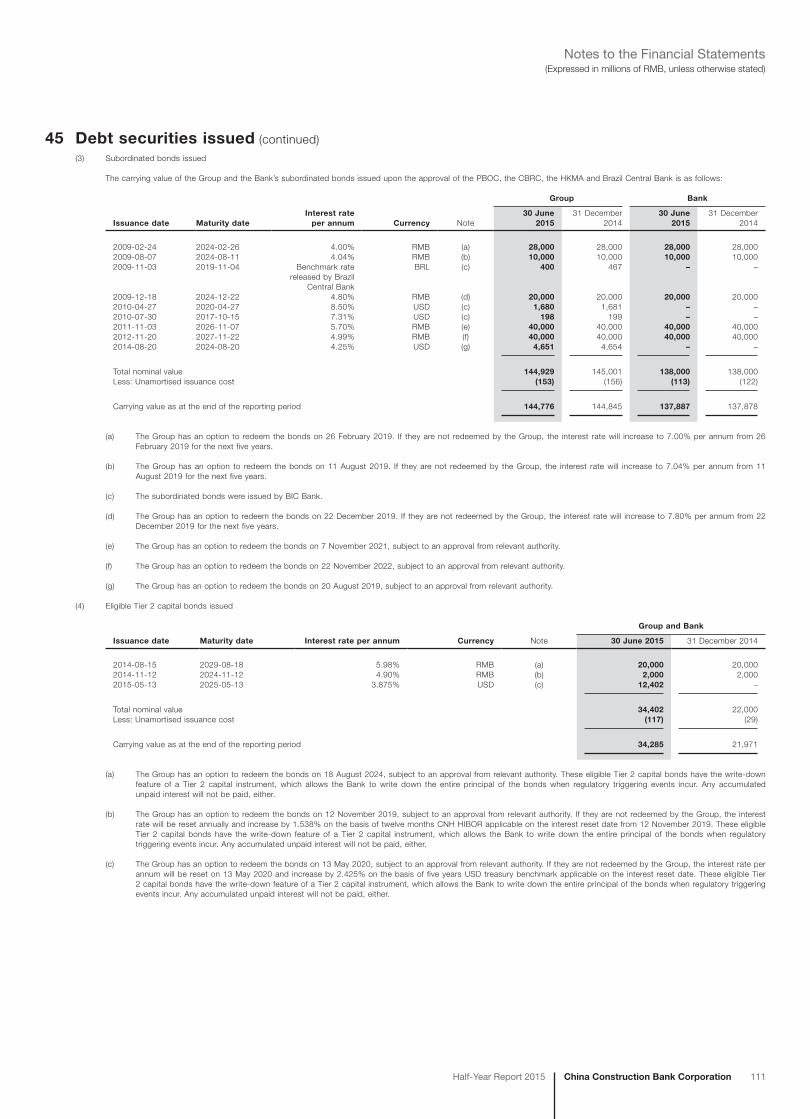
China Construction Bank CorporationHalf-Year Report 2015 111
(Expressed in millions of RMB, unless otherwise stated)Notes to the Financial Statements
45 Debt securities issued (continued)(3) Subordinated bonds issued
The carrying value of the Group and the Bank’s subordinated bonds issued upon the approval of the PBOC, the CBRC, the HKMA and Brazil Central Bank is as follows:
Group Bank
Issuance date Maturity dateInterest rate
per annum Currency Note30 June
201531 December
201430 June
201531 December
2014
2009-02-24 2024-02-26 4.00% RMB (a) 28,000 28,000 28,000 28,0002009-08-07 2024-08-11 4.04% RMB (b) 10,000 10,000 10,000 10,0002009-11-03 2019-11-04 Benchmark rate
released by Brazil Central Bank
BRL (c) 400 467 – –
2009-12-18 2024-12-22 4.80% RMB (d) 20,000 20,000 20,000 20,0002010-04-27 2020-04-27 8.50% USD (c) 1,680 1,681 – –2010-07-30 2017-10-15 7.31% USD (c) 198 199 – –2011-11-03 2026-11-07 5.70% RMB (e) 40,000 40,000 40,000 40,0002012-11-20 2027-11-22 4.99% RMB (f) 40,000 40,000 40,000 40,0002014-08-20 2024-08-20 4.25% USD (g) 4,651 4,654 – –
Total nominal value 144,929 145,001 138,000 138,000Less: Unamortised issuance cost (153) (156) (113) (122)
Carrying value as at the end of the reporting period 144,776 144,845 137,887 137,878
(a) The Group has an option to redeem the bonds on 26 February 2019. If they are not redeemed by the Group, the interest rate will increase to 7.00% per annum from 26 February 2019 for the next five years.
(b) The Group has an option to redeem the bonds on 11 August 2019. If they are not redeemed by the Group, the interest rate will increase to 7.04% per annum from 11 August 2019 for the next five years.
(c) The subordinated bonds were issued by BIC Bank.
(d) The Group has an option to redeem the bonds on 22 December 2019. If they are not redeemed by the Group, the interest rate will increase to 7.80% per annum from 22 December 2019 for the next five years.
(e) The Group has an option to redeem the bonds on 7 November 2021, subject to an approval from relevant authority.
(f) The Group has an option to redeem the bonds on 22 November 2022, subject to an approval from relevant authority.
(g) The Group has an option to redeem the bonds on 20 August 2019, subject to an approval from relevant authority.
(4) Eligible Tier 2 capital bonds issued
Group and Bank
Issuance date Maturity date Interest rate per annum Currency Note 30 June 2015 31 December 2014
2014-08-15 2029-08-18 5.98% RMB (a) 20,000 20,0002014-11-12 2024-11-12 4.90% RMB (b) 2,000 2,0002015-05-13 2025-05-13 3.875% USD (c) 12,402 –
Total nominal value 34,402 22,000Less: Unamortised issuance cost (117) (29)
Carrying value as at the end of the reporting period 34,285 21,971
(a) The Group has an option to redeem the bonds on 18 August 2024, subject to an approval from relevant authority. These eligible Tier 2 capital bonds have the write-down feature of a Tier 2 capital instrument, which allows the Bank to write down the entire principal of the bonds when regulatory triggering events incur. Any accumulated unpaid interest will not be paid, either.
(b) The Group has an option to redeem the bonds on 12 November 2019, subject to an approval from relevant authority. If they are not redeemed by the Group, the interest rate will be reset annually and increase by 1.538% on the basis of twelve months CNH HIBOR applicable on the interest reset date from 12 November 2019. These eligible Tier 2 capital bonds have the write-down feature of a Tier 2 capital instrument, which allows the Bank to write down the entire principal of the bonds when regulatory triggering events incur. Any accumulated unpaid interest will not be paid, either.
(c) The Group has an option to redeem the bonds on 13 May 2020, subject to an approval from relevant authority. If they are not redeemed by the Group, the interest rate per annum will be reset on 13 May 2020 and increase by 2.425% on the basis of five years USD treasury benchmark applicable on the interest reset date. These eligible Tier 2 capital bonds have the write-down feature of a Tier 2 capital instrument, which allows the Bank to write down the entire principal of the bonds when regulatory triggering events incur. Any accumulated unpaid interest will not be paid, either.
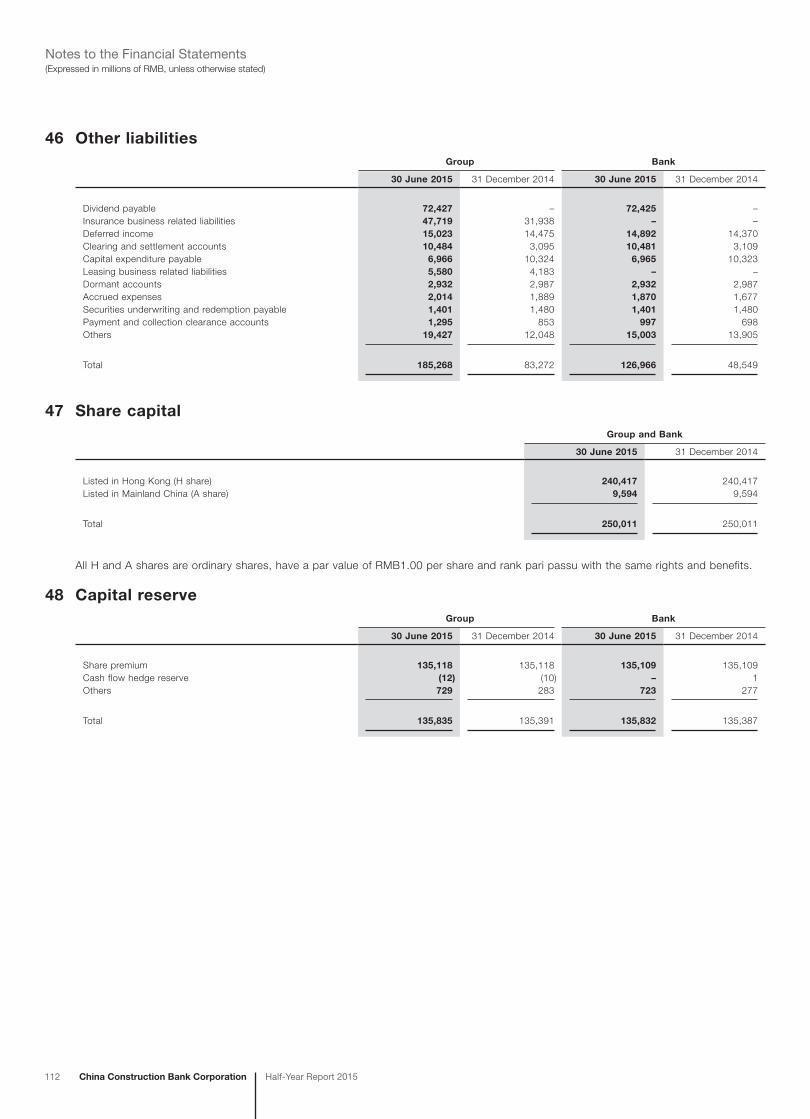
112 China Construction Bank Corporation Half-Year Report 2015
(Expressed in millions of RMB, unless otherwise stated)Notes to the Financial Statements
46 Other liabilitiesGroup Bank
30 June 2015 31 December 2014 30 June 2015 31 December 2014
Dividend payable 72,427 – 72,425 –Insurance business related liabilities 47,719 31,938 – –Deferred income 15,023 14,475 14,892 14,370Clearing and settlement accounts 10,484 3,095 10,481 3,109Capital expenditure payable 6,966 10,324 6,965 10,323Leasing business related liabilities 5,580 4,183 – –Dormant accounts 2,932 2,987 2,932 2,987Accrued expenses 2,014 1,889 1,870 1,677Securities underwriting and redemption payable 1,401 1,480 1,401 1,480Payment and collection clearance accounts 1,295 853 997 698Others 19,427 12,048 15,003 13,905
Total 185,268 83,272 126,966 48,549
47 Share capitalGroup and Bank
30 June 2015 31 December 2014
Listed in Hong Kong (H share) 240,417 240,417Listed in Mainland China (A share) 9,594 9,594
Total 250,011 250,011
All H and A shares are ordinary shares, have a par value of RMB1.00 per share and rank pari passu with the same rights and benefits.
48 Capital reserveGroup Bank
30 June 2015 31 December 2014 30 June 2015 31 December 2014
Share premium 135,118 135,118 135,109 135,109Cash flow hedge reserve (12) (10) – 1Others 729 283 723 277
Total 135,835 135,391 135,832 135,387
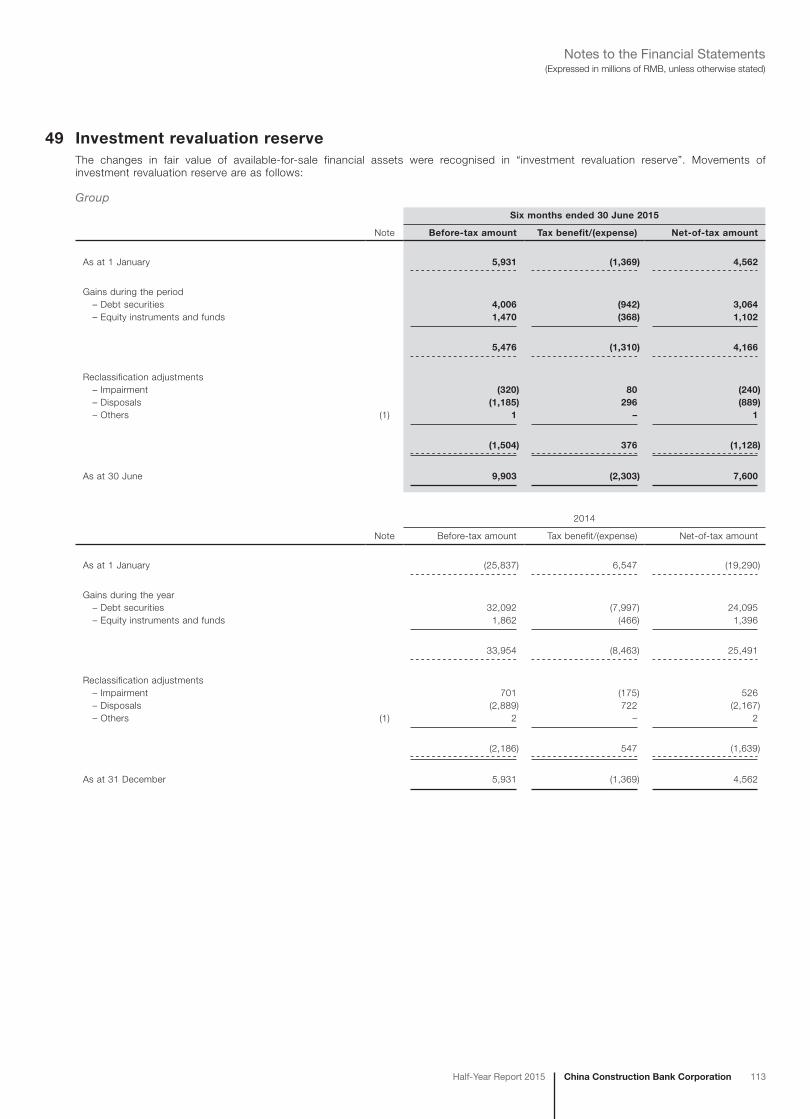
China Construction Bank CorporationHalf-Year Report 2015 113
(Expressed in millions of RMB, unless otherwise stated)Notes to the Financial Statements
49 Investment revaluation reserveThe changes in fair value of available-for-sale financial assets were recognised in “investment revaluation reserve”. Movements of investment revaluation reserve are as follows:
GroupSix months ended 30 June 2015
Note Before-tax amount Tax benefit/(expense) Net-of-tax amount
As at 1 January 5,931 (1,369) 4,562
Gains during the period – Debt securities 4,006 (942) 3,064 – Equity instruments and funds 1,470 (368) 1,102
5,476 (1,310) 4,166
Reclassification adjustments – Impairment (320) 80 (240) – Disposals (1,185) 296 (889) – Others (1) 1 – 1
(1,504) 376 (1,128)
As at 30 June 9,903 (2,303) 7,600
2014
Note Before-tax amount Tax benefit/(expense) Net-of-tax amount
As at 1 January (25,837) 6,547 (19,290)
Gains during the year – Debt securities 32,092 (7,997) 24,095 – Equity instruments and funds 1,862 (466) 1,396
33,954 (8,463) 25,491
Reclassification adjustments – Impairment 701 (175) 526 – Disposals (2,889) 722 (2,167) – Others (1) 2 – 2
(2,186) 547 (1,639)
As at 31 December 5,931 (1,369) 4,562
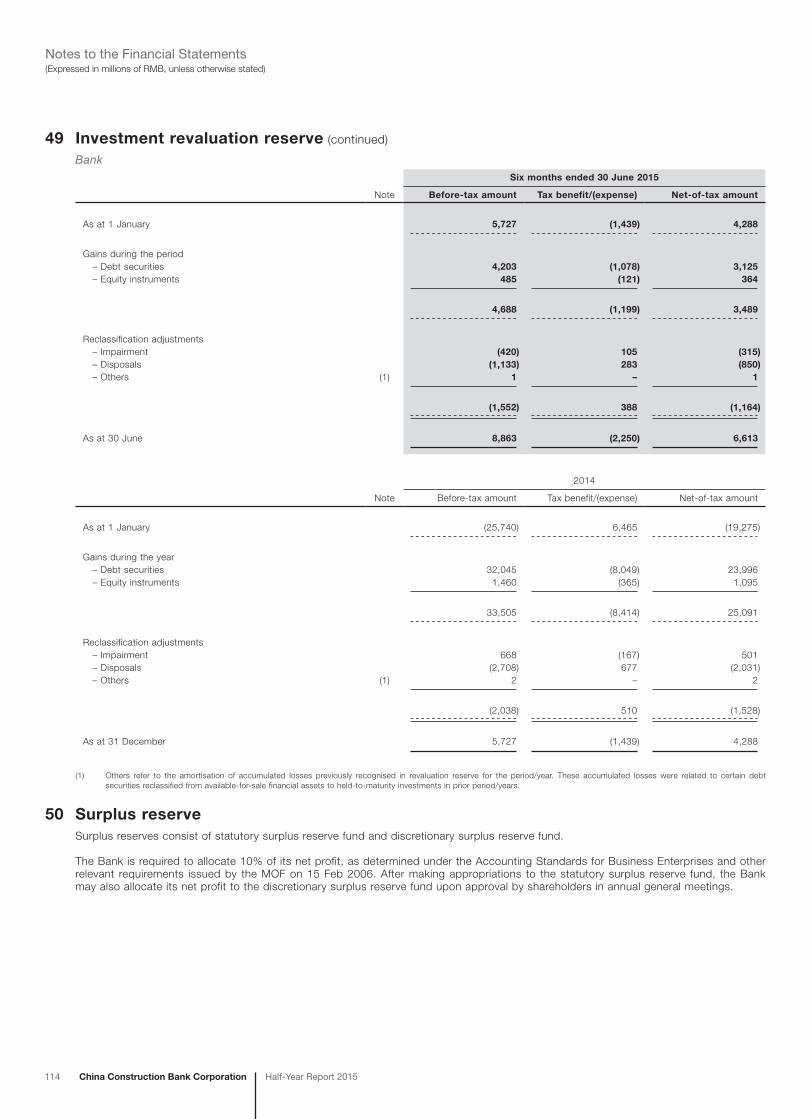
114 China Construction Bank Corporation Half-Year Report 2015
(Expressed in millions of RMB, unless otherwise stated)Notes to the Financial Statements
49 Investment revaluation reserve (continued)
BankSix months ended 30 June 2015
Note Before-tax amount Tax benefit/(expense) Net-of-tax amount
As at 1 January 5,727 (1,439) 4,288
Gains during the period – Debt securities 4,203 (1,078) 3,125 – Equity instruments 485 (121) 364
4,688 (1,199) 3,489
Reclassification adjustments – Impairment (420) 105 (315) – Disposals (1,133) 283 (850) – Others (1) 1 – 1
(1,552) 388 (1,164)
As at 30 June 8,863 (2,250) 6,613
2014
Note Before-tax amount Tax benefit/(expense) Net-of-tax amount
As at 1 January (25,740) 6,465 (19,275)
Gains during the year – Debt securities 32,045 (8,049) 23,996 – Equity instruments 1,460 (365) 1,095
33,505 (8,414) 25,091
Reclassification adjustments – Impairment 668 (167) 501 – Disposals (2,708) 677 (2,031) – Others (1) 2 – 2
(2,038) 510 (1,528)
As at 31 December 5,727 (1,439) 4,288
(1) Others refer to the amortisation of accumulated losses previously recognised in revaluation reserve for the period/year. These accumulated losses were related to certain debt securities reclassified from available-for-sale financial assets to held-to-maturity investments in prior period/years.
50 Surplus reserveSurplus reserves consist of statutory surplus reserve fund and discretionary surplus reserve fund.
The Bank is required to allocate 10% of its net profit, as determined under the Accounting Standards for Business Enterprises and other relevant requirements issued by the MOF on 15 Feb 2006. After making appropriations to the statutory surplus reserve fund, the Bank may also allocate its net profit to the discretionary surplus reserve fund upon approval by shareholders in annual general meetings.
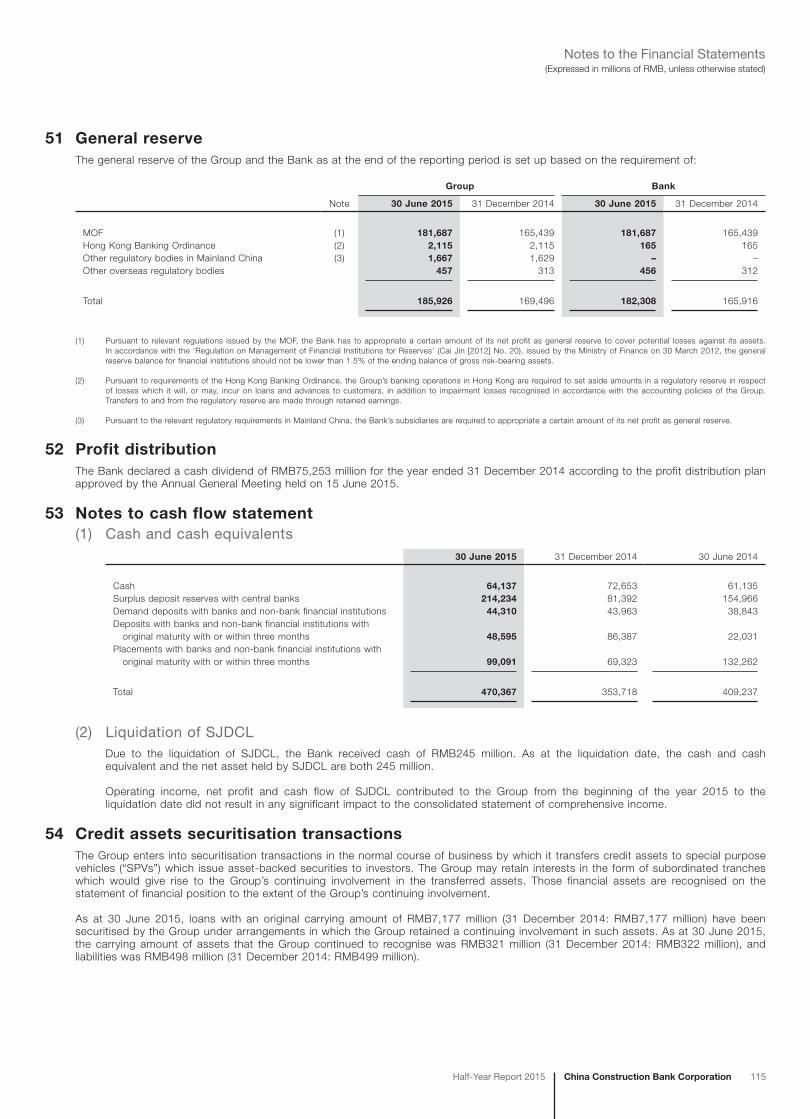
China Construction Bank CorporationHalf-Year Report 2015 115
(Expressed in millions of RMB, unless otherwise stated)Notes to the Financial Statements
51 General reserveThe general reserve of the Group and the Bank as at the end of the reporting period is set up based on the requirement of:
Group Bank
Note 30 June 2015 31 December 2014 30 June 2015 31 December 2014
MOF (1) 181,687 165,439 181,687 165,439Hong Kong Banking Ordinance (2) 2,115 2,115 165 165Other regulatory bodies in Mainland China (3) 1,667 1,629 – –Other overseas regulatory bodies 457 313 456 312
Total 185,926 169,496 182,308 165,916
(1) Pursuant to relevant regulations issued by the MOF, the Bank has to appropriate a certain amount of its net profit as general reserve to cover potential losses against its assets. In accordance with the ‘Regulation on Management of Financial Institutions for Reserves’ (Cai Jin [2012] No. 20), issued by the Ministry of Finance on 30 March 2012, the general reserve balance for financial institutions should not be lower than 1.5% of the ending balance of gross risk-bearing assets.
(2) Pursuant to requirements of the Hong Kong Banking Ordinance, the Group’s banking operations in Hong Kong are required to set aside amounts in a regulatory reserve in respect of losses which it will, or may, incur on loans and advances to customers, in addition to impairment losses recognised in accordance with the accounting policies of the Group. Transfers to and from the regulatory reserve are made through retained earnings.
(3) Pursuant to the relevant regulatory requirements in Mainland China, the Bank’s subsidiaries are required to appropriate a certain amount of its net profit as general reserve.
52 Profit distributionThe Bank declared a cash dividend of RMB75,253 million for the year ended 31 December 2014 according to the profit distribution plan approved by the Annual General Meeting held on 15 June 2015.
53 Notes to cash flow statement(1) Cash and cash equivalents
30 June 2015 31 December 2014 30 June 2014
Cash 64,137 72,653 61,135Surplus deposit reserves with central banks 214,234 81,392 154,966Demand deposits with banks and non-bank financial institutions 44,310 43,963 38,843Deposits with banks and non-bank financial institutions with original maturity with or within three months 48,595 86,387 22,031Placements with banks and non-bank financial institutions with original maturity with or within three months 99,091 69,323 132,262
Total 470,367 353,718 409,237
(2) Liquidation of SJDCLDue to the liquidation of SJDCL, the Bank received cash of RMB245 million. As at the liquidation date, the cash and cash equivalent and the net asset held by SJDCL are both 245 million.
Operating income, net profit and cash flow of SJDCL contributed to the Group from the beginning of the year 2015 to the liquidation date did not result in any significant impact to the consolidated statement of comprehensive income.
54 Credit assets securitisation transactionsThe Group enters into securitisation transactions in the normal course of business by which it transfers credit assets to special purpose vehicles (“SPVs”) which issue asset-backed securities to investors. The Group may retain interests in the form of subordinated tranches which would give rise to the Group’s continuing involvement in the transferred assets. Those financial assets are recognised on the statement of financial position to the extent of the Group’s continuing involvement.
As at 30 June 2015, loans with an original carrying amount of RMB7,177 million (31 December 2014: RMB7,177 million) have been securitised by the Group under arrangements in which the Group retained a continuing involvement in such assets. As at 30 June 2015, the carrying amount of assets that the Group continued to recognise was RMB321 million (31 December 2014: RMB322 million), and liabilities was RMB498 million (31 December 2014: RMB499 million).
116 China Construction Bank Corporation Half-Year Report 2015
(Expressed in millions of RMB, unless otherwise stated)Notes to the Financial Statements
55 Operating segmentsThe Group has presented the operating segments in a manner consistent with the way in which information is reported internally to the Group’s chief operating decision makers for the purposes of resource allocation and performance assessment. Measurement of segment assets and liabilities and segment income and results is based on the Group’s accounting policies.
Transactions between segments are conducted under normal commercial terms and conditions. Internal charges and transfer prices are determined with reference to market rates and have been reflected in the performance of each segment. Net interest income and expense arising from internal charges and transfer pricing adjustments are referred to as “internal net interest income/expense”. Interest income and expense earned from third parties are referred to as “external net interest income/expense”.
Segment revenues, results, assets and liabilities include items directly attributable to a segment as well as those that can be allocated on a reasonable basis. Segment income and results are determined before intra-group transactions are eliminated as part of the consolidation process. Segment capital expenditure is the total cost incurred during the period to acquire fixed assets, intangible assets and other long-term assets.
(1) Geographical segmentsThe Group operates principally in Mainland China with branches covering all provinces, autonomous regions and municipalities directly under the central government, and several subsidiaries located in Mainland China. The Group also has bank branch operations in Hong Kong, Macau, Taiwan, Singapore, Frankfurt, Johannesburg, Tokyo, Seoul, New York, Sydney, Ho Chi Minh City, Luxembourg, Toronto, London and certain subsidiaries operations in Hong Kong, London, Moscow, Dubai, Luxembourg, British Virgin Islands, New Zealand and Sao Paulo.
In presenting information on the basis of geographical segments, operating income is allocated based on the location of the branches and subsidiaries that generate the income. Segment assets, liabilities and capital expenditure are allocated based on their geographical location.
Geographical segments of the Group, as defined for management reporting purposes, are defined as follows:
– “Yangtze River Delta” refers to the following areas where the tier-1 branches and the subsidiaries of the Bank operate: Shanghai Municipality, Jiangsu Province, Zhejiang Province, City of Ningbo and City of Suzhou;
– “Pearl River Delta” refers to the following areas where the tier-1 branches of the Bank operate: Guangdong Province, City of Shenzhen, Fujian Province and City of Xiamen;
– “Bohai Rim” refers to the following areas where the tier-1 branches and the subsidiaries of the Bank operate: Beijing Municipality, Shandong Province, Tianjin Municipality, Hebei Province and City of Qingdao;
– the “Central” region refers to the following areas where the tier-1 branches and the subsidiaries of the Bank operate: Shanxi Province, Guangxi Autonomous Region, Hubei Province, Henan Province, Hunan Province, Jiangxi Province, Hainan Province and Anhui Province;
– the “Western” region refers to the following areas where the tier-1 branches and the subsidiaries of the Bank operate: Sichuan Province, Chongqing Municipality, Guizhou Province, Yunnan Province, Tibet Autonomous Region, Inner Mongolia Autonomous Region, Shaanxi Province, Gansu Province, Qinghai Province, Ningxia Autonomous Region and Xinjiang Autonomous Region; and
– the “Northeastern” region refers to the following areas where the tier-1 branches and the subsidiaries of the Bank operate: Liaoning Province, Jilin Province, Heilongjiang Province and City of Dalian.

China Construction Bank CorporationHalf-Year Report 2015 117
(Expressed in millions of RMB, unless otherwise stated)Notes to the Financial Statements
55 Operating segments (continued)
(1) Geographical segments (continued)
Six months ended 30 June 2015
YangtzeRiver Delta
Pearl River Delta Bohai Rim Central Western Northeastern Head Office Overseas Total
External net interest income 28,450 17,531 20,203 26,247 29,426 8,259 91,594 2,909 224,619Internal net interest income/(expense) 7,865 11,770 14,673 11,306 8,459 5,121 (60,690) 1,496 –
Net interest income 36,315 29,301 34,876 37,553 37,885 13,380 30,904 4,405 224,619
Net fee and commission income 10,953 9,564 10,449 10,290 7,627 3,250 10,558 954 63,645Net trading gain/(loss) 80 69 (60) 40 49 19 593 960 1,750Dividend income – 4 13 158 5 – 8 283 471Net gain arising from investment securities 1,042 – 20 233 – 298 1,264 575 3,432Other operating income, net 251 104 475 144 1,264 118 1,261 283 3,900
Operating income 48,641 39,042 45,773 48,418 46,830 17,065 44,588 7,460 297,817
Operating expenses (14,857) (11,586) (14,477) (16,749) (15,295) (6,467) (5,271) (2,727) (87,429)Impairment losses (13,727) (8,991) (3,255) (5,271) (3,918) (2,645) (1,690) (1,752) (41,249)Share of profits less gains of associates and joint ventures – – – 17 – – – 51 68
Profit before tax 20,057 18,465 28,041 26,415 27,617 7,953 37,627 3,032 169,207
Capital expenditure 375 404 1,590 1,396 658 362 228 1,481 6,494Depreciation and amortisation 1,526 989 1,458 1,799 1,523 816 1,337 201 9,649
30 June 2015
Segment assets 3,121,737 2,672,716 3,414,684 2,820,963 2,772,710 1,038,055 6,529,431 1,111,062 23,481,358Interests in associates and joint ventures – – – 1,583 – – – 2,175 3,758
3,121,737 2,672,716 3,414,684 2,822,546 2,772,710 1,038,055 6,529,431 1,113,237 23,485,116
Deferred tax assets 39,555Elimination (5,305,485)
Total assets 18,219,186
Segment liabilities 3,093,338 2,656,889 3,390,041 2,800,053 2,756,168 1,033,220 5,453,575 1,028,418 22,211,702
Deferred tax liabilities 519Elimination (5,305,485)
Total liabilities 16,906,736
Off-balance sheet credit commitments 502,828 352,722 593,664 336,377 298,684 107,478 7,500 100,813 2,300,066
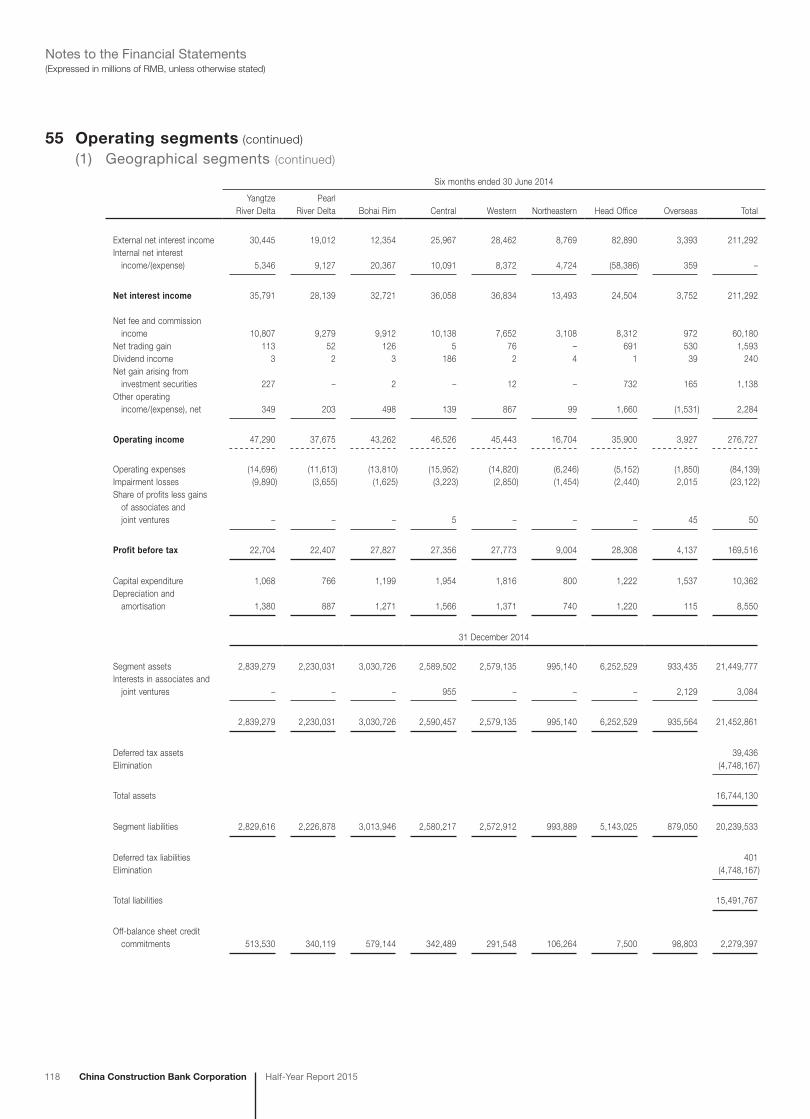
118 China Construction Bank Corporation Half-Year Report 2015
(Expressed in millions of RMB, unless otherwise stated)Notes to the Financial Statements
55 Operating segments (continued)
(1) Geographical segments (continued)
Six months ended 30 June 2014
YangtzeRiver Delta
PearlRiver Delta Bohai Rim Central Western Northeastern Head Office Overseas Total
External net interest income 30,445 19,012 12,354 25,967 28,462 8,769 82,890 3,393 211,292Internal net interest income/(expense) 5,346 9,127 20,367 10,091 8,372 4,724 (58,386) 359 –
Net interest income 35,791 28,139 32,721 36,058 36,834 13,493 24,504 3,752 211,292
Net fee and commission income 10,807 9,279 9,912 10,138 7,652 3,108 8,312 972 60,180Net trading gain 113 52 126 5 76 – 691 530 1,593Dividend income 3 2 3 186 2 4 1 39 240Net gain arising from investment securities 227 – 2 – 12 – 732 165 1,138Other operating income/(expense), net 349 203 498 139 867 99 1,660 (1,531) 2,284
Operating income 47,290 37,675 43,262 46,526 45,443 16,704 35,900 3,927 276,727
Operating expenses (14,696) (11,613) (13,810) (15,952) (14,820) (6,246) (5,152) (1,850) (84,139)Impairment losses (9,890) (3,655) (1,625) (3,223) (2,850) (1,454) (2,440) 2,015 (23,122)Share of profits less gains of associates and joint ventures – – – 5 – – – 45 50
Profit before tax 22,704 22,407 27,827 27,356 27,773 9,004 28,308 4,137 169,516
Capital expenditure 1,068 766 1,199 1,954 1,816 800 1,222 1,537 10,362Depreciation and amortisation 1,380 887 1,271 1,566 1,371 740 1,220 115 8,550
31 December 2014
Segment assets 2,839,279 2,230,031 3,030,726 2,589,502 2,579,135 995,140 6,252,529 933,435 21,449,777Interests in associates and joint ventures – – – 955 – – – 2,129 3,084
2,839,279 2,230,031 3,030,726 2,590,457 2,579,135 995,140 6,252,529 935,564 21,452,861
Deferred tax assets 39,436Elimination (4,748,167)
Total assets 16,744,130
Segment liabilities 2,829,616 2,226,878 3,013,946 2,580,217 2,572,912 993,889 5,143,025 879,050 20,239,533
Deferred tax liabilities 401Elimination (4,748,167)
Total liabilities 15,491,767
Off-balance sheet credit commitments 513,530 340,119 579,144 342,489 291,548 106,264 7,500 98,803 2,279,397

China Construction Bank CorporationHalf-Year Report 2015 119
(Expressed in millions of RMB, unless otherwise stated)Notes to the Financial Statements
55 Operating segments (continued)
(2) Business segmentsBusiness segments, as defined for management reporting purposes, are as follows:
Corporate bankingThis segment represents the provision of a range of financial products and services to corporations, government agencies and financial institutions. The products and services include corporate loans, trade financing, deposit taking and wealth management services, agency services, financial consulting and advisory services, cash management services, remittance and settlement services, custody services and guarantee services, etc.
Personal bankingThis segment represents the provision of a range of financial products and services to individual customers. The products and services comprise personal loans, deposit taking and wealth management services, card business, remittance services and agency services, etc.
Treasury businessThis segment covers the Group’s treasury operations. The treasury enters into inter-bank money market transactions, repurchase and resale transactions, and invests in debt securities. It also trades in derivatives and foreign currency for its own account. The treasury carries out customer-driven derivatives, foreign currency and precious metal trading. Its function also includes the management of the Group’s overall liquidity position, including the issuance of debt securities.
OthersThese represent equity investments and the revenues, results, assets and liabilities of overseas branches and subsidiaries.
Six months ended 30 June 2015
Corporatebanking
Personalbanking
Treasurybusiness Others Total
External net interest income 125,408 6,950 85,258 7,003 224,619Internal net interest (expenses)/income (6,975) 70,732 (60,839) (2,918) –
Net interest income 118,433 77,682 24,419 4,085 224,619
Net fee and commission income 23,965 27,066 10,883 1,731 63,645Net trading (loss)/gain (2,559) (470) 3,778 1,001 1,750Dividend income – – – 471 471Net gain arising from investment securities – – 223 3,209 3,432Other operating income/(expense), net 158 (21) 2,132 1,631 3,900
Operating income 139,997 104,257 41,435 12,128 297,817
Operating expenses (35,486) (42,814) (4,047) (5,082) (87,429)Impairment losses (32,034) (6,345) (496) (2,374) (41,249)Share of profits less losses of associates and joint ventures – – – 68 68
Profit before tax 72,477 55,098 36,892 4,740 169,207
Capital expenditure 1,381 2,570 179 2,364 6,494Depreciation and amortisation 3,088 5,745 400 416 9,649
30 June 2015
Segment assets 7,155,820 3,237,890 6,585,604 1,274,203 18,253,517Interests in associates and joint ventures – – – 3,758 3,758
7,155,820 3,237,890 6,585,604 1,277,961 18,257,275
Deferred tax assets 39,555Elimination (77,644)
Total assets 18,219,186
Segment liabilities 8,185,033 7,171,575 236,989 1,390,264 16,983,861
Deferred tax liabilities 519Elimination (77,644)
Total liabilities 16,906,736
Off-balance sheet credit commitments 1,680,890 518,157 – 101,019 2,300,066

120 China Construction Bank Corporation Half-Year Report 2015
(Expressed in millions of RMB, unless otherwise stated)Notes to the Financial Statements
55 Operating segments (continued)
(2) Business segments (continued)
Six months ended 30 June 2014
Corporatebanking
Personalbanking
Treasurybusiness Others Total
External net interest income 110,317 9,010 86,241 5,724 211,292Internal net interest income/(expenses) 4,569 72,339 (73,676) (3,232) –
Net interest income 114,886 81,349 12,565 2,492 211,292
Net fee and commission income 25,966 22,650 10,101 1,463 60,180Net trading (loss)/gain (3,708) (3,854) 8,615 540 1,593Dividend income – – – 240 240Net gain arising from investment securities – – 609 529 1,138Other operating income/(expense), net 147 30 2,858 (751) 2,284
Operating income 137,291 100,175 34,748 4,513 276,727
Operating expenses (32,321) (45,422) (2,632) (3,764) (84,139)Impairment losses (18,122) (5,457) (527) 984 (23,122)Share of profits less losses of associates and joint ventures – – – 50 50
Profit before tax 86,848 49,296 31,589 1,783 169,516
Capital expenditure 2,215 6,168 166 1,814 10,363Depreciation and amortisation 2,137 5,964 157 292 8,550
31 December 2014
Segment assets 6,106,160 3,005,155 6,588,297 1,056,039 16,755,651Interests in associates and joint ventures – – – 3,084 3,084
6,106,160 3,005,155 6,588,297 1,059,123 16,758,735
Deferred tax assets 39,436Elimination (54,041)
Total assets 16,744,130
Segment liabilities 7,118,017 6,820,246 446,096 1,161,048 15,545,407
Deferred tax liabilities 401Elimination (54,041)
Total liabilities 15,491,767
Off-balance sheet credit commitments 1,705,786 474,580 – 99,031 2,279,397
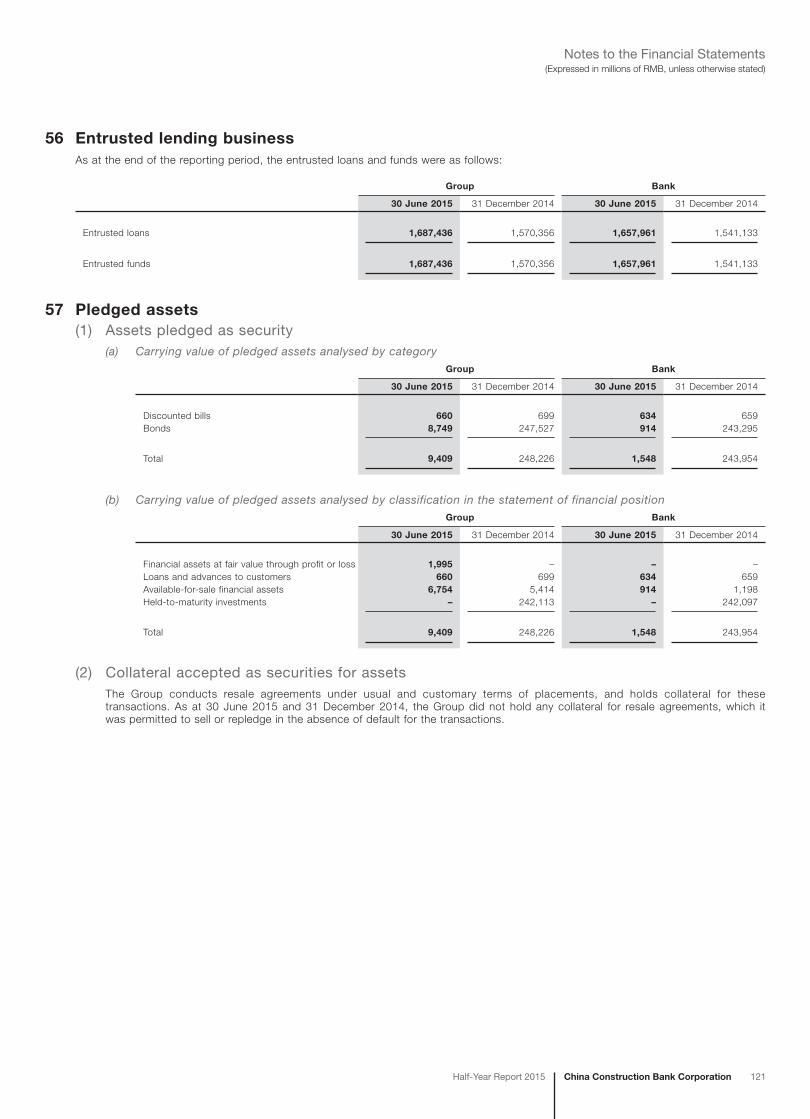
China Construction Bank CorporationHalf-Year Report 2015 121
(Expressed in millions of RMB, unless otherwise stated)Notes to the Financial Statements
56 Entrusted lending businessAs at the end of the reporting period, the entrusted loans and funds were as follows:
Group Bank
30 June 2015 31 December 2014 30 June 2015 31 December 2014
Entrusted loans 1,687,436 1,570,356 1,657,961 1,541,133
Entrusted funds 1,687,436 1,570,356 1,657,961 1,541,133
57 Pledged assets(1) Assets pledged as security
(a) Carrying value of pledged assets analysed by categoryGroup Bank
30 June 2015 31 December 2014 30 June 2015 31 December 2014
Discounted bills 660 699 634 659Bonds 8,749 247,527 914 243,295
Total 9,409 248,226 1,548 243,954
(b) Carrying value of pledged assets analysed by classification in the statement of financial positionGroup Bank
30 June 2015 31 December 2014 30 June 2015 31 December 2014
Financial assets at fair value through profit or loss 1,995 – – –Loans and advances to customers 660 699 634 659Available-for-sale financial assets 6,754 5,414 914 1,198Held-to-maturity investments – 242,113 – 242,097
Total 9,409 248,226 1,548 243,954
(2) Collateral accepted as securities for assetsThe Group conducts resale agreements under usual and customary terms of placements, and holds collateral for these transactions. As at 30 June 2015 and 31 December 2014, the Group did not hold any collateral for resale agreements, which it was permitted to sell or repledge in the absence of default for the transactions.
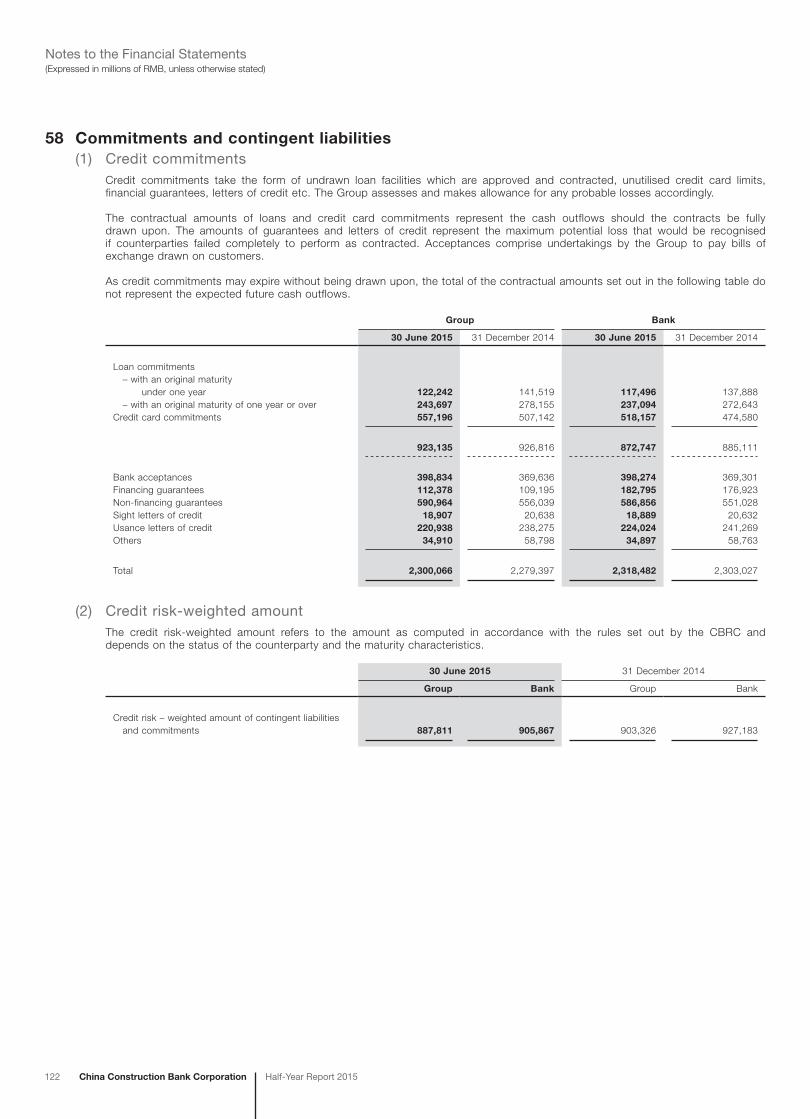
122 China Construction Bank Corporation Half-Year Report 2015
(Expressed in millions of RMB, unless otherwise stated)Notes to the Financial Statements
58 Commitments and contingent liabilities(1) Credit commitments
Credit commitments take the form of undrawn loan facilities which are approved and contracted, unutilised credit card limits, financial guarantees, letters of credit etc. The Group assesses and makes allowance for any probable losses accordingly.
The contractual amounts of loans and credit card commitments represent the cash outflows should the contracts be fully drawn upon. The amounts of guarantees and letters of credit represent the maximum potential loss that would be recognised if counterparties failed completely to perform as contracted. Acceptances comprise undertakings by the Group to pay bills of exchange drawn on customers.
As credit commitments may expire without being drawn upon, the total of the contractual amounts set out in the following table do not represent the expected future cash outflows.
Group Bank
30 June 2015 31 December 2014 30 June 2015 31 December 2014
Loan commitments – with an original maturity under one year 122,242 141,519 117,496 137,888 – with an original maturity of one year or over 243,697 278,155 237,094 272,643Credit card commitments 557,196 507,142 518,157 474,580
923,135 926,816 872,747 885,111
Bank acceptances 398,834 369,636 398,274 369,301Financing guarantees 112,378 109,195 182,795 176,923Non-financing guarantees 590,964 556,039 586,856 551,028Sight letters of credit 18,907 20,638 18,889 20,632Usance letters of credit 220,938 238,275 224,024 241,269Others 34,910 58,798 34,897 58,763
Total 2,300,066 2,279,397 2,318,482 2,303,027
(2) Credit risk-weighted amountThe credit risk-weighted amount refers to the amount as computed in accordance with the rules set out by the CBRC and depends on the status of the counterparty and the maturity characteristics.
30 June 2015 31 December 2014
Group Bank Group Bank
Credit risk – weighted amount of contingent liabilities and commitments 887,811 905,867 903,326 927,183

China Construction Bank CorporationHalf-Year Report 2015 123
(Expressed in millions of RMB, unless otherwise stated)Notes to the Financial Statements
58 Commitments and contingent liabilities (continued)
(3) Operating lease commitmentsThe Group and the Bank lease certain property and equipment under operating leases, which typically run for an initial period of one to five years and may include an option to renew the lease when all terms are renegotiated. As at the end of the reporting period, the future minimum lease payments under non-cancellable operating leases for property and equipment were as follows:
Group Bank
30 June 2015 31 December 2014 30 June 2015 31 December 2014
Within one year 5,461 5,234 5,026 4,834After one year but within two years 4,306 4,295 3,985 4,012After two years but within three years 3,278 3,227 3,089 3,035After three years but within five years 3,419 3,615 3,205 3,418After five years 2,347 2,471 1,950 2,057
Total 18,811 18,842 17,255 17,356
(4) Capital commitmentsAs at the end of the reporting period, the Group and the Bank had capital commitments as follows:
Group Bank
30 June 2015 31 December 2014 30 June 2015 31 December 2014
Contracted for 5,757 5,214 5,691 5,135Authorised but not contracted for 2,288 1,406 2,238 1,362
Total 8,045 6,620 7,929 6,497
(5) Underwriting obligationsAs at 30 June 2015, there was no unexpired underwriting commitment of the Group and the Bank (as at 31 December 2014: nil).
(6) Government bonds redemption obligationsAs an underwriting agent of PRC government bonds, the Group has the responsibility to buy back those bonds sold by it should the holders decide to early redeem the bonds held. The redemption price for the bonds at any time before their maturity date is based on the coupon value plus any interest unpaid and accrued up to the redemption date. Accrued interest payables to the bond holders are calculated in accordance with relevant rules of the MOF and the PBOC. The redemption price may be different from the fair value of similar instruments traded at the redemption date.
The redemption obligations, which represent the nominal value of government bonds underwritten and sold by the Group and the Bank, but not yet matured as at 30 June 2015, were RMB68,204 million (as at 31 December 2014: RMB61,633 million).
(7) Outstanding litigation and disputesAs at 30 June 2015, the Group was the defendant in certain pending litigation and disputes with gross claims of RMB6,208 million (as at 31 December 2014: RMB5,677 million). Provisions have been made for the estimated losses arising from such litigations based upon the opinions of the Group’s internal and external legal counsels (Note 44). The Group considers that the provisions made are reasonable and adequate.
(8) Provision against commitments and contingent liabilitiesThe Group and the Bank assessed and made provisions for any probable outflow of economic benefits in relation to the above commitments and contingent liabilities in accordance with their accounting policies.

124 China Construction Bank Corporation Half-Year Report 2015
(Expressed in millions of RMB, unless otherwise stated)Notes to the Financial Statements
59 Related party relationships and transactions(1) Transactions with parent companies and their affiliates
The parent companies of the Group are CIC and Huijin.
Approved by the State Council, CIC was established on 29 September 2007 with a registered capital of RMB1,550 billion. As a wholly owned subsidiary of CIC, Huijin exercises its rights and obligations as an investor on behalf of PRC government.
Huijin was incorporated on 16 December 2003 as a wholly state-owned investment company. It was registered in Beijing with a registered capital of RMB828,209 million. Its principal activities are equity investments as authorised by the State Council, without engaging in other commercial operations. As at 30 June 2015, Huijin directly held 57.11% shares of the Bank.
The related companies under parent companies include the subsidiaries under parent companies and other associates and joint ventures.
The Group’s transactions with parent companies and their affiliates mainly include deposit taking, entrusted asset management, operating leases, lending, purchase and sale of debt securities, money market transactions and inter-bank clearing. These transactions are priced based on market prices and conducted under general commercial terms.
The Group has issued subordinated debts with a nominal value of RMB144.93 billion (as at 31 December 2014: RMB145 billion). These are bearer bonds and tradable in secondary market. Accordingly, the Group has no information in respect of the amount of the bonds held by the affiliates of parent companies as at the end of the reporting period.
(a) Transactions with parent companiesIn the ordinary course of the business, material transactions that the Group and the Bank entered into with parent companies are as follows:
Amounts
Six months ended 30 June
2015 2014
AmountRatio to similar
transactions AmountRatio to similar
transactions
Interest income 289 0.08% 289 0.08%Interest expense 174 0.11% 61 0.04%
Balances outstanding as at the end of the reporting period
30 June 2015 31 December 2014
Note BalanceRatio to similar
transactions BalanceRatio to similar
transactions
Interest receivable 471 0.47% 185 0.20%Held-to-maturity investments 16,680 0.67% 16,680 0.73%Financial liabilities at fair value through profit or loss – – 13,000 4.39%Deposits from customers 7,505 0.05% 5,621 0.04%Interest payable 177 0.09% 6 0.00%Other liabilities (i) 42,979 23.20% – –Credit commitments 288 0.02% 288 0.01%
(i) Other liabilities as at 30 June 2015 represents cash dividends payable to Huijin approved by the 2014 Annual General Meeting.
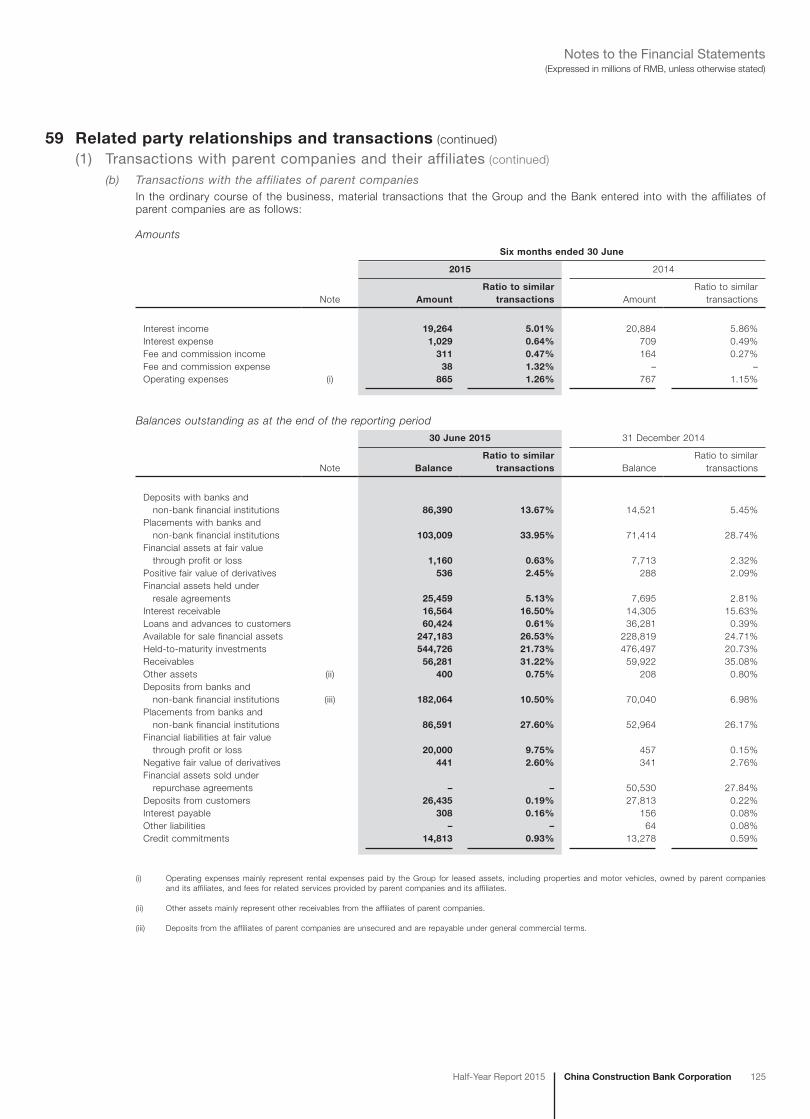
China Construction Bank CorporationHalf-Year Report 2015 125
(Expressed in millions of RMB, unless otherwise stated)Notes to the Financial Statements
59 Related party relationships and transactions (continued)
(1) Transactions with parent companies and their affiliates (continued)
(b) Transactions with the affiliates of parent companiesIn the ordinary course of the business, material transactions that the Group and the Bank entered into with the affiliates of parent companies are as follows:
Amounts
Six months ended 30 June
2015 2014
Note AmountRatio to similar
transactions AmountRatio to similar
transactions
Interest income 19,264 5.01% 20,884 5.86%Interest expense 1,029 0.64% 709 0.49%Fee and commission income 311 0.47% 164 0.27%Fee and commission expense 38 1.32% – –Operating expenses (i) 865 1.26% 767 1.15%
Balances outstanding as at the end of the reporting period
30 June 2015 31 December 2014
Note BalanceRatio to similar
transactions BalanceRatio to similar
transactions
Deposits with banks and non-bank financial institutions 86,390 13.67% 14,521 5.45%Placements with banks and non-bank financial institutions 103,009 33.95% 71,414 28.74%Financial assets at fair value through profit or loss 1,160 0.63% 7,713 2.32%Positive fair value of derivatives 536 2.45% 288 2.09%Financial assets held under resale agreements 25,459 5.13% 7,695 2.81%Interest receivable 16,564 16.50% 14,305 15.63%Loans and advances to customers 60,424 0.61% 36,281 0.39%Available for sale financial assets 247,183 26.53% 228,819 24.71%Held-to-maturity investments 544,726 21.73% 476,497 20.73%Receivables 56,281 31.22% 59,922 35.08%Other assets (ii) 400 0.75% 208 0.80%Deposits from banks and non-bank financial institutions (iii) 182,064 10.50% 70,040 6.98%Placements from banks and non-bank financial institutions 86,591 27.60% 52,964 26.17%Financial liabilities at fair value through profit or loss 20,000 9.75% 457 0.15%Negative fair value of derivatives 441 2.60% 341 2.76%Financial assets sold under repurchase agreements – – 50,530 27.84%Deposits from customers 26,435 0.19% 27,813 0.22%Interest payable 308 0.16% 156 0.08%Other liabilities – – 64 0.08%Credit commitments 14,813 0.93% 13,278 0.59%
(i) Operating expenses mainly represent rental expenses paid by the Group for leased assets, including properties and motor vehicles, owned by parent companies and its affiliates, and fees for related services provided by parent companies and its affiliates.
(ii) Other assets mainly represent other receivables from the affiliates of parent companies.
(iii) Deposits from the affiliates of parent companies are unsecured and are repayable under general commercial terms.
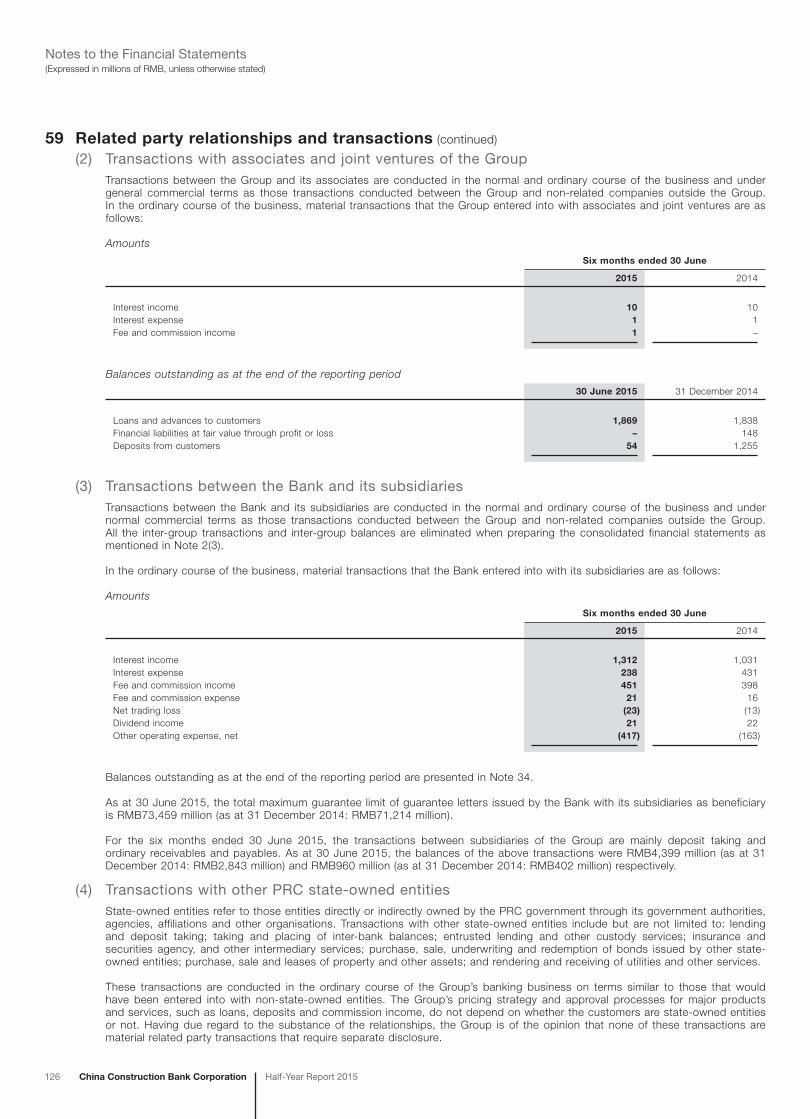
126 China Construction Bank Corporation Half-Year Report 2015
(Expressed in millions of RMB, unless otherwise stated)Notes to the Financial Statements
59 Related party relationships and transactions (continued)
(2) Transactions with associates and joint ventures of the GroupTransactions between the Group and its associates are conducted in the normal and ordinary course of the business and under general commercial terms as those transactions conducted between the Group and non-related companies outside the Group. In the ordinary course of the business, material transactions that the Group entered into with associates and joint ventures are as follows:
Amounts
Six months ended 30 June
2015 2014
Interest income 10 10Interest expense 1 1Fee and commission income 1 –
Balances outstanding as at the end of the reporting period
30 June 2015 31 December 2014
Loans and advances to customers 1,869 1,838Financial liabilities at fair value through profit or loss – 148Deposits from customers 54 1,255
(3) Transactions between the Bank and its subsidiariesTransactions between the Bank and its subsidiaries are conducted in the normal and ordinary course of the business and under normal commercial terms as those transactions conducted between the Group and non-related companies outside the Group. All the inter-group transactions and inter-group balances are eliminated when preparing the consolidated financial statements as mentioned in Note 2(3).
In the ordinary course of the business, material transactions that the Bank entered into with its subsidiaries are as follows:
Amounts
Six months ended 30 June
2015 2014
Interest income 1,312 1,031Interest expense 238 431Fee and commission income 451 398Fee and commission expense 21 16Net trading loss (23) (13)Dividend income 21 22Other operating expense, net (417) (163)
Balances outstanding as at the end of the reporting period are presented in Note 34.
As at 30 June 2015, the total maximum guarantee limit of guarantee letters issued by the Bank with its subsidiaries as beneficiary is RMB73,459 million (as at 31 December 2014: RMB71,214 million).
For the six months ended 30 June 2015, the transactions between subsidiaries of the Group are mainly deposit taking and ordinary receivables and payables. As at 30 June 2015, the balances of the above transactions were RMB4,399 million (as at 31 December 2014: RMB2,843 million) and RMB960 million (as at 31 December 2014: RMB402 million) respectively.
(4) Transactions with other PRC state-owned entitiesState-owned entities refer to those entities directly or indirectly owned by the PRC government through its government authorities, agencies, affiliations and other organisations. Transactions with other state-owned entities include but are not limited to: lending and deposit taking; taking and placing of inter-bank balances; entrusted lending and other custody services; insurance and securities agency, and other intermediary services; purchase, sale, underwriting and redemption of bonds issued by other state-owned entities; purchase, sale and leases of property and other assets; and rendering and receiving of utilities and other services.
These transactions are conducted in the ordinary course of the Group’s banking business on terms similar to those that would have been entered into with non-state-owned entities. The Group’s pricing strategy and approval processes for major products and services, such as loans, deposits and commission income, do not depend on whether the customers are state-owned entities or not. Having due regard to the substance of the relationships, the Group is of the opinion that none of these transactions are material related party transactions that require separate disclosure.
China Construction Bank CorporationHalf-Year Report 2015 127
(Expressed in millions of RMB, unless otherwise stated)Notes to the Financial Statements
59 Related party relationships and transactions (continued)
(5) Transactions with the Annuity Scheme and Plan AssetsApart from the obligations for defined contributions to the Annuity Scheme and regular banking transactions, there were no other transactions between the Group and the Annuity Scheme for the six months ended 30 June 2015 and the year ended 31 December 2014.
As at 30 June 2015, RMB3,051 million of the Group’s supplementary retirement benefit plan assets (31 December 2014: RMB2,977 million) were managed by CCB Principal and management fees payable to CCB Principal was RMB3.68 million (31 December 2014: RMB28.86 million).
(6) Key management personnelKey management personnel are those persons having authorities and responsibilities for planning, directing and controlling the activities of the Group, directly or indirectly, including directors, supervisors and senior executives. The Group enters into banking transactions with key management personnel in the normal course of business. For the six months ended 30 June 2015 and for the year ended 31 December 2014, there were no material transactions and balances with key management personnel.
(7) Loans and advances to directors, supervisors and senior executivesThe Group had no material balance of loans and advances to directors, supervisors and senior executives as at the end of reporting period. Those loans and advances to directors, supervisors and senior executives were conducted in the normal and ordinary course of the business and under normal commercial terms or on the same terms and conditions with those which are available to other employees, based on terms and conditions granted to third parties adjusted for risk reduction.
60 Risk ManagementThe Group has exposures to the following risks from its use of financial instruments:
– credit risk– market risk– liquidity risk– operational risk– insurance risk
This note presents information about the Group’s exposures to each of the above risks, the Group’s objectives, policies and processes for measuring and managing risk, and the Group’s capital management.
Risk management frameworkThe Board of Directors carries out their responsibilities according to the articles of association and other related regulatory requirements. The Board of Directors of the Bank established the Risk Management Committee to be responsible for formulating risk management strategies and policies, monitoring the implementation, and evaluating the overall risk profile on a regular basis. The Board of Supervisors has overseen the establishment of the overall risk management system and the carrying out of risk management responsibilities by the Board of Directors and senior management. Senior management is responsible for carrying out the risk management strategies established by the Board of Directors and the implementation of the overall risk management of the Group. Senior management appoints the Chief Risk Officer who assists the president with the corresponding risk management work.
To identify, evaluate, monitor and manage risk, the Group has designed a comprehensive governance framework, internal control policies and procedures. Risk management policies and systems are reviewed regularly to reflect changes in market conditions, products and services offered. The Group, through its training system, standardised management and process management, aims at developing a disciplined and constructive control environment, in which all employees understand their roles and obligations.
Risk Management Department is in charge of the overall business risk management. Credit Management Department is in charge of the overall credit risk management. Credit Approval Department is in charge of the overall credit business approval. Internal Control and Compliance Department coordinates operating risk management, internal control and compliance. Other departments are responsible for managing various corresponding risks.
The Group Audit Committee is responsible for monitoring and evaluating internal controls, and monitoring the compliance of core business sectors and their management procedures. Internal Control Department assists the Audit Committee to execute the above mentioned responsibilities and reports to the Audit Committee.
128 China Construction Bank Corporation Half-Year Report 2015
(Expressed in millions of RMB, unless otherwise stated)Notes to the Financial Statements
60 Risk Management (continued)
(1) Credit riskCredit risk managementCredit risk represents the financial loss that arises from the failure of a debtor or counterparty to discharge its contractual obligations or commitments to the Group.
Credit businessThe Risk Management Department takes the lead in the development and implementation of the credit risk measurement tools including customers rating and facilities grading and is responsible for the special assets resolutions. The Credit Management Department is responsible for establishing credit risk management policies and monitoring the quality of credit assets. The Credit Approval Department is responsible for the group’s comprehensive credit limits and credit approval of various credit businesses. While the Credit Management Department takes the lead, both the Credit Management Department and the Credit Approval Department will coordinate with the Corporate Banking Department, the SME Business Department, the Institutional Banking Department, the International Business Department, the Group Clients Department, the Housing Finance & Personal Lending Department, the Credit Card Center, and the Legal Affairs Department to implement the credit risk management policies and procedures.
With respect to the credit risk management of corporate and institutional business, the Group has accelerated the adjustment of its credit portfolio structure, enhanced post-lending monitoring, and refined the industry-specific guideline and policy baseline for credit approval. Management also fine-tuned the credit acceptance and exit policies, and optimised its economic capital and credit risk limit management. All these policies have been implemented to improve the overall asset quality. The Group manages credit risk throughout the entire credit process including pre-lending evaluations, credit approval and post-lending monitoring. The Group performs pre-lending evaluations by assessing the entity’s credit ratings based on internal rating criteria and assessing the risks and rewards with respect to the proposed project. Credit approvals are granted by designated Credit Approval Officers. The Group continually carries out post-lending monitoring, particularly those related to targeted industries, geographical segments, products and clients. Any adverse events that may significantly affect a borrower’s repayment ability are reported timely and measures are implemented to prevent and control risks.
With respect to the personal credit business, the Group relies on credit assessment of applicants as the basis for loan approval. Customer relationship managers are required to assess the income level, credit history, and repayment ability of the applicant. The customer relationship managers then forward the application and recommendations to the loan-approval departments for consent. The Group monitors borrowers’ repayment ability, the status of collateral and any changes to collateral value. Once a loan becomes overdue, the Group starts the recovery process according to standard personal loan recovery procedures.
To mitigate risks, the Group requests the customers to provide collateral and guarantees where appropriate. A fine management system and operating procedure for collateral have been developed, and there is a guideline to specify the suitability of accepting specific types of collateral. Collateral values, structures and legal covenants are regularly reviewed to ensure that they still serve their intended purposes and conform to market practices.
Credit grading classificationThe Group adopts a loan risk classification approach to manage the loan portfolio risk. Loans are generally classified as normal, special mention, substandard, doubtful and loss according to their level of risk. Substandard, doubtful and loss loans are considered as impaired loans and advances when one or more events demonstrate there is objective evidence of a loss event which triggers impairment. The allowance for impairment loss on impaired loans and advances is collectively or individually assessed as appropriate.
The core definitions of the five categories of loans and advances are set out below:
Normal: Borrowers can honour the terms of their loans. There is no reason to doubt their ability to repay principal and interest in full on a timely basis.
Special mention: Borrowers are able to service their loans currently, although repayment may be adversely affected by specific factors.
Substandard: Borrowers’ abilities to service their loans are apparently in question and they cannot rely entirely on normal business revenues to repay principal and interest. Certain losses may ensue even when collateral or guarantees are invoked.
Doubtful: Borrowers cannot repay principal and interest in full and significant losses will need to be recognised even when collateral or guarantees are invoked.
Loss: Principal and interest of loans cannot be recovered or only a small portion of them can be recovered after taking all possible measures or resorting to all necessary legal procedures.
The Group has also applied the same grading criteria and management approach in classifying the off-balance sheet credit-related operations.
Treasury businessFor risk management purposes, credit risk arising from debt securities and derivatives exposures is managed independently and information thereon is disclosed in notes (1)(h) and (1)(i) below. The Group sets credit limits for treasury activities and monitors them regularly with reference to the fair values of the relevant financial instruments.
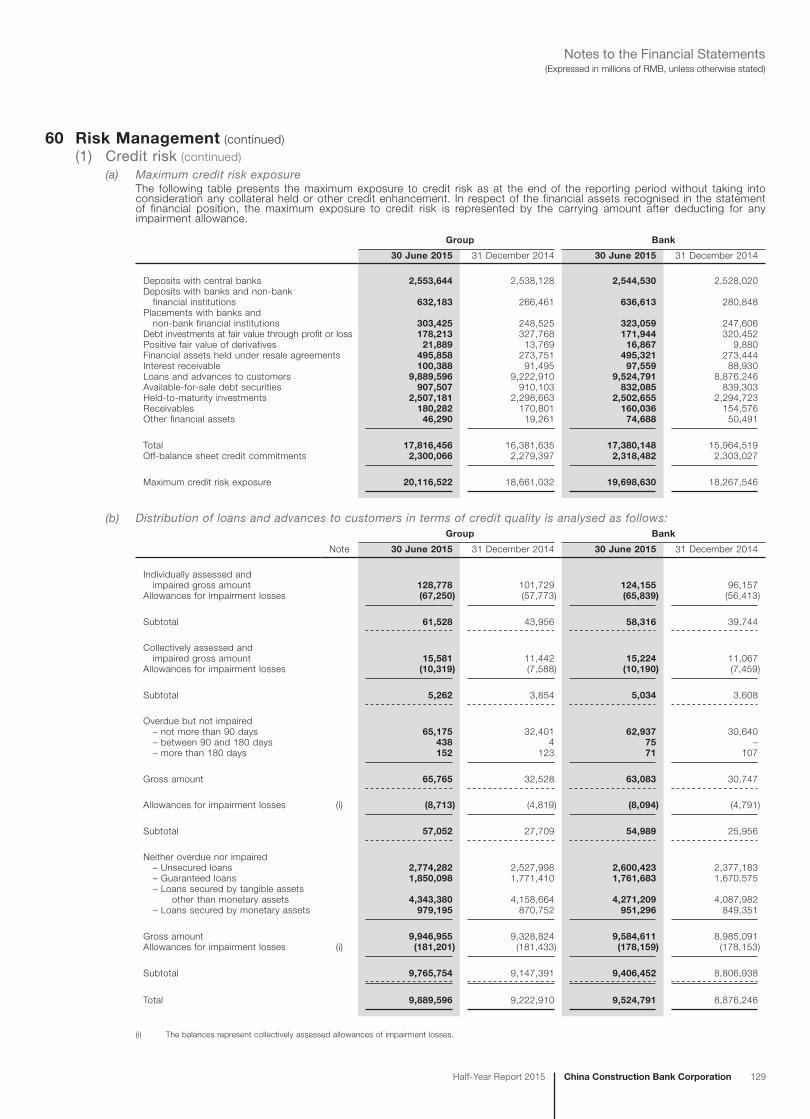
China Construction Bank CorporationHalf-Year Report 2015 129
(Expressed in millions of RMB, unless otherwise stated)Notes to the Financial Statements
60 Risk Management (continued)(1) Credit risk (continued)
(a) Maximum credit risk exposureThe following table presents the maximum exposure to credit risk as at the end of the reporting period without taking into consideration any collateral held or other credit enhancement. In respect of the financial assets recognised in the statement of financial position, the maximum exposure to credit risk is represented by the carrying amount after deducting for any impairment allowance.
Group Bank
30 June 2015 31 December 2014 30 June 2015 31 December 2014
Deposits with central banks 2,553,644 2,538,128 2,544,530 2,528,020Deposits with banks and non-bank financial institutions 632,183 266,461 636,613 280,848Placements with banks and non-bank financial institutions 303,425 248,525 323,059 247,606Debt investments at fair value through profit or loss 178,213 327,768 171,944 320,452Positive fair value of derivatives 21,889 13,769 16,867 9,880Financial assets held under resale agreements 495,858 273,751 495,321 273,444Interest receivable 100,388 91,495 97,559 88,930Loans and advances to customers 9,889,596 9,222,910 9,524,791 8,876,246Available-for-sale debt securities 907,507 910,103 832,085 839,303Held-to-maturity investments 2,507,181 2,298,663 2,502,655 2,294,723Receivables 180,282 170,801 160,036 154,576Other financial assets 46,290 19,261 74,688 50,491
Total 17,816,456 16,381,635 17,380,148 15,964,519Off-balance sheet credit commitments 2,300,066 2,279,397 2,318,482 2,303,027
Maximum credit risk exposure 20,116,522 18,661,032 19,698,630 18,267,546
(b) Distribution of loans and advances to customers in terms of credit quality is analysed as follows:Group Bank
Note 30 June 2015 31 December 2014 30 June 2015 31 December 2014
Individually assessed and impaired gross amount 128,778 101,729 124,155 96,157Allowances for impairment losses (67,250) (57,773) (65,839) (56,413)
Subtotal 61,528 43,956 58,316 39,744
Collectively assessed and impaired gross amount 15,581 11,442 15,224 11,067Allowances for impairment losses (10,319) (7,588) (10,190) (7,459)
Subtotal 5,262 3,854 5,034 3,608
Overdue but not impaired – not more than 90 days 65,175 32,401 62,937 30,640 – between 90 and 180 days 438 4 75 – – more than 180 days 152 123 71 107
Gross amount 65,765 32,528 63,083 30,747
Allowances for impairment losses (i) (8,713) (4,819) (8,094) (4,791)
Subtotal 57,052 27,709 54,989 25,956
Neither overdue nor impaired – Unsecured loans 2,774,282 2,527,998 2,600,423 2,377,183 – Guaranteed loans 1,850,098 1,771,410 1,761,683 1,670,575 – Loans secured by tangible assets other than monetary assets 4,343,380 4,158,664 4,271,209 4,087,982 – Loans secured by monetary assets 979,195 870,752 951,296 849,351
Gross amount 9,946,955 9,328,824 9,584,611 8,985,091Allowances for impairment losses (i) (181,201) (181,433) (178,159) (178,153)
Subtotal 9,765,754 9,147,391 9,406,452 8,806,938
Total 9,889,596 9,222,910 9,524,791 8,876,246
(i) The balances represent collectively assessed allowances of impairment losses.
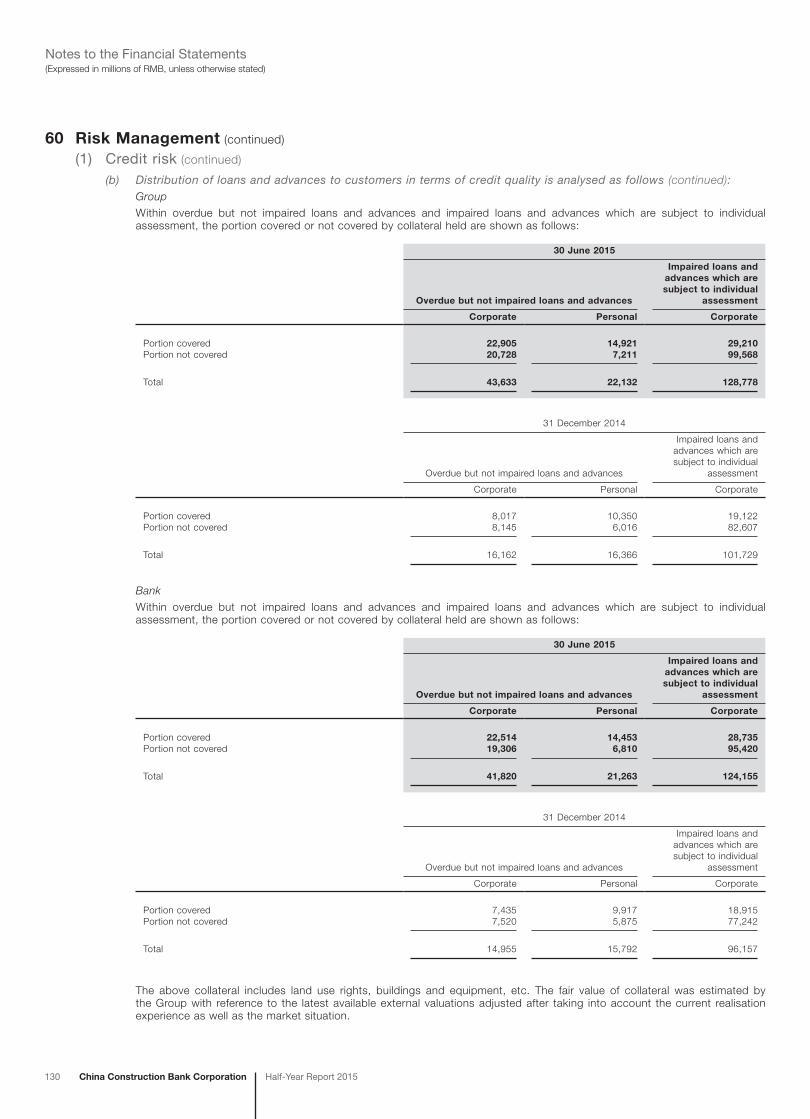
130 China Construction Bank Corporation Half-Year Report 2015
(Expressed in millions of RMB, unless otherwise stated)Notes to the Financial Statements
60 Risk Management (continued)
(1) Credit risk (continued)
(b) Distribution of loans and advances to customers in terms of credit quality is analysed as follows (continued):Group
Within overdue but not impaired loans and advances and impaired loans and advances which are subject to individual assessment, the portion covered or not covered by collateral held are shown as follows:
30 June 2015
Overdue but not impaired loans and advances
Impaired loans and advances which are subject to individual
assessment
Corporate Personal Corporate
Portion covered 22,905 14,921 29,210Portion not covered 20,728 7,211 99,568
Total 43,633 22,132 128,778
31 December 2014
Overdue but not impaired loans and advances
Impaired loans and advances which are subject to individual
assessment
Corporate Personal Corporate
Portion covered 8,017 10,350 19,122Portion not covered 8,145 6,016 82,607
Total 16,162 16,366 101,729
Bank
Within overdue but not impaired loans and advances and impaired loans and advances which are subject to individual assessment, the portion covered or not covered by collateral held are shown as follows:
30 June 2015
Overdue but not impaired loans and advances
Impaired loans and advances which are subject to individual
assessment
Corporate Personal Corporate
Portion covered 22,514 14,453 28,735Portion not covered 19,306 6,810 95,420
Total 41,820 21,263 124,155
31 December 2014
Overdue but not impaired loans and advances
Impaired loans and advances which are subject to individual
assessment
Corporate Personal Corporate
Portion covered 7,435 9,917 18,915Portion not covered 7,520 5,875 77,242
Total 14,955 15,792 96,157
The above collateral includes land use rights, buildings and equipment, etc. The fair value of collateral was estimated by the Group with reference to the latest available external valuations adjusted after taking into account the current realisation experience as well as the market situation.

China Construction Bank CorporationHalf-Year Report 2015 131
(Expressed in millions of RMB, unless otherwise stated)Notes to the Financial Statements
60 Risk Management (continued)
(1) Credit risk (continued)
(c) Loans and advances to customers analysed by economic sector concentrationsGroup
30 June 2015 31 December 2014
Grossloan
balance Percentage
Balance secured by
collateral
Grossloan
balance Percentage
Balancesecured by
collateral
Corporate loans and advances – Manufacturing 1,516,135 14.93% 544,297 1,446,259 15.26% 529,550 – Transportation, storage and postal services 1,191,413 11.73% 457,259 1,105,769 11.67% 412,629 – Production and supply of electric power, heat, gas and water 655,179 6.45% 187,242 636,254 6.72% 185,585 – Leasing and commercial services 651,202 6.41% 296,836 602,041 6.35% 270,183 – Real estate 580,723 5.72% 466,310 575,283 6.07% 472,791 – Wholesale and retail trade 524,037 5.16% 204,426 473,501 5.00% 179,181 – Water, environment and public utility management 343,965 3.39% 184,486 328,023 3.46% 173,852 – Construction 289,749 2.85% 99,019 275,305 2.92% 99,641 – Mining 248,921 2.45% 35,158 244,516 2.58% 34,371 – Agriculture, forestry, farming, fishing 132,583 1.31% 56,921 136,791 1.44% 58,497 – Public management, social securities and social organisation 119,723 1.18% 50,271 126,050 1.33% 55,044 – Education 82,135 0.81% 23,175 79,945 0.84% 22,409 – Others 353,822 3.47% 73,060 307,822 3.25% 70,730
Total corporate loans and advances 6,689,587 65.86% 2,678,460 6,337,559 66.89% 2,564,463Personal loans and advances 3,192,395 31.43% 2,754,360 2,935,762 30.99% 2,538,346Discounted bills 275,097 2.71% – 201,202 2.12% –
Total loans and advances to customers 10,157,079 100.00% 5,432,820 9,474,523 100.00% 5,102,809
Details of impaired loans, impairment allowances, charges, and amounts written off in respect of economic sectors which constitute 10% or more of total gross loans and advances to customers are as follows:
30 June 2015
Grossimpaired
loans
Individuallyassessed
impairmentallowances
Collectivelyassessed
impairmentallowances
Charged toprofit or loss
during the period
Written offduring
the period
Manufacturing 62,698 (33,190) (35,094) 17,271 3,047Transportation, storage and postal services 5,168 (3,355) (25,876) 731 604
31 December 2014
Grossimpaired
loans
Individuallyassessed
impairmentallowances
Collectivelyassessed
impairmentallowances
Charged toprofit or loss
during the year
Written offduring
the year
Manufacturing 49,637 (28,678) (34,351) 22,392 10,537Transportation, storage and postal services 4,962 (3,661) (25,661) 2,632 422

132 China Construction Bank Corporation Half-Year Report 2015
(Expressed in millions of RMB, unless otherwise stated)Notes to the Financial Statements
60 Risk Management (continued)
(1) Credit risk (continued)
(c) Loans and advances to customers analysed by economic sector concentrations (continued)Bank
30 June 2015 31 December 2014
Grossloan
balance Percentage
Balancesecured by
collateral
Grossloan
balance Percentage
Balancesecured by
collateral
Corporate loans and advances – Manufacturing 1,440,564 14.72% 538,902 1,372,900 15.05% 525,535 – Transportation, storage and postal services 1,139,463 11.64% 442,257 1,062,056 11.64% 399,799 – Pr oduction and supply of electric power, heat,
gas and water 641,692 6.56% 185,233 622,392 6.82% 183,757 – Leasing and commercial services 637,593 6.51% 293,401 592,391 6.49% 270,339 – Real estate 535,051 5.47% 438,425 531,945 5.83% 444,658 – Wholesale and retail trade 471,638 4.82% 198,342 423,854 4.65% 173,576 – Wa ter, environment and public utility
management 342,361 3.50% 184,216 327,802 3.59% 173,781 – Construction 282,307 2.88% 98,064 269,183 2.96% 98,708 – Mining 236,007 2.41% 34,833 237,468 2.60% 33,973 – Agriculture, forestry, farming, fishing 127,181 1.30% 56,105 130,627 1.43% 56,996 – Pu blic management, social securities and
social organisation 118,819 1.21% 50,016 124,753 1.37% 54,689 – Education 81,266 0.83% 22,660 79,379 0.87% 22,259 – Others 318,853 3.26% 68,757 260,079 2.85% 65,665
Total corporate loans and advances 6,372,795 65.11% 2,611,211 6,034,829 66.15% 2,503,735Personal loans and advances 3,139,483 32.08% 2,719,142 2,887,433 31.65% 2,504,497Discounted bills 274,795 2.81% – 200,800 2.20% –
Total loans and advances to customers 9,787,073 100.00% 5,330,353 9,123,062 100.00% 5,008,232
Details of impaired loans, impairment allowances, charges, and amounts written off in respect of economic sectors which constitute 10% or more of total gross loans and advances to customers are as follows:
30 June 2015
Grossimpaired
loans
Individuallyassessed
impairmentallowances
Collectivelyassessed
impairmentallowances
Charged toprofit or loss
duringthe period
Written offduring
the period
Manufacturing 61,746 (32,845) (34,331) 16,791 2,761Transportation, storage and postal services 5,002 (3,254) (25,200) 667 604
31 December 2014
Grossimpaired
loans
Individuallyassessed
impairmentallowances
Collectivelyassessed
impairmentallowances
Charged toprofit or loss
during the year
Written off during
the year
Manufacturing 48,497 (28,318) (33,699) 21,719 10,377Transportation, storage and postal services 4,839 (3,562) (25,058) 2,398 399
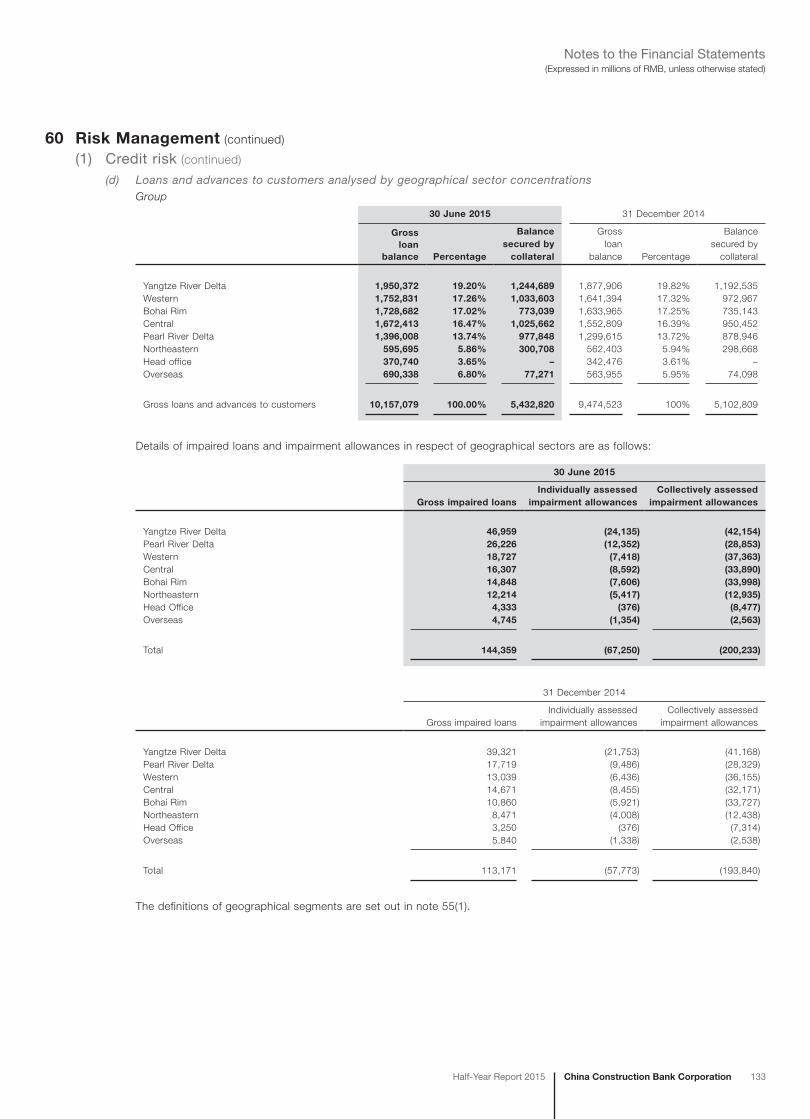
China Construction Bank CorporationHalf-Year Report 2015 133
(Expressed in millions of RMB, unless otherwise stated)Notes to the Financial Statements
60 Risk Management (continued)
(1) Credit risk (continued)
(d) Loans and advances to customers analysed by geographical sector concentrationsGroup
30 June 2015 31 December 2014
Grossloan
balance Percentage
Balancesecured by
collateral
Grossloan
balance Percentage
Balancesecured by
collateral
Yangtze River Delta 1,950,372 19.20% 1,244,689 1,877,906 19.82% 1,192,535Western 1,752,831 17.26% 1,033,603 1,641,394 17.32% 972,967Bohai Rim 1,728,682 17.02% 773,039 1,633,965 17.25% 735,143Central 1,672,413 16.47% 1,025,662 1,552,809 16.39% 950,452Pearl River Delta 1,396,008 13.74% 977,848 1,299,615 13.72% 878,946Northeastern 595,695 5.86% 300,708 562,403 5.94% 298,668Head office 370,740 3.65% – 342,476 3.61% –Overseas 690,338 6.80% 77,271 563,955 5.95% 74,098
Gross loans and advances to customers 10,157,079 100.00% 5,432,820 9,474,523 100% 5,102,809
Details of impaired loans and impairment allowances in respect of geographical sectors are as follows:
30 June 2015
Gross impaired loansIndividually assessed
impairment allowancesCollectively assessed
impairment allowances
Yangtze River Delta 46,959 (24,135) (42,154)Pearl River Delta 26,226 (12,352) (28,853)Western 18,727 (7,418) (37,363)Central 16,307 (8,592) (33,890)Bohai Rim 14,848 (7,606) (33,998)Northeastern 12,214 (5,417) (12,935)Head Office 4,333 (376) (8,477)Overseas 4,745 (1,354) (2,563)
Total 144,359 (67,250) (200,233)
31 December 2014
Gross impaired loansIndividually assessed
impairment allowancesCollectively assessed
impairment allowances
Yangtze River Delta 39,321 (21,753) (41,168)Pearl River Delta 17,719 (9,486) (28,329)Western 13,039 (6,436) (36,155)Central 14,671 (8,455) (32,171)Bohai Rim 10,860 (5,921) (33,727)Northeastern 8,471 (4,008) (12,438)Head Office 3,250 (376) (7,314)Overseas 5,840 (1,338) (2,538)
Total 113,171 (57,773) (193,840)
The definitions of geographical segments are set out in note 55(1).

134 China Construction Bank Corporation Half-Year Report 2015
(Expressed in millions of RMB, unless otherwise stated)Notes to the Financial Statements
60 Risk Management (continued)
(1) Credit risk (continued)
(d) Loans and advances to customers analysed by geographical sector concentrations (continued)Bank
30 June 2015 31 December 2014
Grossloan
balance Percentage
Balancesecured by
collateral
Grossloan
balance Percentage
Balancesecured by
collateral
Yangtze River Delta 1,941,710 19.84% 1,241,215 1,869,069 20.49% 1,188,909Western 1,752,443 17.91% 1,033,499 1,641,041 17.99% 972,863Central 1,671,386 17.08% 1,025,287 1,551,816 17.01% 950,088Bohai Rim 1,619,321 16.55% 732,711 1,547,173 16.96% 700,950Pearl River Delta 1,396,008 14.26% 977,848 1,299,615 14.25% 878,946Northeastern 595,590 6.09% 300,625 562,285 6.16% 298,567Head office 370,740 3.79% – 342,476 3.75% –Overseas 439,875 4.48% 19,168 309,587 3.39% 17,909
Total gross loans and advances to customers 9,787,073 100.00% 5,330,353 9,123,062 100.00% 5,008,232
Details of impaired loans and impairment allowances in respect of geographical sectors are as follows:
30 June 2015
Gross impaired loansIndividually assessed
impairment allowancesCollectively assessed
impairment allowances
Yangtze River Delta 46,712 (24,038) (41,813)Pearl River Delta 26,226 (12,352) (28,853)Western 18,727 (7,418) (37,350)Central 16,299 (8,591) (33,855)Bohai Rim 14,609 (7,478) (32,080)Northeastern 12,213 (5,417) (12,932)Head Office 4,333 (376) (8,477)Overseas 260 (169) (1,083)
Total 139,379 (65,839) (196,443)
31 December 2014
Gross impaired loansIndividually assessed
impairment allowancesCollectively assessed
impairment allowances
Yangtze River Delta 39,090 (21,671) (40,902)Pearl River Delta 17,719 (9,486) (28,329)Western 13,039 (6,436) (36,143)Central 14,661 (8,452) (32,138)Bohai Rim 10,723 (5,815) (32,196)Northeastern 8,471 (4,008) (12,435)Head Office 3,250 (376) (7,314)Overseas 271 (169) (946)
Total 107,224 (56,413) (190,403)
The definitions of geographical segments are set out in note 55(1).

China Construction Bank CorporationHalf-Year Report 2015 135
(Expressed in millions of RMB, unless otherwise stated)Notes to the Financial Statements
60 Risk Management (continued)
(1) Credit risk (continued)
(e) Loans and advances to customers analysed by types of collateralGroup Bank
30 June 2015 31 December 2014 30 June 2015 31 December 2014
Unsecured loans 2,795,410 2,544,820 2,620,806 2,393,294Guaranteed loans 1,928,849 1,826,894 1,835,914 1,721,536Loans secured by tangible assets other than monetary assets 4,443,704 4,223,844 4,369,337 4,152,298Loans secured by monetary assets 989,116 878,965 961,016 855,934
Gross loans and advances to customers 10,157,079 9,474,523 9,787,073 9,123,062
(f) Rescheduled loans and advances to customersGroup
30 June 2015 31 December 2014
Total
Percentage of gross loans and advances to customers Total
Percentage of gross loans and advances to customers
Rescheduled loans and advances to customers 3,856 0.04% 3,073 0.03%Of which: Rescheduled loans and advances overdue for more than 90 days 2,388 0.02% 2,498 0.03%
Bank
30 June 2015 31 December 2014
Total
Percentageof gross loans and advances to customers Total
Percentageof gross loans and advances to customers
Rescheduled loans and advances to customers 1,080 0.01% 339 0.00%Of which: Rescheduled loans and advances overdue for more than 90 days 49 0.00% 32 0.00%
(g) Distribution of amounts due from banks and non-bank financial institutions in terms of credit quality is as follows:Amount due from banks and non-bank financial institutions includes deposits and placements with banks and non-bank financial institutions, and financial assets held under resale agreements of which counterparties are banks and non-bank financial institutions.
Group Bank
30 June 2015 31 December 2014 30 June 2015 31 December 2014
Individually assessed and impaired gross amount 62 55 59 52Allowances for impairment losses (36) (34) (33) (31)
Subtotal 26 21 26 21
Neither overdue nor impaired – grade A to AAA 1,342,630 707,514 1,367,973 703,135 – grade B to BBB 5,293 2,819 4,654 2,555 – unrated 83,517 78,383 82,340 96,187
Subtotal 1,431,440 788,716 1,454,967 801,877
Total 1,431,466 788,737 1,454,993 801,898
Amounts neither overdue nor impaired are analysed above according to the Group and the Bank’s internal credit rating. Unrated amounts due from banks and non-bank financial institutions include amounts due from a number of banks and non-bank financial institutions for which the Group and the Bank have not assigned internal credit ratings.
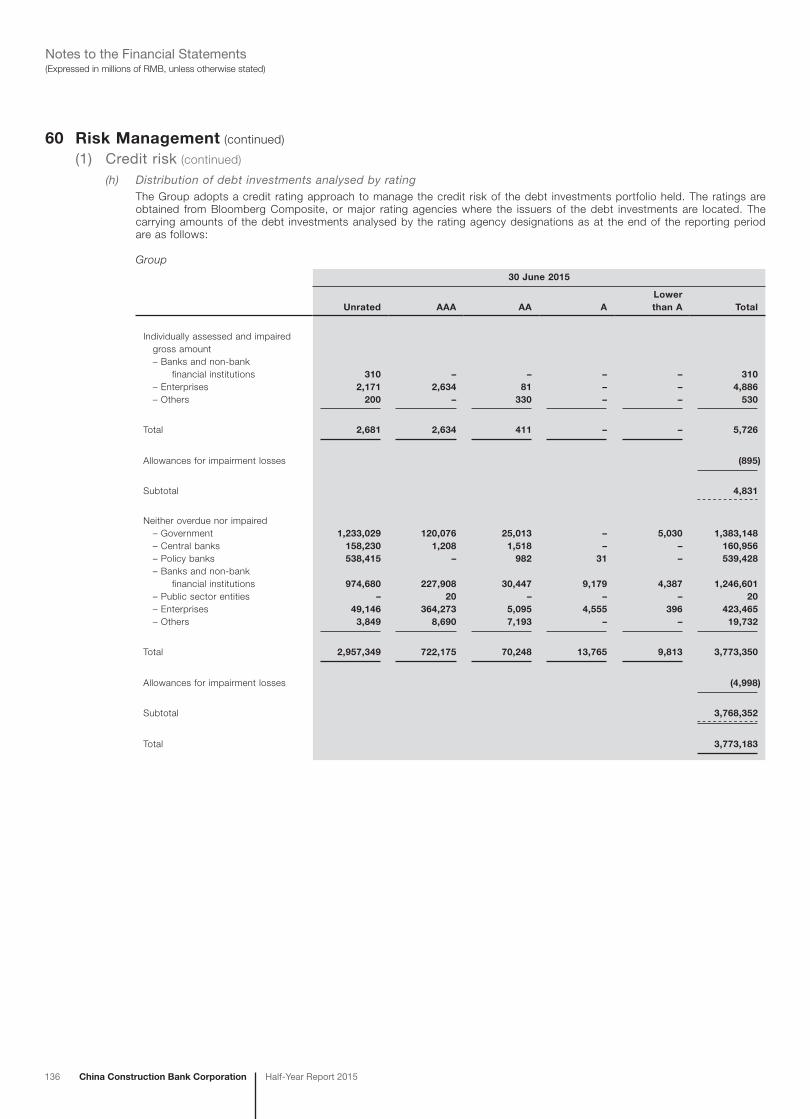
136 China Construction Bank Corporation Half-Year Report 2015
(Expressed in millions of RMB, unless otherwise stated)Notes to the Financial Statements
60 Risk Management (continued)
(1) Credit risk (continued)
(h) Distribution of debt investments analysed by ratingThe Group adopts a credit rating approach to manage the credit risk of the debt investments portfolio held. The ratings are obtained from Bloomberg Composite, or major rating agencies where the issuers of the debt investments are located. The carrying amounts of the debt investments analysed by the rating agency designations as at the end of the reporting period are as follows:
Group
30 June 2015
Unrated AAA AA ALowerthan A Total
Individually assessed and impaired gross amount – Banks and non-bank financial institutions 310 – – – – 310 – Enterprises 2,171 2,634 81 – – 4,886 – Others 200 – 330 – – 530
Total 2,681 2,634 411 – – 5,726
Allowances for impairment losses (895)
Subtotal 4,831
Neither overdue nor impaired – Government 1,233,029 120,076 25,013 – 5,030 1,383,148 – Central banks 158,230 1,208 1,518 – – 160,956 – Policy banks 538,415 – 982 31 – 539,428 – Banks and non-bank financial institutions 974,680 227,908 30,447 9,179 4,387 1,246,601 – Public sector entities – 20 – – – 20 – Enterprises 49,146 364,273 5,095 4,555 396 423,465 – Others 3,849 8,690 7,193 – – 19,732
Total 2,957,349 722,175 70,248 13,765 9,813 3,773,350
Allowances for impairment losses (4,998)
Subtotal 3,768,352
Total 3,773,183
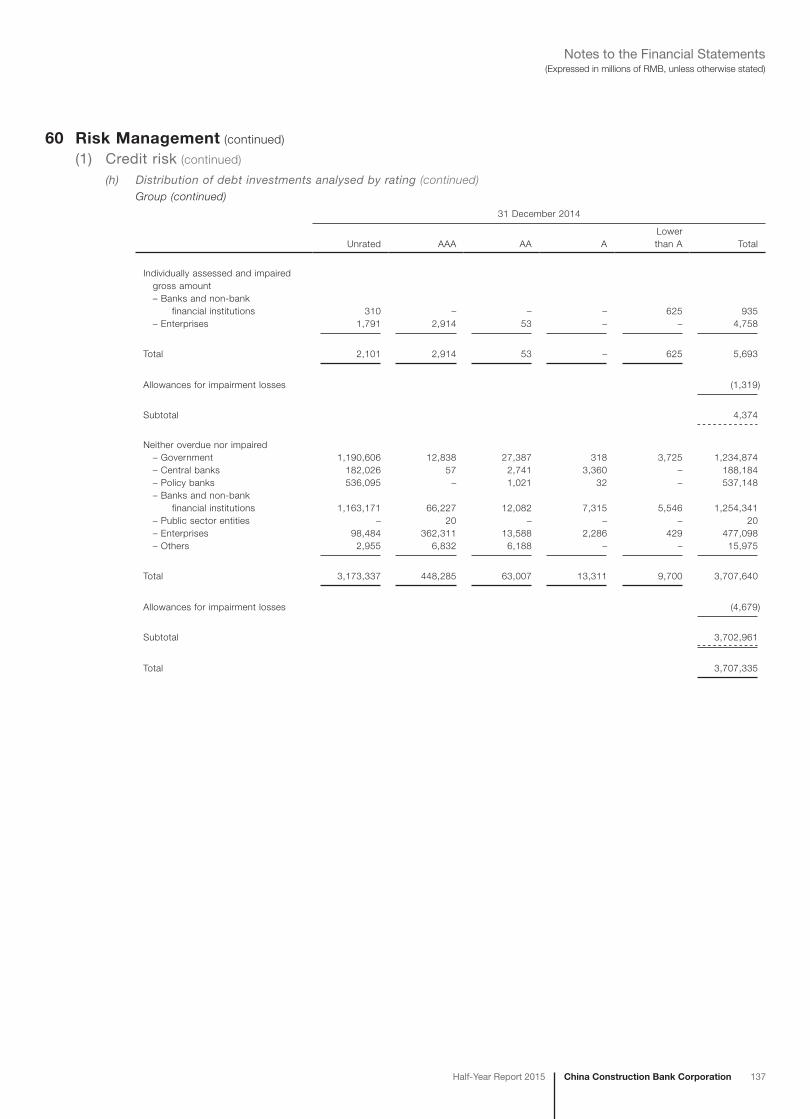
China Construction Bank CorporationHalf-Year Report 2015 137
(Expressed in millions of RMB, unless otherwise stated)Notes to the Financial Statements
60 Risk Management (continued)
(1) Credit risk (continued)
(h) Distribution of debt investments analysed by rating (continued)Group (continued)
31 December 2014
Unrated AAA AA ALowerthan A Total
Individually assessed and impaired gross amount – Banks and non-bank financial institutions 310 – – – 625 935 – Enterprises 1,791 2,914 53 – – 4,758
Total 2,101 2,914 53 – 625 5,693
Allowances for impairment losses (1,319)
Subtotal 4,374
Neither overdue nor impaired – Government 1,190,606 12,838 27,387 318 3,725 1,234,874 – Central banks 182,026 57 2,741 3,360 – 188,184 – Policy banks 536,095 – 1,021 32 – 537,148 – Banks and non-bank financial institutions 1,163,171 66,227 12,082 7,315 5,546 1,254,341 – Public sector entities – 20 – – – 20 – Enterprises 98,484 362,311 13,588 2,286 429 477,098 – Others 2,955 6,832 6,188 – – 15,975
Total 3,173,337 448,285 63,007 13,311 9,700 3,707,640
Allowances for impairment losses (4,679)
Subtotal 3,702,961
Total 3,707,335
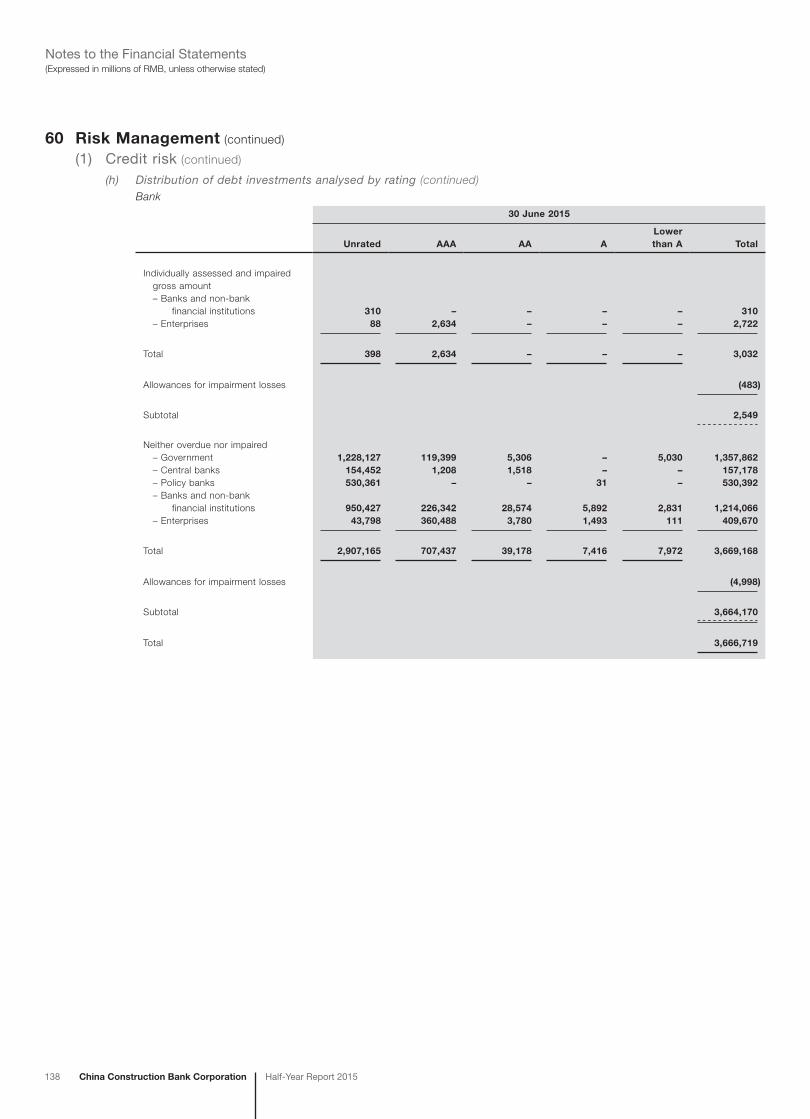
138 China Construction Bank Corporation Half-Year Report 2015
(Expressed in millions of RMB, unless otherwise stated)Notes to the Financial Statements
60 Risk Management (continued)
(1) Credit risk (continued)
(h) Distribution of debt investments analysed by rating (continued)Bank
30 June 2015
Unrated AAA AA ALower than A Total
Individually assessed and impaired gross amount – Banks and non-bank financial institutions 310 – – – – 310 – Enterprises 88 2,634 – – – 2,722
Total 398 2,634 – – – 3,032
Allowances for impairment losses (483)
Subtotal 2,549
Neither overdue nor impaired – Government 1,228,127 119,399 5,306 – 5,030 1,357,862 – Central banks 154,452 1,208 1,518 – – 157,178 – Policy banks 530,361 – – 31 – 530,392 – Banks and non-bank financial institutions 950,427 226,342 28,574 5,892 2,831 1,214,066 – Enterprises 43,798 360,488 3,780 1,493 111 409,670
Total 2,907,165 707,437 39,178 7,416 7,972 3,669,168
Allowances for impairment losses (4,998)
Subtotal 3,664,170
Total 3,666,719
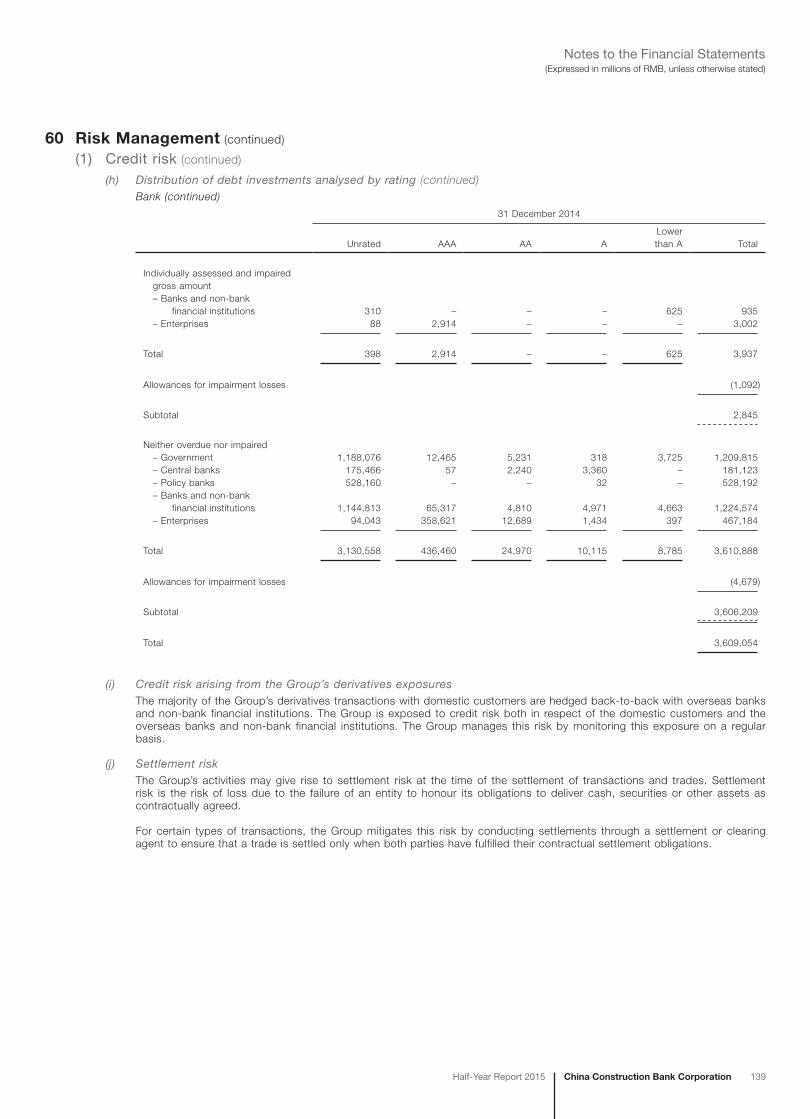
China Construction Bank CorporationHalf-Year Report 2015 139
(Expressed in millions of RMB, unless otherwise stated)Notes to the Financial Statements
60 Risk Management (continued)
(1) Credit risk (continued)
(h) Distribution of debt investments analysed by rating (continued)Bank (continued)
31 December 2014
Unrated AAA AA ALowerthan A Total
Individually assessed and impaired gross amount – Banks and non-bank financial institutions 310 – – – 625 935 – Enterprises 88 2,914 – – – 3,002
Total 398 2,914 – – 625 3,937
Allowances for impairment losses (1,092)
Subtotal 2,845
Neither overdue nor impaired – Government 1,188,076 12,465 5,231 318 3,725 1,209,815 – Central banks 175,466 57 2,240 3,360 – 181,123 – Policy banks 528,160 – – 32 – 528,192 – Banks and non-bank financial institutions 1,144,813 65,317 4,810 4,971 4,663 1,224,574 – Enterprises 94,043 358,621 12,689 1,434 397 467,184
Total 3,130,558 436,460 24,970 10,115 8,785 3,610,888
Allowances for impairment losses (4,679)
Subtotal 3,606,209
Total 3,609,054
(i) Credit risk arising from the Group’s derivatives exposuresThe majority of the Group’s derivatives transactions with domestic customers are hedged back-to-back with overseas banks and non-bank financial institutions. The Group is exposed to credit risk both in respect of the domestic customers and the overseas banks and non-bank financial institutions. The Group manages this risk by monitoring this exposure on a regular basis.
(j) Settlement riskThe Group’s activities may give rise to settlement risk at the time of the settlement of transactions and trades. Settlement risk is the risk of loss due to the failure of an entity to honour its obligations to deliver cash, securities or other assets as contractually agreed.
For certain types of transactions, the Group mitigates this risk by conducting settlements through a settlement or clearing agent to ensure that a trade is settled only when both parties have fulfilled their contractual settlement obligations.

140 China Construction Bank Corporation Half-Year Report 2015
(Expressed in millions of RMB, unless otherwise stated)Notes to the Financial Statements
60 Risk Management (continued)
(2) Market riskMarket risk is the risk of loss, in respect of the Group’s on and off balance sheet activities, arising from adverse movements in market rates including interest rates, foreign exchange rates, commodity prices and stock prices. Market risk arises from both the Group’s trading and non-trading business. A trading book consists of positions in financial instruments and commodities held either with trading intent or in order to hedge other elements of the trading book. Non-trading book records those financial instruments and commodities which are not included in the trading book.
The Group continues to improve market risk management system. The Market Risk Management Department is responsible for leading the establishment of market risk management policies and rules, developing the market risk measurement tools, monitoring and reporting the trading market risk and related daily work. The Asset and Liability Management Department (the “ALM”) is responsible for managing non-trading interest rate risk, exchange rate risk and the size and structure of the assets and liabilities in response to structural market risk. The Financial Market Department manages the Bank’s RMB and foreign currency investment portfolios, conducts proprietary and customer-driven transactions, as well as implementing market risk management policies and rules. The Audit Department is responsible for regularly performing independent audits of the reliability and effectiveness of the processes constituting the risk management system.
The Group’s interest rate risk mainly comprises repricing risk and basis risk arising from mismatch of term structure and pricing basis of assets and liabilities. The Group uses multiple tools such as repricing gap analysis, sensitivity analysis on net interest income, scenario analysis and stress testing, etc. to monitor the interest rate risk periodically.
The Group’s foreign exchange exposure mainly comprises exposures from foreign currency portfolios within treasury proprietary investments in debt securities and money market placements, and currency exposures from its overseas business. The Group manages its foreign exchange exposure by spot foreign exchange transactions and by matching its foreign currency denominated assets with corresponding liabilities in the same currency, and also uses derivatives in the management of its own foreign currency asset and liability portfolios and structural positions.
The Group is also exposed to market risk in respect of its customer driven derivatives portfolio and manages this risk by entering into back-to-back hedging transactions with overseas banks and non-bank financial institutions.
The Group considers that the market risk arising from stock prices in respect of its investment portfolios is minimal.
The Group monitors market risk separately in respect of trading portfolios and non-trading portfolios. Trading portfolios include exchange rate and interest rate derivatives as well as trading securities. The historical simulation model for the Value-at-risk (“VaR”) analysis is a major tool used by the Bank to measure and monitor the market risk of its trading portfolio. Net interest income sensitivity analysis, interest rate repricing gap analysis and foreign exchange risk concentration analysis are the major tools used by the Group to monitor the market risk of its overall businesses.
(a) VaR analysisVaR is a technique which estimates the potential losses that could occur on risk positions taken, due to movements in market interest rates, foreign exchange rates and other market prices over a specified time horizon and at a given level of confidence. The Risk Management Department calculates interest rates, foreign exchange rates and commodity prices VaR for the Bank’s trading portfolio. By reference to historical movements in interest rates, foreign exchange rates and commodity prices, the Risk Management Department calculates VaR on a daily basis for the trading portfolio and monitors it regularly. VaR is calculated at a confidence level of 99% and with a holding period of one day.

China Construction Bank CorporationHalf-Year Report 2015 141
(Expressed in millions of RMB, unless otherwise stated)Notes to the Financial Statements
60 Risk Management (continued)
(2) Market risk (continued)
(a) VaR analysis (continued)A summary of the VaR of the Bank’s trading portfolio as at the end of the reporting period and during the respective periods is as follows:
Six months ended 30 June 2015
30 June Average Maximum Minimum
VaR of trading portfolio 68 76 197 49Of which: – Interest rate risk 48 37 172 17 – Foreign exchange risk (i) 64 62 104 13 – Commodity risk 3 2 9 –
Six months ended 30 June 2014
30 June Average Maximum Minimum
VaR of trading portfolio 47 84 137 47Of which: – Interest rate risk 24 31 115 9 – Foreign exchange risk (i) 39 75 119 38 – Commodity risk – 1 5 –
(i) The VaR in relation to bullion is included in foreign exchange risk above.
VaR for each risk factor is the independently derived largest potential loss in a specific holding period and within a certain confidence level due to fluctuations solely in that risk factor. The individual VaRs did not add up to the total VaR as there was diversification effect due to correlation amongst the risk factors.
Although VaR is an important tool for measuring market risk, the assumptions on which the model is based give rise to some limitations, including the following:
– A 1-day holding period assumes that it is possible to hedge or dispose of positions within that period. This is considered to be a realistic assumption in almost all cases but may not be the case in situations in which there is severe market illiquidity for a prolonged period;
– A 99 percent confidence level does not reflect losses that may occur beyond this level. Within the model used there is 1 percent probability that losses could exceed the VaR;
– VaR is calculated on an end-of-day basis and does not reflect exposures that may arise on positions during the trading day;
– The use of historical data as a basis for determining the possible range of future outcomes may not always cover all possible scenarios, especially those of an exceptional nature; and
– The VaR measure is dependent upon the Bank’s position and the volatility of market prices. The VaR of an unchanged position reduces if the market price volatility declines and vice versa.
(b) Net interest income sensitivity analysisIn monitoring interest rate risk on its overall non-derivative financial assets and liabilities, the Bank regularly measures its future net interest income sensitivity to an increase or decrease in market interest rates (assuming no asymmetrical movement in yield curves and a constant financial position). An incremental 100 basis points parallel fall or rise in all yield curves, other than that applicable to balances with central banks, would increase or decrease annualised net interest income of the Group by RMB54,695 million (as at 31 December 2014: RMB38,702 million). Had the impact of yield curves movement for demand deposits from customers been excluded, the annualised net interest income of the Group would decrease or increase by RMB25,628 million (as at 31 December 2014: RMB30,346 million).
The above interest rate sensitivity is for illustration purpose only and is assessed based on simplified assumptions. The figures here indicate estimated net interest income movements under various predicted yield curve scenarios and are subject to the Bank’s current interest rate exposures. However, the possible risk management measures that can be undertaken by the interest risk management department or related business departments to mitigate interest rate risk have not been taken into account. In practice, the departments that manage the interest rate risk strive to reduce loss arising from the risk while increasing the net income. These figures are estimated on the assumption that the interest rates on various maturities will move within similar ranges, and therefore do not reflect the potential net interest income changes in the event that interest rates on some maturities may change and others remain unchanged. Moreover, the above estimations are based on other simplified assumptions, including that all positions will be held to maturity and rolled over upon maturity.

142 China Construction Bank Corporation Half-Year Report 2015
(Expressed in millions of RMB, unless otherwise stated)Notes to the Financial Statements
60 Risk Management (continued)
(2) Market risk (continued)
(c) Interest rate repricing gap analysisInterest rate risk refers to the risk where the market interest rates, term structure and other factors may experience unfavourable fluctuations which impact the overall profitability and fair value resulting in losses to the Bank. The key determinants of the Group’s interest rate risk arises from the mismatch between the maturity periods of the assets and liabilities, and inconsistent pricing basis, resulting in re-pricing risk and basis risk.
The ALM is responsible for regularly monitoring the interest rate risk positions and measuring the interest rate re-pricing gap. The main reason for measuring the interest rate re-pricing gap is to assist in analysing the impact of interest rate changes on net interest income.
The following tables indicate the average interest rate (“AIR”) for the respective period, and the expected next repricing dates (or maturity dates whichever are earlier) for the assets and liabilities of the Group as at the end of the reporting period.
Group
30 June 2015
Note
Averageinterest
rate (i)
Non-interestbearing
Withinthree
months
Betweenthree
monthsand one
year
Betweenone yearand five
yearsMore thanfive years Total
AssetsCash and deposits with central banks 1.54% 120,514 2,497,267 – – – 2,617,781Deposits and placements with banks and non-bank financial institutions 4.04% – 459,604 471,267 4,737 – 935,608Financial assets held under resale agreements 3.30% – 291,614 204,244 – – 495,858Loans and advances to customers (ii) 5.63% – 2,786,536 6,918,216 113,276 71,568 9,889,596Investments (iii) 4.04% 32,707 461,614 569,242 1,582,658 1,159,669 3,805,890Other assets – 474,453 – – – – 474,453
Total assets 4.56% 627,674 6,496,635 8,162,969 1,700,671 1,231,237 18,219,186
LiabilitiesBorrowings from central banks 3.43% – 24,236 15,863 – – 40,099Deposits and placements from banks and non-bank financial institutions 2.34% – 1,740,129 263,592 43,855 53 2,047,629Financial liabilities at fair value through profit or loss 1.43% 18,251 141,819 45,139 – – 205,209Financial assets sold under repurchase agreements 4.09% – 8,488 7 – – 8,495Deposits from customers 1.96% 49,681 9,159,776 2,887,249 1,593,455 6,816 13,696,977Debt securities issued 4.06% – 99,430 118,417 106,271 102,188 426,306Other liabilities – 482,021 – – – – 482,021
Total liabilities 2.08% 549,953 11,173,878 3,330,267 1,743,581 109,057 16,906,736
Asset-liability gap 2.48% 77,721 (4,677,243) 4,832,702 (42,910) 1,122,180 1,312,450
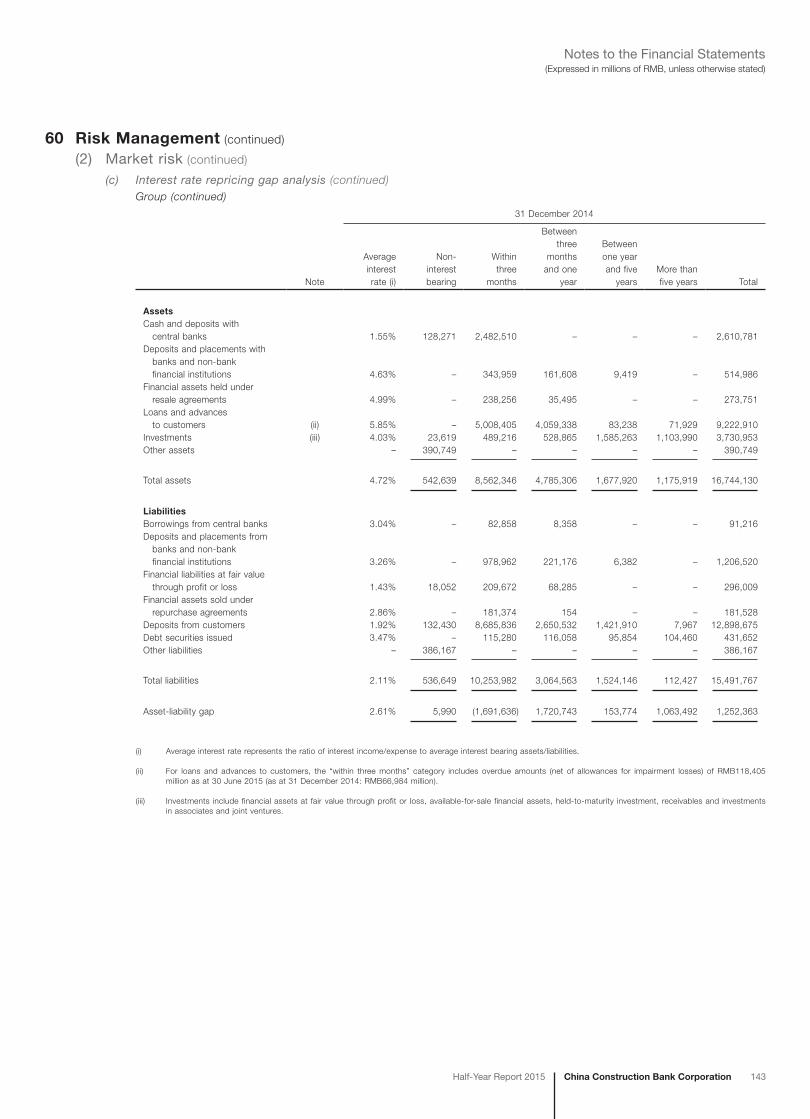
China Construction Bank CorporationHalf-Year Report 2015 143
(Expressed in millions of RMB, unless otherwise stated)Notes to the Financial Statements
60 Risk Management (continued)
(2) Market risk (continued)
(c) Interest rate repricing gap analysis (continued)Group (continued)
31 December 2014
Note
Averageinterestrate (i)
Non-interestbearing
Withinthree
months
Betweenthree
monthsand one
year
Betweenone yearand five
yearsMore thanfive years Total
AssetsCash and deposits with central banks 1.55% 128,271 2,482,510 – – – 2,610,781Deposits and placements with banks and non-bank financial institutions 4.63% – 343,959 161,608 9,419 – 514,986Financial assets held under resale agreements 4.99% – 238,256 35,495 – – 273,751Loans and advances to customers (ii) 5.85% – 5,008,405 4,059,338 83,238 71,929 9,222,910Investments (iii) 4.03% 23,619 489,216 528,865 1,585,263 1,103,990 3,730,953Other assets – 390,749 – – – – 390,749
Total assets 4.72% 542,639 8,562,346 4,785,306 1,677,920 1,175,919 16,744,130
LiabilitiesBorrowings from central banks 3.04% – 82,858 8,358 – – 91,216Deposits and placements from banks and non-bank financial institutions 3.26% – 978,962 221,176 6,382 – 1,206,520Financial liabilities at fair value through profit or loss 1.43% 18,052 209,672 68,285 – – 296,009Financial assets sold under repurchase agreements 2.86% – 181,374 154 – – 181,528Deposits from customers 1.92% 132,430 8,685,836 2,650,532 1,421,910 7,967 12,898,675Debt securities issued 3.47% – 115,280 116,058 95,854 104,460 431,652Other liabilities – 386,167 – – – – 386,167
Total liabilities 2.11% 536,649 10,253,982 3,064,563 1,524,146 112,427 15,491,767
Asset-liability gap 2.61% 5,990 (1,691,636) 1,720,743 153,774 1,063,492 1,252,363
(i) Average interest rate represents the ratio of interest income/expense to average interest bearing assets/liabilities.
(ii) For loans and advances to customers, the “within three months” category includes overdue amounts (net of allowances for impairment losses) of RMB118,405 million as at 30 June 2015 (as at 31 December 2014: RMB66,984 million).
(iii) Investments include financial assets at fair value through profit or loss, available-for-sale financial assets, held-to-maturity investment, receivables and investments in associates and joint ventures.
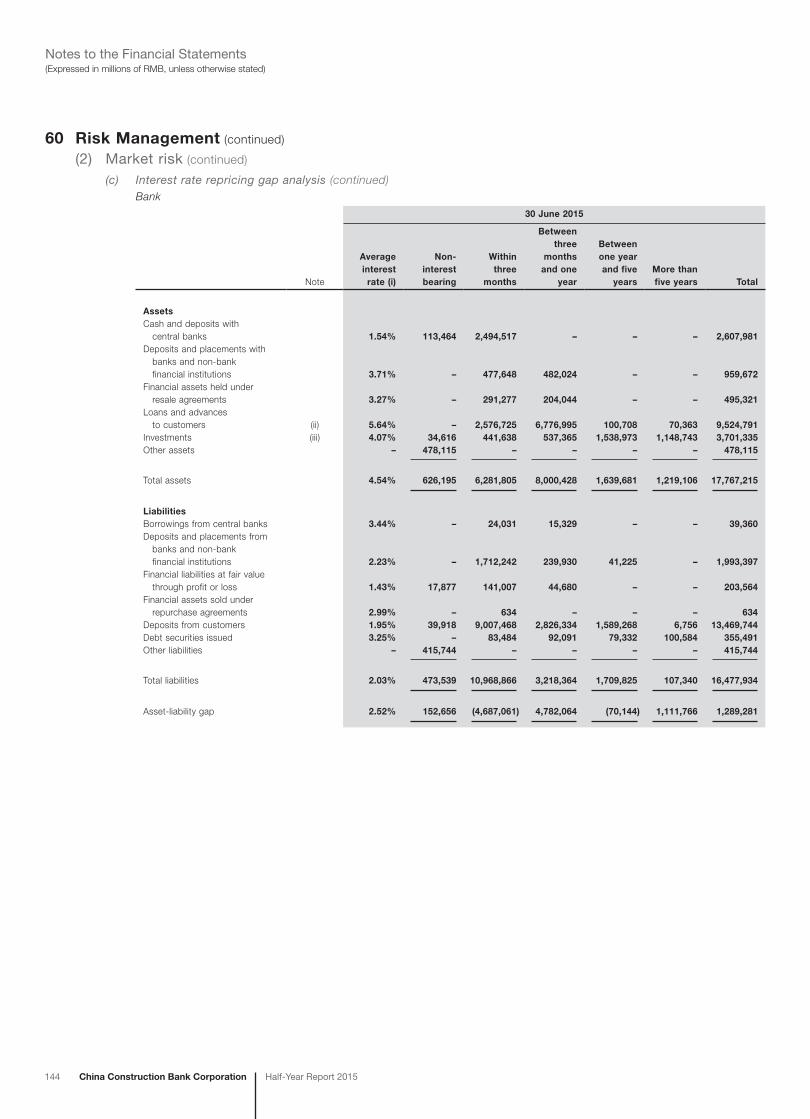
144 China Construction Bank Corporation Half-Year Report 2015
(Expressed in millions of RMB, unless otherwise stated)Notes to the Financial Statements
60 Risk Management (continued)
(2) Market risk (continued)
(c) Interest rate repricing gap analysis (continued)Bank
30 June 2015
Note
Averageinterest
rate (i)
Non-interestbearing
Withinthree
months
Betweenthree
monthsand one
year
Betweenone yearand five
yearsMore thanfive years Total
AssetsCash and deposits with central banks 1.54% 113,464 2,494,517 – – – 2,607,981Deposits and placements with banks and non-bank financial institutions 3.71% – 477,648 482,024 – – 959,672Financial assets held under resale agreements 3.27% – 291,277 204,044 – – 495,321Loans and advances to customers (ii) 5.64% – 2,576,725 6,776,995 100,708 70,363 9,524,791Investments (iii) 4.07% 34,616 441,638 537,365 1,538,973 1,148,743 3,701,335Other assets – 478,115 – – – – 478,115
Total assets 4.54% 626,195 6,281,805 8,000,428 1,639,681 1,219,106 17,767,215
LiabilitiesBorrowings from central banks 3.44% – 24,031 15,329 – – 39,360Deposits and placements from banks and non-bank financial institutions 2.23% – 1,712,242 239,930 41,225 – 1,993,397Financial liabilities at fair value through profit or loss 1.43% 17,877 141,007 44,680 – – 203,564Financial assets sold under repurchase agreements 2.99% – 634 – – – 634Deposits from customers 1.95% 39,918 9,007,468 2,826,334 1,589,268 6,756 13,469,744Debt securities issued 3.25% – 83,484 92,091 79,332 100,584 355,491Other liabilities – 415,744 – – – – 415,744
Total liabilities 2.03% 473,539 10,968,866 3,218,364 1,709,825 107,340 16,477,934
Asset-liability gap 2.52% 152,656 (4,687,061) 4,782,064 (70,144) 1,111,766 1,289,281

China Construction Bank CorporationHalf-Year Report 2015 145
(Expressed in millions of RMB, unless otherwise stated)Notes to the Financial Statements
60 Risk Management (continued)
(2) Market risk (continued)
(c) Interest rate repricing gap analysis (continued)Bank (continued)
31 December 2014
Note
Averageinterestrate (i)
Non-interestbearing
Withinthree
months
Betweenthree
monthsand one
year
Betweenone yearand five
yearsMore thanfive years Total
AssetsCash and deposits with central banks 1.55% 122,153 2,477,875 – – – 2,600,028Deposits and placements with banks and non-bank financial institutions 4.06% – 380,091 143,963 4,400 – 528,454Financial assets held under resale agreements 4.96% – 237,949 35,495 – – 273,444Loans and advances to customers (ii) 5.91% – 4,753,217 3,983,089 70,169 69,771 8,876,246Investments (iii) 4.05% 32,405 463,784 501,083 1,550,392 1,093,795 3,641,459Other assets – 400,152 – – – – 400,152
Total assets 4.72% 554,710 8,312,916 4,663,630 1,624,961 1,163,566 16,319,783
LiabilitiesBorrowings from central banks 3.03% – 82,426 7,983 – – 90,409Deposits and placements from banks and non-bank financial institutions 3.18% – 964,089 191,957 4,852 – 1,160,898Financial liabilities at fair value through profit or loss 1.43% 17,235 207,968 67,439 – – 292,642Financial assets sold under repurchase agreements 3.47% – 177,116 140 – – 177,256Deposits from customers 1.92% 100,287 8,555,196 2,578,874 1,412,224 7,912 12,654,493Debt securities issued 3.20% – 105,105 86,154 75,089 101,156 367,504Other liabilities – 344,345 – – – – 344,345
Total liabilities 2.09% 461,867 10,091,900 2,932,547 1,492,165 109,068 15,087,547
Asset-liability gap 2.64% 92,843 (1,778,984) 1,731,083 132,796 1,054,498 1,232,236
(i) Average interest rate represents the ratio of interest income/expense to average interest bearing assets/liabilities.
(ii) For loans and advances to customers, the “within three months” category includes overdue amounts (net of allowances for impairment losses) of RMB114,805 million as at 30 June 2015 (as at 31 December 2014: RMB63,704 million).
(iii) Investments include financial assets at fair value through profit or loss, available-for-sale financial assets, held-to-maturity investments, receivables and investments in subsidiaries.
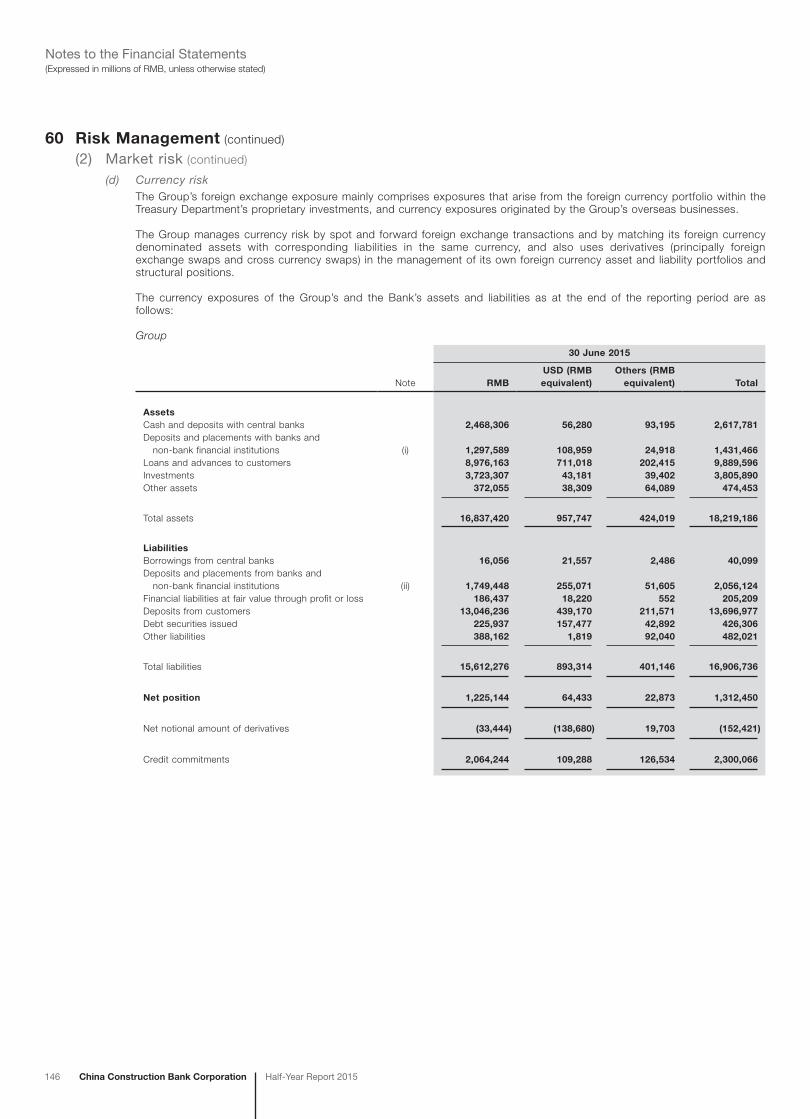
146 China Construction Bank Corporation Half-Year Report 2015
(Expressed in millions of RMB, unless otherwise stated)Notes to the Financial Statements
60 Risk Management (continued)
(2) Market risk (continued)
(d) Currency riskThe Group’s foreign exchange exposure mainly comprises exposures that arise from the foreign currency portfolio within the Treasury Department’s proprietary investments, and currency exposures originated by the Group’s overseas businesses.
The Group manages currency risk by spot and forward foreign exchange transactions and by matching its foreign currency denominated assets with corresponding liabilities in the same currency, and also uses derivatives (principally foreign exchange swaps and cross currency swaps) in the management of its own foreign currency asset and liability portfolios and structural positions.
The currency exposures of the Group’s and the Bank’s assets and liabilities as at the end of the reporting period are as follows:
Group
30 June 2015
Note RMBUSD (RMBequivalent)
Others (RMBequivalent) Total
AssetsCash and deposits with central banks 2,468,306 56,280 93,195 2,617,781Deposits and placements with banks and non-bank financial institutions (i) 1,297,589 108,959 24,918 1,431,466Loans and advances to customers 8,976,163 711,018 202,415 9,889,596Investments 3,723,307 43,181 39,402 3,805,890Other assets 372,055 38,309 64,089 474,453
Total assets 16,837,420 957,747 424,019 18,219,186
LiabilitiesBorrowings from central banks 16,056 21,557 2,486 40,099Deposits and placements from banks and non-bank financial institutions (ii) 1,749,448 255,071 51,605 2,056,124Financial liabilities at fair value through profit or loss 186,437 18,220 552 205,209Deposits from customers 13,046,236 439,170 211,571 13,696,977Debt securities issued 225,937 157,477 42,892 426,306Other liabilities 388,162 1,819 92,040 482,021
Total liabilities 15,612,276 893,314 401,146 16,906,736
Net position 1,225,144 64,433 22,873 1,312,450
Net notional amount of derivatives (33,444) (138,680) 19,703 (152,421)
Credit commitments 2,064,244 109,288 126,534 2,300,066

China Construction Bank CorporationHalf-Year Report 2015 147
(Expressed in millions of RMB, unless otherwise stated)Notes to the Financial Statements
60 Risk Management (continued)
(2) Market risk (continued)
(d) Currency risk (continued)Group (continued)
As at 31 December 2014
Note RMBUSD (RMBequivalent)
Others (RMBequivalent) Total
AssetsCash and deposits with central banks 2,553,937 40,375 16,469 2,610,781Deposits and placements with banks and non-bank financial institutions (i) 670,774 73,065 44,898 788,737Loans and advances to customers 8,471,056 568,883 182,971 9,222,910Investments 3,644,031 35,464 51,458 3,730,953Other assets 314,775 42,649 33,325 390,749
Total assets 15,654,573 760,436 329,121 16,744,130
LiabilitiesBorrowings from central banks 68,982 7,055 15,179 91,216Deposits and placements from banks and non-bank financial institutions (ii) 1,173,773 162,537 51,738 1,388,048Financial liabilities at fair value through profit or loss 270,329 24,316 1,364 296,009Deposits from customers 12,280,266 405,376 213,033 12,898,675Debt securities issued 265,130 122,514 44,008 431,652Other liabilities 356,103 1,129 28,935 386,167
Total liabilities 14,414,583 722,927 354,257 15,491,767
Net position 1,239,990 37,509 (25,136) 1,252,363
Net notional amount of derivatives (21,184) 19,298 50,412 48,526
Credit commitments 2,041,479 144,592 93,326 2,279,397
(i) Including financial assets held under resale agreements.
(ii) Including financial assets sold under repurchase agreements.
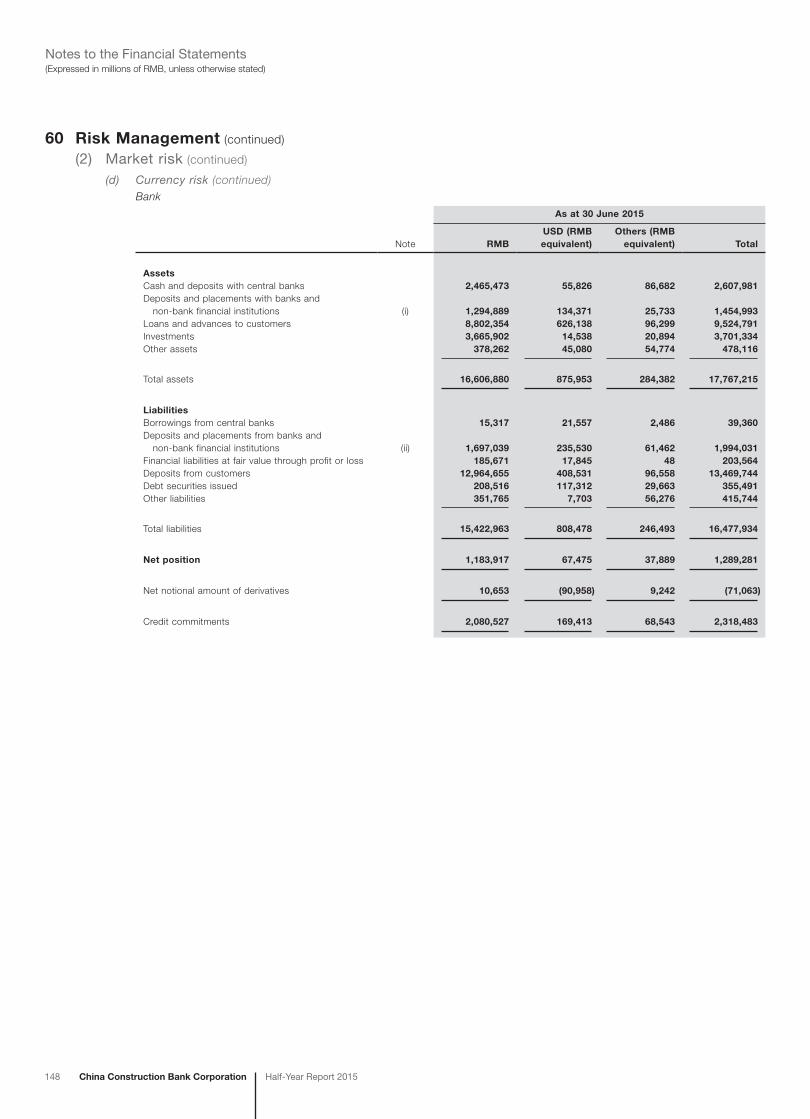
148 China Construction Bank Corporation Half-Year Report 2015
(Expressed in millions of RMB, unless otherwise stated)Notes to the Financial Statements
60 Risk Management (continued)
(2) Market risk (continued)
(d) Currency risk (continued)Bank
As at 30 June 2015
Note RMBUSD (RMBequivalent)
Others (RMBequivalent) Total
AssetsCash and deposits with central banks 2,465,473 55,826 86,682 2,607,981Deposits and placements with banks and non-bank financial institutions (i) 1,294,889 134,371 25,733 1,454,993Loans and advances to customers 8,802,354 626,138 96,299 9,524,791Investments 3,665,902 14,538 20,894 3,701,334Other assets 378,262 45,080 54,774 478,116
Total assets 16,606,880 875,953 284,382 17,767,215
LiabilitiesBorrowings from central banks 15,317 21,557 2,486 39,360Deposits and placements from banks and non-bank financial institutions (ii) 1,697,039 235,530 61,462 1,994,031Financial liabilities at fair value through profit or loss 185,671 17,845 48 203,564Deposits from customers 12,964,655 408,531 96,558 13,469,744Debt securities issued 208,516 117,312 29,663 355,491Other liabilities 351,765 7,703 56,276 415,744
Total liabilities 15,422,963 808,478 246,493 16,477,934
Net position 1,183,917 67,475 37,889 1,289,281
Net notional amount of derivatives 10,653 (90,958) 9,242 (71,063)
Credit commitments 2,080,527 169,413 68,543 2,318,483

China Construction Bank CorporationHalf-Year Report 2015 149
(Expressed in millions of RMB, unless otherwise stated)Notes to the Financial Statements
60 Risk Management (continued)
(2) Market risk (continued)
(d) Currency risk (continued)Bank (continued)
31 December 2014
Note RMBUSD (RMBequivalent)
Others (RMBequivalent) Total
AssetsCash and deposits with central banks 2,549,507 39,978 10,543 2,600,028Deposits and placements with banks and non-bank financial institutions (i) 652,427 104,419 45,052 801,898Loans and advances to customers 8,300,128 493,987 82,131 8,876,246Investments 3,597,518 20,513 23,428 3,641,459Other assets 327,890 53,055 19,207 400,152
Total assets 15,427,470 711,952 180,361 16,319,783
LiabilitiesBorrowings from central banks 68,175 7,055 15,179 90,409Deposits and placements from banks and non-bank financial institutions (ii) 1,137,458 151,614 49,082 1,338,154Financial liabilities at fair value through profit or loss 268,356 24,238 48 292,642Deposits from customers 12,209,331 354,977 90,185 12,654,493Debt securities issued 239,392 91,552 36,560 367,504Other liabilities 319,301 14,497 10,547 344,345
Total liabilities 14,242,013 643,933 201,601 15,087,547
Net position 1,185,457 68,019 (21,240) 1,232,236
Net notional amount of derivatives 11,733 (5,917) 40,391 46,207
Credit commitments 2,071,999 186,445 44,582 2,303,026
(i) Including financial assets held under resale agreements.
(ii) Including financial assets sold under repurchase agreements.
(3) Liquidity riskLiquidity risk is the type of risk that occurs when, despite its debt servicing ability, the Group cannot obtain sufficient funds in time, or obtain sufficient funds at a reasonable cost, to meet the needs of asset growth or repay liabilities when they are due. It is caused by mismatches of assets and liabilities in terms of their amounts and maturity dates. In accordance with liquidity policies, the Group monitors the future cash flows to ensure that an appropriate level of highly liquid assets is maintained.
At the Group level, liquidity is managed and coordinated through the ALM Department. The ALM Department is responsible for formulation of the liquidity policies in accordance with regulatory requirements and prudential principles. Such policies include:
– adopting a prudent strategy and ensuring sufficient funds are available at any moment to satisfy any payment request;
– optimising the Group’s asset and liability structure, diversifying and stabilising the source of funds, and reserving an appropriate proportion of highly credit-rated and liquid asset portfolio; and
– managing and utilising centrally the Bank’s liquid funds.
The Group uses a variety of methods including liquidity index analysis, analysis of remaining contractual maturities and undiscounted cash flow analysis to measure the liquidity risk. Gap analysis is used to predict the cash flow within one year. Various types of scenario analysis are then applied to assess the impact of liquidity risk.

150 China Construction Bank Corporation Half-Year Report 2015
(Expressed in millions of RMB, unless otherwise stated)Notes to the Financial Statements
60 Risk Management (continued)
(3) Liquidity risk (continued)
(a) Maturity analysisThe following tables provide an analysis of the assets and liabilities of the Group and the Bank based on the remaining periods to repayment as at the end of the reporting period:
Group30 June 2015
IndefiniteRepayable
on demandWithin
one month
Betweenone and
threemonths
Betweenthree
months and one year
Betweenone and
five yearsMore thanfive years Total
AssetsCash and deposits with central banks 2,339,408 278,373 – – – – – 2,617,781Deposits and placements with banks and non-bank financial institutions – 49,703 168,974 233,194 472,357 11,151 229 935,608Financial assets held under resale agreements – – 169,192 122,422 204,244 – – 495,858Loans and advances to customers 93,443 423,284 284,900 600,011 2,515,332 2,634,057 3,338,569 9,889,596Investments – Financial assets at fair value through profit or loss 4,638 – 49,200 70,307 46,090 7,513 5,103 182,851 – Available-for-sale financial assets 24,311 – 26,345 39,973 130,252 512,192 198,745 931,818 – Held-to-maturity investments – – 26,899 88,557 309,858 1,184,744 897,123 2,507,181 – Receivables – – 1,089 1,452 15,247 67,647 94,847 180,282 – Investments in associates and joint ventures 3,758 – – – – – – 3,758Other assets 212,643 75,154 28,177 51,709 94,336 11,341 1,093 474,453
Total assets 2,678,201 826,514 754,776 1,207,625 3,787,716 4,428,645 4,535,709 18,219,186
LiabilitiesBorrowings from central banks – – 10,536 13,700 15,863 – – 40,099Deposits and placements from banks and non-bank financial institutions – 1,473,223 159,264 101,425 264,527 46,261 2,929 2,047,629Financial liabilities at fair value through profit or loss – 18,251 63,442 78,377 45,139 – – 205,209Financial assets sold under repurchase agreements – – 8,207 281 7 – – 8,495Deposits from customers – 7,260,826 921,456 1,010,101 2,877,121 1,613,886 13,587 13,696,977Debt securities issued – Certificates of deposit issued – – 47,622 41,352 115,265 10,433 87 214,759 – Bonds issued – – 310 – 7,840 22,140 2,196 32,486 – Subordinated bonds issued – – – – – 64,850 79,926 144,776 – Eligible Tier 2 capital bonds issued – – – – – 14,306 19,979 34,285Other liabilities 519 209,946 94,871 30,934 116,191 28,351 1,209 482,021
Total liabilities 519 8,962,246 1,305,708 1,276,170 3,441,953 1,800,227 119,913 16,906,736
Long/(short) position 2,677,682 (8,135,732) (550,932) (68,545) 345,763 2,628,418 4,415,796 1,312,450
Notional amount of derivatives – Interest rate contracts – – 35,785 114,220 228,351 52,554 2,274 433,184 – Exchange rate contracts – – 583,983 432,106 1,114,113 128,370 5,248 2,263,820 – Other contracts – – 2,318 8,060 46,743 3,077 31 60,229
Total – – 622,086 554,386 1,389,207 184,001 7,553 2,757,233
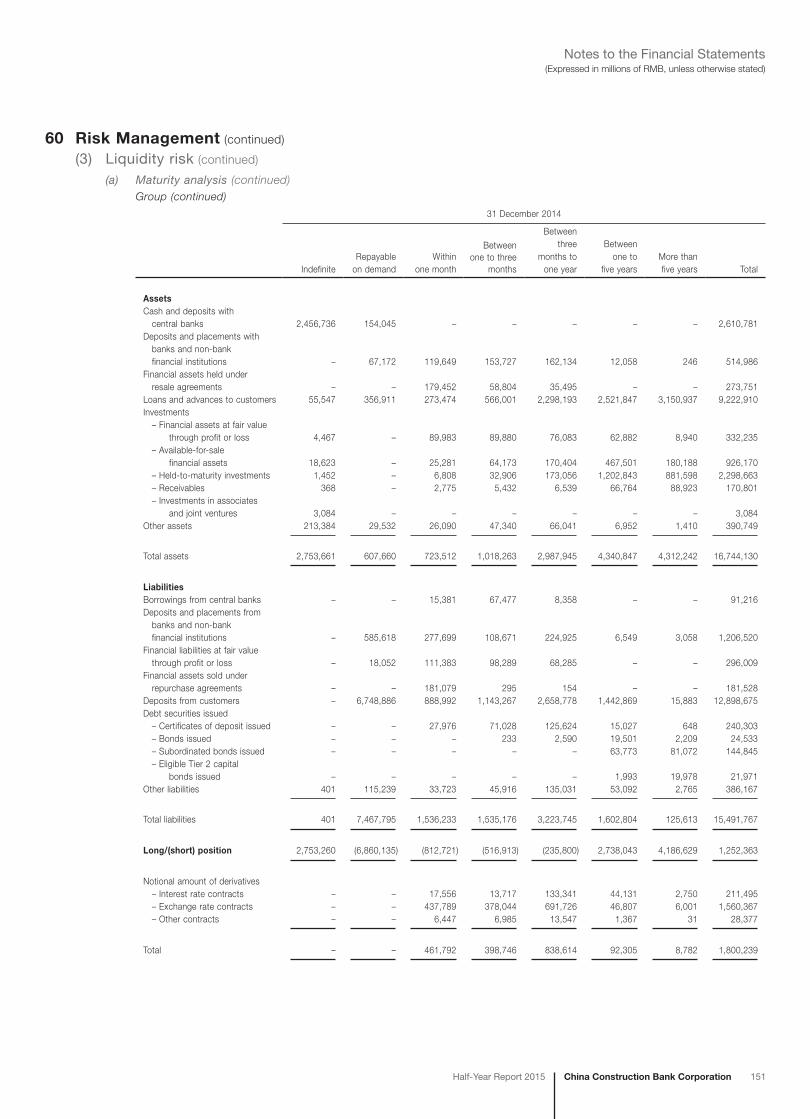
China Construction Bank CorporationHalf-Year Report 2015 151
(Expressed in millions of RMB, unless otherwise stated)Notes to the Financial Statements
60 Risk Management (continued)
(3) Liquidity risk (continued)
(a) Maturity analysis (continued)Group (continued)
31 December 2014
IndefiniteRepayable
on demandWithin
one month
Betweenone to three
months
Betweenthree
months toone year
Betweenone to
five yearsMore thanfive years Total
AssetsCash and deposits with central banks 2,456,736 154,045 – – – – – 2,610,781Deposits and placements with banks and non-bank financial institutions – 67,172 119,649 153,727 162,134 12,058 246 514,986Financial assets held under resale agreements – – 179,452 58,804 35,495 – – 273,751Loans and advances to customers 55,547 356,911 273,474 566,001 2,298,193 2,521,847 3,150,937 9,222,910Investments – Financial assets at fair value through profit or loss 4,467 – 89,983 89,880 76,083 62,882 8,940 332,235 – Available-for-sale financial assets 18,623 – 25,281 64,173 170,404 467,501 180,188 926,170 – Held-to-maturity investments 1,452 – 6,808 32,906 173,056 1,202,843 881,598 2,298,663 – Receivables 368 – 2,775 5,432 6,539 66,764 88,923 170,801 – Investments in associates and joint ventures 3,084 – – – – – – 3,084Other assets 213,384 29,532 26,090 47,340 66,041 6,952 1,410 390,749
Total assets 2,753,661 607,660 723,512 1,018,263 2,987,945 4,340,847 4,312,242 16,744,130
LiabilitiesBorrowings from central banks – – 15,381 67,477 8,358 – – 91,216Deposits and placements from banks and non-bank financial institutions – 585,618 277,699 108,671 224,925 6,549 3,058 1,206,520Financial liabilities at fair value through profit or loss – 18,052 111,383 98,289 68,285 – – 296,009Financial assets sold under repurchase agreements – – 181,079 295 154 – – 181,528Deposits from customers – 6,748,886 888,992 1,143,267 2,658,778 1,442,869 15,883 12,898,675Debt securities issued – Certificates of deposit issued – – 27,976 71,028 125,624 15,027 648 240,303 – Bonds issued – – – 233 2,590 19,501 2,209 24,533 – Subordinated bonds issued – – – – – 63,773 81,072 144,845 – Eligible Tier 2 capital bonds issued – – – – – 1,993 19,978 21,971Other liabilities 401 115,239 33,723 45,916 135,031 53,092 2,765 386,167
Total liabilities 401 7,467,795 1,536,233 1,535,176 3,223,745 1,602,804 125,613 15,491,767
Long/(short) position 2,753,260 (6,860,135) (812,721) (516,913) (235,800) 2,738,043 4,186,629 1,252,363
Notional amount of derivatives – Interest rate contracts – – 17,556 13,717 133,341 44,131 2,750 211,495 – Exchange rate contracts – – 437,789 378,044 691,726 46,807 6,001 1,560,367 – Other contracts – – 6,447 6,985 13,547 1,367 31 28,377
Total – – 461,792 398,746 838,614 92,305 8,782 1,800,239
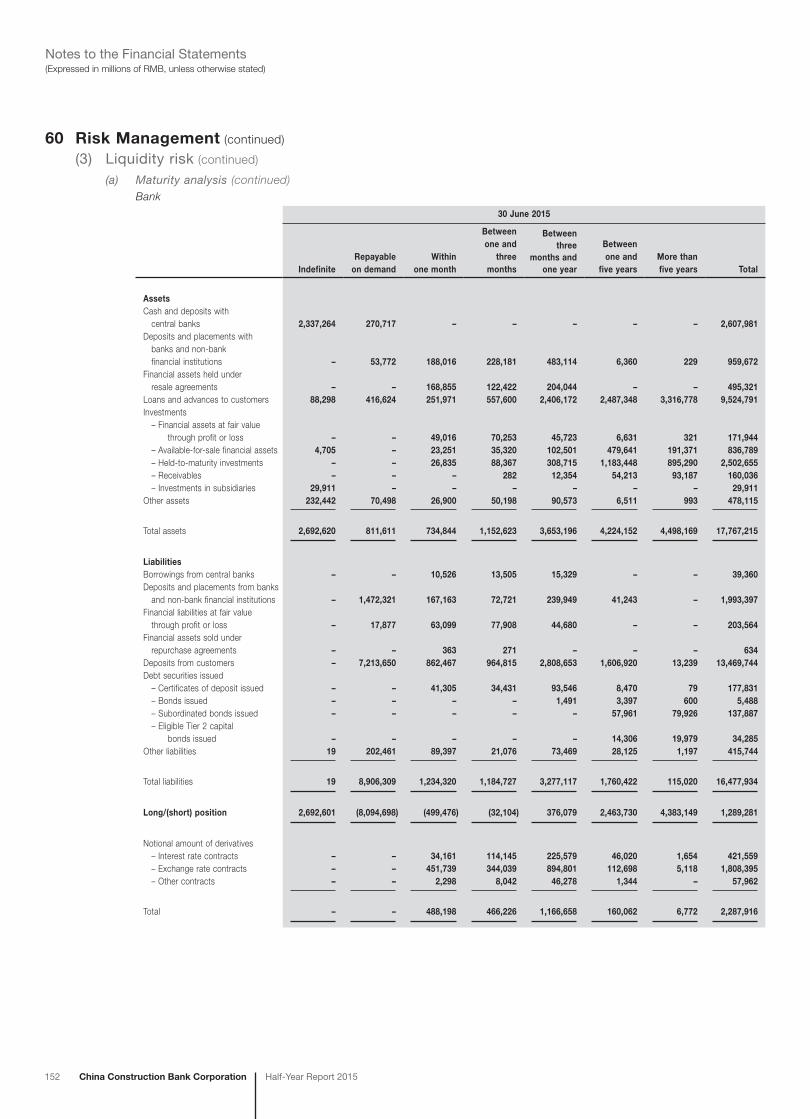
152 China Construction Bank Corporation Half-Year Report 2015
(Expressed in millions of RMB, unless otherwise stated)Notes to the Financial Statements
60 Risk Management (continued)
(3) Liquidity risk (continued)
(a) Maturity analysis (continued)Bank
30 June 2015
IndefiniteRepayable
on demandWithin
one month
Betweenone and
threemonths
Betweenthree
months and one year
Betweenone and
five yearsMore thanfive years Total
AssetsCash and deposits with central banks 2,337,264 270,717 – – – – – 2,607,981Deposits and placements with banks and non-bank financial institutions – 53,772 188,016 228,181 483,114 6,360 229 959,672Financial assets held under resale agreements – – 168,855 122,422 204,044 – – 495,321Loans and advances to customers 88,298 416,624 251,971 557,600 2,406,172 2,487,348 3,316,778 9,524,791Investments – Financial assets at fair value through profit or loss – – 49,016 70,253 45,723 6,631 321 171,944 – Available-for-sale financial assets 4,705 – 23,251 35,320 102,501 479,641 191,371 836,789 – Held-to-maturity investments – – 26,835 88,367 308,715 1,183,448 895,290 2,502,655 – Receivables – – – 282 12,354 54,213 93,187 160,036 – Investments in subsidiaries 29,911 – – – – – – 29,911Other assets 232,442 70,498 26,900 50,198 90,573 6,511 993 478,115
Total assets 2,692,620 811,611 734,844 1,152,623 3,653,196 4,224,152 4,498,169 17,767,215
LiabilitiesBorrowings from central banks – – 10,526 13,505 15,329 – – 39,360Deposits and placements from banks and non-bank financial institutions – 1,472,321 167,163 72,721 239,949 41,243 – 1,993,397Financial liabilities at fair value through profit or loss – 17,877 63,099 77,908 44,680 – – 203,564Financial assets sold under repurchase agreements – – 363 271 – – – 634Deposits from customers – 7,213,650 862,467 964,815 2,808,653 1,606,920 13,239 13,469,744Debt securities issued – Certificates of deposit issued – – 41,305 34,431 93,546 8,470 79 177,831 – Bonds issued – – – – 1,491 3,397 600 5,488 – Subordinated bonds issued – – – – – 57,961 79,926 137,887 – Eligible Tier 2 capital bonds issued – – – – – 14,306 19,979 34,285Other liabilities 19 202,461 89,397 21,076 73,469 28,125 1,197 415,744
Total liabilities 19 8,906,309 1,234,320 1,184,727 3,277,117 1,760,422 115,020 16,477,934
Long/(short) position 2,692,601 (8,094,698) (499,476) (32,104) 376,079 2,463,730 4,383,149 1,289,281
Notional amount of derivatives – Interest rate contracts – – 34,161 114,145 225,579 46,020 1,654 421,559 – Exchange rate contracts – – 451,739 344,039 894,801 112,698 5,118 1,808,395 – Other contracts – – 2,298 8,042 46,278 1,344 – 57,962
Total – – 488,198 466,226 1,166,658 160,062 6,772 2,287,916

China Construction Bank CorporationHalf-Year Report 2015 153
(Expressed in millions of RMB, unless otherwise stated)Notes to the Financial Statements
60 Risk Management (continued)
(3) Liquidity risk (continued)
(a) Maturity analysis (continued)Bank (continued)
31 December 2014
IndefiniteRepayable
on demandWithin
one month
Betweenone and three
months
Betweenthree
months and one year
Betweenone and
five yearsMore thanfive years Total
AssetsCash and deposits with central banks 2,453,866 146,162 – – – – – 2,600,028Deposits and placements with banks and non-bank financial institutions – 81,064 129,070 159,440 151,604 7,030 246 528,454Financial assets held under resale agreements – – 179,145 58,804 35,495 – – 273,444Loans and advances to customers 52,150 352,186 242,407 505,451 2,193,056 2,399,377 3,131,619 8,876,246Investments – Financial assets at fair value through profit or loss – – 89,739 89,850 75,492 61,869 3,502 320,452 – Available-for-sale financial assets 8,089 – 19,193 57,875 145,283 440,514 173,960 844,914 – Held-to-maturity investments – – 6,808 32,906 172,893 1,202,428 879,688 2,294,723 – Receivables 368 – 1,478 4,660 4,669 57,121 86,280 154,576 – Investments in subsidiaries 26,794 – – – – – – 26,794Other assets 234,772 26,362 24,951 45,858 63,508 3,690 1,011 400,152
Total assets 2,776,039 605,774 692,791 954,844 2,842,000 4,172,029 4,276,306 16,319,783
LiabilitiesBorrowings from central banks – – 15,321 67,105 7,983 – – 90,409Deposits and placements from banks and non-bank financial institutions – 589,145 280,045 97,574 190,481 3,653 – 1,160,898Financial liabilities at fair value through profit or loss – 17,235 110,889 97,079 67,439 – – 292,642Financial assets sold under repurchase agreements – – 176,840 276 140 – – 177,256Deposits from customers – 6,716,706 834,896 1,068,206 2,586,501 1,432,356 15,828 12,654,493Debt securities issued – Certificates of deposit issued – – 26,144 67,393 93,650 13,821 648 201,656 – Bonds issued – – – – 499 4,892 608 5,999 – Subordinated bonds issued – – – – – 57,956 79,922 137,878 – Eligible Tier 2 capital bonds issued – – – – – 1,993 19,978 21,971Other liabilities 43 116,666 29,664 38,420 104,146 52,674 2,732 344,345
Total liabilities 43 7,439,752 1,473,799 1,436,053 3,050,839 1,567,345 119,716 15,087,547
Long/(short) position 2,775,996 (6,833,978) (781,008) (481,209) (208,839) 2,604,684 4,156,590 1,232,236
Notional amount of derivatives – Interest rate contracts – – 17,121 13,704 131,685 42,132 2,750 207,392 – Exchange rate contracts – – 355,381 291,997 562,810 37,253 5,372 1,252,813 – Other contracts – – 6,347 6,912 13,088 – – 26,347
Total – – 378,849 312,613 707,583 79,385 8,122 1,486,552
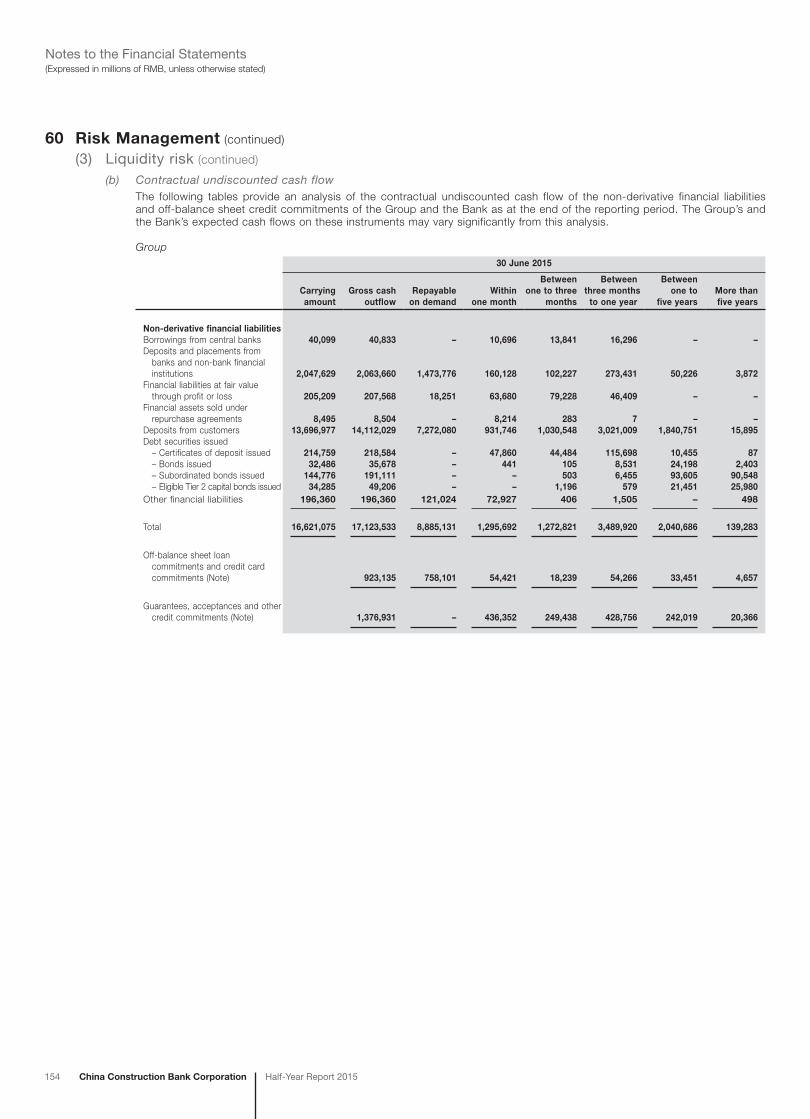
154 China Construction Bank Corporation Half-Year Report 2015
(Expressed in millions of RMB, unless otherwise stated)Notes to the Financial Statements
60 Risk Management (continued)
(3) Liquidity risk (continued)
(b) Contractual undiscounted cash flowThe following tables provide an analysis of the contractual undiscounted cash flow of the non-derivative financial liabilities and off-balance sheet credit commitments of the Group and the Bank as at the end of the reporting period. The Group’s and the Bank’s expected cash flows on these instruments may vary significantly from this analysis.
Group30 June 2015
Carryingamount
Gross cashoutflow
Repayableon demand
Withinone month
Betweenone to three
months
Betweenthree months
to one year
Betweenone to
five yearsMore thanfive years
Non-derivative financial liabilitiesBorrowings from central banks 40,099 40,833 – 10,696 13,841 16,296 – –Deposits and placements from banks and non-bank financial institutions 2,047,629 2,063,660 1,473,776 160,128 102,227 273,431 50,226 3,872Financial liabilities at fair value through profit or loss 205,209 207,568 18,251 63,680 79,228 46,409 – –Financial assets sold under repurchase agreements 8,495 8,504 – 8,214 283 7 – –Deposits from customers 13,696,977 14,112,029 7,272,080 931,746 1,030,548 3,021,009 1,840,751 15,895Debt securities issued – Certificates of deposit issued 214,759 218,584 – 47,860 44,484 115,698 10,455 87 – Bonds issued 32,486 35,678 – 441 105 8,531 24,198 2,403 – Subordinated bonds issued 144,776 191,111 – – 503 6,455 93,605 90,548 – Eligible Tier 2 capital bonds issued 34,285 49,206 – – 1,196 579 21,451 25,980Other financial liabilities 196,360 196,360 121,024 72,927 406 1,505 – 498
Total 16,621,075 17,123,533 8,885,131 1,295,692 1,272,821 3,489,920 2,040,686 139,283
Off-balance sheet loan commitments and credit card commitments (Note) 923,135 758,101 54,421 18,239 54,266 33,451 4,657
Guarantees, acceptances and other credit commitments (Note) 1,376,931 – 436,352 249,438 428,756 242,019 20,366

China Construction Bank CorporationHalf-Year Report 2015 155
(Expressed in millions of RMB, unless otherwise stated)Notes to the Financial Statements
60 Risk Management (continued)
(3) Liquidity risk (continued)
(b) Contractual undiscounted cash flow (continued)Group (continued)
31 December 2014
Carryingamount
Gross cashoutflow
Repayableon demand
Withinone month
Betweenone to three
months
Betweenthree months
to one year
Betweenone to
five yearsMore thanfive years
Non-derivative financial liabilitiesBorrowings from central banks 91,216 92,293 – 15,633 68,081 8,579 – –Deposits and placements from banks and non-bank financial institutions 1,206,520 1,218,693 586,146 278,566 110,485 232,376 7,262 3,858Financial liabilities at fair value through profit or loss 296,009 300,029 18,052 112,230 99,577 70,170 – –Financial assets sold under repurchase agreements 181,528 181,633 – 181,179 298 156 – –Deposits from customers 12,898,675 13,264,096 6,750,324 904,117 1,176,840 2,763,233 1,651,486 18,096Debt securities issued – Certificates of deposit issued 240,303 242,299 – 28,076 71,278 126,859 15,486 600 – Bonds issued 24,533 27,094 – 64 339 3,157 21,089 2,445 – Subordinated bonds issued 144,845 192,199 – – 1,219 5,739 91,547 93,694 – Eligible Tier 2 capital bonds issued 21,971 34,450 – – – 1,294 7,176 25,980Other financial liabilities 98,912 98,912 96,218 507 320 1,368 – 499
Total 15,204,512 15,651,698 7,450,740 1,520,372 1,528,437 3,212,931 1,794,046 145,172
Off-balance sheet loan commitments and credit card commitments (Note) 926,816 723,996 63,991 31,610 64,423 41,102 1,694
Guarantees, acceptances and other credit commitments (Note) 1,352,581 – 363,442 243,751 447,179 267,126 31,083
Bank30 June 2015
Carryingamount
Gross cashoutflow
Repayableon demand
Withinone month
Betweenone to three
months
Betweenthree months
to one year
Betweenone to
five yearsMore thanfive years
Non-derivative financial liabilitiesBorrowings from central banks 39,360 40,075 – 10,686 13,641 15,748 – –Deposits and placements from banks and non-bank financial institutions 1,993,397 2,007,035 1,472,870 167,975 73,136 248,284 44,770 –Financial liabilities at fair value through profit or loss 203,564 205,919 17,877 63,334 78,764 45,944 – –Financial assets sold under repurchase agreements 634 638 – 365 273 – – –Deposits from customers 13,469,744 13,883,548 7,224,900 872,691 985,073 2,951,629 1,833,709 15,546Debt securities issued – Certificates of deposit issued 177,831 180,666 – 41,474 36,488 93,949 8,668 87 – Bonds issued 5,488 5,959 – – 37 1,643 3,644 635 – Subordinated bonds issued 137,887 181,228 – – 404 6,356 83,920 90,548 – Eligible Tier 2 capital bonds issued 34,285 49,206 – – 1,196 579 21,451 25,980Other financial liabilities 136,800 136,800 61,654 72,914 337 1,397 – 498
Total 16,198,990 16,691,074 8,777,301 1,229,439 1,189,349 3,365,529 1,996,162 133,294
Off-balance sheet loan commitments and credit card commitments (Note) 872,747 758,101 12,449 17,197 53,412 28,868 2,720
Guarantees, acceptances and other credit commitments (Note) 1,445,735 – 445,456 260,383 467,550 252,064 20,282
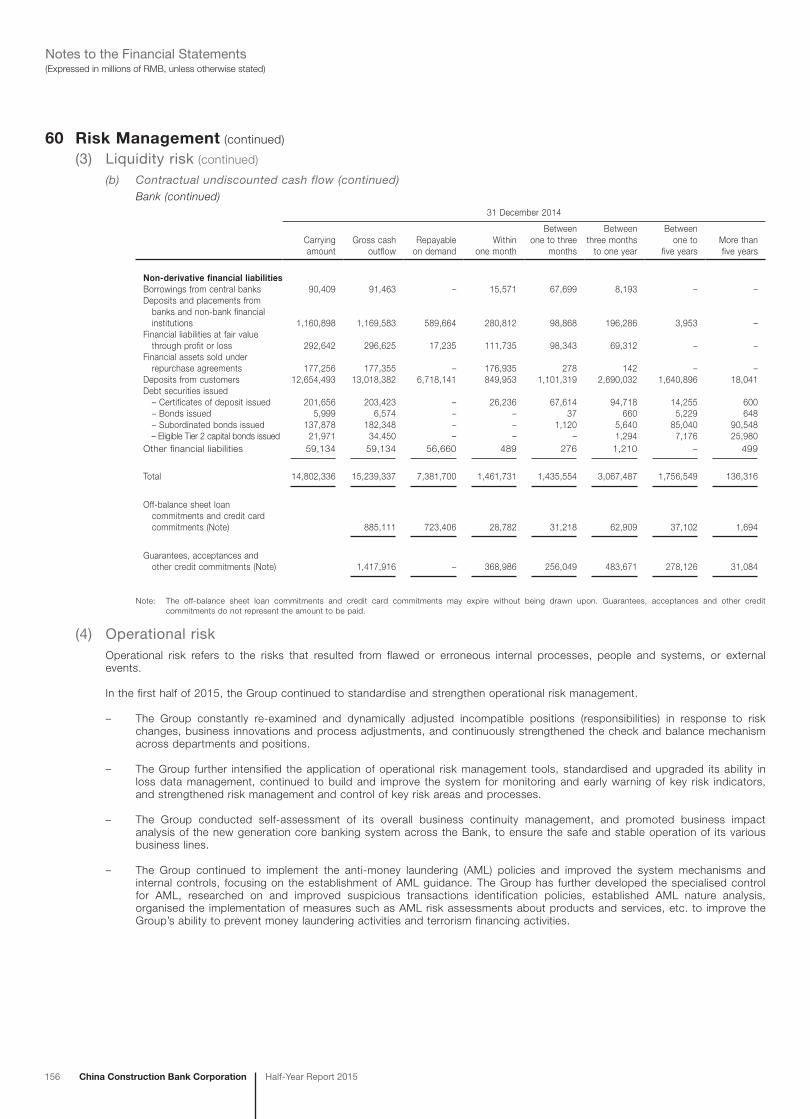
156 China Construction Bank Corporation Half-Year Report 2015
(Expressed in millions of RMB, unless otherwise stated)Notes to the Financial Statements
60 Risk Management (continued)
(3) Liquidity risk (continued)
(b) Contractual undiscounted cash flow (continued)Bank (continued)
31 December 2014
Carryingamount
Gross cashoutflow
Repayableon demand
Withinone month
Betweenone to three
months
Betweenthree months
to one year
Betweenone to
five yearsMore thanfive years
Non-derivative financial liabilitiesBorrowings from central banks 90,409 91,463 – 15,571 67,699 8,193 – –Deposits and placements from banks and non-bank financial institutions 1,160,898 1,169,583 589,664 280,812 98,868 196,286 3,953 –Financial liabilities at fair value through profit or loss 292,642 296,625 17,235 111,735 98,343 69,312 – –Financial assets sold under repurchase agreements 177,256 177,355 – 176,935 278 142 – –Deposits from customers 12,654,493 13,018,382 6,718,141 849,953 1,101,319 2,690,032 1,640,896 18,041Debt securities issued – Certificates of deposit issued 201,656 203,423 – 26,236 67,614 94,718 14,255 600 – Bonds issued 5,999 6,574 – – 37 660 5,229 648 – Subordinated bonds issued 137,878 182,348 – – 1,120 5,640 85,040 90,548 – Eligible Tier 2 capital bonds issued 21,971 34,450 – – – 1,294 7,176 25,980Other financial liabilities 59,134 59,134 56,660 489 276 1,210 – 499
Total 14,802,336 15,239,337 7,381,700 1,461,731 1,435,554 3,067,487 1,756,549 136,316
Off-balance sheet loan commitments and credit card commitments (Note) 885,111 723,406 28,782 31,218 62,909 37,102 1,694
Guarantees, acceptances and other credit commitments (Note) 1,417,916 – 368,986 256,049 483,671 278,126 31,084
Note: The off-balance sheet loan commitments and credit card commitments may expire without being drawn upon. Guarantees, acceptances and other credit commitments do not represent the amount to be paid.
(4) Operational riskOperational risk refers to the risks that resulted from flawed or erroneous internal processes, people and systems, or external events.
In the first half of 2015, the Group continued to standardise and strengthen operational risk management.
– The Group constantly re-examined and dynamically adjusted incompatible positions (responsibilities) in response to risk changes, business innovations and process adjustments, and continuously strengthened the check and balance mechanism across departments and positions.
– The Group further intensified the application of operational risk management tools, standardised and upgraded its ability in loss data management, continued to build and improve the system for monitoring and early warning of key risk indicators, and strengthened risk management and control of key risk areas and processes.
– The Group conducted self-assessment of its overall business continuity management, and promoted business impact analysis of the new generation core banking system across the Bank, to ensure the safe and stable operation of its various business lines.
– The Group continued to implement the anti-money laundering (AML) policies and improved the system mechanisms and internal controls, focusing on the establishment of AML guidance. The Group has further developed the specialised control for AML, researched on and improved suspicious transactions identification policies, established AML nature analysis, organised the implementation of measures such as AML risk assessments about products and services, etc. to improve the Group’s ability to prevent money laundering activities and terrorism financing activities.
China Construction Bank CorporationHalf-Year Report 2015 157
(Expressed in millions of RMB, unless otherwise stated)Notes to the Financial Statements
60 Risk Management (continued)
(5) Fair value of financial instruments(a) Valuation technique, input and process
The Board is responsible for establishing a robust internal control policy of valuation, and takes the ultimate responsibility for the adequacy and effectiveness of internal control system. The Board of Supervisors is in charge of supervising the performance of the Board and Senior Management. According to the requirements of the Board and the Board of Supervisors, Senior Management’s responsibility is to organise and implement the internal control system over the valuation process to ensure the effectiveness of the internal control system of valuation.
The Group has established an independent valuation process for financial assets and financial liabilities. The relevant departments are responsible for performing valuation, verifying valuation model and accounting for valuation results.
For the six months ended 30 June 2015, there was no significant change in the valuation techniques or inputs used to determine fair value as compared to those used for the year ended 31 December 2014.
(b) Fair value hierarchyThe Group measures fair values using the following fair value hierarchy that reflects the significance of the inputs used in making the measurements:
– Level 1: Fair value based on quoted prices (unadjusted) in active markets for identical assets or liabilities.
– Level 2: Fair value based on inputs other than quoted prices included within level 1 that are observable for the asset or liability, either directly (that is, as prices) or indirectly (that is, derived from prices).
– Level 3: Fair value based on inputs for the asset or liability that are not based on observable market data (that is, unobservable inputs).

158 China Construction Bank Corporation Half-Year Report 2015
(Expressed in millions of RMB, unless otherwise stated)Notes to the Financial Statements
60 Risk Management (continued)
(5) Fair value of financial instruments (continued)
(c) Financial instruments measured at fair value(i) Fair value hierarchy
The table below analyses financial instruments, measured at fair value at the end of the reporting period, by the level in the fair value hierarchy into which the fair value measurement is categorised:
Group
30 June 2015
Level 1 Level 2 Level 3 Total
AssetsFinancial assets at fair value through profit or lossFinancial assets held for trading purpose – Debt securities 115 27,478 – 27,593 – Equity instruments and funds 653 2 – 655Financial assets designated as at fair value through profit or loss – Debt securities – – 466 466 – Equity instruments 1,874 – 2,109 3,983 – Other debt instruments – 48,327 101,827 150,154Positive fair value of derivatives – 20,738 1,151 21,889Available-for-sale financial assets – Debt securities 34,730 868,695 4,082 907,507 – Equity instruments and funds 18,323 – 4,034 22,357
Total 55,695 965,240 113,669 1,134,604
LiabilitiesFinancial liabilities at fair value through profit or lossFinancial liabilities designated as at fair value through profit or loss – 204,835 374 205,209Negative fair value of derivatives – 15,806 1,133 16,939
Total – 220,641 1,507 222,148
31 December 2014
Level 1 Level 2 Level 3 Total
AssetsFinancial assets at fair value through profit or lossFinancial assets held for trading purpose – Debt securities 272 94,846 – 95,118 – Equity instruments and funds 603 8 – 611Financial assets designated as at fair value through profit or loss – Debt securities 31 – 967 998 – Equity instruments 1,905 – 1,951 3,856 – Other debt instruments – 61,736 169,916 231,652Positive fair value of derivatives – 12,470 1,299 13,769Available-for-sale financial assets – Debt securities 29,513 876,918 3,672 910,103 – Equity instruments and funds 8,130 921 4,797 13,848
Total 40,454 1,046,899 182,602 1,269,955
LiabilitiesFinancial liabilities at fair value through profit or lossFinancial liabilities designated as at fair value through profit or loss – 295,192 817 296,009Negative fair value of derivatives – 11,085 1,288 12,373
Total – 306,277 2,105 308,382
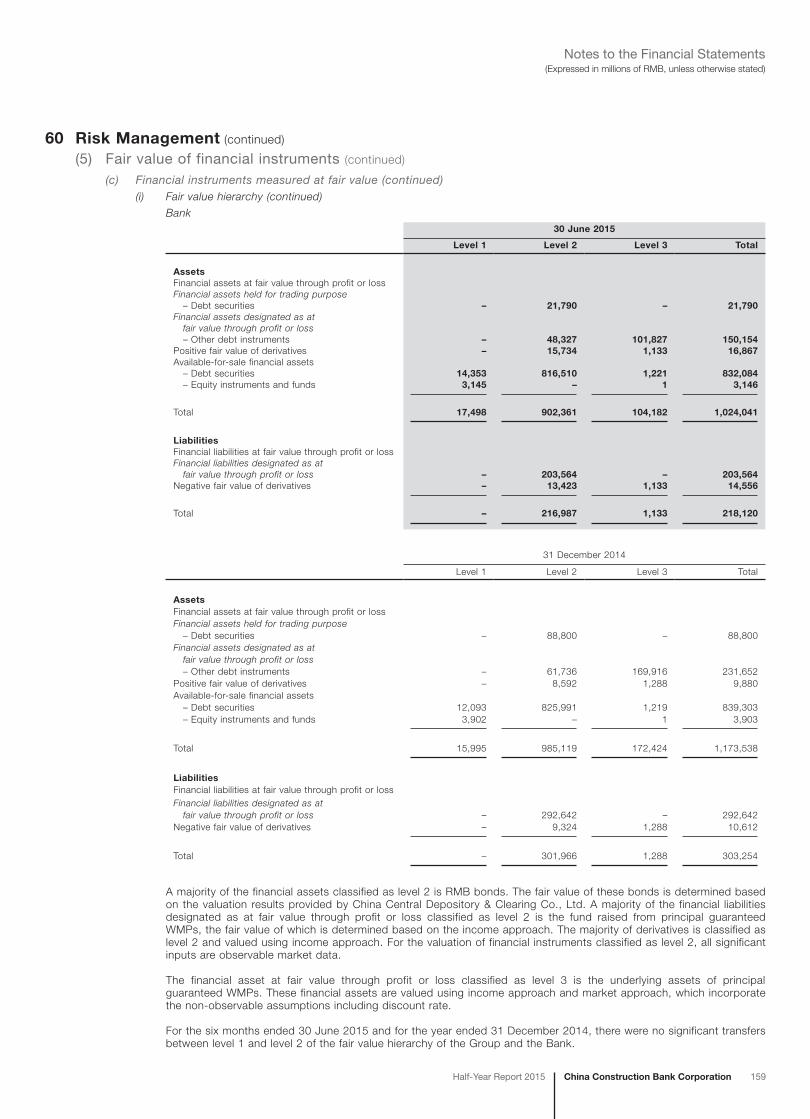
China Construction Bank CorporationHalf-Year Report 2015 159
(Expressed in millions of RMB, unless otherwise stated)Notes to the Financial Statements
60 Risk Management (continued)
(5) Fair value of financial instruments (continued)
(c) Financial instruments measured at fair value (continued)(i) Fair value hierarchy (continued)
Bank30 June 2015
Level 1 Level 2 Level 3 Total
AssetsFinancial assets at fair value through profit or lossFinancial assets held for trading purpose – Debt securities – 21,790 – 21,790Financial assets designated as at fair value through profit or loss – Other debt instruments – 48,327 101,827 150,154Positive fair value of derivatives – 15,734 1,133 16,867Available-for-sale financial assets – Debt securities 14,353 816,510 1,221 832,084 – Equity instruments and funds 3,145 – 1 3,146
Total 17,498 902,361 104,182 1,024,041
LiabilitiesFinancial liabilities at fair value through profit or lossFinancial liabilities designated as at fair value through profit or loss – 203,564 – 203,564Negative fair value of derivatives – 13,423 1,133 14,556
Total – 216,987 1,133 218,120
31 December 2014
Level 1 Level 2 Level 3 Total
AssetsFinancial assets at fair value through profit or lossFinancial assets held for trading purpose – Debt securities – 88,800 – 88,800Financial assets designated as at fair value through profit or loss – Other debt instruments – 61,736 169,916 231,652Positive fair value of derivatives – 8,592 1,288 9,880Available-for-sale financial assets – Debt securities 12,093 825,991 1,219 839,303 – Equity instruments and funds 3,902 – 1 3,903
Total 15,995 985,119 172,424 1,173,538
LiabilitiesFinancial liabilities at fair value through profit or lossFinancial liabilities designated as at fair value through profit or loss – 292,642 – 292,642Negative fair value of derivatives – 9,324 1,288 10,612
Total – 301,966 1,288 303,254
A majority of the financial assets classified as level 2 is RMB bonds. The fair value of these bonds is determined based on the valuation results provided by China Central Depository & Clearing Co., Ltd. A majority of the financial liabilities designated as at fair value through profit or loss classified as level 2 is the fund raised from principal guaranteed WMPs, the fair value of which is determined based on the income approach. The majority of derivatives is classified as level 2 and valued using income approach. For the valuation of financial instruments classified as level 2, all significant inputs are observable market data.
The financial asset at fair value through profit or loss classified as level 3 is the underlying assets of principal guaranteed WMPs. These financial assets are valued using income approach and market approach, which incorporate the non-observable assumptions including discount rate.
For the six months ended 30 June 2015 and for the year ended 31 December 2014, there were no significant transfers between level 1 and level 2 of the fair value hierarchy of the Group and the Bank.
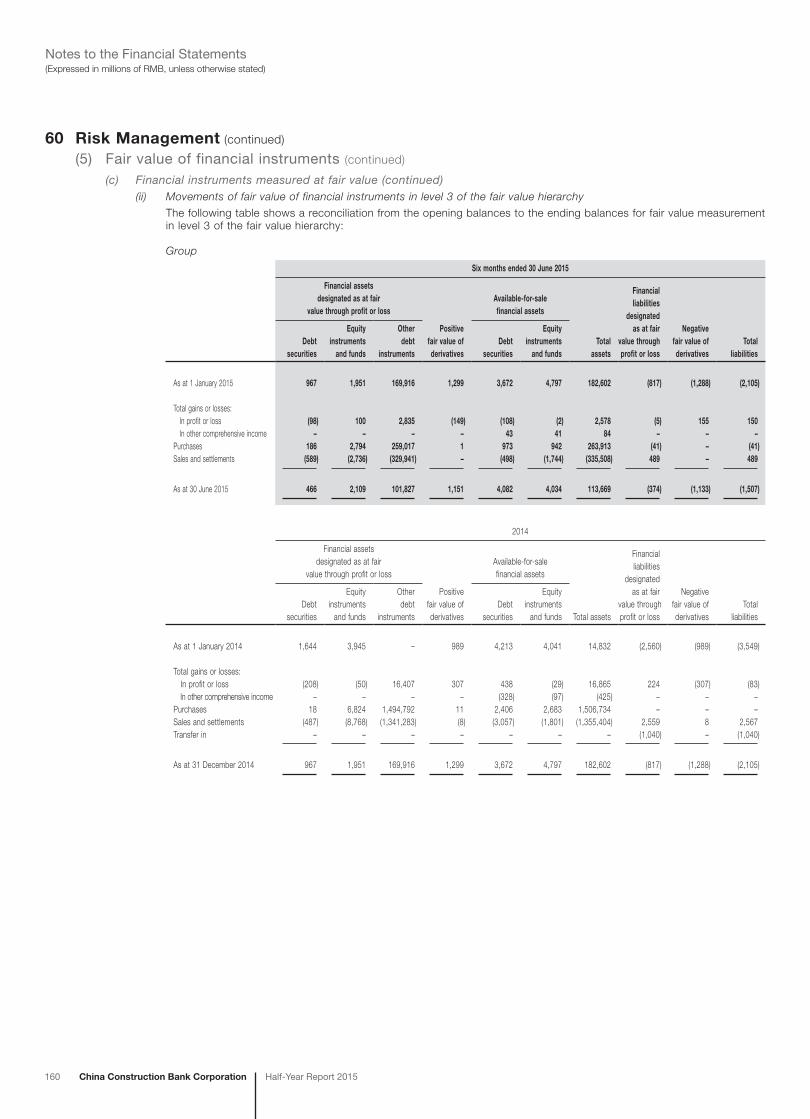
160 China Construction Bank Corporation Half-Year Report 2015
(Expressed in millions of RMB, unless otherwise stated)Notes to the Financial Statements
60 Risk Management (continued)
(5) Fair value of financial instruments (continued)
(c) Financial instruments measured at fair value (continued)(ii) Movements of fair value of financial instruments in level 3 of the fair value hierarchy
The following table shows a reconciliation from the opening balances to the ending balances for fair value measurement in level 3 of the fair value hierarchy:
Group
Six months ended 30 June 2015
Financial assetsdesignated as at fair
value through profit or loss
Positivefair value ofderivatives
Available-for-salefinancial assets
Total assets
Financialliabilities
designatedas at fair
value throughprofit or loss
Negativefair value ofderivatives
Totalliabilities
Debtsecurities
Equityinstruments
and funds
Otherdebt
instrumentsDebt
securities
Equityinstruments
and funds
As at 1 January 2015 967 1,951 169,916 1,299 3,672 4,797 182,602 (817) (1,288) (2,105)
Total gains or losses: In profit or loss (98) 100 2,835 (149) (108) (2) 2,578 (5) 155 150 In other comprehensive income – – – – 43 41 84 – – –Purchases 186 2,794 259,017 1 973 942 263,913 (41) – (41)Sales and settlements (589) (2,736) (329,941) – (498) (1,744) (335,508) 489 – 489
As at 30 June 2015 466 2,109 101,827 1,151 4,082 4,034 113,669 (374) (1,133) (1,507)
2014
Financial assetsdesignated as at fair
value through profit or loss
Positivefair value ofderivatives
Available-for-salefinancial assets
Total assets
Financialliabilities
designatedas at fair
value throughprofit or loss
Negativefair value ofderivatives
Totalliabilities
Debtsecurities
Equityinstruments
and funds
Otherdebt
instrumentsDebt
securities
Equityinstruments
and funds
As at 1 January 2014 1,644 3,945 – 989 4,213 4,041 14,832 (2,560) (989) (3,549)
Total gains or losses: In profit or loss (208) (50) 16,407 307 438 (29) 16,865 224 (307) (83) In other comprehensive income – – – – (328) (97) (425) – – –Purchases 18 6,824 1,494,792 11 2,406 2,683 1,506,734 – – –Sales and settlements (487) (8,768) (1,341,283) (8) (3,057) (1,801) (1,355,404) 2,559 8 2,567Transfer in – – – – – – – (1,040) – (1,040)
As at 31 December 2014 967 1,951 169,916 1,299 3,672 4,797 182,602 (817) (1,288) (2,105)

China Construction Bank CorporationHalf-Year Report 2015 161
(Expressed in millions of RMB, unless otherwise stated)Notes to the Financial Statements
60 Risk Management (continued)
(5) Fair value of financial instruments (continued)
(c) Financial instruments measured at fair value (continued)(ii) Movements of fair value of financial instruments in level 3 of the fair value hierarchy (continued)
Bank
Six months ended 30 June 2015
Available-for-sale financial assets
Financial assets
designated as at fair
value through
profit or loss
Positivefair value ofderivatives
Debt securities
Equity instruments
and fundsTotal
assets
Negativefair value ofderivatives
Total liabilities
As at 1 January 2015 169,916 1,288 1,219 1 172,424 (1,288) (1,288)
Total gains or losses: In profit or loss 2,835 (155) – – 2,680 155 155 In other comprehensive income – – 2 – 2 – –Purchases 259,017 – – – 259,017 – –Sales and settlements (329,941) – – – (329,941) – –
As at 30 June 2015 101,827 1,133 1,221 1 104,182 (1,133) (1,133)
2014
Available-for-sale financial assets
Financial assets
designated as at fair
value through
profit or loss
Positivefair value ofderivatives
Debt securities
Equity instruments
and fundsTotal
assets
Negativefair value ofderivatives
Total liabilities
As at 1 January 2014 – 989 2,754 19 3,762 (989) (989)
Total gains or losses: In profit or loss 16,407 307 395 (19) 17,090 (307) (307) In other comprehensive income – – (392) – (392) – –Purchases 1,494,792 – – 1 1,494,793 – –Sales and settlements (1,341,283) (8) (1,538) – (1,342,829) 8 8
As at 31 December 2014 169,916 1,288 1,219 1 172,424 (1,288) (1,288)

162 China Construction Bank Corporation Half-Year Report 2015
(Expressed in millions of RMB, unless otherwise stated)Notes to the Financial Statements
60 Risk Management (continued)
(5) Fair value of financial instruments (continued)
(c) Financial instruments measured at fair value (continued)(ii) Movements of fair value of financial instruments in level 3 of the fair value hierarchy (continued)
In Level 3 of the fair value hierarchy, total gains or losses included in profit or loss for the year in the above table are presented in net trading gain, net gain arising from investment securities and impairment losses of the statement of comprehensive income.
Gains or losses on level 3 financial assets and liabilities included in the statement of comprehensive income comprise:
Group
Six months ended 30 June 2015 Six months ended 30 June 2014
Realised Unrealised Total Realised Unrealised Total
Total gains 3,258 (530) 2,728 351 60 411
Bank
Six months ended 30 June 2015 Six months ended 30 June 2014
Realised Unrealised Total Realised Unrealised Total
Total gains 2,835 – 2,835 228 11 239
(d) Financial instruments not measured at fair value(i) Financial assets
The Group’s financial assets not measured at fair value mainly include cash and deposits with central banks, deposits and placements with banks and non-bank financial institutions, financial assets held under resale agreements, loans and advances to customers, held-to-maturity investments and receivables.
Deposits with central banks, deposits and placements with banks and non-bank financial institutions and financial assets held under resale agreements
Deposits with central banks, deposits and placements with banks and non-bank financial institutions and financial assets held under resale agreements are mainly priced at market interest rates and mature within one year. Accordingly, the carrying values approximate the fair values.
Loans and advances to customers
Majority of the loans and advances to customers are repriced at least annually to the market rate. Accordingly, their carrying values approximate the fair values.
Investments
The following table shows the carrying values and the fair values of the receivables and held-to-maturity investments which are not presented in the statement of financial position at their fair values.
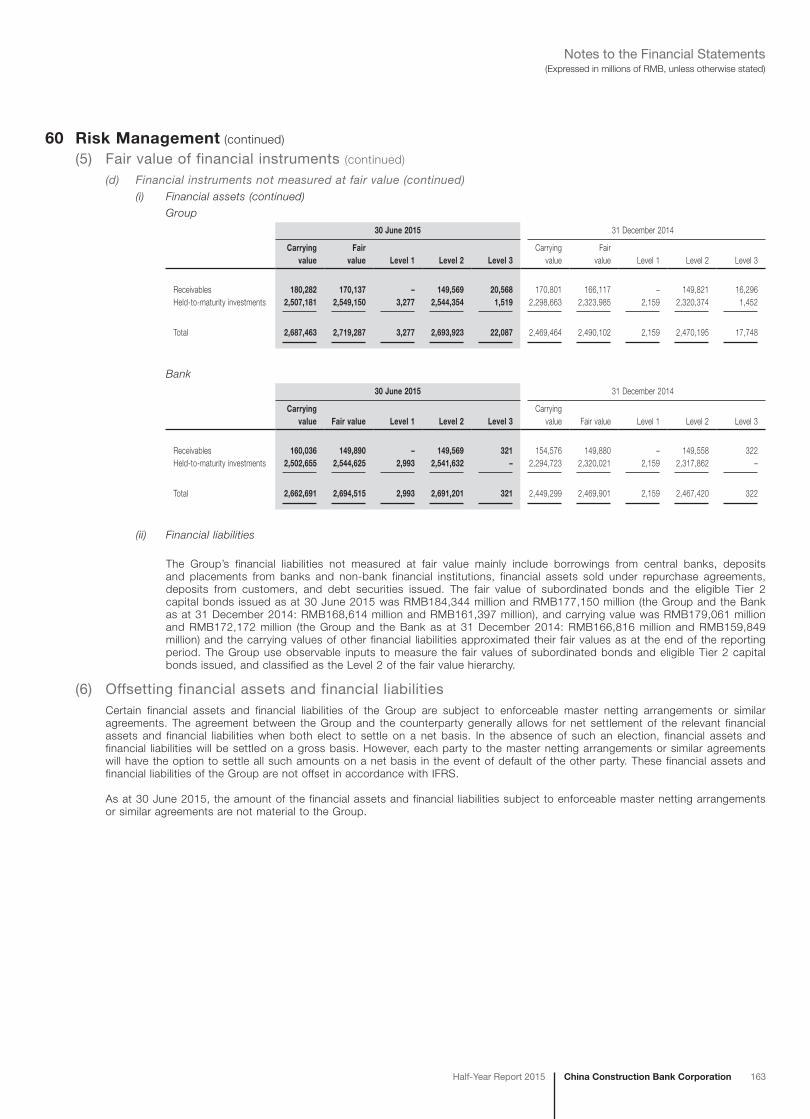
China Construction Bank CorporationHalf-Year Report 2015 163
(Expressed in millions of RMB, unless otherwise stated)Notes to the Financial Statements
60 Risk Management (continued)
(5) Fair value of financial instruments (continued)
(d) Financial instruments not measured at fair value (continued)(i) Financial assets (continued)
Group
30 June 2015 31 December 2014
Carrying value
Fair value Level 1 Level 2 Level 3
Carrying value
Fair value Level 1 Level 2 Level 3
Receivables 180,282 170,137 – 149,569 20,568 170,801 166,117 – 149,821 16,296Held-to-maturity investments 2,507,181 2,549,150 3,277 2,544,354 1,519 2,298,663 2,323,985 2,159 2,320,374 1,452
Total 2,687,463 2,719,287 3,277 2,693,923 22,087 2,469,464 2,490,102 2,159 2,470,195 17,748
Bank
30 June 2015 31 December 2014
Carrying value Fair value Level 1 Level 2 Level 3
Carrying value Fair value Level 1 Level 2 Level 3
Receivables 160,036 149,890 – 149,569 321 154,576 149,880 – 149,558 322Held-to-maturity investments 2,502,655 2,544,625 2,993 2,541,632 – 2,294,723 2,320,021 2,159 2,317,862 –
Total 2,662,691 2,694,515 2,993 2,691,201 321 2,449,299 2,469,901 2,159 2,467,420 322
(ii) Financial liabilities
The Group’s financial liabilities not measured at fair value mainly include borrowings from central banks, deposits and placements from banks and non-bank financial institutions, financial assets sold under repurchase agreements, deposits from customers, and debt securities issued. The fair value of subordinated bonds and the eligible Tier 2 capital bonds issued as at 30 June 2015 was RMB184,344 million and RMB177,150 million (the Group and the Bank as at 31 December 2014: RMB168,614 million and RMB161,397 million), and carrying value was RMB179,061 million and RMB172,172 million (the Group and the Bank as at 31 December 2014: RMB166,816 million and RMB159,849 million) and the carrying values of other financial liabilities approximated their fair values as at the end of the reporting period. The Group use observable inputs to measure the fair values of subordinated bonds and eligible Tier 2 capital bonds issued, and classified as the Level 2 of the fair value hierarchy.
(6) Offsetting financial assets and financial liabilitiesCertain financial assets and financial liabilities of the Group are subject to enforceable master netting arrangements or similar agreements. The agreement between the Group and the counterparty generally allows for net settlement of the relevant financial assets and financial liabilities when both elect to settle on a net basis. In the absence of such an election, financial assets and financial liabilities will be settled on a gross basis. However, each party to the master netting arrangements or similar agreements will have the option to settle all such amounts on a net basis in the event of default of the other party. These financial assets and financial liabilities of the Group are not offset in accordance with IFRS.
As at 30 June 2015, the amount of the financial assets and financial liabilities subject to enforceable master netting arrangements or similar agreements are not material to the Group.
164 China Construction Bank Corporation Half-Year Report 2015
(Expressed in millions of RMB, unless otherwise stated)Notes to the Financial Statements
60 Risk Management (continued)
(7) Insurance riskThe risk under an insurance contract is the possibility that the insured event occurs and the uncertainty in the resulting claim amount. The characteristic of an insurance contract inherently decides randomness and unpredictability of the underlying insurance risk. For insurance contracts where the theory of probability is applied to pricing and provisioning of insurance contract liabilities, the principal risk that the Group faces is that the actual claims and benefit payments exceed the carrying amount of the insurance contract liabilities.
The Group manages the uncertainty of insurance risk through its underwriting strategy and policies to diversify the underwriting risks, adequate reinsurance arrangements, and enhanced underwriting control and claim control.
The Group makes related assumptions for the insurance risks and recognizes insurance contract liabilities accordingly. Insurance risk may be elevated by the uncertainty of insurance risk assumptions including assumptions of mortality, expenses and interest rates.
(8) Capital managementThe Group has implemented a comprehensive capital management policy, covering the management of regulatory capital, economic capital and accounting capital, mainly including management of capital adequacy ratio, capital planning, capital raising and economic capital.
Capital adequacy ratio is a reflection of the Group’s ability to maintain a stable operation and resist adverse risks. In accordance with CBRC’s “Measures for Capital Management of Commercial Banks (trial)” and relevant regulations, commercial banks should meet the minimum capital requirements from 1 January 2013. The Common Equity Tier 1 ratio should be at or above a minimum of 5%, Tier 1 ratio at or above a minimum of 6% and total capital ratio at or above a minimum of 8%. Systemically important domestic banks should also meet the 1% additional capital requirement, with their Common Equity Tier 1 capital. Meanwhile, in accordance with CBRC’s “Notice of relevant transitional arrangement for implementation of Measures for Capital Management of Commercial Banks (trial)”, a capital conservation buffer will be introduced progressively during the transitional period, which will be raised through Common Equity Tier 1 capital. If a countercyclical buffer is required or the Pillar 2 capital requirement is raised by the regulator to a specific commercial bank, the minimum requirements should be met within the transitional period.
The Group timely monitors, analyses and reports capital adequacy ratios, assesses if the capital management objectives have been met and exercises effective management of capital adequacy ratio. The Group adopts various measures such as controlling asset growth, adjusting the structure of risk assets, increasing internal capital supply and raising capital through external channels, to ensure that the Common Equity Tier 1 ratio, Tier 1 ratio and total capital ratio of the Group and the Bank are in full compliance with regulatory requirements and meet internal management requirements. This helps to insulate against potential risks as well as support healthy business developments. The Group now fully complies with all regulatory requirements in this respect.
The Group’s capital planning has taken the regulatory requirements, the Group’s development strategy and risk appetite into consideration, and based on those factors the Group projects the capital usage and need.
The capital raising management of the Group involves reasonable utilisation of various capital instruments to ensure that both external regulatory and internal capital management objectives are met, taking in account capital planning and operating environment. This helps to optimise the Group’s capital structure.
In April 2014, CBRC has officially approved the implementation of the advanced approach of capital management by the Bank. In this approach, the Bank has elected to use foundation internal rating based (“IRB”) approach for corporate risk exposure which is compliant with regulatory requirements, IRB approach for retail risk exposure, internal models approach for market risk and standardised approach for operational risk exposure.
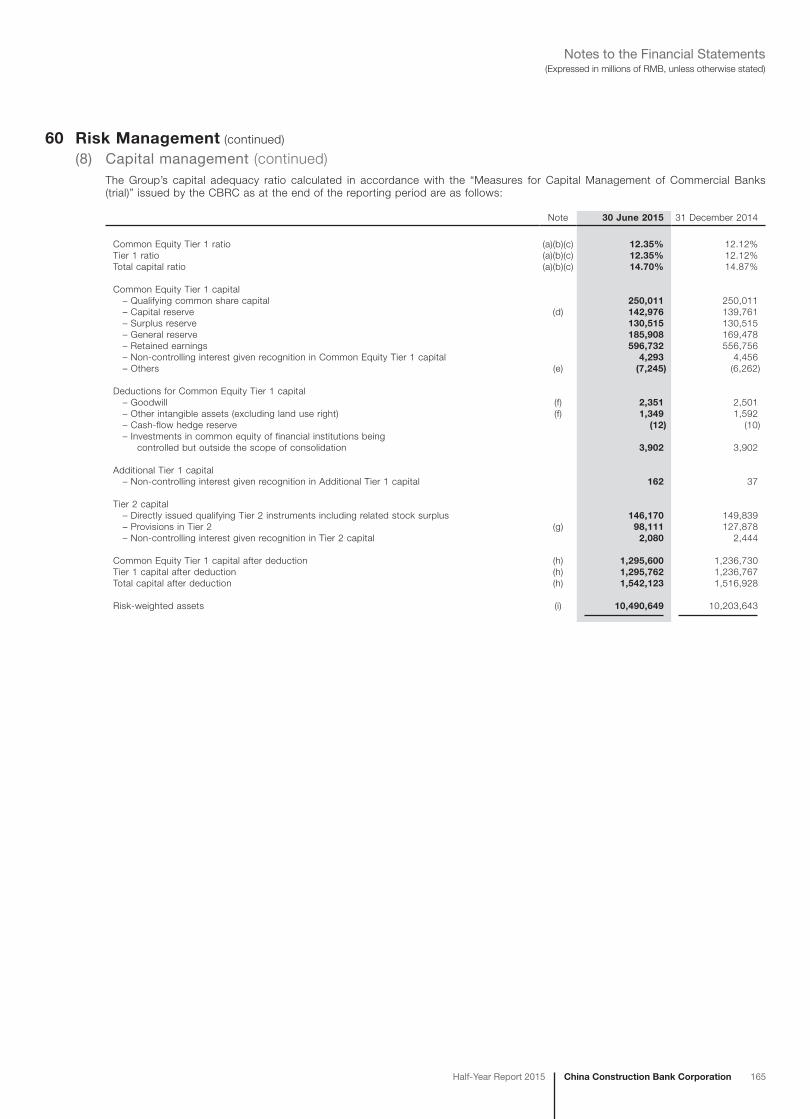
China Construction Bank CorporationHalf-Year Report 2015 165
(Expressed in millions of RMB, unless otherwise stated)Notes to the Financial Statements
60 Risk Management (continued)
(8) Capital management (continued)The Group’s capital adequacy ratio calculated in accordance with the “Measures for Capital Management of Commercial Banks (trial)” issued by the CBRC as at the end of the reporting period are as follows:
Note 30 June 2015 31 December 2014
Common Equity Tier 1 ratio (a)(b)(c) 12.35% 12.12%Tier 1 ratio (a)(b)(c) 12.35% 12.12%Total capital ratio (a)(b)(c) 14.70% 14.87%
Common Equity Tier 1 capital – Qualifying common share capital 250,011 250,011 – Capital reserve (d) 142,976 139,761 – Surplus reserve 130,515 130,515 – General reserve 185,908 169,478 – Retained earnings 596,732 556,756 – Non-controlling interest given recognition in Common Equity Tier 1 capital 4,293 4,456 – Others (e) (7,245) (6,262)
Deductions for Common Equity Tier 1 capital – Goodwill (f) 2,351 2,501 – Other intangible assets (excluding land use right) (f) 1,349 1,592 – Cash-flow hedge reserve (12) (10) – Investments in common equity of financial institutions being controlled but outside the scope of consolidation 3,902 3,902
Additional Tier 1 capital – Non-controlling interest given recognition in Additional Tier 1 capital 162 37
Tier 2 capital – Directly issued qualifying Tier 2 instruments including related stock surplus 146,170 149,839 – Provisions in Tier 2 (g) 98,111 127,878 – Non-controlling interest given recognition in Tier 2 capital 2,080 2,444
Common Equity Tier 1 capital after deduction (h) 1,295,600 1,236,730Tier 1 capital after deduction (h) 1,295,762 1,236,767Total capital after deduction (h) 1,542,123 1,516,928
Risk-weighted assets (i) 10,490,649 10,203,643

166 China Construction Bank Corporation Half-Year Report 2015
(Expressed in millions of RMB, unless otherwise stated)Notes to the Financial Statements
60 Risk Management (continued)
(8) Capital management (continued)Notes:
(a) Since the Half Year report of 2014, the Group has elected the advanced approach to calculate capital adequacy ratio and implemented the parallel period rules.
(b) The Common Equity Tier 1 ratio is calculated by dividing the Common Equity Tier 1 Capital after deduction by risk-weighted assets. Tier 1 ratio is calculated by dividing the Tier 1 Capital after deduction by risk-weighted assets. Total Capital ratio is calculated by dividing the Total capital after deduction by risk-weighted assets.
(c) The scope for calculating capital adequacy ratio of the Group includes all the domestic branches and subsidiaries in the financial sector (excluding CCB Life).
(d) Capital reserve includes investment revaluation reserve.
(e) Others mainly include foreign exchange reserve.
(f) Both balances of goodwill and other intangible assets (excluding land use right) are the net amounts after deducting relevant deferred tax liabilities.
(g) Since the Half Year report of 2014, eligible excessive loan provisions was measured based on the advanced approach and implemented parallel period rules.
(h) Common Equity Tier 1 capital after deduction is calculated by netting off the corresponding deduction items from the Common Equity Tier 1 capital. Tier 1 capital after deduction is calculated by netting off the corresponding deduction items from the Tier 1 capital. Total capital after deduction is calculated by netting off the corresponding deduction items from the total capital.
(i) At 30 June 2015, according to the rules of advanced approach, risk-weighted assets include credit risk-weighted assets, market risk-weighted assets, operational risk-weighted assets and excessive risk-weighted assets due to the application of capital floor.
61 Events after the reporting periodThere are no significant events after the reporting period.
62 Comparative figuresCertain comparative figures have been adjusted to confirm with the presentation and disclosures in the current period.
63 Ultimate parentAs stated in Note 1, the immediate and ultimate parent of the Group is Huijin and CIC respectively.
64 Possible impact of amendments, new standards and interpretations issued but not yet effectiveUp to the date of issue of the financial statements, the IASB has issued the following amendments, new standards and interpretations which are not yet effective for the period ended 30 June 2015 and which have not been adopted in the financial statements.
Standards
Effective for annual period beginning
on or after
IFRS 9, “Financial Instruments” 1 January 2018IFRS 14, “Regulatory Deferral Accounts” 1 January 2016IFRS 15, “Revenue from Contracts with Customers” 1 January 2017Amendment to IFRS 11, “Joint Arrangement” 1 January 2016Amendments to IAS 16 and IAS 38 on clarification of acceptable methods of depreciation and amortisation 1 January 2016Amendment to IAS 27, “Separate Financial Statement” 1 January 2016Amendments to IFRS 10, “Consolidated Financial Statements” and IAS 28, “Investments in Associates” 1 January 2016Annual improvements 2014 1 January 2016
The Group is in the process of making an assessment on the impact of these new and revised IFRSs upon initial application.
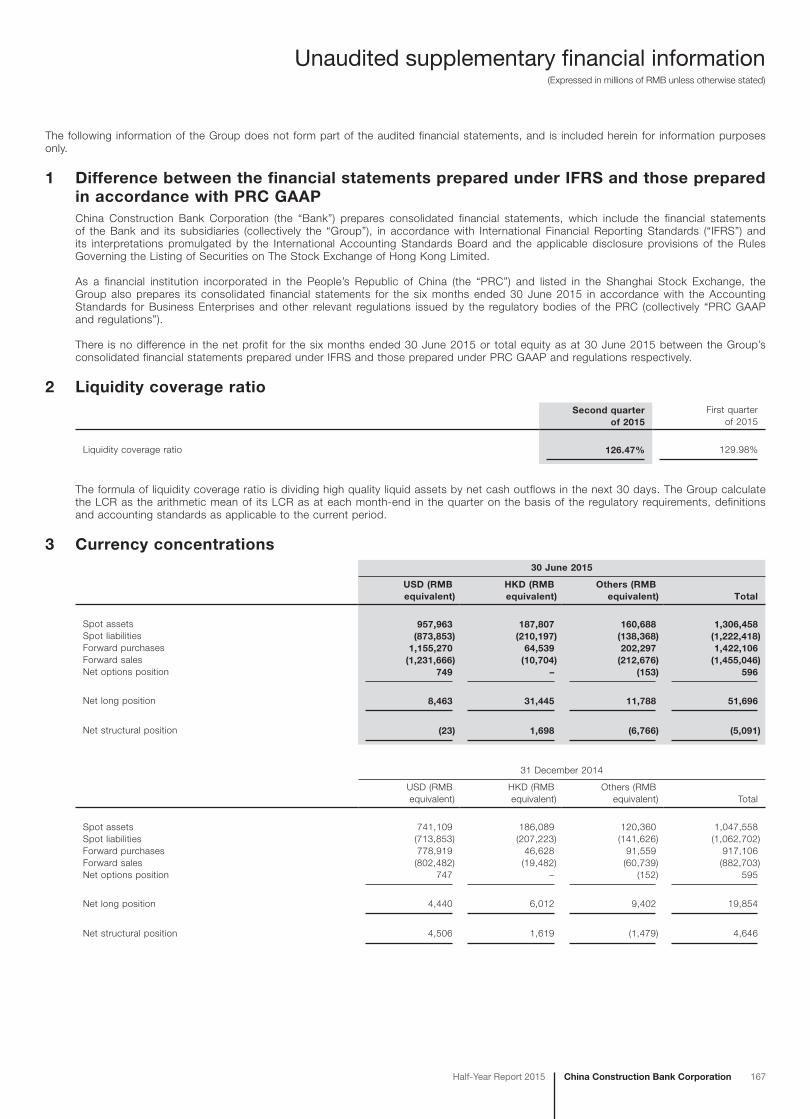
Unaudited supplementary financial information(Expressed in millions of RMB unless otherwise stated)
China Construction Bank CorporationHalf-Year Report 2015 167
The following information of the Group does not form part of the audited financial statements, and is included herein for information purposes only.
1 Difference between the financial statements prepared under IFRS and those prepared in accordance with PRC GAAPChina Construction Bank Corporation (the “Bank”) prepares consolidated financial statements, which include the financial statements of the Bank and its subsidiaries (collectively the “Group”), in accordance with International Financial Reporting Standards (“IFRS”) and its interpretations promulgated by the International Accounting Standards Board and the applicable disclosure provisions of the Rules Governing the Listing of Securities on The Stock Exchange of Hong Kong Limited.
As a financial institution incorporated in the People’s Republic of China (the “PRC”) and listed in the Shanghai Stock Exchange, the Group also prepares its consolidated financial statements for the six months ended 30 June 2015 in accordance with the Accounting Standards for Business Enterprises and other relevant regulations issued by the regulatory bodies of the PRC (collectively “PRC GAAP and regulations”).
There is no difference in the net profit for the six months ended 30 June 2015 or total equity as at 30 June 2015 between the Group’s consolidated financial statements prepared under IFRS and those prepared under PRC GAAP and regulations respectively.
2 Liquidity coverage ratioSecond quarter
of 2015First quarter
of 2015
Liquidity coverage ratio 126.47% 129.98%
The formula of liquidity coverage ratio is dividing high quality liquid assets by net cash outflows in the next 30 days. The Group calculate the LCR as the arithmetic mean of its LCR as at each month-end in the quarter on the basis of the regulatory requirements, definitions and accounting standards as applicable to the current period.
3 Currency concentrations30 June 2015
USD (RMB equivalent)
HKD (RMB equivalent)
Others (RMB equivalent) Total
Spot assets 957,963 187,807 160,688 1,306,458Spot liabilities (873,853) (210,197) (138,368) (1,222,418)Forward purchases 1,155,270 64,539 202,297 1,422,106Forward sales (1,231,666) (10,704) (212,676) (1,455,046)Net options position 749 – (153) 596
Net long position 8,463 31,445 11,788 51,696
Net structural position (23) 1,698 (6,766) (5,091)
31 December 2014
USD (RMB equivalent)
HKD (RMB equivalent)
Others (RMB equivalent) Total
Spot assets 741,109 186,089 120,360 1,047,558Spot liabilities (713,853) (207,223) (141,626) (1,062,702)Forward purchases 778,919 46,628 91,559 917,106Forward sales (802,482) (19,482) (60,739) (882,703)Net options position 747 – (152) 595
Net long position 4,440 6,012 9,402 19,854
Net structural position 4,506 1,619 (1,479) 4,646
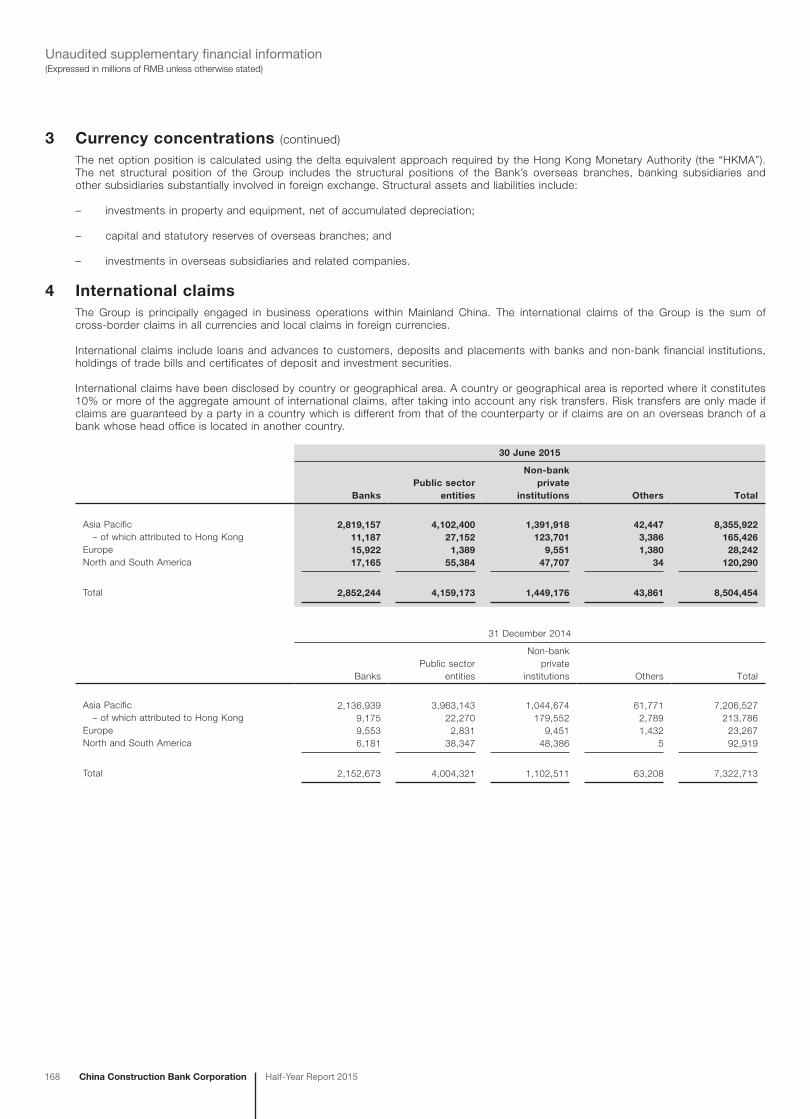
168 China Construction Bank Corporation Half-Year Report 2015
(Expressed in millions of RMB unless otherwise stated)Unaudited supplementary financial information
3 Currency concentrations (continued)
The net option position is calculated using the delta equivalent approach required by the Hong Kong Monetary Authority (the “HKMA”). The net structural position of the Group includes the structural positions of the Bank’s overseas branches, banking subsidiaries and other subsidiaries substantially involved in foreign exchange. Structural assets and liabilities include:
– investments in property and equipment, net of accumulated depreciation;
– capital and statutory reserves of overseas branches; and
– investments in overseas subsidiaries and related companies.
4 International claimsThe Group is principally engaged in business operations within Mainland China. The international claims of the Group is the sum of cross-border claims in all currencies and local claims in foreign currencies.
International claims include loans and advances to customers, deposits and placements with banks and non-bank financial institutions, holdings of trade bills and certificates of deposit and investment securities.
International claims have been disclosed by country or geographical area. A country or geographical area is reported where it constitutes 10% or more of the aggregate amount of international claims, after taking into account any risk transfers. Risk transfers are only made if claims are guaranteed by a party in a country which is different from that of the counterparty or if claims are on an overseas branch of a bank whose head office is located in another country.
30 June 2015
BanksPublic sector
entities
Non-bank private
institutions Others Total
Asia Pacific 2,819,157 4,102,400 1,391,918 42,447 8,355,922 – of which attributed to Hong Kong 11,187 27,152 123,701 3,386 165,426Europe 15,922 1,389 9,551 1,380 28,242North and South America 17,165 55,384 47,707 34 120,290
Total 2,852,244 4,159,173 1,449,176 43,861 8,504,454
31 December 2014
BanksPublic sector
entities
Non-bank private
institutions Others Total
Asia Pacific 2,136,939 3,963,143 1,044,674 61,771 7,206,527 – of which attributed to Hong Kong 9,175 22,270 179,552 2,789 213,786Europe 9,553 2,831 9,451 1,432 23,267North and South America 6,181 38,347 48,386 5 92,919
Total 2,152,673 4,004,321 1,102,511 63,208 7,322,713
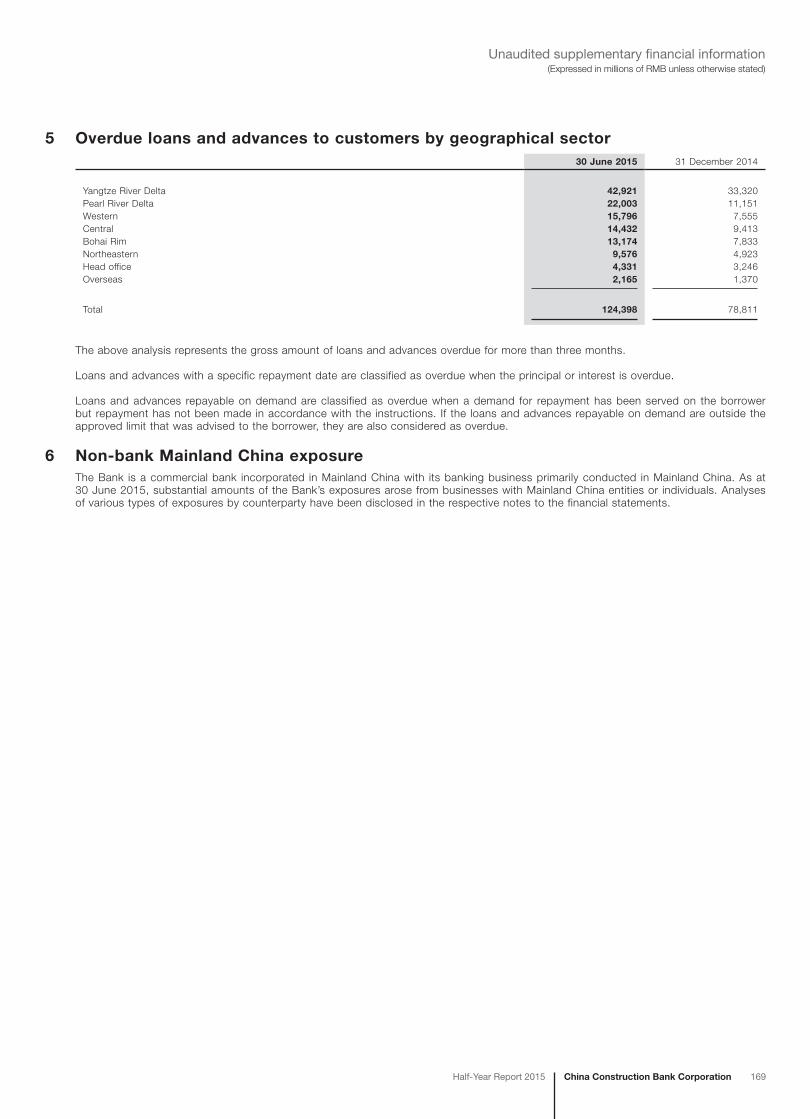
China Construction Bank CorporationHalf-Year Report 2015 169
(Expressed in millions of RMB unless otherwise stated)Unaudited supplementary financial information
5 Overdue loans and advances to customers by geographical sector30 June 2015 31 December 2014
Yangtze River Delta 42,921 33,320Pearl River Delta 22,003 11,151Western 15,796 7,555Central 14,432 9,413Bohai Rim 13,174 7,833Northeastern 9,576 4,923Head office 4,331 3,246Overseas 2,165 1,370
Total 124,398 78,811
The above analysis represents the gross amount of loans and advances overdue for more than three months.
Loans and advances with a specific repayment date are classified as overdue when the principal or interest is overdue.
Loans and advances repayable on demand are classified as overdue when a demand for repayment has been served on the borrower but repayment has not been made in accordance with the instructions. If the loans and advances repayable on demand are outside the approved limit that was advised to the borrower, they are also considered as overdue.
6 Non-bank Mainland China exposureThe Bank is a commercial bank incorporated in Mainland China with its banking business primarily conducted in Mainland China. As at 30 June 2015, substantial amounts of the Bank’s exposures arose from businesses with Mainland China entities or individuals. Analyses of various types of exposures by counterparty have been disclosed in the respective notes to the financial statements.

Appendix: Composition of Capital
170 China Construction Bank Corporation Half-Year Report 2015
In accordance with the regulatory requirements for the disclosure of information on capital composition of commercial banks issued by CBRC, the following table shows the Group’s composition of capital, minimum regulatory capital requirements, as well as their connections with the balance sheets under the scope of regulatory consolidation.
(In millions of RMB, except percentages) CodeAs at
30 June 2015As at
31 December 2014
Common Equity Tier 1 capital:1 Qualifying common share capital n 250,011 250,0112 Retained earnings 913,155 856,7492a Surplus reserve r 130,515 130,5152b General reserve s 185,908 169,4782c Undistributed profits t 596,732 556,7563 Accumulated other comprehensive income and disclosed reserves 135,731 133,4993a Capital reserve o+q 142,976 139,7613b Others u (7,245) (6,262)4 Amount given recognition in Common Equity Tier 1 capital (Only applicable to unlisted companies,
while banks of joint-stock companies to be completed with “0”) N/A N/A5 Minority interest given recognition in Common Equity Tier 1 capital v 4,293 4,4566 Common Equity Tier 1 capital before regulatory adjustments 1,303,190 1,244,715Common Equity Tier 1 capital: Regulatory adjustments7 Prudent valuation adjustment – –8 Goodwill (excluding deferred tax liabilities) k 2,351 2,5019 Other intangible assets (excluding land use rights) (excluding deferred tax liabilities) j 1,349 1,59210 Net deferred tax assets relying on future profits and arising from operating losses – –11 Cash-flow hedge reserves p (12) (10)12 Gaps of loan loss provisions – –13 Gains from sales of asset securitisation – –14 Unrealised profit/loss arising from the changes in own credit risk on fair values of liability – –15 Net defined-benefit pension assets (excluding deferred tax liabilities) – –16 Directly or indirectly investments in own shares – –17 Reciprocal cross-holdings in common equity – –18 Non-significant investments in capital of financial institutions outside the scope of regulatory
consolidation (amount above 10% threshold) – –19 Significant investments in capital of financial institutions outside the scope of regulatory
consolidation (amount above 10% threshold) – –20 Mortgage-servicing rights N/A N/A21 Other deferred tax assets relying on the Bank’s future profitability (amount above 10% threshold) – –22 Significant investments in the capital of financial institutions outside the scope of regulatory
consolidation and other deferred tax assets that rely on the Bank’s future profitability after all regulatory adjustments (amount exceeding the 15% threshold) – –
23 of which: significant investments in the capital of financial institutions – –24 of which: Mortgage-servicing rights N/A N/A25 of which: Other deferred tax assets that rely on the Bank’s future profitability – –26a Investments in common equity of financial institutions being controlled but outside the scope
of regulatory consolidation h 3,902 3,90226b Gaps of common equity of financial institutions being controlled but outside the scope
of regulatory consolidation – –26c Total regulatory adjustments to Common Equity Tier 1 capital – –27 Regulatory adjustments applied to Common Equity Tier 1 due to insufficient Additional Tier 1 and
Tier 2 to cover deductions – –28 Total regulatory adjustments in Common Equity Tier 1 capital 7,590 7,98529 Common Equity Tier 1 capital after regulatory adjustments 1,295,600 1,236,730Additional Tier 1 capital:30 Directly issued qualifying Additional Tier 1 capital instruments including related stock surplus – –31 of which: classified as equity – –32 of which: classified as liabilities – –33 of which: Instruments not given recognition in Additional Tier 1 capital after the transition period – –34 Minority interest given recognition in Additional Tier 1 capital w 162 3735 of which: Portions not given recognition in Additional Tier 1 capital after the transition period – –36 Additional Tier 1 capital before regulatory adjustments 162 37
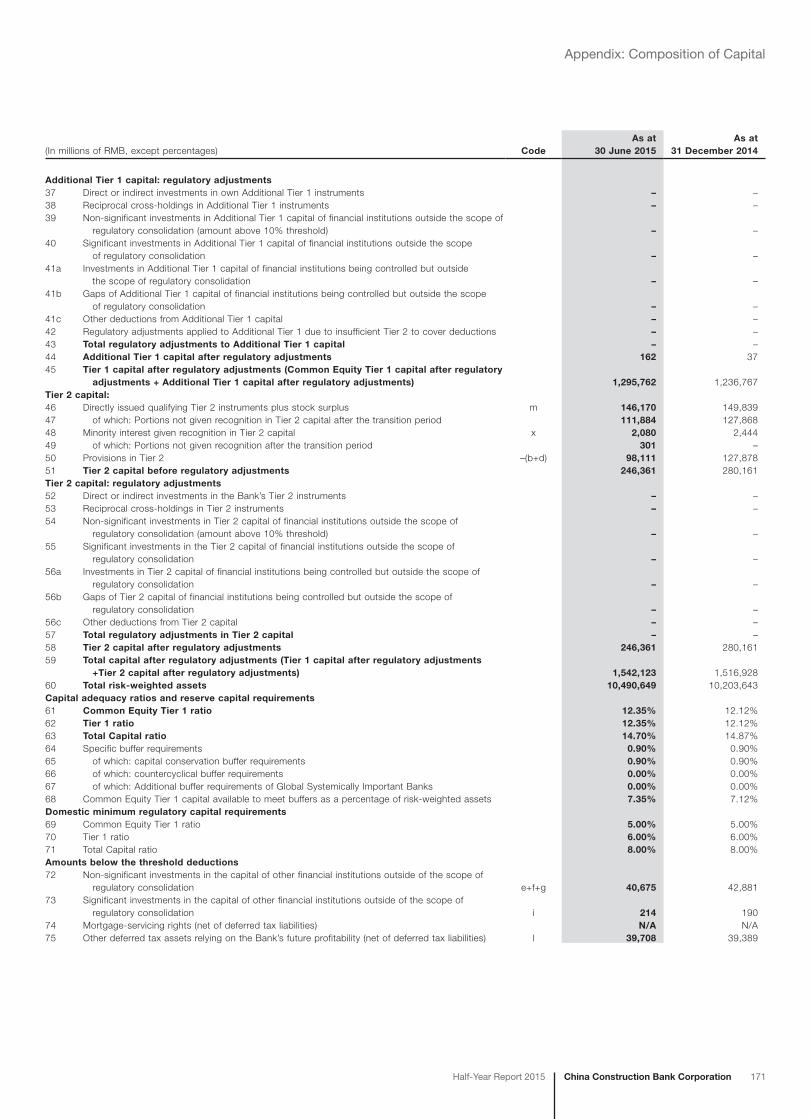
China Construction Bank CorporationHalf-Year Report 2015 171
Appendix: Composition of Capital
(In millions of RMB, except percentages) CodeAs at
30 June 2015As at
31 December 2014
Additional Tier 1 capital: regulatory adjustments37 Direct or indirect investments in own Additional Tier 1 instruments – –38 Reciprocal cross-holdings in Additional Tier 1 instruments – –39 Non-significant investments in Additional Tier 1 capital of financial institutions outside the scope of
regulatory consolidation (amount above 10% threshold) – –40 Significant investments in Additional Tier 1 capital of financial institutions outside the scope
of regulatory consolidation – –41a Investments in Additional Tier 1 capital of financial institutions being controlled but outside
the scope of regulatory consolidation – –41b Gaps of Additional Tier 1 capital of financial institutions being controlled but outside the scope
of regulatory consolidation – –41c Other deductions from Additional Tier 1 capital – –42 Regulatory adjustments applied to Additional Tier 1 due to insufficient Tier 2 to cover deductions – –43 Total regulatory adjustments to Additional Tier 1 capital – –44 Additional Tier 1 capital after regulatory adjustments 162 3745 Tier 1 capital after regulatory adjustments (Common Equity Tier 1 capital after regulatory
adjustments + Additional Tier 1 capital after regulatory adjustments) 1,295,762 1,236,767Tier 2 capital:46 Directly issued qualifying Tier 2 instruments plus stock surplus m 146,170 149,83947 of which: Portions not given recognition in Tier 2 capital after the transition period 111,884 127,86848 Minority interest given recognition in Tier 2 capital x 2,080 2,44449 of which: Portions not given recognition after the transition period 301 –50 Provisions in Tier 2 –(b+d) 98,111 127,87851 Tier 2 capital before regulatory adjustments 246,361 280,161Tier 2 capital: regulatory adjustments52 Direct or indirect investments in the Bank’s Tier 2 instruments – –53 Reciprocal cross-holdings in Tier 2 instruments – –54 Non-significant investments in Tier 2 capital of financial institutions outside the scope of
regulatory consolidation (amount above 10% threshold) – –55 Significant investments in the Tier 2 capital of financial institutions outside the scope of
regulatory consolidation – –56a Investments in Tier 2 capital of financial institutions being controlled but outside the scope of
regulatory consolidation – –56b Gaps of Tier 2 capital of financial institutions being controlled but outside the scope of
regulatory consolidation – –56c Other deductions from Tier 2 capital – –57 Total regulatory adjustments in Tier 2 capital – –58 Tier 2 capital after regulatory adjustments 246,361 280,16159 Total capital after regulatory adjustments (Tier 1 capital after regulatory adjustments
+Tier 2 capital after regulatory adjustments) 1,542,123 1,516,92860 Total risk-weighted assets 10,490,649 10,203,643Capital adequacy ratios and reserve capital requirements61 Common Equity Tier 1 ratio 12.35% 12.12%62 Tier 1 ratio 12.35% 12.12%63 Total Capital ratio 14.70% 14.87%64 Specific buffer requirements 0.90% 0.90%65 of which: capital conservation buffer requirements 0.90% 0.90%66 of which: countercyclical buffer requirements 0.00% 0.00%67 of which: Additional buffer requirements of Global Systemically Important Banks 0.00% 0.00%68 Common Equity Tier 1 capital available to meet buffers as a percentage of risk-weighted assets 7.35% 7.12%Domestic minimum regulatory capital requirements69 Common Equity Tier 1 ratio 5.00% 5.00%70 Tier 1 ratio 6.00% 6.00%71 Total Capital ratio 8.00% 8.00%Amounts below the threshold deductions72 Non-significant investments in the capital of other financial institutions outside of the scope of
regulatory consolidation e+f+g 40,675 42,88173 Significant investments in the capital of other financial institutions outside of the scope of
regulatory consolidation i 214 19074 Mortgage-servicing rights (net of deferred tax liabilities) N/A N/A75 Other deferred tax assets relying on the Bank’s future profitability (net of deferred tax liabilities) l 39,708 39,389

172 China Construction Bank Corporation Half-Year Report 2015
Appendix: Composition of Capital
(In millions of RMB, except percentages) CodeAs at
30 June 2015As at
31 December 2014
Limit of provisions in Tier 2 capital76 Provisions eligible for inclusion in Tier 2 in respect of exposures subject to regulatory
weight approach (prior to the application of cap) –a 3,651 1,18677 Provisions eligible for inclusion in Tier 2 capital under regulatory weight approach –b 3,651 1,18678 Provisions eligible for inclusion in Tier 2 in respect of exposures subject to internal
rating-based approach (prior to the application of cap) –c 132,539 131,52679 Provisions eligible for inclusion in Tier 2 capital under internal rating-based approach –d 94,460 126,692Capital instruments subject to phase-out arrangements80 Amount given recognition in current-period Common Equity Tier 1 capital
due to transitional arrangements – –81 Amount not given recognition in current-period Common Equity Tier 1 capital
due to transitional arrangements – –82 Amount given recognition in current-period Additional Tier 1 capital
due to transitional arrangements – –83 Amount not given recognition in current-period Additional Tier 1 capital
due to transitional arrangements – –84 Amount given recognition in current-period Tier 2 capital due to transitional arrangements 111,884 127,86885 Amount not given recognition in current-period Tier 2 capital due to transitional arrangements 26,003 10,010

China Construction Bank CorporationHalf-Year Report 2015 173
Appendix: Composition of Capital
The following table shows the balance sheet of the accounting and regulatory consolidations.
(In millions of RMB)
As at 30 June 2015Balance sheet of
the accounting consolidation
Balance sheet of the regulatory consolidation
AssetsCash and deposits with central banks 2,617,781 2,617,737Deposits with banks and non-bank financial institutions 632,183 628,000Precious metals 90,786 90,786Placements with banks and non-bank financial institutions 303,425 306,828Financial assets at fair value through profit or loss 182,851 179,565Positive fair value of derivatives 21,889 21,767Financial assets held under resale agreements 495,858 495,491Interest receivable 100,388 99,608Loans and advances to customers 9,889,596 9,888,186Available-for-sale financial assets 931,818 912,235Held-to-maturity investments 2,507,181 2,503,803Receivables 180,282 160,036Investments to subsidiaries – 4,829Interests in associates and jointly controlled entities 3,758 1,973Fixed assets 148,979 147,968Land use rights 15,490 15,490Intangible assets 1,784 1,349Goodwill 2,546 2,351Deferred tax assets 39,555 39,708Other assets 53,036 52,562
Total assets 18,219,186 18,170,272
LiabilitiesBorrowings from central banks 40,099 40,099Deposits from banks and non-bank financial institutions 1,733,895 1,733,895Placements from banks and non-bank financial institutions 313,734 318,086Financial liabilities at fair value through profit or loss 205,209 205,487Negative fair value of derivatives 16,939 16,635Financial assets sold under repurchase agreements 8,495 6,942Deposits from customers 13,696,977 13,701,250Accrued staff costs 32,160 31,705Taxes payable 40,809 40,630Interest payable 198,692 198,981Provisions 7,634 7,630Debt securities issued 426,306 421,975Deferred tax liabilities 519 421Other liabilities 185,268 141,614
Total liabilities 16,906,736 16,865,350
EquityShare capital 250,011 250,011Capital reserve 135,835 135,809Investment revaluation reserve 7,600 7,167Surplus reserve 130,515 130,515General reserve 185,926 185,908Retained earnings 598,917 596,732Exchange reserve (7,374) (7,245)Total equity attributable to equity shareholders of the Bank 1,301,430 1,298,897Minority interests 11,020 6,025
Total equity 1,312,450 1,304,922
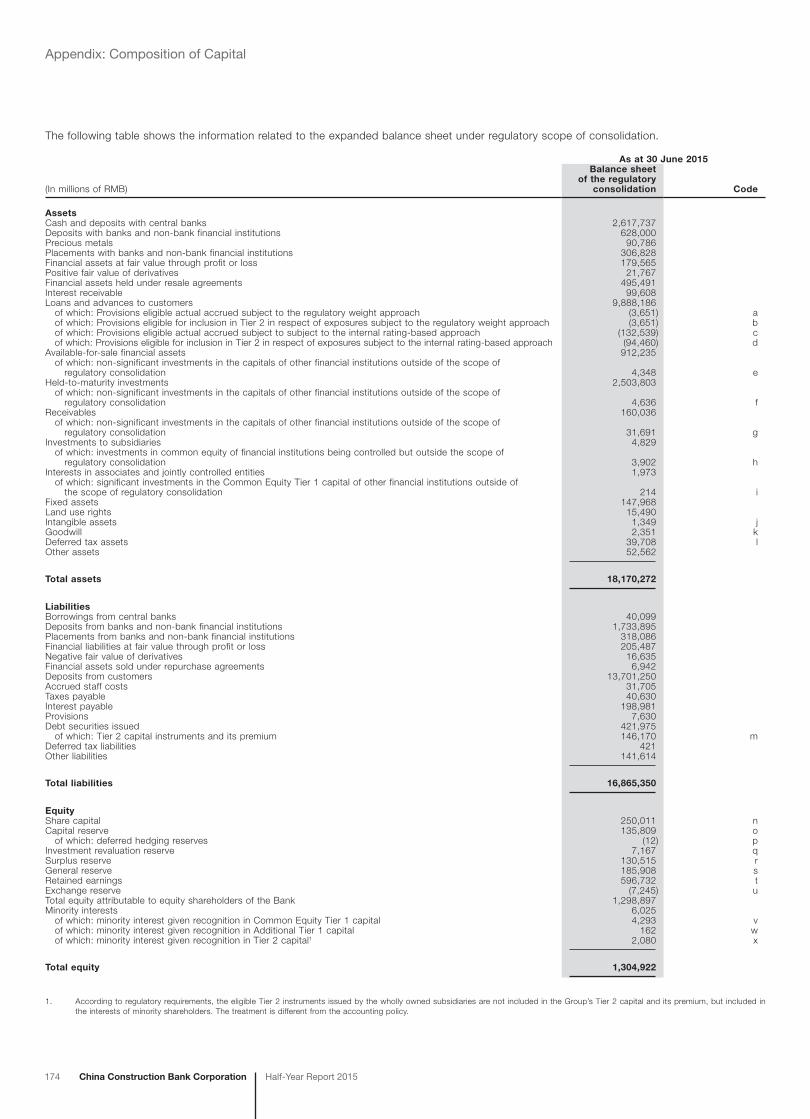
174 China Construction Bank Corporation Half-Year Report 2015
Appendix: Composition of Capital
The following table shows the information related to the expanded balance sheet under regulatory scope of consolidation.
(In millions of RMB)
As at 30 June 2015Balance sheet
of the regulatory consolidation Code
AssetsCash and deposits with central banks 2,617,737Deposits with banks and non-bank financial institutions 628,000Precious metals 90,786Placements with banks and non-bank financial institutions 306,828Financial assets at fair value through profit or loss 179,565Positive fair value of derivatives 21,767Financial assets held under resale agreements 495,491Interest receivable 99,608Loans and advances to customers 9,888,186 of which: Provisions eligible actual accrued subject to the regulatory weight approach (3,651) a of which: Provisions eligible for inclusion in Tier 2 in respect of exposures subject to the regulatory weight approach (3,651) b of which: Provisions eligible actual accrued subject to subject to the internal rating-based approach (132,539) c of which: Provisions eligible for inclusion in Tier 2 in respect of exposures subject to the internal rating-based approach (94,460) dAvailable-for-sale financial assets 912,235 of which: non-significant investments in the capitals of other financial institutions outside of the scope of regulatory consolidation 4,348 eHeld-to-maturity investments 2,503,803 of which: non-significant investments in the capitals of other financial institutions outside of the scope of regulatory consolidation 4,636 fReceivables 160,036 of which: non-significant investments in the capitals of other financial institutions outside of the scope of regulatory consolidation 31,691 gInvestments to subsidiaries 4,829 of which: investments in common equity of financial institutions being controlled but outside the scope of regulatory consolidation 3,902 hInterests in associates and jointly controlled entities 1,973 of which: significant investments in the Common Equity Tier 1 capital of other financial institutions outside of the scope of regulatory consolidation 214 iFixed assets 147,968Land use rights 15,490Intangible assets 1,349 jGoodwill 2,351 kDeferred tax assets 39,708 lOther assets 52,562
Total assets 18,170,272
LiabilitiesBorrowings from central banks 40,099Deposits from banks and non-bank financial institutions 1,733,895Placements from banks and non-bank financial institutions 318,086Financial liabilities at fair value through profit or loss 205,487Negative fair value of derivatives 16,635Financial assets sold under repurchase agreements 6,942Deposits from customers 13,701,250Accrued staff costs 31,705Taxes payable 40,630Interest payable 198,981Provisions 7,630Debt securities issued 421,975 of which: Tier 2 capital instruments and its premium 146,170 mDeferred tax liabilities 421Other liabilities 141,614
Total liabilities 16,865,350
EquityShare capital 250,011 nCapital reserve 135,809 o of which: deferred hedging reserves (12) pInvestment revaluation reserve 7,167 qSurplus reserve 130,515 rGeneral reserve 185,908 sRetained earnings 596,732 tExchange reserve (7,245) uTotal equity attributable to equity shareholders of the Bank 1,298,897Minority interests 6,025 of which: minority interest given recognition in Common Equity Tier 1 capital 4,293 v of which: minority interest given recognition in Additional Tier 1 capital 162 w of which: minority interest given recognition in Tier 2 capital1 2,080 x
Total equity 1,304,922
1. According to regulatory requirements, the eligible Tier 2 instruments issued by the wholly owned subsidiaries are not included in the Group’s Tier 2 capital and its premium, but included in the interests of minority shareholders. The treatment is different from the accounting policy.
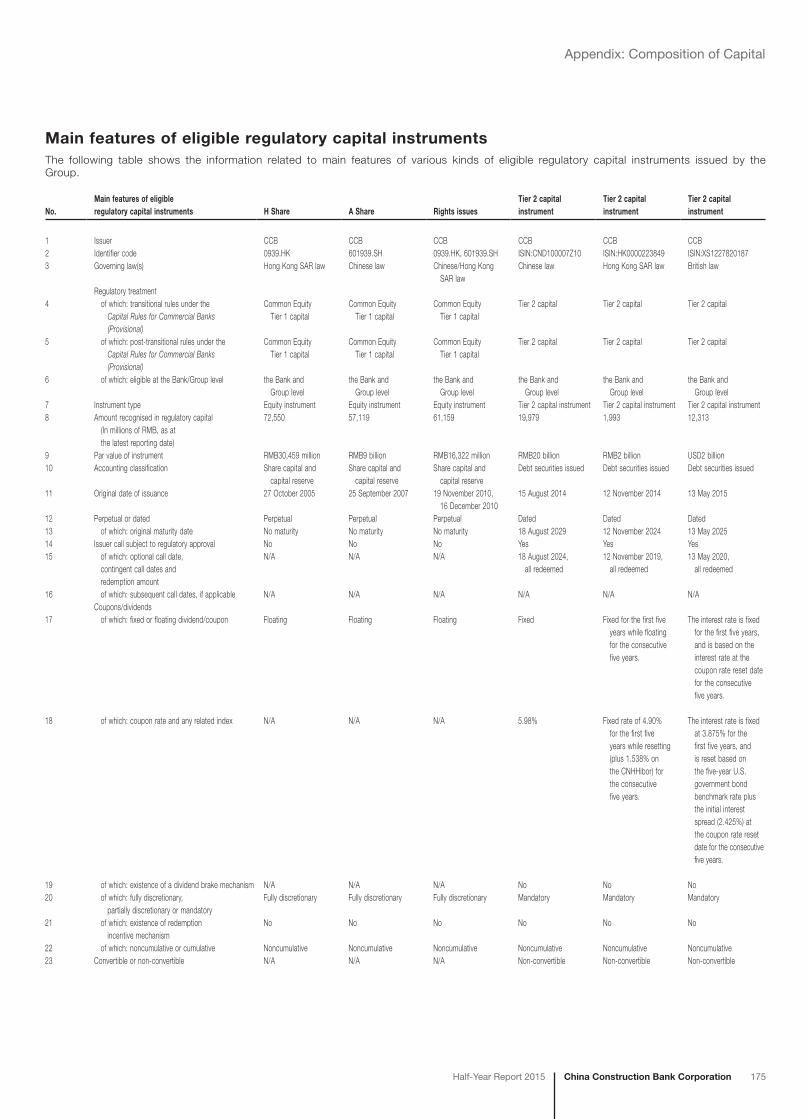
China Construction Bank CorporationHalf-Year Report 2015 175
Appendix: Composition of Capital
Main features of eligible regulatory capital instrumentsThe following table shows the information related to main features of various kinds of eligible regulatory capital instruments issued by the Group.
No.Main features of eligible regulatory capital instruments H Share A Share Rights issues
Tier 2 capital instrument
Tier 2 capital instrument
Tier 2 capital instrument
1 Issuer CCB CCB CCB CCB CCB CCB2 Identifier code 0939.HK 601939.SH 0939.HK, 601939.SH ISIN:CND100007Z10 ISIN:HK0000223849 ISIN:XS12278201873 Governing law(s) Hong Kong SAR law Chinese law Chinese/Hong Kong
SAR lawChinese law Hong Kong SAR law British law
Regulatory treatment4 of which: transitional rules under the
Capital Rules for Commercial Banks (Provisional)
Common Equity Tier 1 capital
Common Equity Tier 1 capital
Common Equity Tier 1 capital
Tier 2 capital Tier 2 capital Tier 2 capital
5 of which: post-transitional rules under the Capital Rules for Commercial Banks (Provisional)
Common Equity Tier 1 capital
Common Equity Tier 1 capital
Common Equity Tier 1 capital
Tier 2 capital Tier 2 capital Tier 2 capital
6 of which: eligible at the Bank/Group level the Bank and Group level
the Bank and Group level
the Bank and Group level
the Bank and Group level
the Bank and Group level
the Bank and Group level
7 Instrument type Equity instrument Equity instrument Equity instrument Tier 2 capital instrument Tier 2 capital instrument Tier 2 capital instrument8 Amount recognised in regulatory capital
(In millions of RMB, as at the latest reporting date)
72,550 57,119 61,159 19,979 1,993 12,313
9 Par value of instrument RMB30,459 million RMB9 billion RMB16,322 million RMB20 billion RMB2 billion USD2 billion10 Accounting classification Share capital and
capital reserveShare capital and capital reserve
Share capital and capital reserve
Debt securities issued Debt securities issued Debt securities issued
11 Original date of issuance 27 October 2005 25 September 2007 19 November 2010, 16 December 2010
15 August 2014 12 November 2014 13 May 2015
12 Perpetual or dated Perpetual Perpetual Perpetual Dated Dated Dated13 of which: original maturity date No maturity No maturity No maturity 18 August 2029 12 November 2024 13 May 202514 Issuer call subject to regulatory approval No No No Yes Yes Yes15 of which: optional call date,
contingent call dates and redemption amount
N/A N/A N/A 18 August 2024, all redeemed
12 November 2019, all redeemed
13 May 2020, all redeemed
16 of which: subsequent call dates, if applicable N/A N/A N/A N/A N/A N/ACoupons/dividends
17 of which: fixed or floating dividend/coupon Floating Floating Floating Fixed Fixed for the first five years while floating for the consecutive five years.
The interest rate is fixed for the first five years, and is based on the interest rate at the coupon rate reset date for the consecutive five years.
18 of which: coupon rate and any related index N/A N/A N/A 5.98% Fixed rate of 4.90% for the first five years while resetting (plus 1.538% on the CNHHibor) for the consecutive five years.
The interest rate is fixed at 3.875% for the first five years, and is reset based on the five-year U.S. government bond benchmark rate plus the initial interest spread (2.425%) at the coupon rate reset date for the consecutive five years.
19 of which: existence of a dividend brake mechanism N/A N/A N/A No No No20 of which: fully discretionary,
partially discretionary or mandatoryFully discretionary Fully discretionary Fully discretionary Mandatory Mandatory Mandatory
21 of which: existence of redemption incentive mechanism
No No No No No No
22 of which: noncumulative or cumulative Noncumulative Noncumulative Noncumulative Noncumulative Noncumulative Noncumulative23 Convertible or non-convertible N/A N/A N/A Non-convertible Non-convertible Non-convertible

176 China Construction Bank Corporation Half-Year Report 2015
Appendix: Composition of Capital
No.Main features of eligible regulatory capital instruments H Share A Share Rights issues
Tier 2 capital instrument
Tier 2 capital instrument
Tier 2 capital instrument
24 of which: if convertible, specify conversion trigger (s)
N/A N/A N/A N/A N/A N/A
25 of which: if convertible, specify if it is fully or partially
N/A N/A N/A N/A N/A N/A
26 of which: if convertible, specify conversion rate
N/A N/A N/A N/A N/A N/A
27 of which: if convertible, specify if it is mandatory or optional conversion
N/A N/A N/A N/A N/A N/A
28 of which: if convertible, specify instrument type convertible into
N/A N/A N/A N/A N/A N/A
29 of which: if convertible, specify issuer of instrument it converts into
N/A N/A N/A N/A N/A N/A
30 Write-down feature N/A N/A N/A Yes Yes Yes31 of which: if write-down,
specify write-down trigger(s)N/A N/A N/A Wr ite-down is
triggered at the earlier of followings: (1) CBRC determines issuer cannot survive if no write-down is conducted; (2) related authorities confirm that issuer cannot survive if public capital injection or equivalent support will not be offered.
Wr ite-down is triggered at the earlier of followings: (1) CBRC determines issuer cannot survive if no write-down is conducted; (2) related authorities confirm that issuer cannot survive if public capital injection or equivalent support will not be offered.
Wr ite-down is triggered at the earlier of followings: (1) CBRC determines issuer cannot survive if no write-down is conducted; (2) related authorities confirm that issuer cannot survive if public capital injection or equivalent support will not be offered.
32 of which: if write-down, specify if it is full or partial
N/A N/A N/A Full Full Full
33 of which: if write-down, specify if it is permanent or temporary
N/A N/A N/A Permanent Permanent Permanent
34 of which: if temporary write-down, specify the description of write-up mechanism
N/A N/A N/A N/A N/A N/A
35 Hierarchy of claims in liquidation (specify instrument type immediately senior to instrument)
the lowest priority of all claims
the lowest priority of all claims
the lowest priority of all claims
th e lower priority behind the depositor and general creditor, the same priority with other Tier 2 debt
th e lower priority behind the depositor and general creditor, the same priority with other Tier 2 debt
th e lower priority behind the depositor and general creditor, the same priority with other Tier 2 debt
36 Non-eligible transitioned features No No No No No No37 of which: if yes, specify non-eligible
featuresN/A N/A N/A N/A N/A N/A
We have included in this report certain forward-looking statements with respect to our financial position, operating results and business development. We use words such as “will”, “may”, “expect”, “try”, “strive”, and similar expressions to identify forward-looking statements. These statements are based on current plans, estimates and projections. Although we believe that the expectations reflected in these forward-looking statements are reasonable, we can give no assurance that those expectations will prove to have been correct, and you are cautioned not to place undue reliance on such statements. Readers are cautioned that a number of factors could cause actual results to differ, in some instances materially, from those anticipated or implied in forward-looking statements. These factors include, among others: changes in general economic conditions in the markets in which the Group operates, changes in the government’s adjustments and control policies and in laws and regulations, and factors specific to the Group.
These forward-looking statements in this report do not constitute a substantive commitment by the Group to its investors. Investors should be aware of the investment risks. During the reporting period, we proactively took measures to effectively manage various risks. For more information, please refer to “Management Discussion and Analysis” in the “Risk Management”.