half year report 2017 - u-blox€¦ · korea, pakistan, singapore, sweden, taiwan, united kingdom...
TRANSCRIPT

HALF YEAR REPORT 2017
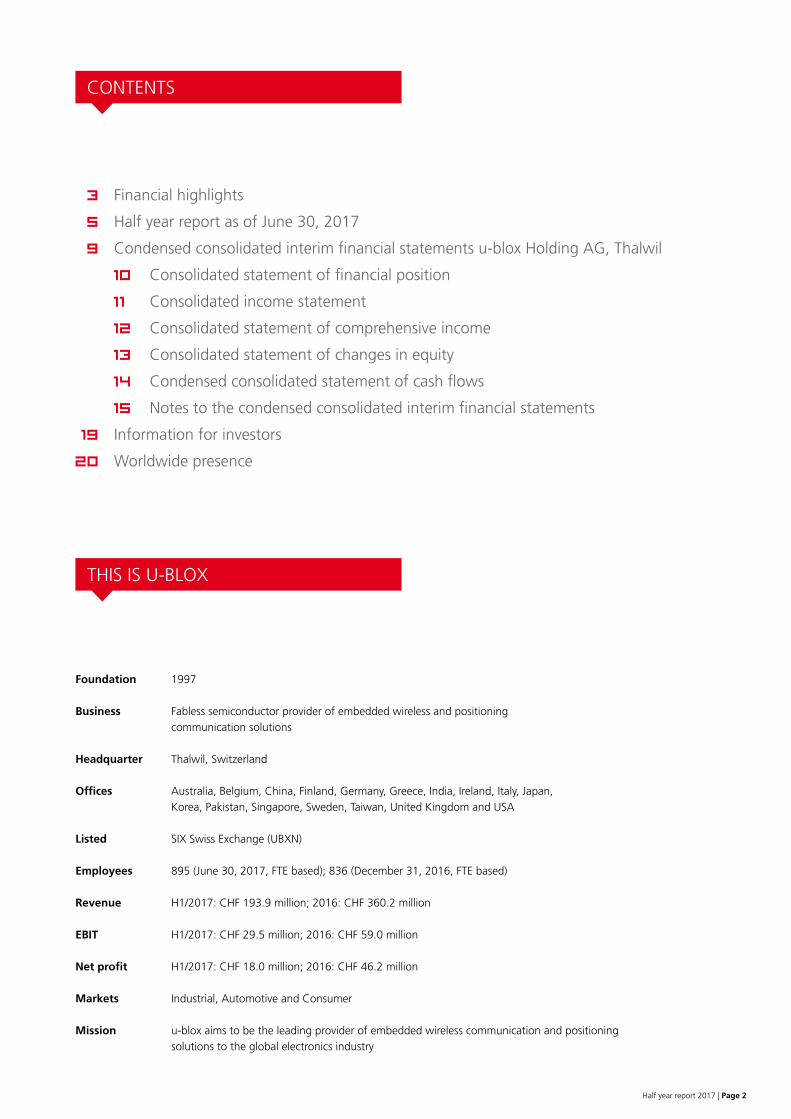
Foundation 1997
Business Fabless semiconductor provider of embedded wireless and positioning communication solutions
Headquarter Thalwil, Switzerland
Offices Australia, Belgium, China, Finland, Germany, Greece, India, Ireland, Italy, Japan, Korea, Pakistan, Singapore, Sweden, Taiwan, United Kingdom and USA
Listed SIX Swiss Exchange (UBXN)
Employees 895 (June 30, 2017, FTE based); 836 (December 31, 2016, FTE based)
Revenue H1/2017: CHF 193.9 million; 2016: CHF 360.2 million
EBIT H1/2017: CHF 29.5 million; 2016: CHF 59.0 million
Net profit H1/2017: CHF 18.0 million; 2016: CHF 46.2 million
Markets Industrial, Automotive and Consumer
Mission u-blox aims to be the leading provider of embedded wireless communication and positioning solutions to the global electronics industry
Half year report 2017 | Page 2
CONTENTS
3 Financial highlights
5 Half year report as of June 30, 2017
9 Condensed consolidated interim financial statements u-blox Holding AG, Thalwil
10 Consolidated statement of financial position
11 Consolidated income statement
12 Consolidated statement of comprehensive income
13 Consolidated statement of changes in equity
14 Condensed consolidated statement of cash flows
15 Notes to the condensed consolidated interim financial statements
19 Information for investors
20 Worldwide presence
THIS IS U-BLOX

193.9
58.1
29.5
18.0
45.1
Revenue in m CHF
Equity ratio in %
Operating profit in m CHF
Net profit in m CHF
Gross profit in %
Revenue H1/2016: 179.7 – Growth rate: 7.9%
22.1
Operating cashflow in m CHF
Operating cashflow H1/2016: 26.3 – Growth rate: -16.0%
Equity ratio 2016: 67.0%
Operating profit H1/2016: 27.8 – Growth rate: 6.1%
Net profit H1/2016: 18.5 – Growth rate: -2.6%
Gross profit in % H1/2016: 45.9
Financial highlights
Total equity Equity ratio, % of total assets
Total equity and equity ratio in m CHF
300
250
200
150
100
50
02014 2015 2016 H1/2015
Page 3 | Financial highlights
21370.5%
64.2%
285
67.0%
Americas EMEAAPAC EBITDA
Revenue by geography / EBITDA in m CHF
350
300
250
200
150
100
50
02014 2015 2016 H1/2015 H1/2016
78.758.648%
27%
25%
270.0
338.3
48%
29%
23%
u-blox revenue split per market Employee breakdown spread over 17 countries
75% of employees based outside Switzerland
Total: 895
Logistics, admin 15% (133)
Sales, marketing,support 18% (161)
Research &development67% (601)
(End of H1/2017, FTE based)(Estimate)
Automotive
Consumer
Industrial
40.3
193.9
53%
21%
26%
H1/2017 H1/2016 H1/2017
254275
58.1%
248
81.8
360.2
50%
25%
25%
36.5
29%
25%
161.9
46%39.1
179.7
46%
28%
26%
218
63.9%
65.4%

This is u-blox | Page 4
This is u-blox
Positioning & Wireless• Fleet management• Remote monitoring and control• Automatic meter reading• Point-of-sales• Remote displays• Remote security and surveillance• Unmanned Aerial Vehicles
Positioning & Wireless• In-car navigation• Stolen vehicle recovery• Emergency call• Car connectivity telematics• Vehicle black-box
Positioning & Wireless• Wearables• Personal navigation devices• Notebooks and mobile internet devices• Cameras• Person locators
Technologies• GSM/GPRS• CDMA• UMTS/HSPA• LTE
Cellularmodules
Industrial
Short rangemodules
Automotive
Positioningchips & modules
Consumer
Technologies• Bluetooth• Bluetooth low energy• Wi-Fi• Multiradio
Technologies• GPS• GLONASS• BeiDou• Galileo• QZSS
OUR TECHNOLOGIES
OUR MARKETS

u-blox firmly on track for sustained growth and profitability
2017 half-year highlights
• u-blox posted an encouraging 7.9% increase in revenues from CHF 179.7 million to CHF 193.9 million.
• EBIT rose by 6.1% to CHF 29.5 million, representing a margin of 15.2%.
• Operating activities generated a cash flow of CHF 22.1 million, 11.4% of revenue.
• Net profit saw a 2.6% decrease to CHF 18.0 million, a net profit margin of 9.3% (H1 2016: 10.3%).
• u-blox finalized a CHF 60 million bond issue (6 years, interest 1.375%) supporting the continued strategic development of the company.
• A surge of new and prospective products consolidates u-blox’s leading position in the industry.
• Full-year revenue and EBIT expectations remain unchanged.
Remark: All numbers in this report are IFRS based. Adjusted numbers are provided in the last table to this report.
Thalwil, Switzerland – August 24, 2017 – u-blox (SIX:UBXN), a global leader in wireless and positioning modules and chips, today announced results for the first half year. The company maintained a strong financial performance, posting a 7.9% increase in revenues, which, combined with the effectiveness of u-blox’s strategic approach, helped to further solidify profitability. During the first half of 2017, consolidated revenues stood at CHF 193.9 million.
u-blox registered another increase in gross profit from CHF 82.5 million to CHF 87.4 million, with gross profit margin remaining high at 45.1%. Operating profit (EBIT) was up from CHF 27.8 to CHF 29.5 million, representing an improvement of 6.1% over the same period last year, while the EBITDA margin stood at 20.8%. There was a 2.6% decrease in net profit, which declined from CHF 18.5 million in 2016 to CHF 18.0 million, due to foreign exchange impact. Net cash flow from operations was CHF 22.1 million, which represented 11.4% of revenue. The balance sheet remained solid, with a healthy equity ratio of 58.1%.
All these figures underscore u-blox’s ability to meet medium to long-term revenue and profit targets. A full pipeline of new products and developments is likewise a firm indication of potential future growth.
Revenue development and breakdownThe first half of 2017 showed continued growth in u-blox’s positioning & wireless products segment.
Consolidated revenues from chips and modules for positioning and wireless connectivity rose by 7.9% from CHF 179.5 million in the first half of 2016 to CHF 193.8 million during the first half of 2017. Revenue growth was slightly negatively impacted by -0.3% foreign exchange decay. Wireless services (including intra-Group sales) generated CHF 12.3 million in revenues compared with CHF 15.1 million for the same period last year.
During the first half of 2017, u-blox reported an overall increase of revenues of 7.9%, with Asia-Pacific accounting for 53.4%, EMEA for 25.7% and the Americas for 20.9%. Asia Pacific
reported 25.3% growth over first half year 2016 to CHF 103.4 million, EMEA by 8.5% to CHF 49.9 million and Americas revenues decreased by 20.7% to CHF 40.6 million. When compared to second half year 2016, the growth rates amounted to 8.0% for Asia-Pacific, 9.1% for EMEA and 3.9% for Americas.
Strong growth in AsiaIn Asia, the economic environment was strong, with production capacity in the electronics industry running at limits. Our revenues grew by 25.3%, driven by strong product sales in all categories. Several customers reported large-scale operational expansion, while new applications, such as wearables and the smart bike also boosted our revenues. In the Americas, business declined by 20.7% as a direct result of the slowdown in 2016, which led to lower business activity at the beginning of the year. Compared with the second half of 2016, however, revenue increased again. The migration to new LTE-based cellular standards generated new traction as the industry has now opted for the M1 standard for M2M applications. There was a strong increase in sales of LTE-based modules, with sales of CDMA-based products declining. Demand in the automotive sector remained buoyant. The EMEA region delivered a 8.5% growth in revenues over the first half of 2016. Strong demand in the industrial and automotive sectors drove business forward. In-car communication and navigation, smart meters, industrial controls, road pricing and asset tracking guaranteed expanding business. u-blox maintained a wide customer base during the first half of 2017, generating around 80% of its total revenue from 74 customers, with the largest accounting for 5.3%. The company extended its operations to various new markets and regions, and supplied products and services to 5’700 customers.
In all regions, u-blox pursued a record number of new business opportunities, driven by general interest in the Internet of Things (IoT).
Increased gross profit Gross profit saw a 5.9% improvement during the first six months, taking it from CHF 82.5 million in the same period last year to CHF 87.4 million. Gross profit margin stood at 45.1%, a small decline over first half year 2016.
Research and product development In the first half of 2017, R&D expenses stood at CHF 32.0 million, or 16.5% of revenue. These figures compare with CHF 32.1 million and 17.9%, respectively, during the same period in 2016.
Distribution and marketing activities Wide-ranging expansion in our operations drove distribution and marketing expenses up from CHF 15.9 million to CHF 17.2 million. This figure is equivalent to 8.8% of revenue, compared with 8.8% during the same period last year.
Further increase in profit u-blox posted EBIT of CHF 29.5 million, or 15.2% during the first half of 2017, which compares favorably with the CHF 27.8 million or 15.5%, in 2016. The EBITDA margin was 20.8%.
Finance income and costs Finance income totaled CHF 0.3 million, while finance costs
Half year report as of June 30, 2017
Page 5 | Letter to the shareholders

amounted to CHF 7.0 million, due mainly to negative unrealized foreign currency impacts, and interest on the bonds issued in 2015 and 2017.
Strong financial position u-blox maintained a strong balance sheet during the first half of 2017, the equity ratio amounted to 58.1% influenced by the purchase of treasury shares during the period. Cash, cash equivalents and marketable securities totaled CHF 168.6 million as of June 30, 2017, compared with CHF 157.1 million on December 31, 2016. Also u-blox carries treasury shares in the amount of CHF 24.4 million; shares that will serve the employee stock options program. In 2017, u-blox placed a fixed-rate domestic straight bond worth CHF 60 million. The issue will further increase the company’s financial flexibility and ability for strategic action.
Strategic highlights and initiativesu-blox is pleased to report that u-blox remains on course for sustained growth and profitability thanks to a time-tested strategy that is founded on four discrete pillars: ongoing strengthening of our leading market position; continuing technological development and innovation; outstanding operational performance, and strategic partnerships. During the first half of 2017, u-blox made significant advances in all three of its key strategic technology areas: positioning, cellular, and short range.
In February, the company announced the launch of a groundbreaking, super-low-power GNSS receiver chip for wearable applications. The new super-efficient chip offers a unique balance of performance and ultra-low power use, cutting power consumption by two-thirds to just 20 mW, while supplying one positional update every second with virtually no loss of accuracy.
This was followed in May by the world’s smallest quad-band LTE Cat M1 module. M1 is one of the new LTE standards for M2M solutions. Carriers in the US have selected this standard and are now expanding coverage on a broad scale.
Finally, in June, u-blox announced it was accelerating deployment of its VERA-P1 series V2X communication modules for Advanced Driver Assistance Systems, which are designed to make vehicles safer and increase the level of automation. All major car OEMs put considerable effort in this new functionality.
In addition to product news, in the beginning of the second half of 2017, u-blox announced a new strategic initiative with Sapcorda Services GmbH. Later in 2017, Sapcorda will be entering into a joint venture with Bosch, Geo++ and Mitsubishi which will bring high precision GNSS positioning services to mass market applications and facilitate the establishment of a worldwide available and affordable solution for system integrators, EOMs and receiver manufacturers. New product rundownIn the first six months, u-blox released several new products designed to meet its customers’ wide-ranging and continuously evolving needs. These products are vital in our range of offerings developed, designed and produced to keep the company at the forefront of existing markets, while enabling u-blox to make inroads into future markets. Below follow details of some of the first six months’ new product highlights.
The ultra-small, multi-GNSS ZOE-M8G module launched in January is an ideal location sensor for wearables, drones and asset trackers.
(in CHF 000s)Jan. - June 2017
(unaudited) % revenueJan. - June 2016
(unaudited) % revenueJan. - Dec. 2016
(audited) % revenue
Revenue 193’908 100.0% 179’688 100.0% 360’230 100.0%
Cost of sales -106’518 -54.9% -97’205 -54.1% -193’123 -53.6%
Gross profit 87’390 45.1% 82’483 45.9% 167’107 46.4%
Distribution and marketing expenses -17’157 -8.8% -15’886 -8.8% -32’032 -8.9%
Research and development expenses -31’957 -16.5% -32’092 -17.9% -63’490 -17.6%
General and administrative expenses -9’593 -4.9% -7’878 -4.4% -14’614 -4.1%
Other income 845 0.4% 1’216 0.7% 2’033 0.6%
Operating profit (EBIT) 29’528 15.2% 27’843 15.5% 59’004 16.4%
Financial income 309 0.2% 123 0.1% 4’337 1.2%
Finance costs -6’979 -3.6% -3’016 -1.7% -1’653 -0.5%
Profit before income tax (EBT) 22’858 11.8% 24’950 13.9% 61’688 17.1%
Income tax expense -4’846 -2.5% -6’453 -3.6% -15’488 -4.3%
Net profit, attributable to owners of the parent 18’012 9.3% 18’497 10.3% 46’200 12.8%
Operating profit (EBIT) 29’528 15.2% 27’843 15.5% 59’004 16.4%
Depreciation and amortization 10’730 5.5% 11’301 6.3% 22’762 6.3%
EBITDA1) 40’258 20.8% 39’144 21.8% 81’766 22.7%
1) Management calculates EBITDA (earnings before interest, taxes, depreciation and amortization) by adding back depreciation and amortization to operating profit (EBIT), in each case determined in accordance with IFRS.
Table 1: consolidated income statement
Letter to the shareholders | Page 6

It offers exceptionally high performance and was designed for markets where very small size, minimal weight and high location precision are essential. It simplifies product design because it can be used with passive antennas, eliminating the need for additional components. In January, u-blox announced the launch of JODY-W1, a host-based automotive Wi-Fi and Bluetooth module with Real Simultaneous Dual Band (RSDB) support that is ideal for in-vehicle infotainment
and telematics applications requiring high data rates and concurrent connectivity.
The two NINA-W1 Wi-Fi modules introduced in March comply with all the latest security standards and are the most advanced of their kind for industrial markets. With ultra-low power consumption they are ideal for Wi Fi applications including telematics, low-power sensors, connected buildings, points of sale, and health devices.
(in CHF 000s)Jan. - June 2017
(unaudited)Jan. - June 2016
(unaudited)Jan. - Dec. 2016
(audited)
Net cash provided by operating activities 22‘061 26‘256 93‘559
Net cash used in investing activities -27’914 -19’622 -45’711
Net cash provided by financing activities 26’021 -11’581 -10’515
Net increase/(decrease) in cash and cash equivalents 20‘168 -4‘947 37‘333
Cash and cash equivalents at beginning of period 149’545 112’387 112’387
Effect of exchange rate fluctuations on cash and cash equivalents -5’928 -175 -175
Cash and cash equivalents at end of period 163‘785 107‘265 149‘545
Table 3: consolidated statement of financial position (condensed)
(in CHF 000s) At June 30, 2017
(unaudited)At December 31, 2016
(audited)
ASSETSCurrent assets
Cash and cash equivalents 163’785 149’545
Marketable securities 4’831 7’573
Other assets 98’186 82’462
Total current assets 266’802 239’580
Non-current assets
Property, plant and equipment 15’570 15’774
Intangible assets 186’790 166’009
Financial assets 1’139 1’074
Deferred tax assets 2’458 2’435
Total non-current assets 205’957 185’292
Total assets 472’759 424’872
LIABILITIES AND EQUITY
Current liabilities 57’307 59’098
Non-current liabilities 140’676 81’047
Total liabilities 197’983 140’145
Shareholders’ equity
Share capital 6’238 6’152
Share premium 65’180 74’387
Retained earnings 203’358 204’188
Total equity, attributable to owners of the parent 274’776 284’727
Total liabilities and equity 472’759 424’872
Page 7 | Letter to the shareholders
Table 2: consolidated statement of cash flows (condensed)

Adjustments
(in CHF 000s) (IFRS) % revenue
Share based payments
Pension impact based on
IAS-19Non-recurring
expenses
Amortization intangible assets
acquired (adjusted) % revenue (adjusted) % revenue
Revenue 193'908 100.0% 193'908 100.0% 179'688 100.0%
Cost of sales -106'518 -54.9% 387 -106'131 -54.7% -96'873 -53.9%
Gross Profit 87'390 45.1% 387 0 0 0 87'777 45.3% 82'815 46.1%
Distribution and marketing expenses -17'157 -8.8% 509 272 -16'376 -8.4% -14'775 -8.2%
Research and development expenses -31'957 -16.5% 2'683 264 946 -28'064 -14.5% -29'155 -16.2%
General and administrative expenses -9'593 -4.9% 478 666 563 -7'886 -4.1% -5'775 -3.2%
Other income 845 0.4% 845 0.4% 1'216 0.7%
Operating Profit (EBIT) 29'528 15.2% 4'057 666 827 1'218 36'296 18.7% 34'326 19.1%
Financial income 309 0.2% 309 0.2% 123 0.1%
Finance costs -6'979 -3.6% -6'979 -3.6% -3'016 -1.7%
Profit before income tax (EBT) 22'858 11.8% 4'057 666 827 1'218 29'626 15.3% 31'433 17.5%
Income tax expense -4'846 -2.5% -1'079 -5'925 -3.1% -6'287 -3.5%
18'012 9.3% 2'978 666 827 1'218 23'701 12.2% 25'146 14.0%
Earnings per share in CHF 2.61 3.44 3.72 Diluted earnings per share in CHF 2.57 3.39 3.62
Operating Profit (EBIT) 29'528 15.2% 4'057 666 827 1'218 36'296 18.7% 34'326 19.1%
Depreciation and amortization 10'730 5.5% -1'218 9'512 4.9% 10'022 5.6%
EBITDA 1) 40'258 20.8% 4'057 666 827 0 45'808 23.6% 44'348 24.7%
0
Net profit, attributable to owners of the parent
Jan. - June 2017Jan. - June 2017 Jan. - June 2016
Letter to the shareholders | Page 8
Fritz Fahrni Thomas Seiler Chairman of the Board of Directors CEO
In June, u-blox announced its TOBY-L4 LTE modules, a new series of secure, advanced automotive telematics modules with powerful embedded CPU that provide fully integrated gateway solution for automotive OEMs enabling data, voice, positioning, eCall and advanced telematics. They meet all current industry and carrier requirements for high data transmission capacity.
Revenue by reporting segmentsu-blox operates in two segments:
• Positioning and wireless products u-blox develops and sells chips and modules for positioning
and wireless connectivity that are used in automotive, industrial and consumer applications. Revenue was CHF 193.8 million for the first half of 2017 compared with CHF 179.5 million during the same period last year.
• Wireless services u-blox also offers wireless communication technology services
in the form of reference designs and software. In the first semester, revenue for wireless services was CHF 12.3 million compared with CHF 15.1 million in the first half of 2016 (including intra-group revenue, recorded on newly defined basis).
Table 4: Consolidated Income Statement (adjusted)
Adjusted numbers are provided below for allowing comparison with industry peers.
1) Management calculates EBITDA (earnings before interest, taxes, depreciation and amortization) by adding back depreciation and amortization to operating profit (EBIT), in each case determined in accordance with IFRS.
Board and management membersThere were no changes in the board and management during the period under review.
OutlookFor 2017, u-blox anticipates EBIT as before of between CHF 60 million and CHF 65 million, based on revenue predictions of between CHF 410 million and CHF 425 million, with unchanged assumptions for foreign exchange rates. Medium to long-term perspectives expect continued growth.

u-blox Holding AG, ThalwilCondensed consolidated interimfinancial statements June 30, 2017
Page 9 | Financial summary

These condensed interim financial statements should be read in conjunction with the accompanying notes.
Consolidated statement of financial position
Financial summary | Page 10
(in CHF 000s) NoteJune 30, 2017
(unaudited)December 31, 2016
(audited)
Assets
Current assets
Cash and cash equivalents 163’785 149’545
Marketable securities 4’831 7’573
Trade accounts receivables 46’084 39’792
Other receivables 10’710 8’065
Current tax assets 811 640
Inventories 37’916 31’571
Prepaid expenses and accrued income 2’665 2’394
Total current assets 266’802 239’580
Non-current assets
Property, plant and equipment 15’570 15’774
Goodwill 54’621 54’104
Other intangible assets 132’169 111’905
Financial assets 1’139 1’074
Deferred tax assets 2’458 2’435
Total non-current assets 205’957 185’292
Total assets 472’759 424’872
Liabilities and equity
Current liabilities
Trade accounts payables 17’748 19’435
Other payables 4’665 5’970
Current tax liabilities 15’430 11’461
Provisions 813 1’611
Accrued expenses 18’645 20’621
Derivative financial liabilities 6 0
Total current liabilities 57’307 59’098
Non-current liabilities
Non-derivative financial liabilities 118’787 59’414
Other payables 494 833
Provisions 7’333 4’887
Pension liability 12’778 13’717
Deferred tax liabilities 1’284 2’196
Total non-current liabilities 140’676 81’047
Total liabilities 197’983 140’145
Shareholders’ equity
Share capital 6’238 6’152
Share premium 65’180 74’387
Treasury shares -24’422 0
Cumulative translation differences -15’130 -15’018
Retained earnings 242’910 219’206
Total equity, attributable to owners of the parent 274’776 284’727
Total liabilities and equity 472’759 424’872

Consolidated income statement
(in CHF 000s) NotesJan. - June 2017
(unaudited)Jan. - June 2016
(unaudited)
Revenue 193’908 179’688
Cost of sales -106’518 -97’205
Gross profit 87’390 82’483
Distribution and marketing expenses -17’157 -15’886
Research and development expenses -31’957 -32’092
General and administrative expenses -9’593 -7’878
Other income 845 1’216
Operating profit (EBIT) 29’528 27’843
Financial income 309 123
Finance costs -6’979 -3’016
Profit before income tax (EBT) 22’858 24’950
Income tax expense -4’846 -6’453
Net profit 18’012 18’497
Basic earnings per share (in CHF) 2.61 2.73
Diluted earnings per share (in CHF) 2.57 2.67
These condensed interim financial statements should be read in conjunction with the accompanying notes.
Page 11 | Financial summary

Consolidated statement of comprehensive income
(in CHF 000s)Jan. - June 2017
(unaudited)Jan. - June 2016
(unaudited)
Net profit for the period 18’012 18’497
Other comprehensive income:
Remeasurements on net pension liability 1’566 -2’306
Income tax on remeasurements on net pension liability -305 479
Items that will not be reclassified to income statement 1’261 -1’827
Currency translation differences -112 -2’947
Items that are or may be reclassified subsequently to income statement -112 -2’947
Other comprehensive income for the period, net of taxes 1’149 -4’774
Total comprehensive income, attributable to owners of the parent 19’161 13’723
These condensed interim financial statements should be read in conjunction with the accompanying notes.
Financial summary | Page 12
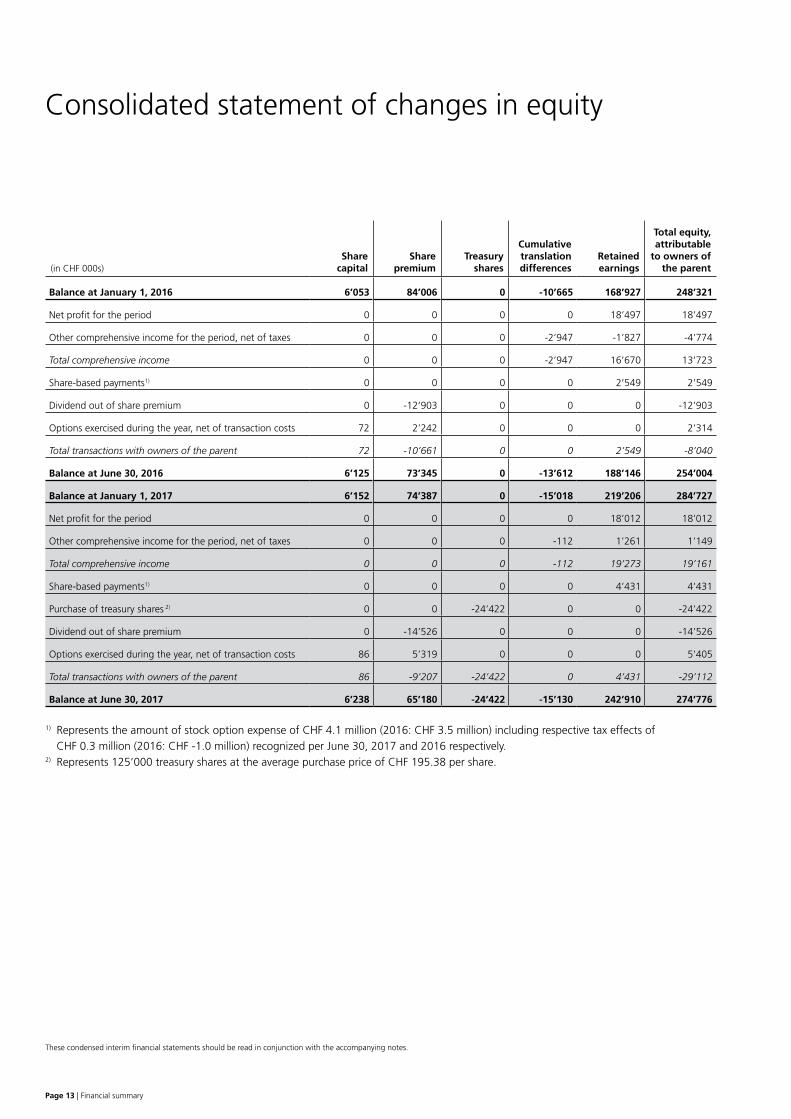
Consolidated statement of changes in equity
These condensed interim financial statements should be read in conjunction with the accompanying notes.
(in CHF 000s)Share
capitalShare
premiumTreasury
shares
Cumulative translation differences
Retained earnings
Total equity,attributable
to owners of the parent
Balance at January 1, 2016 6’053 84’006 0 -10’665 168’927 248’321
Net profit for the period 0 0 0 0 18’497 18’497
Other comprehensive income for the period, net of taxes 0 0 0 -2’947 -1’827 -4’774
Total comprehensive income 0 0 0 -2’947 16’670 13’723
Share-based payments1) 0 0 0 0 2’549 2’549
Dividend out of share premium 0 -12’903 0 0 0 -12’903
Options exercised during the year, net of transaction costs 72 2’242 0 0 0 2’314
Total transactions with owners of the parent 72 -10’661 0 0 2’549 -8’040
Balance at June 30, 2016 6’125 73’345 0 -13’612 188’146 254’004
Balance at January 1, 2017 6’152 74’387 0 -15’018 219’206 284’727
Net profit for the period 0 0 0 0 18’012 18’012
Other comprehensive income for the period, net of taxes 0 0 0 -112 1’261 1’149
Total comprehensive income 0 0 0 -112 19’273 19’161
Share-based payments1) 0 0 0 0 4’431 4’431
Purchase of treasury shares 2) 0 0 -24’422 0 0 -24’422
Dividend out of share premium 0 -14’526 0 0 0 -14’526
Options exercised during the year, net of transaction costs 86 5’319 0 0 0 5’405
Total transactions with owners of the parent 86 -9’207 -24’422 0 4’431 -29’112
Balance at June 30, 2017 6’238 65’180 -24’422 -15’130 242’910 274’776
1) Represents the amount of stock option expense of CHF 4.1 million (2016: CHF 3.5 million) including respective tax effects of CHF 0.3 million (2016: CHF -1.0 million) recognized per June 30, 2017 and 2016 respectively.2) Represents 125’000 treasury shares at the average purchase price of CHF 195.38 per share.
Page 13 | Financial summary

Condensed consolidated statement of cash flows
These condensed interim financial statements should be read in conjunction with the accompanying notes.
(in CHF 000s)Jan. - June 2017
(unaudited)Jan. - June 2016
(unaudited)
Net cash generated from operating activities 22‘061 26‘256
Net cash used in investing activities -27’914 -19’622
Net cash generated from/(used in) financing activities 26‘021 -11‘581
Net increase/(decrease) in cash and cash equivalents 20‘168 -4‘947
Cash and cash equivalents at beginning of period 149’545 112’387
Effect of exchange rate fluctuations on cash and cash equivalents -5’928 -175
Cash and cash equivalents at end of period 163‘785 107‘265
1) Net cash used in investing activities consists of investments into property, plant and equipment of CHF 4.3 million (June 30, 2016 CHF 3.3 million) and investments into intangible assets of CHF 26.7 million (June 30, 2016 CHF 17.8 million) in the first half year 2017.
2) Net cash provided by financing activities contains proceeds from issuance of a bond of 59.3 million net cash inflow (see Note 4 on page 17) and the exercise of employee stock options of CHF 5.4 million (June 30, 2016 CHF 2.3 million), the dividend payment out of reserves from capital contributions of CHF 14.5 million (June 30, 2016 CHF 12.9 million) and the purchase of treasury shares of CHF 24.4 million (June 30, 2016: none) for the employee share option program.
1)
2)
Financial summary | Page 14
1)
2)

Notes to the condensed consolidated interim financial statements
Page 15 | Financial summary
1 Basis of preparation of the condensed consolidated
interim financial statements
The condensed consolidated interim financial statements of u-blox Holding AG (‘u-blox’ or the ‘Group’) were prepared in accordance with IAS 34 “Interim Financial Reporting”. These condensed consolidated interim financial statements do not include all the notes contained in the consolidated annual financial statements, and for that reason should be read in conjunction with the consolidated annual financial statements for the year ended December 31, 2016.
The condensed consolidated interim financial statements have been prepared in Swiss francs (CHF), rounded to the nearest thousand.
The preparation of the condensed consolidated interim financial statements requires management judgments, estimates and assumptions that affect the application of policies and reported amounts of assets and liabilities, income and expenses as well as disclosure of contingent assets and liabilities.Although these judgments, estimates and assumptions are based on management’s best knowledge of current events and actions, actual results may ultimately differ from those estimates.
In these condensed consolidated interim financial statements significant estimates and assumptions made by management are not different from those disclosed in the consolidated financial statements for the year ended December 31, 2016.
Income taxes are recognized based on best estimate of the weighted average annual tax rate for 2017. The Group operates in markets where no significant seasonal or cyclical variations in revenue are experienced during the financial year.
For the condensed consolidated interim financial statements, a EUR/CHF exchange rate of 1.095 and a USD/CHF exchange rate of 0.959 was applied at the end-of-period (December 31, 2016 EUR/CHF 1.0727, USD/CHF 1.0194). For the period an average exchange rate of EUR/CHF 1.076 and USD/CHF 0.994 was applied (previous period: EUR/CHF 1.105, USD/CHF 0.997).
Changes in accounting policiesIn 2017, u-blox has not adopted any new International Financial Reporting Standards (IFRS).
The accounting policies applied in the condensed consolidated interim financial statements are consistent with those used in the consolidated financial statements for the year ended December 31, 2016.
The year end assessment for IFRS 15 has changed from mainly additional disclosures to no or no significant impacts expected on the consolidated financial statements of u-blox.
In 2017, u-blox acquired an interest rate swap which is initially measured at fair value; directly attributable transaction costs are recognized in profit and loss as incurred. Subsequent to initial recognition, the derivative is recognized in profit and loss.
As of January 1, 2016, u-blox adopted various amended International Financial Reporting Standards (IFRS), none of which have a material impact on the consolidated financial statements of u-blox.

2 Segment information
Positioning andWireless products
Wireless services
Totalsegments
Non-allocated/eliminations Group
January – June January – June January – June January – June January – June
(in CHF 000s) 2017 2016 2017 2016 2017 2016 2017 2016 2017 2016
Revenue third 193’815 179’546 93 142 193’908 179’688 0 0 193’908 179’688
Revenue intragroup 0 0 12’172 14’944 12’172 14’944 -12’172 -14’944 0 0
Total revenue 193’815 179’546 12’265 15’086 206’080 194’632 -12’172 -14’944 193’908 179’688
EBITDA 39’728 36’098 367 3’244 40’095 39’342 163 -198 40’258 39’144
Depreciation -3’397 -3’063 -1’056 -923 -4’453 -3’986 0 0 -4’453 -3’986
Amortization -6’253 -7’292 -24 -23 6’277 -7’315 0 0 -6’277 -7’315
EBIT 30’078 25’743 -713 2’298 29’365 28’041 163 -198 29’528 27’843
Financial income 309 123
Finance costs -6’979 -3’016
EBT 22’858 24’950
June 30,2017
Dec 31,2016
June 30,2017
Dec 31,2016
June 30,2017
Dec 31,2016
June 30,2017
Dec 31,2016
June 30,2017
Dec 31,2016
Assets 273’901 242’879 26’644 21’366 300’546 264’245 172’213 160’627 472’759 424’872
Financial summary | Page 16

Page 17 | Financial summary
3 Acquisition of subsidiary
No business combination took place during the six month period that ended June 30, 2017. u-blox and SIM Technology Group terminated the asset purchase agreement and technology assignment contract per May 22, 2017. This asset deal was disclosed as a post balance sheet event in the financial report 2016. In 2016 no business combination took place.
4 Non- and derivative financial liabilities
On April 18, 2017, u-blox issued a bond for CHF 60.0 million (net cash inflow of CHF 59.3 million) with a coupon of 1.375% p.a. and a 6 year term to maturity. On the same date, u-blox entered into an interest swap contract over CHF 30.0 million with a maturity of 6 years.
5 Finance cost
As in the previous year, the main part of the finance cost consists of interest expenses for the bond and foreign exchange losses.
6 Financial instruments
The following table shows the carrying amount of all financial instruments per category. With the exception of financial liabilities, they correspond, approximately, to the fair values in accordance with IFRS. The fair value of financial liabilities is disclosed in the table “Fair value hierarchy”.
(in CHF 000s)Carrying amount
June 30, 2017Carrying amount
Dec 31, 2016
Cash and cash equivalents 163’785 149’545
Trade accounts receivable 46’084 39’792
Other receivables 10’710 8’065
Accrued income 4 1’544
Financial assets 1’139 1’074
Loans and receivables 57’937 50’475
Marketable securities 4’831 7’573
Financial assets at fair value through profit or loss 4’831 7’573
Trade accounts payable 17’748 19’435
Other payables 4’172 4’739
Accrued expenses 9’129 7’663
Non-derivative financial liabilities 118’787 59’414
Liabilities at amortized costs 149’836 91’251
Other payables - contingent consideration 343 751
Derivative financial liabilities 6 0
Liabilities at fair value through profit and loss 349 751

Financial summary | Page 18
7 Dividend
On April 25, 2017 the Annual General Meeting of u-blox Holding AG approved a gross dividend of CHF 2.10 per share. A total dividend amount of CHF 14.5 million was paid out on May 3, 2017.
8 Guarantees, pledges in favor of third parties and
other contingent liabilities
At June 30, 2017 and December 31, 2016 there were no guarantees in favour of third parties. The group is not exposed to any significant other contingent liabilites. There is no known threatened or pending litigation against any group company.
9 Subsequent events
There have been no events between June 30, 2017 and the date of authorization of these condensed consolidated interim financial statements that would lead to an adjustment of the carrying amounts of assets and liabilities presented as of June 30, 2017 or would otherwise have to be disclosed.
The Board of Directors authorized on August 24, 2017 these condensed consolidated interim financial statements for publication.
Fair value hierarchyThe different levels of financial instruments carried at fair value or for which the fair value is disclosed have been defined as follows in the table below:Level 1: quoted prices (unadjusted) in active markets for identical assets or liabilities.Level 2: inputs other than quoted prices included within level 1 that are observable for the asset or the liability, either directly (i.e. as prices) or indirectly (i.e. derived from prices).Level 3: inputs for assets or liabilities that are not based on observable market data (unobservable inputs).
June 30, 2017Carrying amounts Fair value
(in CHF 000s) Total Level 1 Level 2 Level 3
Marketable securities 4’831 4’831 0 0
Total assets 4’831 4’831 0 0
Other payables - contingent consideration 343 0 0 343
Non-derivative financial liabilities 118’787 123’690 0 0
Derivative financial liabilities 6 0 6 0
Total liabilities 119’130 123’690 6 343
December 31, 2016(in CHF 000s) Total Level 1 Level 2 Level 3
Marketable securities 7’573 7’573 0 0
Total assets 7’573 7’573 0 0
Other payables - contingent consideration 751 0 0 751
Financial liabilities 59’414 61’650 0 0
Total liabilities 60’165 61’650 0 751
Page 19 | Financial summary
Information for investors
u-blox Holding AG
Corporate address
Investor relations
Website
Financial calendar
Ticker details for u-blox shares• Listing SIX Swiss Exchange• Ticker symbol UBXN• ISIN-No. CH0033361673• Swiss Security-No. 3336167• Reuters UBXN.S• Bloomberg UBXN:SW
u-blox Holding AGZürcherstrasse 688800 ThalwilSwitzerlandPhone +41 44 722 74 44Fax +41 44 722 74 47
Thomas SeilerChief Executive OfficerE-mail: [email protected]
Roland JudChief Financial Officer E-mail: [email protected]
www.u-blox.com
• Full year results 2017 March 15, 2018• Annual General Meeting April 24, 2018

Information for investors | Page 20
Disclaimer This document contains certain forward-looking statements. Such forward-looking statements reflect the current views of management and are subject to known and unknown risks,uncertainties and other factors that may cause actual results, performance or achievements of the u-blox Group to differ materially from those expressed or implied. These include risks relatedto the success of and demand for the Group’s products, the potential for the Group’s products to become obsolete, the Group’s ability to defend its intellectual property, the Group’s ability todevelop and commercialize new products in a timely manner, the dynamic and competitive environment in which the Group operates, the regulatory environment, changes in currency exchangerates, the Group’s ability to generate revenues and profitability, and the Group’s ability to realize its expansion projects in a timely manner. Should one or more of these risks or uncertaintiesmaterialize, or should underlying assumptions prove incorrect, actual results may vary materially from those described in this report. u-blox is providing the information in this release as of thisdate and does not undertake any obligation to update any forward-looking statements contained in it as a result of new information, future events or otherwise.
ImprintPublisher / Copyright: August 2017 u-blox Holding AG, Thalwil, Switzerland.
Worldwide presence
R&D centerEspoo, FIMalmö, SEReigate, UKCambourne, UKLuton, UKCork, IELeuven, BE
R&D centerBerlin, GermanySgonico, ItalyAthens, GreeceLahore, Pakistan
Americas regional officeReston, Virginia, USA
R&D centerSan Diego, CA, USA
Corporate headquarters EMEA regional officeR&D centerThalwil, Switzerland
APAC regional officeSingapore
APAC area offices
Beijing, China
Seoul, Korea
Tokyo, Japan
Osaka, Japan
Shanghai, China
Chongqing, China
Taipei, Taiwan
Shenzhen, China
Bangalore, India
Sydney, Australia

u-blox Holding AGZürcherstrasse 688800 ThalwilSwitzerlandPhone +41 44 722 74 44Fax +41 44 722 74 47www.u-blox.com