half year report - financials
TRANSCRIPT


HALF YEAR REPORTFOR THE SIX MONTH PERIOD ENDED 30 JUNE 2018

Hal
f Yea
r re
port
Jan
uar
Y - J
un
e 20
18
2

3
Board of Directors
Mr. Roberto Longo ChairmanMr. Muhammad Imran Malik Chief ExecutiveMr. Cesar Alex Panduro Arevalo DirectorMr. Toh Guan Kiat DirectorMr. Kamal Monnoo DirectorMr. Muhammad Maqbool DirectorMr. Ijaz Ahmad Chaudhry DirectorMr. Shahid Anwar (Nominee of NIT) DirectorMr. Aamir Amin (Nominee of NIT) Director Audit Committee
Mr. Muhammad Maqbool ChairmanMr. Mr.Roberto Longo MemberMr. Ijaz Ahmad Chaudhry Member Human Resource and Remuneration Committee
Mr. Ijaz Ahmad Chaudhry ChairmanMr. Muhammad Imran Malik MemberMr. Muhammad Maqbool Member Chief Financial Officer (CFO)
Mr. Cesar Alex Panduro Arevalo Company Secretary
Mr. Amjad Farooq Auditors
A.F. Ferguson & Co. (a member firm of PwC Network)23-C, Aziz Avenue, Canal Bank, Gulberg V, Lahore. Legal Advisor
Surridge & Beecheno 60, Shahrah-e-Quaid-e-Azam, Ghulam Rasool Building,Lahore. Stock Exchange Listing
Bata Pakistan Limited is listed onPakistan Stock Exchange. The Company’s shares are quoted in leading Newspapers under “Leather and Tanneries” sector.
Bankers
Habib Bank Limited Habib Metropolitan Bank Limited MCB Bank Limited Bank Al Habib Limited National Bank of Pakistan Limited United Bank Limited
Registered Office
Batapur,G. T. Road,P.O. Batapur, Lahore.
Share Registrar
Corplink (Pvt.) Ltd.Wings Arcade, 1-K Commercial Area,Model Town, Lahore. Factories
Batapur,
G. T. Road,P.O. Batapur, Lahore.Lahore.
Maraka,
26 - Km, Multan Road,Lahore.
Liaison Office
138 C-II Commercial Area,P.E.C.H.S., Tariq Road,Karachi.
CORPORATE INFORMATION

Hal
f Yea
r re
port
Jan
uar
Y - J
un
e 20
18
4
It is my pleasure to present the un-audited condensed interim financial statements and brief review of the Company’s
operations for the half year ended 30 June 2018.
The Company turnover in the period under review was Rs. 8.298 billion as compared to Rs. 7.829 billion for the corresponding
period of last year showing a growth of 6%. Profit after tax increased from Rs. 707.3 million to Rs. 712.9 million and earnings
per share increased from Rs. 93.56 to Rs. 94.30.
Retail division showed a significant growth of 8% during the period with current setup and was able to achieve improvement
in turnover with respect to corresponding period. Our non-retail division also showed a slight improvement in turnover
during this period as compared to corresponding period which was in line with the plan of 2018. They are striving to develop
new products and customers base to achieve growth.
Our production facilities at Batapur and Maraka remained fully loaded to meet the demand and to produce value added
products for differentiation. We are continually making investment in new moulds, the majority of which proved very
successful in the marketplace.
Our precedence remains to satisfy the demand of our valued customers and provide them with services exclusively and
efficiently. In order to maintain our role as a leader in footwear industry, an amount of Rs. 118.535 million has been spent
for opening new and renovation of existing stores. Our focus as a part of our strategy will remain on expansion of big format
stores by closing low turnover and non-profitable stores which are under minimum benchmark.
The Company continued its Corporate Social Responsibilities (CSR) activities during the period under review and donated
511 pairs of shoes to underprivileged children studying in different schools. Arranged mentorship session in CDG Girls High
School Nawab Pura Lahore with the help of our volunteers who inspired the students in career counselling and personality
building. To promote a sense of belonging and caring, our volunteers spent quality time with orphans / abandoned children
of SOS Hermann Gmeiner School Johar Town Lahore and presented them with gifts. Training of employees has always been
considered as an investment for the future with the objective to provide them with safe and healthy work place.
We remain confident as regards to our prospects for the remaining year, despite the highly competitive marketing environment.
We look forward to continued support from all our stakeholders to achieve the objectives for the year 2018.
On behalf of the Board
Batapur: (Muhammad Imran Malik)
Lahore: 30 August 2018 Chief Executive
DIRECTORS’ REVIEW

5
������ �� ��ا��

Hal
f Yea
r re
port
Jan
uar
Y - J
un
e 20
18
6
Introduction
We have reviewed the accompanying condensed interim statement of financial position of Bata Pakistan Limited as at
June 30, 2018 and the related condensed interim statement of profit or loss and other comprehensive income, condensed
interim statement of changes in equity, and condensed interim statement of cash flows, and notes to the financial statements
for the six-month period then ended (here-in-after referred to as the “interim financial statements”). Management is
responsible for the preparation and presentation of these interim financial statements in accordance with accounting and
reporting standards as applicable in Pakistan for interim financial reporting. Our responsibility is to express a conclusion on
these interim financial statements based on our review. The figures of the condensed interim profit and loss account for the
quarters ended March 31, 2018 and 2017 have not been reviewed, as we are required to review only the cumulative figures
for the six-month period ended June 30, 2018.
Scope of Review
We conducted our review in accordance with International Standard on Review Engagements 2410, “Review of Interim
Financial Information Performed by the Independent Auditor of the Entity”. A review of interim financial statements consists
of making inquiries, primarily of persons responsible for financial and accounting matters, and applying analytical and other
review procedures. A review is substantially less in scope than an audit conducted in accordance with International Standards
on Auditing and consequently does not enable us to obtain assurance that we would become aware of all significant matters
that might be identified in an audit. Accordingly, we do not express an audit opinion.
Conclusion
Based on our review, nothing has come to our attention that causes us to believe that the accompanying interim financial
statements are not prepared, in all material respects, in accordance with the accounting and reporting standards as applicable
in Pakistan for interim financial reporting.
The engagement partner on the audit resulting in this independent auditor’s report is Amer Raza Mir.
Other Matter
These condensed interim financial statements of the Company for the six-months ended June 30, 2017 and the annual
financial statements of the Company for the year ended December 31, 2017 were reviewed and audited by another firm of
Chartered Accountants who vide their reports dated August 24, 2017 and March 15, 2018 expressed an unmodified conclusion
and unmodified opinion thereon respectively.
A.F. FERGUSON & CO
Chartered Accountants
Lahore: August 30, 2018
INDEPENDENT AUDITOR’S REVIEW REPORT
To the members of Bata Pakistan Limited
Report on review of Interim Financial Statements

7
Chief Financial OfficerDirectorChief Executive
CONDENSED INTERIM STATEMENT OF FINANCIAL POSITION - UNAUDITED AS AT JUNE 30, 2018
(UN - AUDITED) (AUDITED) June 30, December 31, Note 2018 2017
(Rupees in ‘000) ASSETS NON-CURRENT ASSETS Property, plant and equipment 6 1,603,543 1,511,909 Intangible assets 1,059 1,713 Long term investments 7 45,001 45,000 Long term deposits and prepayments 40,309 35,557
1,689,912 1,594,179 CURRENT ASSETS Stores and spare parts 27 – Stock in trade 8 4,434,163 3,482,354 Trade debts - unsecured 1,927,832 1,563,635 Advances - unsecured 236,462 432,424 Deposits and short term prepayments 254,637 74,386 Other receivables 457,992 721,636 Interest accrued 802 1,751 Short term investment 600,000 550,000 Sales tax refunds due from Government 391,660 493,823 Cash and bank balances 9 611,592 610,138
8,915,167 7,930,147 TOTAL ASSETS 10,605,079 9,524,326 SHARE CAPITAL AND RESERVES
Authorized share capital
10,000,000 (December 31, 2017: 10,000,000) ordinary shares of Rs. 10 each 100,000 100,000
Issued, subscribed and paid up capital
7,560,000 (December 31, 2017: 7,560,000) ordinary shares of Rs. 10 each 75,600 75,600
Reserves Capital reserve 483 483 Revenue reserves 7,309,968 7,050,641
7,310,451 7,051,124
7,386,051 7,126,724 NON-CURRENT LIABILITIES Long term deposits 45,001 45,000 Deferred liability - employee benefits 10 76,201 76,030 Deferred taxation 51,382 40,799
172,584 161,829 CURRENT LIABILITIES Trade and other payables 2,692,548 1,640,756 Short term borrowings 11 – – Provision for taxation 353,896 595,017
3,046,444 2,235,773 CONTINGENCIES AND COMMITMENTS 12 TOTAL EQUITY AND LIABILITIES 10,605,079 9,524,326 The annexed notes from 1 to 20 form an integral part of this interim financial statement.

Hal
f Yea
r re
port
Jan
uar
Y - J
un
e 20
18
8
Chief Financial OfficerDirectorChief Executive
Six month period ended Three month period ended
June 30, June 30, June 30, June 30, Note 2018 2017 2018 2017
(Rupees in ‘000)
NET SALES 13 8,298,127 7,828,929 5,240,759 4,765,416COST OF SALES 14 4,677,192 4,539,133 2,941,763 2,777,126
GROSS PROFIT 3,620,935 3,289,796 2,298,996 1,988,290 Distribution Cost 1,834,969 1,674,417 1,049,684 935,439 Administrative Expenses 544,785 486,312 279,885 251,824 Other expenses 104,153 85,273 81,774 57,265
2,483,907 2,246,002 1,411,343 1,244,528 OTHER INCOME 23,927 47,073 11,645 16,001 OPERATING PROFIT 1,160,955 1,090,867 899,298 759,763 FINANCE COST 23,847 21,444 12,715 11,044 PROFIT BEFORE TAXATION 1,137,108 1,069,423 886,583 748,719 PROVISION FOR TAXATION Current 413,598 380,226 320,559 274,036 Deferred 10,583 (18,147) 24,423 (9,974)
424,181 362,079 344,982 264,062
PROFIT AFTER TAXATION 712,927 707,344 541,601 484,657 Other comprehensive income – – – – TOTAL COMPREHENSIVE INCOME 712,927 707,344 541,601 484,657 EARNINGS PER SHARE - BASIC AND DILUTED 17 Rs. 94.30 Rs. 93.56 Rs. 71.64 Rs. 64.11
The annexed notes from 1 to 20 form an integral part of this interim financial statement.
CONDENSED INTERIM STATEMENT OF PROFIT OR LOSS AND OTHER COMPREHENSIVE INCOME - UNAUDITEDFOR THE SIX MONTH PERIOD ENDED JUNE 30, 2018
9
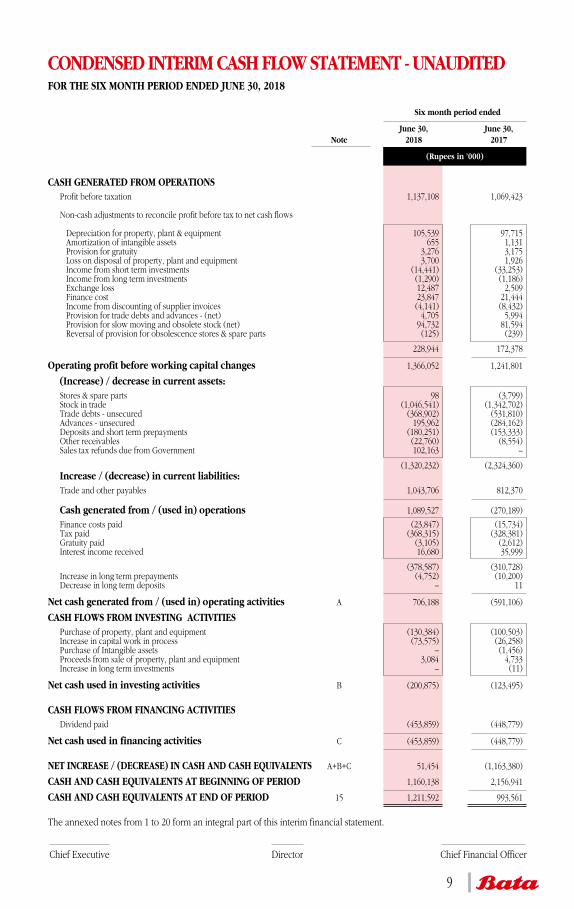
CONDENSED INTERIM CASH FLOW STATEMENT - UNAUDITEDFOR THE SIX MONTH PERIOD ENDED JUNE 30, 2018
Six month period ended
June 30, June 30, Note 2018 2017
(Rupees in ’000)
CASH GENERATED FROM OPERATIONS Profit before taxation 1,137,108 1,069,423 Non-cash adjustments to reconcile profit before tax to net cash flows Depreciation for property, plant & equipment 105,539 97,715 Amortization of intangible assets 655 1,131 Provision for gratuity 3,276 3,175 Loss on disposal of property, plant and equipment 3,700 1,926 Income from short term investments (14,441) (33,253) Income from long term investments (1,290) (1,186) Exchange loss 12,487 2,509 Finance cost 23,847 21,444 Income from discounting of supplier invoices (4,141) (8,432) Provision for trade debts and advances - (net) 4,705 5,994 Provision for slow moving and obsolete stock (net) 94,732 81,594 Reversal of provision for obsolescence stores & spare parts (125) (239)
228,944 172,378
Operating profit before working capital changes 1,366,052 1,241,801
(Increase) / decrease in current assets: Stores & spare parts 98 (3,799) Stock in trade (1,046,541) (1,342,702) Trade debts - unsecured (368,902) (531,810) Advances - unsecured 195,962 (284,162) Deposits and short term prepayments (180,251) (153,333) Other receivables (22,760) (8,554) Sales tax refunds due from Government 102,163 –
(1,320,232) (2,324,360) Increase / (decrease) in current liabilities: Trade and other payables 1,043,706 812,370 Cash generated from / (used in) operations 1,089,527 (270,189)
Finance costs paid (23,847) (15,734) Tax paid (368,315) (328,381) Gratuity paid (3,105) (2,612) Interest income received 16,680 35,999
(378,587) (310,728) Increase in long term prepayments (4,752) (10,200) Decrease in long term deposits – 11
Net cash generated from / (used in) operating activities A 706,188 (591,106)
CASH FLOWS FROM INVESTING ACTIVITIES
Purchase of property, plant and equipment (130,384) (100,503) Increase in capital work in process (73,575) (26,258) Purchase of Intangible assets – (1,456) Proceeds from sale of property, plant and equipment 3,084 4,733 Increase in long term investments – (11)
Net cash used in investing activities B (200,875) (123,495)
CASH FLOWS FROM FINANCING ACTIVITIES
Dividend paid (453,859) (448,779)
Net cash used in financing activities C (453,859) (448,779)
NET INCREASE / (DECREASE) IN CASH AND CASH EQUIVALENTS A+B+C 51,454 (1,163,380)
CASH AND CASH EQUIVALENTS AT BEGINNING OF PERIOD 1,160,138 2,156,941
CASH AND CASH EQUIVALENTS AT END OF PERIOD 15 1,211,592 993,561
The annexed notes from 1 to 20 form an integral part of this interim financial statement.
Chief Financial OfficerDirectorChief Executive

Hal
f Yea
r re
port
Jan
uar
Y - J
un
e 20
18
10
Share Capital General Unappropriated Total capital reserve reserve profits
(Rupees in 000)
Balance as at January 01, 2017 75,600 483 5,634,000 952,511 6,662,594 Final dividend for the year ended December 31, 2016 at the rate of Rs. 60 per share – – – (453,600) (453,600) Transfer to general reserve for the year ended December 31, 2016 – – 498,000 (498,000) – Total comprehensive income for the six month period ended June 30, 2017 – – – 707,344 707,344 Balance as at June 30, 2017 75,600 483 6,132,000 708,255 6,916,338 Balance as at January 01, 2018 75,600 483 6,132,000 918,641 7,126,724 Final dividend for the year ended December 31, 2017 at the rate of Rs. 60 per share – – – (453,600) (453,600) Transfer to general reserve for the year ended December 31, 2017 – – 465,000 (465,000) – Total comprehensive income for the six month period ended June 30, 2018 – – – 712,927 712,927 Balance as at June 30, 2018 75,600 483 6,597,000 712,968 7,386,051 The annexed notes from 1 to 20 form an integral part of this interim financial statement.
CONDENSED INTERIM STATEMENT OF CHANGES IN EQUITY - UNAUDITEDFOR THE SIX MONTH PERIOD ENDED JUNE 30, 2018
Chief Financial OfficerDirectorChief Executive

11
NOTES TO THE CONDENSED INTERIM FINANCIAL STATEMENTS - UNAUDITEDFOR THE SIX MONTH PERIOD ENDED JUNE 30, 2018
1 LEGAL STATUS AND OPERATIONS
Bata Pakistan Limited (the Company) was incorporated in Pakistan as a public limited company and its shares are quoted on Pakistan Stock Exchange. The registered office of the Company is situated at Batapur, Lahore. The principal activity of the Company is manufacturing and sale of footwear of all kinds along with sale of accessories and hosiery items. The parent company of Bata Pakistan Limited is Bafin B.V. (Nederland), whereas the ultimate parent is Compass Limited, Bermuda.
2 STATEMENT OF COMPLIANCE
These condensed interim financial statements have been prepared in accordance with the accounting and reporting standards as applicable in Pakistan for interim financial reporting. The accounting and reporting standards as applicable in Pakistan for interim financial reporting comprise of:
- International accounting standard (IAS) 34, Interim Financial Reporting, issued by the International Accounting Standard Board (IASB) as notified under the Companies Act, 2017; and
- Provisions of and directives issued under the Companies Act, 2017.
Where the provisions of and directives issued under the Companies Act, 2017 differ with the requirements of IAS 34, the provision of and directives issued under the Companies Act, 2017 have been followed.
3 BASIS OF PRESENTATION AND MEASUREMENT
These condensed interim financial statements of the Company for the six month period ended June 30, 2018 are unaudited but subject to limited scope review. These condensed interim financial statements do not include all the statements required for annual financial statements including financial risk management statements and therefore should be read in conjunction with annual financial statements for the year ended December 31, 2017.
The financial statements have been prepared under the historic cost convention. The financial statements are prepared in Pak Rupees, which is the functional currency of the Company. Figures have been rounded off to the nearest thousand rupee unless otherwise specified.
4 STANDARDS, AMENDMENTS AND INTERPRETATIONS TO PUBLISHED ACCOUNTING STANDARDS
4.1 Standards, amendments and interpretations to existing standards effective in current period
Certain standards, amendments and interpretations to approved accounting standards are effective for the annual period beginning on or after July 01, 2017 but are considered not to be relevant or to have any significant effect on the Company’s operations and are, therefore, not detailed in these condensed interim financial statements.
4.2 Standards, amendments and interpretations to existing standards that are not yet effective and have not been early adopted by the Company
Certain standards, amendments and interpretations to approved accounting standards are mandatory for the annual periods beginning on or after July 01, 2018, but are considered not to be relevant or to have any significant effect on the Company’s operations and are, therefore, not detailed in these condensed interim financial statements; except for the following:
– IFRS 15, ‘Revenue from contracts with customers’: This standard has been notified by the SECP to be effective for annual periods beginning on or after July 1, 2018. This standard deals with revenue recognition and establishes principles for reporting useful statements to users of the financial statements about the nature, amount, timing and uncertainty of revenue and cash flows arising from an entity’s contracts with customers. Revenue is recognized when a customer obtains control of a good or service and thus has the ability to direct the use and obtain the benefits from the good or service. The standard replaces IAS 18, ‘Revenue’ and IAS 11, ‘Construction contracts’, and related interpretations. The Company is yet to assess the full impact of the standard.
– IFRS 16, ‘Leases’; (effective for periods beginning on or after January 1, 2019). However, this standard is yet to be notified by the SECP. This standard replaces the current guidance in IAS 17. Leases and is a far reaching change in accounting by lessees in particular. Under IAS 17, lessees were required to make a distinction between a finance lease (on statement of financial position) and an operating lease (off statement of financial position). IFRS 16 now requires lessees to recognize a lease liability reflecting future lease payments and a ‘‘right - of - use’’ asset for virtually all lease contracts. The IASB has included an optional exemption for certain short term leases and leases of low value assets; however, this exemption can only be applied by lessees. For lessors, the accounting stays almost the same. However, as the IASB has updated the guidance on the definition of a lease (as well as the guidance on the combination and separation of contracts), lessors will also be affected by the new standard. At the very least, the new accounting model for lessees is expected to impact negotiations between lessors and lessees. The Company is yet to assess the full impact of the standard.
5 SIGNIFICANT ACCOUNTING POLICIES
These accounting policies and method of computation adopted in the preparation of these condensed interim financial statements are the same as those applied in preparation of the annual audited and published financial statements for the year ended December 31, 2017 except as described below:
– The nomenclature of primary statements has been changed to align it with the requirements of the Companies Act, 2017.
– Income tax expense is recognized based on management’s best estimate of the weighted average income tax rate expected for the full financial year.

Hal
f Yea
r re
port
Jan
uar
Y - J
un
e 20
18
12
NOTES TO THE CONDENSED INTERIM FINANCIAL STATEMENTS - UNAUDITEDFOR THE SIX MONTH PERIOD ENDED JUNE 30, 2018
(UN - AUDITED) (AUDITED)
June 30, December 31, Note 2018 2017
(Rupees in ’000)
6 PROPERTY, PLANT AND EQUIPMENT
Property, plant and equipment 6.1 1,535,967 1,502,756 Capital work in progress 6.2 67,576 9,153
1,603,543 1,511,909 6.1 Opening Net Book Value (NBV) 1,502,756 1,415,822 Add: Additions/transfers during the period 6.1.1 145,535 311,326
1,648,291 1,727,148
Less: Disposals during the period (at NBV) 6.1.1 6,785 17,143 Depreciation charged during the period 105,539 207,249
112,324 224,392
1,535,967 1,502,756 6.1.1 (UN - AUDITED) (AUDITED)
June 30, June 30, December 31, December 31, 2018 2018 2017 2017
Additions Disposal (NBV) Additions Disposal (NBV)
(Rupees in ‘000)
Buildings - Factory 6,051 – 7,722 – - Others – 8 – – Plant & Machinery 1,400 261 41,609 3,380 Boiler – – 4,010 82 Gas Installations 23 – – – Office Equipment – – 153 – Furniture, Fixture and Fittings 120,012 6,338 238,214 12,991 Computers 18,049 52 19,618 437 Vehicles – 126 – 253
145,535 6,785 311,326 17,143 (UN - AUDITED) (AUDITED)
June 30, December 31, 2018 2017
(Rupees in ’000) 6.2 Opening balance 9,153 4,935 Add: Additions during the period 73,575 44,830
82,728 49,765 Less: Transfers during the period 15,152 40,612
67,576 9,153

13
NOTES TO THE CONDENSED INTERIM FINANCIAL STATEMENTS - UNAUDITEDFOR THE SIX MONTH PERIOD ENDED JUNE 30, 2018
(UN - AUDITED) (AUDITED)
June 30, December 31, Note 2018 2017
(Rupees in ’000)
7 LONG TERM INVESTMENTS
Held to maturity at cost
PLS Term Deposit Receipts 7.1 45,001 45,000
7.1 These deposits are earmarked against the balances due to employees held as securities and personal accounts maintained with commercial banks undertaking conventional banking services. These carry mark-up at the rate of 6.00% (2017: 6.00%) per annum.
8 STOCK IN TRADE
This represents net amount after adjustment for provision against slow moving and obsolete stock amounting to Rs. 134.739 million (2017: Rs. 81.594 million).
(UN - AUDITED) (AUDITED)
June 30, December 31, Note 2018 2017
(Rupees in ’000) 9 CASH AND BANK BALANCES
Bank balances in Current accounts - Foreign currency 17,764 16,163 - Local currency 14,802 53,579
32,566 69,742 Daily profit accounts 9.1 488,043 434,311
9.2 520,609 504,053 Cash in transit 87,488 104,902 Cash in hand - Foreign currency 2,258 366 - Local currency 1,237 817
3,495 1,183
611,592 610,138
9.1 The rate of mark-up on these accounts ranges from 3.90% to 5.50% (2017: 3.88% to 5.50%) per annum.
9.2 These balances are maintained with commercial banks undertaking conventional banking services.
(UN - AUDITED) (AUDITED)
June 30, December 31, 2018 2017
(Rupees in ’000)
10 DEFERRED LIABILITY- EMPLOYEE BENEFITS
Opening liability 76,030 72,150 Amount recognized during the period/year 3,276 6,024 Payment made by the Company during the period/year (3,105) (4,796) Experience Adjustment – 2,652
Closing liability 76,201 76,030 The latest actuarial valuation was carried out as at December 31, 2017.

Hal
f Yea
r re
port
Jan
uar
Y - J
un
e 20
18
14
11 SHORT TERM BORROWINGS
The credit facilities available to the Company from various commercial banks aggregate to Rs. 710 million (2017: Rs. 700 million). These include cash finance facilities of Rs. 675 million ( 2017: Rs. 665 million) and export finance facility of Rs. 35 million (2017: Rs. 35 million).
Mark up on cash finance ranges from 3 months KIBOR plus 0.50% to 1.0% (2017: 3 months KIBOR plus 0.50% to 1.0%)
as per agreements with banks. While mark up on export finance is charged at 4.00% (2017: 4.00%) per annum. In addition, non funded facilities of letters of guarantee and letters of credit amounting to Rs. 495 million (2017:
Rs. 495 million) were also provided by these banks. The un-utilized facility for letter of credits and guarantees at year end amounts to Rs. 479 million (2017: Rs. 261 million).
These finances are secured against hypothecation of stock in trade, store and spares and receivables of the Company
amounting to Rs. 1,194 million ( 2017: Rs. 1,194 million). (UN - AUDITED) (AUDITED)
June 30, December 31, Note 2018 2017
(Rupees in ’000) 12 CONTINGENCIES AND COMMITMENTS
12.1 The Company is contingently liable for:
Counter Guarantees given to banks 15,960 16,512 Indemnity Bonds given to Custom Authorities 32,459 9,800 Claims not acknowledged as debts - under appeal 14,183 13,183 Order by sales tax department 138,851 138,851 Order by sales tax department - under appeal 265,252 265,252 Order by sales tax department - under appeal 237,370 237,370 Order by sales tax department - under appeal 25,820 25,820 Order by income tax department - under appeal 954,859 954,859 Order by income tax department - under appeal 1,027,460 1,027,460 Order by sales tax department - under appeal 80,000 80,000 Order by sales tax department - under appeal 52,134 52,134 Order by sales tax department - under appeal 8,225 8,225 Show cause notice by sales tax department 85,000 85,000 Order by income tax department-under appeal 12.1.1 617,721 363,683 Order by sales tax department - under appeal 60,732 60,732
3,616,026 3,338,881
There is no significant change in contingencies since the date of preceding published annual financial statements except the following:
12.1.1 Subsequent to the closing period, on July 18, 2018, the Company received an assessment order from Additional Commissioner Inland Revenue (ACIR) for the tax year 2010, in addition to Order dated June 27, 2016 amounting to Rs. 363.6 million. Based on proration of expenses and adding back provision/liabilities, the ACIR created a demand of Rs. 254.038 million. The Company is in process of filing an appeal with Commissioner (Appeals). The Company, based on the opinion of the tax advisor, expects a favorable outcome.
(UN - AUDITED) (AUDITED)
June 30, December 31, 2018 2017
(Rupees in ’000)
12.2 Commitments in respect of:
- Capital expenditure 11,522 14,801 - Letters of credit and bank contracts 176,575 513,632
188,097 528,433
NOTES TO THE CONDENSED INTERIM FINANCIAL STATEMENTS - UNAUDITEDFOR THE SIX MONTH PERIOD ENDED JUNE 30, 2018

15
(UN - AUDITED)
Six month period ended Three month period ended
June 30, June 30, June 30, June 30, 2018 2017 2018 2017
(Rupees in ‘000)
13 NET SALES
Shoes and accessories Local 9,635,931 9,128,159 6,102,455 5,584,574 Export 43,436 46,041 26,146 28,295
9,679,367 9,174,200 6,128,601 5,612,869 Sundry articles and scrap material 50,349 57,970 36,166 31,018
9,729,716 9,232,170 6,164,767 5,643,887
Less: Sales tax 616,269 639,557 386,889 390,892 Discount to dealers and distributors 648,854 615,073 436,580 397,960 Commission to agents/business associates 166,466 148,611 100,539 89,619
1,431,589 1,403,241 924,008 878,471
8,298,127 7,828,929 5,240,759 4,765,416 14 COST OF SALES
Raw material consumed 1,743,736 1,948,431 1,000,819 1,005,479 Stores and spares consumed 3,888 6,371 1,678 2,966 Fuel and power 54,928 59,012 28,466 28,323 Salaries, wages and benefits 244,973 258,385 130,030 130,859 Repairs and maintenance 34,303 25,779 24,583 14,055 Insurance 7,573 5,520 3,677 1,786 Depreciation 24,160 23,950 12,140 12,004
2,113,561 2,327,448 1,201,393 1,195,472 Add: Opening goods in process 49,498 40,996 56,259 63,601
2,163,059 2,368,444 1,257,652 1,259,073 Less: Closing goods in process 39,364 63,575 39,364 63,575
Cost of goods manufactured 2,123,695 2,304,869 1,218,288 1,195,498 Add: Opening stock of finished goods 3,269,167 2,698,754 4,076,530 3,515,518 Finished goods purchased 3,426,003 3,375,308 1,788,618 1,905,908
8,818,865 8,378,931 7,083,436 6,616,924 Less: Closing stock of finished goods 4,141,673 3,839,798 4,141,673 3,839,798
4,677,192 4,539,133 2,941,763 2,777,126
(UN - AUDITED)
June 30, June 30, 2018 2017
(Rupees in ’000) 15 CASH AND CASH EQUIVALENTS
Bank balances in - Current accounts 32,566 115,153 - Daily profit accounts 488,043 844,387 Short term investment 600,000 – Cash in transit 87,488 32,635 Cash in hand 3,495 1,386
1,211,592 993,561
NOTES TO THE CONDENSED INTERIM FINANCIAL STATEMENTS - UNAUDITEDFOR THE SIX MONTH PERIOD ENDED JUNE 30, 2018

Hal
f Yea
r re
port
Jan
uar
Y - J
un
e 20
18
16
16 TRANSACTIONS WITH RELATED PARTIES
The related parties comprise of parent company, related group companies, provident fund trusts, directors and key management personnel. Transactions with related parties during the period are as follows:
(UN - AUDITED)
Six month period ended Three month period ended
June 30, June 30, June 30, June 30, 2018 2017 2018 2017
Relationship with Nature of transactions (Rupees in ‘000) the Company
Common control Purchase of goods and companies services 505,601 575,113 124,029 339,451 Sale of goods and services 5,287 908 1,983 516 Dividend paid 307,037 307,037 307,037 307,037 Trade mark license fee 203,667 196,485 127,280 119,494 Management service fee 80,874 69,995 41,022 35,263 IT charges 15,319 14,805 380 3,161 Staff Retirement Contribution to provident Benefits fund trusts 34,622 31,012 17,587 18,277 Staff Retirement Benefits Gratuity paid 3,105 2,613 (11) 786 Key management personnel Remuneration 96,835 48,294 62,706 26,129 All transactions with related parties have been carried out on mutually agreed terms and conditions.
(UN - AUDITED) (AUDITED)
June 30, December 31, 2018 2017
(Rupees in ’000) Period end balances
Receivable from related party 607 1,967 Payable to related party 142,802 98,610 These are in the normal course of business and are interest free.
(UN - AUDITED)
Six month period ended Three month period ended
June 30, June 30, June 30, June 30, 2018 2017 2018 2017
17 EARNINGS PER SHARE - BASIC
AND DILUTED Profit after taxation attributable to ordinary share holders (Rupees in ‘000) 712,927 707,344 541,601 484,657
Weighted average number of ordinary shares - Number (in ‘000) 7,560 7,560 7,560 7,560
Earnings per share - Basic (Rs.) 94.30 93.56 71.64 64.11
17.1 No figure for diluted earnings per share has been disclosed as the Company has not issued any instrument which would have a dilutive impact on earnings per share, when exercised.
NOTES TO THE CONDENSED INTERIM FINANCIAL STATEMENTS - UNAUDITEDFOR THE SIX MONTH PERIOD ENDED JUNE 30, 2018

17
18.
SEG
MEN
T RE
PORT
ING
(UN
- AUD
ITED
)
Six
mon
th p
erio
d en
ded
Re
tail
Who
lesa
le
Expo
rt Ot
hers
To
tal
Ju
ne 30
, 201
8 Ju
ne 30
, 201
7 Ju
ne 30
, 201
8 Ju
ne 30
, 201
7 Ju
ne 30
, 201
8 Ju
ne 30
, 201
7 Ju
ne 30
, 201
8 Ju
ne 30
, 201
7 Ju
ne 30
, 201
8 Ju
ne 30
, 201
7
Ru
pees
in (‘
000)
N
et sa
les
5,9
59,9
79
5,5
26,8
18
2,2
45,8
95
2,1
99,8
62
43,
435
4
6,04
1
48,
818
5
6,20
8
8,2
98,1
27
7,8
28,9
29
In
ter -
segm
ent s
ales
–
–
–
– –
– –
– –
–
To
tal S
ales
5
,959
,979
5
,526
,818
2
,245
,895
2
,199
,862
4
3,43
5
46,
041
4
8,81
8
56,
208
8
,298
,127
7
,828
,929
Se
gmen
t res
ult
befo
re u
nallo
cate
d ex
pens
es
1,4
80,8
74
1,3
13,0
02
379
,075
3
75,0
08
5,0
40
5,1
30
6,7
32
10,
239
1
,871
,721
1
,703
,379
U
nallo
cate
d op
erat
ing
expe
nses
6
30,5
40
574
,312
O
ther
exp
ense
s
1
04,1
53
85,
273
O
ther
inco
me
23,
927
4
7,07
3
O
pera
ting
prof
it
1
,160
,955
1
,090
,867
Fi
nanc
e co
st
2
3,84
7
21,
444
Pr
ofit
befo
re ta
xatio
n
1
,137
,108
1
,069
,423
Ta
xatio
n
4
24,1
81
362
,079
Pr
ofit
afte
r tax
atio
n
7
12,9
27
707
,344
(U
N - A
UDIT
ED)
Th
ree m
onth
per
iod
ende
d
Reta
il W
hole
sale
Ex
port
Othe
rs
Tota
l
Ju
ne 30
, 201
8 Ju
ne 30
, 201
7 Ju
ne 30
, 201
8 Ju
ne 30
, 201
7 Ju
ne 30
, 201
8 Ju
ne 30
, 201
7 Ju
ne 30
, 201
8 Ju
ne 30
, 201
7 Ju
ne 30
, 201
8 Ju
ne 30
, 201
7
Ru
pees
in (‘
000)
Net
sale
s
3,6
07,9
29
3,3
14,8
96
1,5
71,3
05
1,3
91,7
77
26,
145
2
8,29
5
35,
380
3
0,44
8
5,2
40,7
59
4,7
65,4
16
Inte
r - se
gmen
t sal
es
–
–
– –
– –
– –
– –
Tota
l Sal
es
3
,607
,929
3
,314
,896
1
,571
,305
1
,391
,777
2
6,14
5
28,
295
3
5,38
0
30,
448
5
,240
,759
4
,765
,416
Segm
ent r
esul
t be
fore
una
lloca
ted
expe
nses
1
,005
,609
8
58,4
97
301
,543
2
44,6
74
3,2
72
2,9
13
3,4
49
4,1
21
1,3
13,8
73
1,1
10,2
05
Una
lloca
ted
oper
atin
g ex
pens
es
344
,446
3
09,1
78
Oth
er e
xpen
ses
81,
774
5
7,26
5
Oth
er in
com
e
1
1,64
5
16,
001
Ope
ratin
g pr
ofit
899
,298
7
59,7
63
Fina
nce
cost
12,
715
1
1,04
4
Prof
it be
fore
taxa
tion
886
,583
7
48,7
19
Taxa
tion
3
44,9
82
264
,062
Prof
it af
ter t
axat
ion
541
,601
4
84,6
57
NOTES TO THE CONDENSED INTERIM FINANCIAL STATEMENTS - UNAUDITEDFOR THE SIX MONTH PERIOD ENDED JUNE 30, 2018

Hal
f Yea
r re
port
Jan
uar
Y - J
un
e 20
18
18
Chief Financial OfficerDirectorChief Executive
(UN - AUDITED) (AUDITED) (UN - AUDITED) (AUDITED) Segment assets Segment liabilities
June 30, December 31, June 30, December 31, 2018 2017 2018 2017
(Rupees in ‘000)
18.1 SEGMENT ASSETS AND LIABILITIES
Retail 4,480,872 3,570,415 122,140 85,826 Wholesale 2,869,568 2,412,037 35,428 19,253 Export 9,376 8,738 – – Unallocated 3,245,263 3,533,136 3,061,460 2,292,523
10,605,079 9,524,326 3,219,028 2,397,602
19 DATE OF AUTHORIZATION
These interim financial statements were authorized for issue by the Board of Directors on August 30, 2018. 20 CORRESPONDING FIGURES
In order to comply with the requirements of International Accounting Standard 34 - ‘Interim Financial Reporting’, the condensed interim statement of financial position and condensed interim statement of changes in equity have been compared with the balances of annual audited financial statements of the preceding financial year, whereas, the condensed interim profit and loss account, condensed interim statement of comprehensive income, and condensed interim cashflow statement have been compared with the balances of comparable period of immediately preceding financial year.
Corresponding figures have been re-arranged, wherever necessary, for the purposes of comparison. However, no
significant re-arrangements have been made.
NOTES TO THE CONDENSED INTERIM FINANCIAL STATEMENTS - UNAUDITEDFOR THE SIX MONTH PERIOD ENDED JUNE 30, 2018

19
NOTES

Hal
f Yea
r re
port
Jan
uar
Y - J
un
e 20
18
20
NOTES

INVESTORS’ EDUCATIONIn compliance with the Securities and Exchange Commission of Pakistan’s SRO 924(1)/2015 dated September
9, 2015, Investors’ attention is invited to the following information message:
