half-year results nov 2019 - ryanair › wp-content › uploads › ... · buzz, lauda & malta...
TRANSCRIPT

© Ryanair 2014
1
Half-Year Results Nov 2019

2
Europe ’s Favour i te A i r l ine Group
Lowest fare/lowest cost airline group
No 1, Traffic – 153m+ guests (+8%)
No 1, Cover – 239 airports/2,100 routes
Buzz, Lauda & Malta Air join group
EU airline failures/sales accelerate
EU’s greenest, cleanest airline
Lowest cost = structural winner

3
Europe ’s No. 1 Coverage
86 bases
239 airports (60% prim)
Over 2,100 routes
FY20 -Mrs/Bod/Tls (Fr)
-Sen (UK)/Txl (Ger)
-Arm/Geo/Ukr/Turk/Leb
153m guests (+8%)
On track to carry 200m by FY24

4
Avg. Fare Change % > Ryanair
Ryanair €37 -6%
Wizz €47 +3% +27%
easyJet €61 +2% +65%
Norwegian €91 +14% +146%
Lufthansa €176 -10% +376%
IAG €191 -1% +416%
AF/KLM €210 -1% +468%
Avg Competitor Fare €129 +249%
Europe ’s Lowest Fares
(Source: FY results/Annual Reports)

5
€ per pax RYA WIZ EZJ NOR E’Wings LUV
Staff/efficiency (py) 7 (6) 6 (5) 10 (9) 19 (17) 19 (18) 48
Airport & Hand. 7 11 21 19 33 8
Route Charges 5 5 5 7 7 0
Own’ship & maint. 6 15 9 32 21 15
S & M other 4 2* 8 8 34 18
Total 29 39 53 85 114 89
%> Ryanair +34% +83% +193% +293% +207%
Europe ’s Lowest Costs W ins !
* Incl. one-off exceptional gain on aircraft disposals

6
Sep 18 Sep 19
Guests (m) 76.6 85.7 +11%
Rev per Pax €62 €63 +1%
Avg. fare €46 €44 -5%
Ancills per Pax €17 €19 +16%
Unit Costs (ex fuel) €29 €29 +2%
PAT €1.15bn €1.15bn -
EPS €1.00 €1.02 +3%
H1 FY20 Resul ts

7
Cur rent Deve lopments
Lower fares & higher fuel drive airline failures/sales
Cost control & cost leadership maintained
OTP & guest satisfaction improves
Substantial completion of union deals UK/Ger/It/Por/Ire
New Environmental Policy – lower CO2 pax/km
MAX-200s delayed to Q4 – could slip further, slower growth FY21
€700m buyback launched in May, over €250m returned to date
8
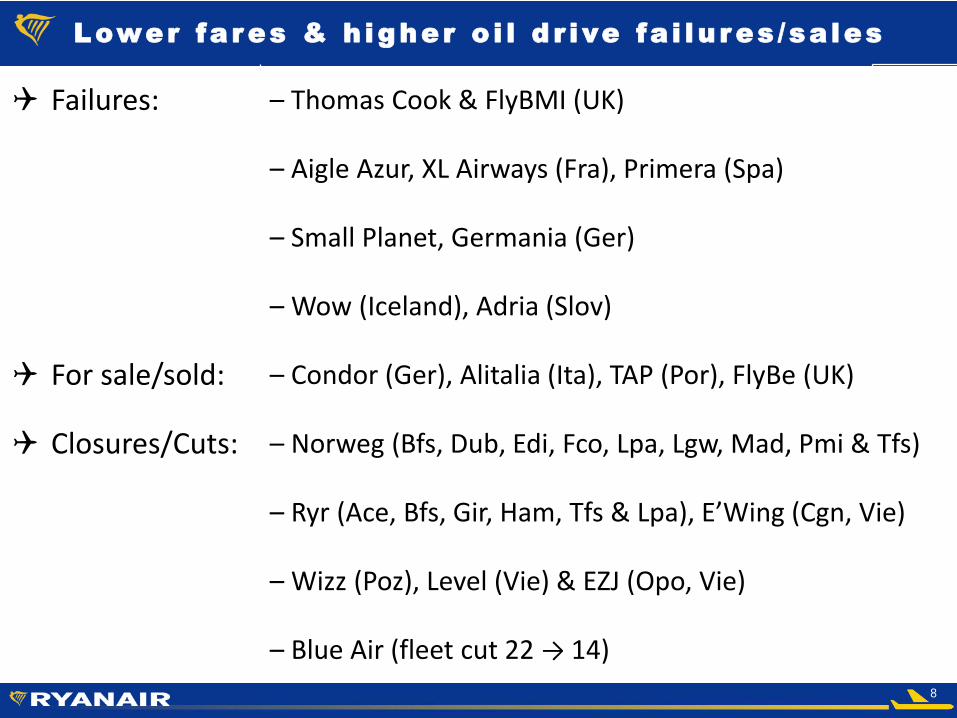
Lower fares & h igher o i l d r ive fa i lu res /sa les
Failures: – Thomas Cook & FlyBMI (UK)
– Aigle Azur, XL Airways (Fra), Primera (Spa)
– Small Planet, Germania (Ger)
– Wow (Iceland), Adria (Slov)
For sale/sold: – Condor (Ger), Alitalia (Ita), TAP (Por), FlyBe (UK)
Closures/Cuts: – Norweg (Bfs, Dub, Edi, Fco, Lpa, Lgw, Mad, Pmi & Tfs)
– Ryr (Ace, Bfs, Gir, Ham, Tfs & Lpa), E’Wing (Cgn, Vie)
– Wizz (Poz), Level (Vie) & EZJ (Opo, Vie)
– Blue Air (fleet cut 22 → 14)

9
`` Buzz Lauda Malta Air Ryanair
Fleet 24 B737 23 A320 6 B737 425 B737
AOC HQ
Polish Warsaw
Austrian Vienna
Maltese Valetta
Irish Dublin
Bases Poland & CEE Aust, Ger & Spa Malta, Ger, Ita & Fra West Europe
CEOMichal
KaczmarzykAndreas Gruber
Diarmuid O’Conghaile
Eddie Wilson
Lowest Cost A i r l ine Group

10
OTP Dr iv ing Guest Sat is fact ion
Investment in handling driving OTP to over 90% (excl. ATC)
OTP improvement = Guest satisfaction at record levels
50%
55%
60%
65%
70%
75%
80%
85%
90%
95%
Q1 FY18 Q2 FY18 Q3 FY18 Q4 FY18 Q1 FY19 Q2 FY19 Q3 FY19 Q4 FY19 Q1 FY20 Q2 FY20
Punctuality
Rate my Trip
Cust Serv
Rostering failure
ATC shortagesstrikes
OTP Improves

11
Substant ia l Un ion Prog ress
Union agreements in all major markets
CLAs agreed in Italy, Ger, UK, Ire, Bel & Port
Ongoing talks in Spain with pilots & c-crew
Strikes in UK, Spa, Port all failed – under 5% support
Surplus pilots & crew – T Cook, Aigle Azur & Adria fail, NAS closures
High pay & industry leading roster (5/4) – attractive employer
Pilot turnover declines to almost zero

12
EU’s C leanest Greenest A i r l ine
First EU Airline to publish CO2 Emissions
Up to 50% lower than BA/Luft/AF
Cut CO2 by 10% to <60g by 2030
“Plastic free” in 5 years (53% now)
Envir taxes €630m in FY20
Vol carbon offset during booking
210 new a/c: cuts fuel 16%, cuts noise 40%

13
Boeing 737MAX update
210 orders (135 firm, 75 options)
Delivs delayed to Mar/Apr – could slip more
20 Max delivs pre S.20 (orig 58)
Slower FY21 growth (162m → 157m)
PDPs frozen – Ongoing Boeing talks
Great aircraft: 4% more seats, 16% less fuel
Grow to 200m guests at lower unit cost

14
FY20 Guidance
153m guests (+8%)
Rev Per Pax up 2% - 3%
Ex fuel unit costs +2%
Fuel +€450m
PAT range €800m to €900m
Subject to H2 fares & Brexit risks

15
Appendices

16
Increased FY21 fue l hedg ing
Jet (met. tonne) FY20 FY21
Q1 $717 (90%) $649 (61%)63% H1
Q2 $718 (90%) $609 (65%)
Q3 $723 (90%) $597 (63%)64% H2
Q4 $667 (90%) $597 (65%)
FY $709 (90%) $614 (63%)
FY21 Based on 157m guests, €120m saving at current spot prices
€/$ FY20 FY21
Opex hedge $1.23 (90%) $1.18 (84%)

17
Shareholder Retur ns €6 .9bn
Buyback Spec Divs Total
(€m) (€m) (€m)
FY08 – 11 346 500 846
FY12 – 14 674 492 1,166
FY15 112 520 632
FY16 1,104 1,104
FY17 1,018 1,018
FY18 829 829
FY19 560 560
FY20 700 700
Total 5,343 1,512 6,855

18
Env i ronmenta l Taxes – no “ f ree r ide”

19
Certain of the information included in this presentation is forward looking and is subject to important risks and uncertainties that couldcause actual results and developments to differ materially from those expressed in or implied by such forward-looking statements. Bytheir nature, forward-looking statements involve risk and uncertainty because they relate to events and depend upon futurecircumstances that may or may not occur. In addition, forward looking statements require management to make estimates andjudgements about future events that are inherently uncertain. Although these estimates and judgements are based on management’sbest information available at the time, actual results may differ significantly from these estimates. A number of factors could causeactual results and developments to differ materially from those expressed or implied by the forward-looking statements including thoseidentified in this presentation and other factors discussed in our Annual Report on Form 20-F filed with the SEC. It is not reasonablypossible to itemise all of the many factors and specific events that could affect the outlook and results of an airline operating in theEuropean economy. Among the factors that are subject to change and could significantly impact Ryanair’s expected results are theairline pricing environment, fuel costs, “Brexit”, competition from new and existing carriers, market prices for replacement aircraft, costsassociated with environmental, safety and security measures, actions of the Irish, U.K., European Union (“EU”) and other governmentsand their respective regulatory agencies, fluctuations in currency exchange rates and interest rates, airport access and charges, labourrelations, the economic environment of the airline industry, the general economic environment in Ireland, the UK and ContinentalEurope, the general willingness of passengers to travel and other economics, social and political factors and flight interruptions caused byvolcanic ash emissions or other atmospheric disruptions. These and other factors could adversely affect the outcome and financial effectsof events or developments referred to in this presentation on the Ryanair Group. Forward looking statements contained in thispresentation based on trends or activities should not be taken as a representation that such trends or activities will continue in the future.
Except as may be required by the Market Abuse Rules of the Central Bank of Ireland, Listing Rules of Euronext Dublin or by any otherrules of any applicable regulatory body or by law, the Company disclaims any obligation or undertaking to release publicly any updates orrevisions to any forward statements contained herein to reflect any changes in the Company’s expectations with regard to any change inevents, conditions or circumstances on which any such statement is based.
This presentation contains certain forward-looking statements as defined under US legislation. By their nature, such statements involveuncertainty; as a consequence, actual results and developments may differ from those expressed in or implied by such statementsdepending on a variety of factors including the specific factors identified in this presentation and other factors discussed in our AnnualReport on Form 20-F filed with the SEC
Discla imer