half year results presentation for personal use only2013/02/26 · investor presentation –fy 2013...
TRANSCRIPT

26 February 2013 ASX and Media Announcement
Half Year Results Presentation Further to the announcement of Qube’s results for the half year ended 31 December 2012 earlier today, attached is the following document:
1. Investor presentation – FY 2013 Interim Results Further Enquiries: Corporate Affairs Paul Lewis Paul White Chief Financial Officer +61 417 224 920 +61 2 9080 1903
For
per
sona
l use
onl
y
Qube Holdings Limited
Investor Presentation – FY 13 Interim Results
For
per
sona
l use
onl
y

Disclaimer – Important Notice
The information contained in this Presentation or subsequently provided to the recipient whether orally or in writing by, or on behalf of Qube Holdings Limited (Qube) or any of its directors, officers, employees,
agents, representatives and advisers (the Parties) is provided to the recipient on the terms and conditions set out in this notice.
The information contained in this Presentation has been furnished by the Parties and other sources deemed reliable but no assurance can be given by the Parties as to the accuracy or completeness of this
information.
To the full extent permitted by law:
(a) no representation or warranty (express or implied) is given; and
(b) no responsibility or liability (including in negligence) is accepted,
by the Parties as to the truth, accuracy or completeness of any statement, opinion, forecast, information or other matter (whether express or implied) contained in this Presentation or as to any other matter
concerning them.
To the full extent permitted by law, no responsibility or liability (including in negligence) is accepted by the Parties:
(a) for or in connection with any act or omission, directly or indirectly in reliance upon; and
(b) for any cost, expense, loss or other liability, directly or indirectly, arising from, or in connection with, any omission from or defects in, or any failure to correct any information,
in this Presentation or any other communication (oral or written) about or concerning them.
The delivery of this Presentation does not under any circumstances imply that the affairs or prospects of Qube or any information have been fully or correctly stated in this Presentation or have not changed since
the date at which the information is expressed to be applicable. Except as required by law and the ASX listing rules, no responsibility or liability (including in negligence) is assumed by the Parties for
updating any such information or to inform the recipient of any new information of which the Parties may become aware.
Notwithstanding the above, no condition, warranty or right is excluded if its exclusion would contravene the Trade Practices Act 1974 or any other applicable law or cause an exclusion to be void.
The provision of this Presentation is not and should not be considered as a recommendation in relation to an investment in Qube or that an investment in Qube is a suitable investment for the recipient.
References to ‘pro-forma’ information are to non-IFRS financial information prepared in accordance with ASIC Regulatory Guide 230 (Disclosing non-IFRS financial information) issued in December 2011.
Non-IFRS financial information has not been subject to audit or review
ABN 141 497 230 53
2
For
per
sona
l use
onl
y

Qube’s Vision
‘To be Australia’s leading provider of Integrated Logistics Solutions
focussed on the Import and Export Supply Chains’
3
For
per
sona
l use
onl
y

Results Highlights
• Record financial results achieved in the first half
• Underlying revenue up 32%, underlying EBITA up 56%, underlying Qube NPAT up 19%
• Improved margins in both divisions reflecting benefits of investment and focus on operating
efficiencies
• Continued diversification of revenue and earnings
• Significant investment undertaken in the period which will contribute fully from FY 14 onwards
• Interim dividend of 2.2 cents (fully franked), up 10% over the prior corresponding period
reflecting Qube’s strong performance and positive outlook
4
For
per
sona
l use
onl
y

Business Update
• Both operating divisions significantly increased revenue and earnings
• Continued improvement in safety performance
• Integration and performance of recent acquisitions achieving expectations
• Significant growth capex undertaken in the period for new contracts
• Substantial growth opportunities being pursued by both divisions
• Continued planning for development of strategic assets
• Qube brand is gaining increasing customer awareness
• Qube is well placed for continued earnings growth
5
For
per
sona
l use
onl
y
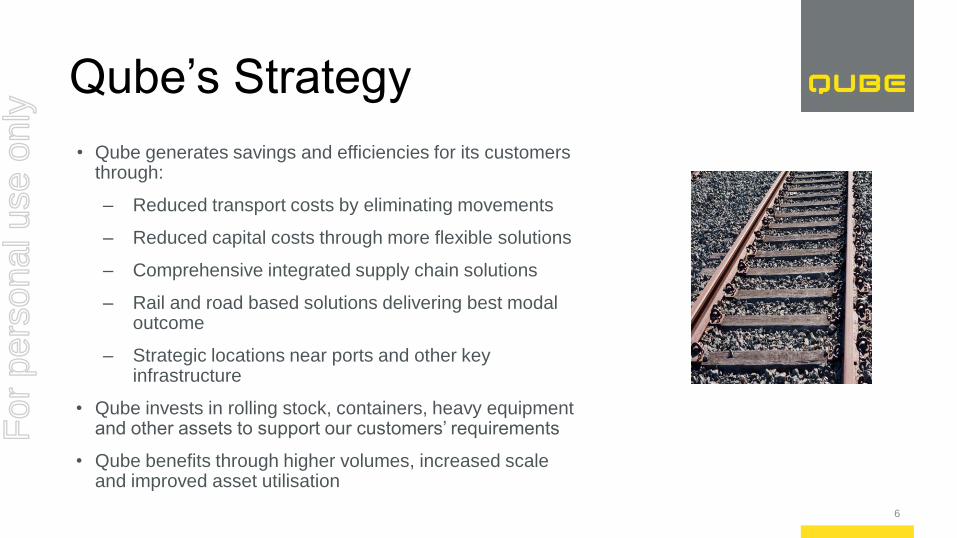
Qube’s Strategy
• Qube generates savings and efficiencies for its customers through:
‒ Reduced transport costs by eliminating movements
‒ Reduced capital costs through more flexible solutions
‒ Comprehensive integrated supply chain solutions
‒ Rail and road based solutions delivering best modal outcome
‒ Strategic locations near ports and other key infrastructure
• Qube invests in rolling stock, containers, heavy equipment and other assets to support our customers’ requirements
• Qube benefits through higher volumes, increased scale and improved asset utilisation
6
For
per
sona
l use
onl
y

Key Financial Outcomes Statutory Results
7
Six months ended 31 December 2012 ($m) 2011 ($m)Change From
Prior Year (%)
Operating Revenue 526.2 345.8 52%
EBITDA 89.3 0.2 >1000%
Depreciation (25.5) (12.0) 112%
EBITA 63.8 (11.8) 641%
Amortisation (3.1) (3.2) -4%
EBIT 60.8 (15.0) 505%
Net Interest Expense (17.2) (5.5) 212%
NPBT and Associates 43.6 (20.5) 313%
Share of Profit of Associates 8.9 6.7 33%
Profit / (Loss) Before Tax 52.6 (13.8) 481%
Tax (Expense) Benefit (16.1) 22.7 -171%
Profit After Tax 36.5 8.9 310%
Non-Controlling Interest (1.8) (0.7) 157%
Profit After Tax Attributable to Shareholders 34.7 8.2 323%
Earnings Per Share (cents) 3.8 1.2 217%
Dividend Per Share (cents) 2.2 2.0 10.0%
Note: The prior period's statutory results were impacted by the Qube Restructure and therefore are not comparable to
the current period's results.
For
per
sona
l use
onl
y

Key Financial Outcomes Underlying Results
8 The underlying result excludes non-cash and non-recurring items in order to more accurately reflect the underlying financial performance of Qube. References to ‘underlying’
and ‘pro-forma’ information are to non-IFRS financial information prepared in accordance with ASIC Regulatory Guide 230 (Disclosing non-IFRS financial information) issued
in December 2011. Non-IFRS financial information has not been subject to audit or review.
Six months ended 31 December 2012 ($m) 2011 ($m)Change From
Prior Year (%)
Underlying Pro-forma
Operating Revenue 526.3 397.5 32%
EBITDA 89.5 54.4 65%
EBITA 64.0 40.9 56%
EBIT 60.9 37.8 61%
Net Interest Expense (17.0) (5.8) 193%
Share of Profit of Associates 8.9 10.1 -12%
Profit Before Tax 52.8 42.1 25%
Tax (Expense) Benefit (13.2) (10.4) 27%
Profit After Tax 39.6 31.8 25%
Non-Controlling Interest (1.8) 0.0 N/A
Profit After Tax Attributable to Shareholders 37.8 31.8 19%
Earnings Per Share (cents) 4.1 3.9 5%
Dividend Per Share (cents) 2.2 2.0 10%
For
per
sona
l use
onl
y
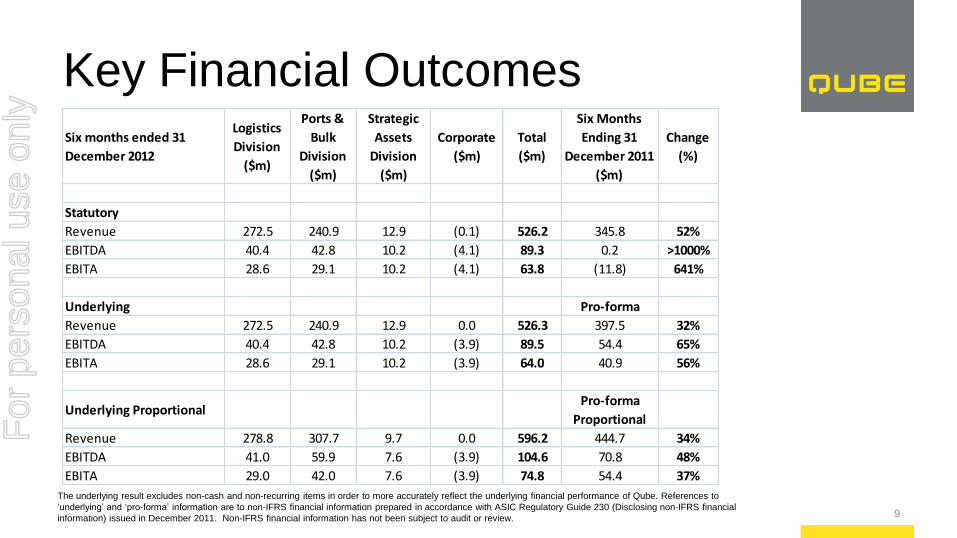
Key Financial Outcomes
9
The underlying result excludes non-cash and non-recurring items in order to more accurately reflect the underlying financial performance of Qube. References to
‘underlying’ and ‘pro-forma’ information are to non-IFRS financial information prepared in accordance with ASIC Regulatory Guide 230 (Disclosing non-IFRS financial
information) issued in December 2011. Non-IFRS financial information has not been subject to audit or review.
Six months ended 31
December 2012
Logistics
Division
($m)
Ports &
Bulk
Division
($m)
Strategic
Assets
Division
($m)
Corporate
($m)
Total
($m)
Six Months
Ending 31
December 2011
($m)
Change
(%)
Statutory
Revenue 272.5 240.9 12.9 (0.1) 526.2 345.8 52%
EBITDA 40.4 42.8 10.2 (4.1) 89.3 0.2 >1000%
EBITA 28.6 29.1 10.2 (4.1) 63.8 (11.8) 641%
Underlying Pro-forma
Revenue 272.5 240.9 12.9 0.0 526.3 397.5 32%
EBITDA 40.4 42.8 10.2 (3.9) 89.5 54.4 65%
EBITA 28.6 29.1 10.2 (3.9) 64.0 40.9 56%
Underlying ProportionalPro-forma
Proportional
Revenue 278.8 307.7 9.7 0.0 596.2 444.7 34%
EBITDA 41.0 59.9 7.6 (3.9) 104.6 70.8 48%
EBITA 29.0 42.0 7.6 (3.9) 74.8 54.4 37%
For
per
sona
l use
onl
y

Enhanced Focus on Safety • Improvement in safety performance across the entire organisation
• Reflected in continued downward trend in the LTIFR since June 2012
10 LTIFR – Lost Time Injury Frequency Rate
21.2
16.8 16.1 16.7
13.5
11.6
8.3
0.0
5.0
10.0
15.0
20.0
25.0
2007 2008 2009 2010 2011 2012 H1 FY 13
LTIFR Qube
For
per
sona
l use
onl
y
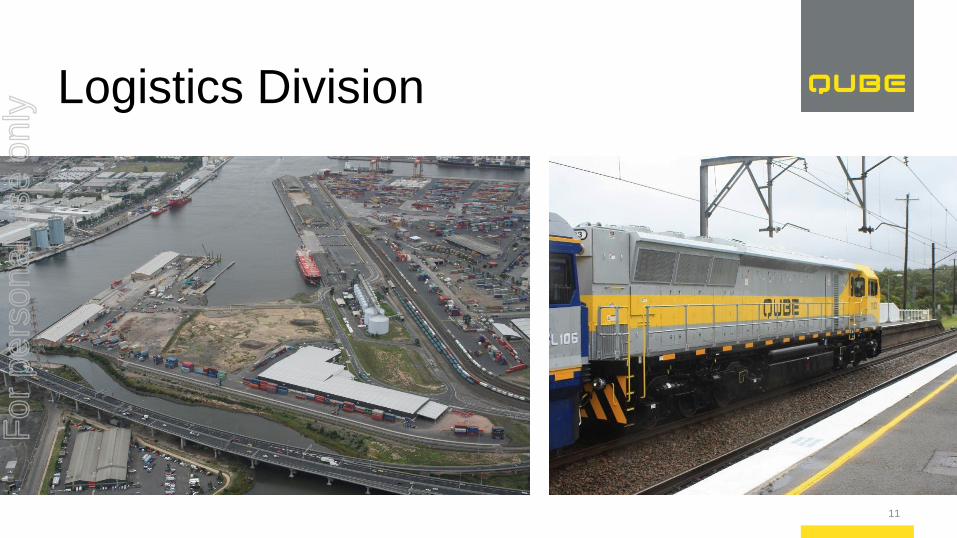
Logistics Division
11
For
per
sona
l use
onl
y

Logistics Division
• Continued revenue growth from acquisitions and organic growth
• Recovery in margins from operating efficiencies and increased scale
• Rail focussed logistics solutions continuing to grow
• Full period contribution from new locomotives and wagons acquired in FY 12
• Development of Vic Dock progressing to plan – expected to be completed by July 2013
• Integration and performance of MIST/ITG acquisition exceeding expectations
12
For
per
sona
l use
onl
y

Logistics Division
• Australia’s largest provider of containerised import / export
logistics services
• National presence in all capital cities and regional areas
• Operates in excess of 145ha (including Freight Depots,
FCL, Empty Container Parks and Warehousing)
• Operator of 11 multi-user Rail Terminals in QLD (1), NSW
(4),Victoria (5) and SA (1)
• 20+ rail services connecting country, regional and
metropolitan areas to ports (80 locos, 800 wagons)
• 300,000+ TEU pa on rail through Port Botany
13
For
per
sona
l use
onl
y

Logistics Division
14
17%
26%
23%
7%
12%
5%
10%
Indicative Revenue Composition (Jul 12 - Dec 12)
Container handling & terminal services
Retail / Imports
Agri
Food processing
Other (incl freight forwarding & project work)
Mining
Manufacturing
For
per
sona
l use
onl
y

Logistics Division
15
The underlying result excludes non-cash and non-recurring items in order to more accurately reflect the underlying financial performance of Qube. References to ‘underlying’ and ‘pro-forma’ information are to non-IFRS financial information prepared in accordance with ASIC Regulatory Guide 230 (Disclosing non-IFRS financial information) issued in December 2011. Non-IFRS financial information has not been subject to audit or review.
Six months ended 31 December 2012 ($m) 2011 ($m)Change From
Prior Year (%)
Underlying Pro-forma
Operating Revenue 272.5 244.5 11%
EBITDA 40.4 32.3 25%
Depreciation (11.8) (8.8) 34%
EBITA 28.6 23.5 22%
Amortisation (0.8) (0.8) 0%
EBIT 27.8 22.7 22%
Qube Share of Associates' NPAT 0.2 0.1 100%
EBITDA Margin (%) 14.8% 13.2% 1.6%
EBITA Margin (%) 10.5% 9.6% 0.9%
For
per
sona
l use
onl
y

Ports & Bulk Division
16
For
per
sona
l use
onl
y
Ports & Bulk Division
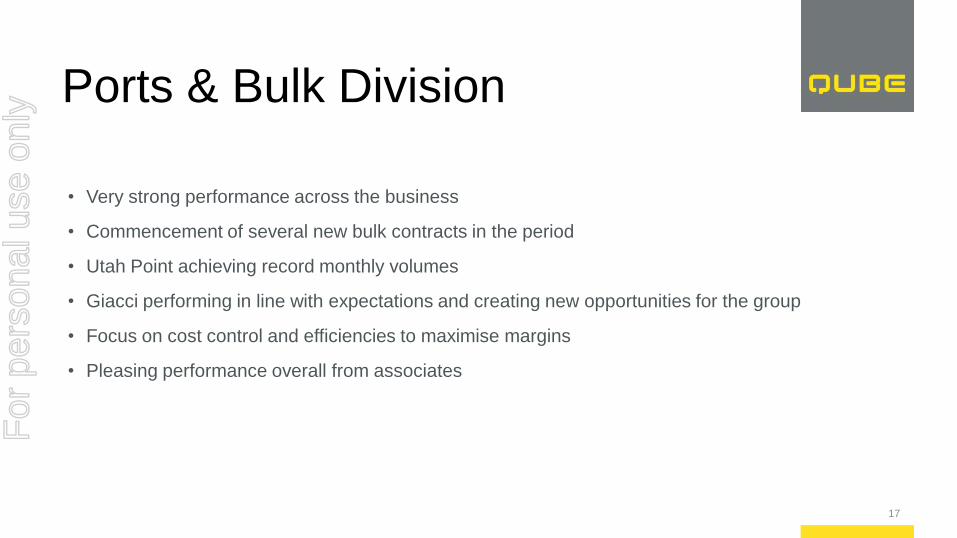
• Very strong performance across the business
• Commencement of several new bulk contracts in the period
• Utah Point achieving record monthly volumes
• Giacci performing in line with expectations and creating new opportunities for the group
• Focus on cost control and efficiencies to maximise margins
• Pleasing performance overall from associates
17
For
per
sona
l use
onl
y

Stockpile Management
Road Haulage
Train Loading
Chartering & Agency
Port Mgmt & Operations
Storage & Management
Rail Haulage
Mine Site Services
Prominent Hill, SA Centennial Coal, NSW Golden Grove, WA Centennial Coal, NSW
Qube Rail Utah Point, WA Utah Point, WA K line
Ports & Bulk Division
18
For
per
sona
l use
onl
y

Ports & Bulk Division
19
16%
11%
11%
11%10%
7%
9%
6%
6%
5%
3%2% 2% 1%
Indicative Revenue Composition (July 12 - Dec 12)
Iron Ore
Ancillary Services
Concentrates
Vehicles/Machinery/Boats/WHSS
Mineral Sands
Facility Operations
Bulk Scrap and Other
Sundry Income
General Cargo
Coal
Metal Products
Containers
Forest Products
Oil & Gas
For
per
sona
l use
onl
y

Ports & Bulk Division
20
For
per
sona
l use
onl
y

Ports & Bulk Division
21
The underlying result excludes non-cash and non-recurring items in order to more accurately reflect the underlying financial performance of Qube. References to
‘underlying’ and ‘pro-forma’ information are to non-IFRS financial information prepared in accordance with ASIC Regulatory Guide 230 (Disclosing non-IFRS financial
information) issued in December 2011. Non-IFRS financial information has not been subject to audit or review.
Six months ended 31 December 2012 ($m) 2011 ($m)Change From
Prior Year (%)
Underlying Pro-forma
Operating Revenue 240.9 150.4 60%
EBITDA 42.8 23.9 79%
Depreciation (13.7) (4.7) 191%
EBITA 29.1 19.2 52%
Amortisation (2.0) (2.0) 0%
EBIT 27.1 17.2 58%
Qube Share of Associates' NPAT 8.7 7.7 13%
EBITDA Margin (%) 17.8% 15.9% 1.9%
EBITA Margin (%) 12.1% 12.8% -0.7%
For
per
sona
l use
onl
y

Ports & Bulk Division Associates
• Completed $20 million investment to support Prixcar acquisition
• AAT and Prixcar benefitted from continued strength in vehicle sales and imports
• Prixcar impacted by issues affecting two of its major transport customers
• NSS secured several new contracts but impacted by termination of QNI contract
• Expect weaker contribution in second half with improved result from FY 14
22
Six months ended 31 December 2012 ($m) 2011 ($m)Change From
Prior Year (%)
Qube share of associates' NPAT Underlying Pro-forma
AAT 5.0 3.6 39%
NSS 2.7 3.3 -17%
Prixcar 1.0 0.8 25%
Total 8.7 7.7 13%
The underlying result excludes non-cash and non-recurring items in order to more accurately reflect the underlying financial performance of Qube. References to
‘underlying’ and ‘pro-forma’ information are to non-IFRS financial information prepared in accordance with ASIC Regulatory Guide 230 (Disclosing non-IFRS financial
information) issued in December 2011. Non-IFRS financial information has not been subject to audit or review.
For
per
sona
l use
onl
y
Strategic Assets Division
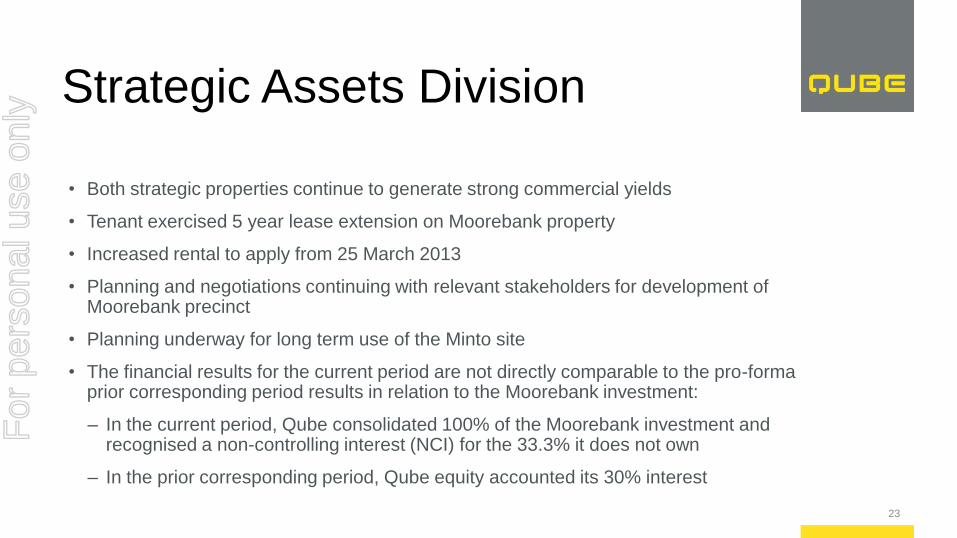
• Both strategic properties continue to generate strong commercial yields
• Tenant exercised 5 year lease extension on Moorebank property
• Increased rental to apply from 25 March 2013
• Planning and negotiations continuing with relevant stakeholders for development of Moorebank precinct
• Planning underway for long term use of the Minto site
• The financial results for the current period are not directly comparable to the pro-forma prior corresponding period results in relation to the Moorebank investment:
– In the current period, Qube consolidated 100% of the Moorebank investment and recognised a non-controlling interest (NCI) for the 33.3% it does not own
– In the prior corresponding period, Qube equity accounted its 30% interest
23
For
per
sona
l use
onl
y

Strategic Assets Division
24
The underlying result excludes non-cash and non-recurring items in order to more accurately reflect the underlying financial performance of Qube. References to
‘underlying’ and ‘pro-forma’ information are to non-IFRS financial information prepared in accordance with ASIC Regulatory Guide 230 (Disclosing non-IFRS financial
information) issued in December 2011. Non-IFRS financial information has not been subject to audit or review.
Six months ended 31 December 2012 ($m) 2011 ($m)Change From
Prior Year (%)
Underlying Pro-forma
Operating Revenue 12.9 2.7 378%
EBITDA 10.2 1.9 437%
Depreciation 0.0 0.0 0%
EBITA 10.2 1.9 437%
Amortisation (0.2) (0.2) 0%
EBIT 10.0 1.7 488%
Qube Share of Associates' NPAT 0.0 2.3 N/A
NCI Share of Qube's NPAT (1.8) 0.0 N/A
EBITDA Margin (%) 79.1% 70.4% 8.7%
EBITA Margin (%) 79.1% 70.4% 8.7%For
per
sona
l use
onl
y

Capex Underpinning Growth • Qube continued to invest in the period to support future growth
• Total capex in first half was approximately $191 million
• Capex included acquisitions of MIST/ITG and funding for Prixcar acquisition
• Significant capex to support new contracts and organic growth
• Expect increased contribution from capex in second half with full year contribution from FY 14
25
Qube Logistics, $110.8m
Qube Ports & Bulk, $76.5m
Strategic Assets / Other, $3.7m
Capex By Division
Acquisitions, $116.9m
Organic Growth, $58.7m
Maintenance, $15.3m
Capex By Type
For
per
sona
l use
onl
y

Cashflow and Financing
• Strong cashflow generated in the period although working capital increased due to
acquisitions and growth
• Net debt increased by approx $163 million due to acquisitions and significant
investment in growth capex
• Gearing remains at bottom end of Qube’s target gearing range of 30-40%
• Refinancing of Strategic Assets’ debt is well progressed
• Expect net debt to increase in second half to support growth capex
26
For
per
sona
l use
onl
y

Cashflow and Financing
27
Six months ended 31 December 2012 $m
EBITDA 89.3
Net operating working capital (18.9)
Other non cash items 0.2
Operating cashflow pre tax, dividends and interest 70.6
Cash tax paid (14.4)
Cash dividends & distributions received 6.1
Cash net interest paid (16.2)
Operating cashflow 46.1
Net spend on PP&E and intangible assets (104.2)
Net spend on business acquisitions & investments (72.6)
Free cashflow after capex (130.7)
Net proceeds from financing 75.4
Proceeds from unit issues 1.3
Dividends & distributions paid (17.5)
Other (0.3)
Change in cash (71.8)
Opening cash 118.6
Closing cash 46.8
Cash conversion 79%
For
per
sona
l use
onl
y
Cashflow and Financing
28
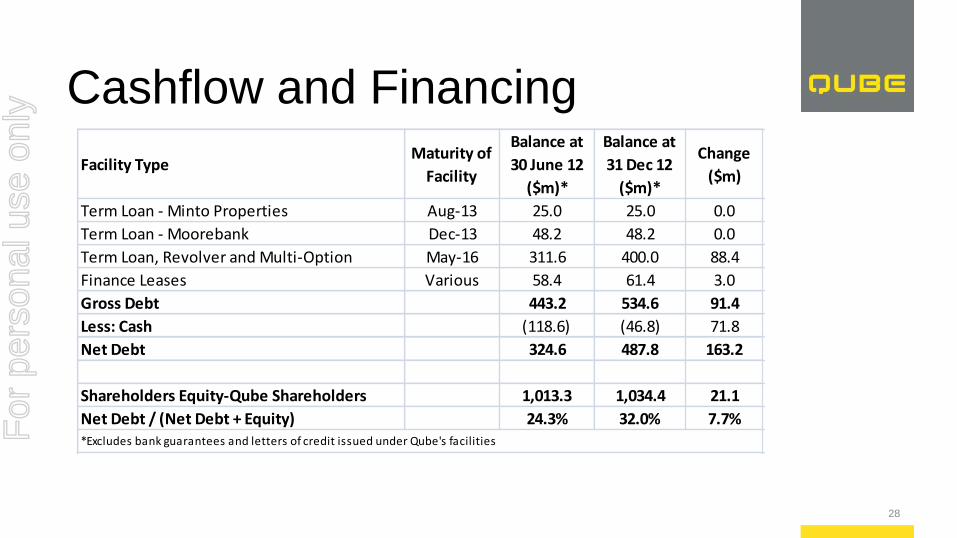
Facility TypeMaturity of
Facility
Balance at
30 June 12
($m)*
Balance at
31 Dec 12
($m)*
Change
($m)
Term Loan - Minto Properties Aug-13 25.0 25.0 0.0
Term Loan - Moorebank Dec-13 48.2 48.2 0.0
Term Loan, Revolver and Multi-Option May-16 311.6 400.0 88.4
Finance Leases Various 58.4 61.4 3.0
Gross Debt 443.2 534.6 91.4
Less: Cash (118.6) (46.8) 71.8
Net Debt 324.6 487.8 163.2
Shareholders Equity-Qube Shareholders 1,013.3 1,034.4 21.1
Net Debt / (Net Debt + Equity) 24.3% 32.0% 7.7%*Excludes bank guarantees and letters of credit issued under Qube's facilitiesF
or p
erso
nal u
se o
nly

Summary and Outlook
• Record results in both divisions
• Strong interest in Qube’s integrated logistics solutions
• Growth expected to continue from organic growth and benefits of capex
• Continued investment expected to support new opportunities
• Subject to economic conditions, Qube expects continued revenue and earnings growth
for the 2013 financial year, albeit at a lower rate than that achieved in the 2012
financial year
• Well placed to deliver sustainable growth over the medium to long term
29
For
per
sona
l use
onl
y

Questions
30
For
per
sona
l use
onl
y

Appendix 1
Reconciliation of 31 December 2012
Statutory Results to Underlying Results
31
Six months ended 31 December 2012
Logistics
Division
($m)
Ports & Bulk
Division
($m)
Strategic
Assets
Division
($m)
Corporate
($m)
Consolidated
($m)
Net profit / (loss) before tax 27.2 35.0 7.9 (17.6) 52.6
Add: net interest expense 0.8 0.8 2.1 13.5 17.2
Add: depreciation and amortisation expense 12.7 15.7 0.2 0.0 28.5
Less: share of profit after tax from associates (0.2) (8.7) 0.0 0.0 (8.9)
EBITDA 40.4 42.8 10.2 (4.1) 89.3
Add: non-cash items
Fair value revaluation loss (net) 0.0 0.0 0.0 0.2 0.2
Underlying EBITDA 40.4 42.8 10.2 (3.9) 89.5
Add: Proportional share of associates' EBITDA 0.6 17.1 0.0 0.0 17.7
Less: Proportional NCI share of Moorebank EBITDA 0.0 0.0 (2.6) 0.0 (2.6)
Underlying Proportional EBITDA 41.0 59.9 7.6 (3.9) 104.6
The underlying result excludes non-cash and non-recurring items in order to more accurately reflect the underlying financial performance of Qube. References to ‘underlying’
and ‘pro-forma’ information are to non-IFRS financial information prepared in accordance with ASIC Regulatory Guide 230 (Disclosing non-IFRS financial information) issued
in December 2011. Non-IFRS financial information has not been subject to audit or review.
For
per
sona
l use
onl
y
Appendix 2
Reconciliation of 31 December 2011
Statutory Results to Pro-forma Results
32
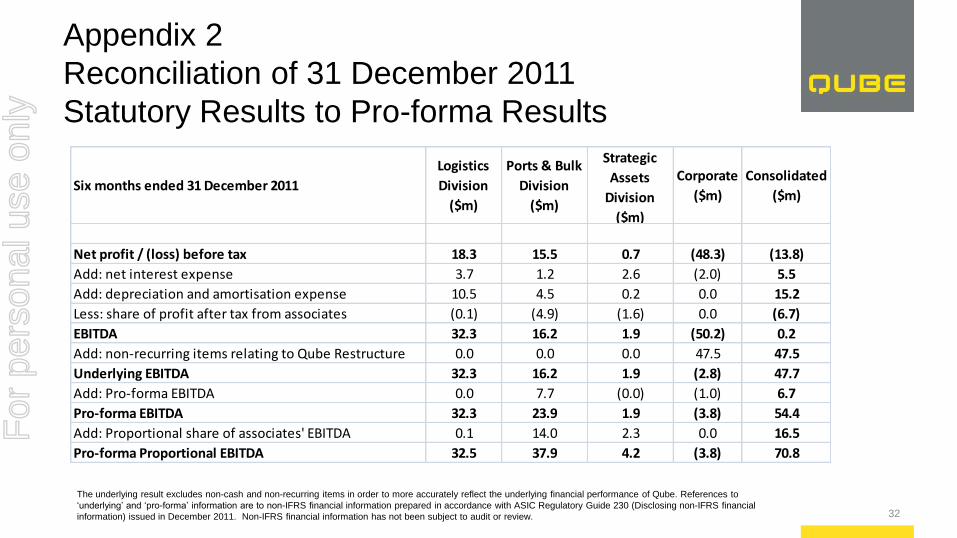
Six months ended 31 December 2011
Logistics
Division
($m)
Ports & Bulk
Division
($m)
Strategic
Assets
Division
($m)
Corporate
($m)
Consolidated
($m)
Net profit / (loss) before tax 18.3 15.5 0.7 (48.3) (13.8)
Add: net interest expense 3.7 1.2 2.6 (2.0) 5.5
Add: depreciation and amortisation expense 10.5 4.5 0.2 0.0 15.2
Less: share of profit after tax from associates (0.1) (4.9) (1.6) 0.0 (6.7)
EBITDA 32.3 16.2 1.9 (50.2) 0.2
Add: non-recurring items relating to Qube Restructure 0.0 0.0 0.0 47.5 47.5
Underlying EBITDA 32.3 16.2 1.9 (2.8) 47.7
Add: Pro-forma EBITDA 0.0 7.7 (0.0) (1.0) 6.7
Pro-forma EBITDA 32.3 23.9 1.9 (3.8) 54.4
Add: Proportional share of associates' EBITDA 0.1 14.0 2.3 0.0 16.5
Pro-forma Proportional EBITDA 32.5 37.9 4.2 (3.8) 70.8
The underlying result excludes non-cash and non-recurring items in order to more accurately reflect the underlying financial performance of Qube. References to
‘underlying’ and ‘pro-forma’ information are to non-IFRS financial information prepared in accordance with ASIC Regulatory Guide 230 (Disclosing non-IFRS financial
information) issued in December 2011. Non-IFRS financial information has not been subject to audit or review.
For
per
sona
l use
onl
y

Appendix 3
Explanation of Pro-forma Information
• The statutory results for the six months to 31 December 2011 were impacted by the Qube restructure completed in the period
which involved significant transaction costs and changes to accounting measurements. Therefore, the statutory results do not
reflect the underlying financial performance of Qube in the period and are not comparable to the current period’s results
• The underlying result excludes non-cash and non-recurring items in order to more accurately reflect the underlying financial
performance of Qube. References to ‘underlying’ and ‘pro-forma’ information are to non-IFRS financial information prepared in
accordance with ASIC Regulatory Guide 230 (Disclosing non-IFRS financial information) issued in December 2011. Non-IFRS
financial information has not been subject to audit or review
• The pro-forma information for the six months to 31 December 2011 has been prepared on the following basis:
‒ Qube owned its current interest in Qube Logistics, Qube Ports & Bulk, AAT, NSS, Prixcar and Minto Properties for the entire
reporting period
‒ Qube accounted for its 30% ownership of the Moorebank Industrial Property Trust (MIPT) as an associate for the entire period
‒ Qube operated as a company for the entire reporting period
‒ The one-off costs relating to the restructure have been excluded
‒ Other non-cash items and non-operating items have been excluded
• The pro-forma proportional information has been prepared on the same basis as the pro-forma information, however, Qube’s
share of associates’ revenue, EBITDA and EBIT has been included in the figures
33
For
per
sona
l use
onl
y

Appendix 4
Underlying / Proportional Information
The underlying result excludes non-cash and non-recurring items in order to more accurately reflect the underlying financial performance of Qube. References to ‘underlying’ and
‘pro-forma’ information are to non-IFRS financial information prepared in accordance with ASIC Regulatory Guide 230 (Disclosing non-IFRS financial information) issued in
December 2011. Non-IFRS financial information has not been subject to audit or review.
See Appendix 3 for further details on the preparation of the Pro-forma and Pro-forma Proportional information.
34
Underlying Pro-forma Change Statutory Change
Six months ended 31 December 2012 ($m) 2011 ($m) (%) 2012 ($m) 2012 ($m) 2011 ($m) (%)
Operating Revenue 526.3 397.5 32% 526.2 596.2 444.7 34%
EBITDA 89.5 54.4 65% 89.3 104.6 70.8 48%
Depreciation (25.5) (13.5) 89% (25.5) (32.8) (16.4) 100%
EBITA 64.0 40.9 56% 63.8 74.8 54.5 37%
Amortisation (3.1) (3.1) 0% (3.1) (3.1) (3.1) 0%
EBIT 60.9 37.8 61% 60.8 71.7 51.4 39%
Net Interest Expense (17.0) (5.8) 193% (17.2) (17.6) (6.0) 193%
NPBT and Associates 43.9 32.0 37% 43.6 54.1 45.4 19%
Share of Profit of Associates 8.9 10.1 -12% 8.9 0.0 0.0 0%
Profit Before Tax 52.8 42.1 25% 52.6 54.1 45.4 19%
Tax (Expense) Benefit (13.2) (10.4) 27% (16.1) (16.3) (13.6) 20%
Profit After Tax 39.6 31.8 25% 36.5 37.8 31.8 19%
Non-Controlling Interest (1.8) 0.0 N/A (1.8) 0.0 0.0 N/A
Profit After Tax Attributable to Shareholders 37.8 31.8 19% 34.7 37.8 31.8 19%
Underlying / Pro-
forma Proportional
For
per
sona
l use
onl
y

Appendix 5
Segment Information - December 2011
The underlying result excludes non-cash and non-recurring items in order to more accurately reflect the underlying financial performance of Qube. References to ‘underlying’ and
‘pro-forma’ information are to non-IFRS financial information prepared in accordance with ASIC Regulatory Guide 230 (Disclosing non-IFRS financial information) issued in
December 2011. Non-IFRS financial information has not been subject to audit or review.
See Appendix 3 for further details on the preparation of the Pro-forma and Pro-forma Proportional information.
35
Six months ended 31
December 2011
Logistics
Division
($m)
Ports &
Bulk
Division
($m)
Strategic
Assets
Division
($m)
Corporate
($m)
Total
($m)
Statutory
Revenue 244.5 98.6 2.5 0.2 345.8
EBITDA 32.3 16.2 1.9 (50.2) 0.2
EBITA 23.5 13.1 1.9 (50.2) (11.8)
Pro-forma
Revenue 244.5 150.4 2.7 (0.1) 397.5
EBITDA 32.3 23.9 1.9 (3.7) 54.4
EBITA 23.5 19.2 1.9 (3.7) 40.9
Pro-forma Proportional
Revenue 244.5 193.9 6.3 0.0 444.7
EBITDA 32.5 37.9 4.2 (3.8) 70.8
EBITA 23.6 30.4 4.2 (3.8) 54.4
For
per
sona
l use
onl
y

Appendix 6
Tax Expense Reconciliation
36
Statutory Underlying
$m $m
Net Profit Before Tax 52.6 52.8
Prima-facie tax at 30% 15.8 15.9
Non-deductible permanent differences
Profit of Associates (2.7) (2.7)
Finalisation of tax adjustments on prior year acquisitions 2.7 -
Other non-deductible items 0.3 -
Tax Expense 16.1 13.2
The underlying result excludes non-cash and non-recurring items in order to more accurately reflect the underlying financial performance of Qube. References to
‘underlying’ and ‘pro-forma’ information are to non-IFRS financial information prepared in accordance with ASIC Regulatory Guide 230 (Disclosing non-IFRS financial
information) issued in December 2011. Non-IFRS financial information has not been subject to audit or review.
For
per
sona
l use
onl
y