half year results presentation - ophir-energy.com · 11,400 boepd average daily production $102...
TRANSCRIPT

HALF YEAR RESULTS PRESENTATIONLondon, 13 September 2018

STRATEGIC PRIORITIES
2018 Half Year Results Presentation Slide 2
SUSTAINABILITY ANDFREE CASH FLOW
To drive NAV growth and returns
to shareholders
LNG ASSETS
Unlock potential value and ensure our shareholders share appropriately
in value realised
CONSOLIDATION
Evaluate opportunities that can accelerate delivery of
business objectives
MINMISE FRONTIER EXPLORATION
Focus on near field exploration
COSTS
Downsize London office* and establish an Asian HQ
*Subject to consultation
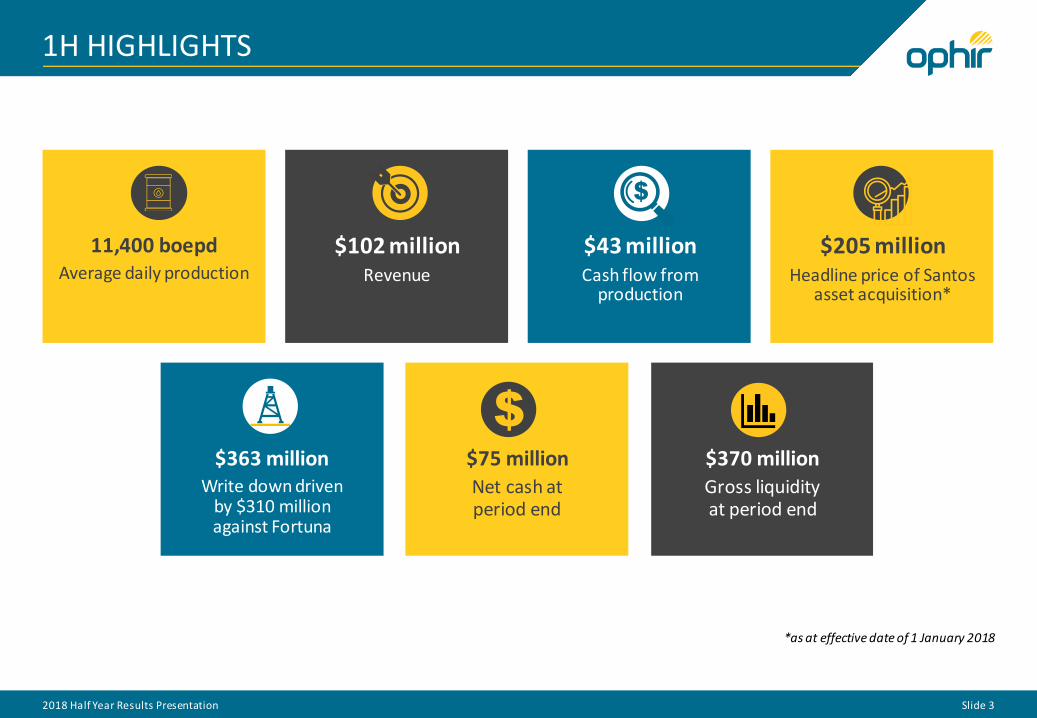
11,400 boepdAverage daily production
$102 millionRevenue
$43 millionCash flow from
production
$205 millionHeadline price of Santos
asset acquisition*
1H HIGHLIGHTS
2018 Half Year Results Presentation Slide 3
$363 millionWrite down driven
by $310 million against Fortuna
$75 millionNet cash at period end
$370 millionGross liquidity at period end
*as at effective date of 1 January 2018

First step towards reaching goal of material free cash generation
SANTOS ACQUISITION
Key metrics
• Production up 18.5% against forecast at acquisition
• Cash flow up 36% against forecast at acquisition
• Recovered 30% of acquisition costs already
• Payback reduced by 6 months
• $13 million per annum of synergies
65
72
60
62
64
66
68
70
72
74
At acquisition Average YTD
$ p
er
bb
l
Oil Price
13,500
16,000
12,000
14,000
16,000
At acquisition Actual
Bo
ep
d
1H Production
45
61
0
10
20
30
40
50
60
70
At acquisition On completion
$ m
illio
ns
Cash flow YTD
36
30
2728293031323334353637
At acquisition On completion
Mo
nth
s
Payback
2018 Half Year Results Presentation Slide 4
Deal rationale
• Further grow and diversify production base
• Increase cash generative base of business
• Move closer to financial sustainability

Forward plan to maximise value creation
ACQUIRED ASSETS
2018 Half Year Results Presentation Slide 5
Madura Offshore/Sampang, Indonesia
• HSE- Continue safe production operations
• Incremental reserves growth- Paus Biru-1 exploration well - Review/sanction Meliwis FID
• Longer term upside
- Negotiate licence extensions
- Enable delivery of longer term near field exploration strategy
Block 12W
• Continue to build relationship with PetroVietnam
• Maximise value creation from assets- Further strengthen relationship with operator (Premier) and JV
- Ensure active contribution to technical and commercial discussions
Synergies
• Combine Indonesian offices, generate at least $13 million per annum of synergies*- Appointed a new Indonesian GM, Pak Tenny Wibowo (ex-Santos)*- Opportunity to high grade the team in Indonesia
*subject to regulator approval
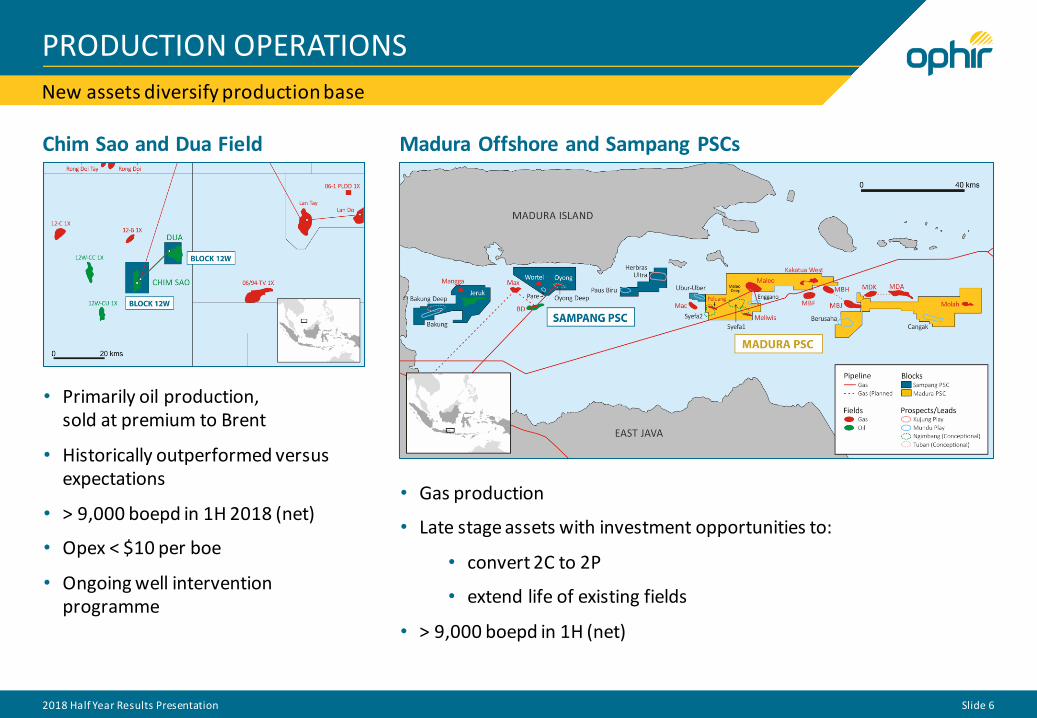
New assets diversify production base
PRODUCTION OPERATIONS
2018 Half Year Results Presentation Slide 6
Madura Offshore and Sampang PSCs
• Primarily oil production, sold at premium to Brent
• Historically outperformed versus expectations
• > 9,000 boepd in 1H 2018 (net)
• Opex < $10 per boe
• Ongoing well intervention programme
• Gas production
• Late stage assets with investment opportunities to:
• convert 2C to 2P
• extend life of existing fields
• > 9,000 boepd in 1H (net)
Chim Sao and Dua Field

Existing assets performing in line with expectations
PRODUCTION OPERATIONS
Bualuang Field Kerendan field
2018 Half Year Results Presentation Slide 7
• Reliable production asset
• 7,800 bopd during 1H
• Opex ~ $13 / bopd
• Development drilling in 2H 2018 to increase production to over 9,000 bopd
• New platform with 12 new slots to be installed in 2019 driving production up to over 11,000 bopd
• Stable production under GSA 1 at 17.5 MMsfcd
• Opex ~ $13 / boepd
• 3D seismic acquired in 2017 highlights material upside potential which could support new routes to market
• Commenced negotiations for GSA 2 to monetise next phase of contingent resource

High value barrels, rapid payback
BUALUANG PHASE 4
Slide 8
Project Scope
• A third platform (Charlie) with 12 slots
• Expansion of water disposal to 100k bwpd
• Additional crude fired power generation capacity
• Additional water disposal well on Bravo platform
• 10 slots allocated in the Phase 4 development phase
• 2 slots for near field exploration success or additional contingent resources
Progress Report
• Brownfield work has commenced offshore Construction work onshore has commenced
- schedule for installation and hook up in June 2019
• Total capex of $138 MM
• Development drilling from July 2019
• First oil in October 2019
Charlie platform and associated brownfield
modifications
2018 Half Year Results Presentation
IRR > 40%Payback within 18 months

T2.6 Depth Map Original Velocity Solution
T2.6 Reservoir
Closure above OWC
Revised depth solution has potential to
bring
North Bualuang into
main field closure above
OWC
B8/38 Bualuang North Prospect
EXPLORATION: NEAR FIELD THE FOCUS
2018 Half Year Results Presentation Slide 9
• Step-out well 5km north of Bualuang platforms
• Targeting reservoirs already producing in main field
• Well cost US$4.8MM on a dry hole basis (US$1.5 million post-tax)
• Spud October 2018
• Pmean STOIIP 36.7 MMSTB with 50% GPOS
• Development drilling in mid-2020 at end ofCharlie drilling programme
• First oil Q3 2020
Kerendan Gas Field
B8/38 OPHIR 100%
BualuangOil Field
Bualuang North Prospect
T2.6 Depth Map Revised Velocity Solution
T2.6 Reservoir
Closure above OWC
with revised velocity
model

FORWARD PRODUCTION PROFILE
Slide 10
0
20000
40000
2017 2018 2019 2020
Production Profile*
Base case Upside
Current investment programme delivers 25,000 boepd in 2019/2020
Delivery of risked upside could drive production over 25,000 boepd
Upside opportunities include:
• Bualuang Phase 5
• Bualuang North
• Kerendan Phases 2 and 3
• Meliwis development
• Paus Biru nearfield exploration
2018 Half Year Results Presentation
*2018 numbers on a pro-forma basis from effective date of 1 January 2018

HALF YEAR FINANCIAL SUMMARY
2018 Half Year Results Presentation Slide 11
Units HY 2018 HY 2017 COMMENTS
NET SOURCES OF FUNDS:
Revenue (including hedges) $’millions 102.1 88.3 ― Bualuang $67/bbl (HY17: $50/bbl) and Kerendan $5.43/Mscf (HY17: $5.23/Mscf)
Kerendan take-or-pay $’millions (0.1) 2.0 ―
Cost of production (operating expenses, royalty and inventories)
$’millions (30.5) (36.0) ― Unit opex $11/boe (HY17: $12/boe)
Investment Income $’millions 1.8 2.6 ― Net income from Sinphuhorm $2m (HY17: $3m)
Income Tax Charge $’millions (30.4) (17.0) ― Increase in SRB (lower capex) and higher revenue from Bualuang
Total net sources of funds from production
$ ‘millions 42.9 39.9 ― Income from production $23/boe (HY17: $21/boe)
NET USES OF FUNDS:
Capex (including pre-licence costs)(1) $’millions 49.7 45.4 ― Exploration $35m (HY17: $26m) and P&D $14m (HY17: $19m)
Net administration cost $’millions 6.5 5.8 ― Minimising corporate cost base - gross reduction of 60% in three years
Net finance costs $’millions 6.5 7.0 ― Interest in 1H18 only relates to NOK bond. 1H 17 included old RBL
Total net uses of funds $’millions 62.7 58.2 ―
FINANCING:
Closing net cash $’millions 75.3 129.9 ― Net cash outlay $42m (HY17: $30m)
Closing borrowings $’millions 104.7 106.6 ―
Undrawn facilities $’millions 190.7 177.5 Available facility of $191m (YE17: $204m; HY17: $178m)
Closing gross liquidity $’millions 370.7 414.0 ― Total liquidity with undrawn RBL $371m (YE17: $427m, HY17: $414m)
Note 1 - capex is adjusted to eliminate non-cash movements for decommissioning of $0.5m (HY17: $0.5m)

Focus on delivering free cash flow
2018 GUIDANCE
2018 Half Year Results Presentation Slide 12
Production: 27,500 boepd*
Fund flow from production: $210 million*
2018 Hedging Programme
• Purchased swap at average of $60/bbl for 3,200 bpd
• Purchased call at average of $68/bbl for 3,200 bpd
• Post 6 Sept additional hedging includes
- Swap at average of $70/bbl for 2,000 bpd
- Call at an average of $78/bbl for 2,000 bpd
Capital expenditure: $145 million*
• Bualuang Phase 4: $45 million
• Mexico exploration: $24 million
• Kerendan civil works & water wells: $10 million
• New Asian assets: $25 million
Net debt: $110 million
Gross liquidity: $260 million
*on a pro-forma basis for Santos assets from effective date of 1.1.18
Net Operating Cash Flow 41%
Operating Costs 24%
Royalty 5%
Taxation 28%
Administration 2%
REVENUE (BRENT ASSUMPTION: $73/BBL)
CAPITAL EXPENDITURE (EXCLUDING ACQUISITION COSTS)
Exploration 46%
Pre-development 8%
Production 45%
Investment Fortuna 1%

Strong balance sheet, low cost sustainable production and limited commitments
FREE CASH GENERATING ASIAN PRODUCTION BASE
2018 Half Year Results Presentation Slide 13
Significant cash position & liquidity• Closing net cash $75 million; Liquidity $371 million
• $130 million Bridge facility to be rolled into RBL
• Planned refinance of Nordic bond
Robust operating cash flow from high margin assets• Solid production base generating c. $300 million free
cash flow p.a, post investment, between 2019-2021
Funded work programme for next few years
• Focus on investing in existing assets to grow production and cash flow
• Reduce balance sheet exposure to frontier exploration
• Up to $150 million investment into Fortuna (not assumed in current forecast)
$50/bbl
$50/bbl $50/bbl
$60/bbl
$60/bbl$60/bbl
$70/bbl
$70/bbl
$70/bbl
$0m
$100m
$200m
Op Cash Flow(1) P&DCapex (2)
Op Cash Flow(1) P&DCapex
Op Cash Flow(1) P&DCapex
2018 2019 2020
Investment Capex Maintenance Capex
Note 1 - Operating cash flow before working adjustmentsNote 2 - Pre-acquisition expenditure
Cash flow v P&D capex forecast

OUTLOOK
Slide 14
Asia will become the hub of our operations
Expanding productionbase
Monetise LNG assets
Reducing exposure to frontier exploration
Generating free cash flow
2018 Half Year Results Presentation

For further information contact:
Head of IR and Corporate [email protected]
Geoff Callow
Level 4123 Victoria StreetLondon SW1E 6DEUNITED KINGDOM
Tel: +44 (0)29 7811 2400Fax: +44 (0)20 7811 2421
Slide 15