half-yearly financial report 30 september 2009€¦ · rit capital partners plc half-yearly...
TRANSCRIPT

HALF-YEARLY FINANCIAL REPORT 30 SEPTEMBER 2009

RIT CAPITAL PARTNERS PLC HALF-YEARLY FINANCIAL REPORT 2009

1
Financial Highlights 2Portfolio Analysis and Currency Exposure 3Chairman’s Statement 4Investment Portfolio 6Responsibility Statement of the Directors in respect of the Half-Yearly Financial Report 8Independent Review Report to RIT Capital Partners plc 9Consolidated Income Statement 10Consolidated Statement of Comprehensive Income 12Consolidated Balance Sheet 14Consolidated Statement of Changes in Equity 15Consolidated Cash Flow Statement 16Notes to the Financial Statements 17Investor Information 19Directors and Advisers 20
Company Registration Number 2129188
RIT CAPITAL PARTNERS PLC HALF-YEARLY FINANCIAL REPORT 2009
2
% C
hang
e
RITCP Diluted NAV per share
Morgan Stanley Capital International World Index (in £)
FTSE All-Share Index
Investment Trust Net Assets Index
-40
-20
0
20
40
60
80
100
120
140
160
180
200
220
Sep09
Mar09
Mar08
Mar07
Mar06
Mar05
Mar04
Mar03
Mar02
Mar01
Mar00
Sep99
FINANCIAL HIGHLIGHTS
30 September 31 March2009 2009 Change
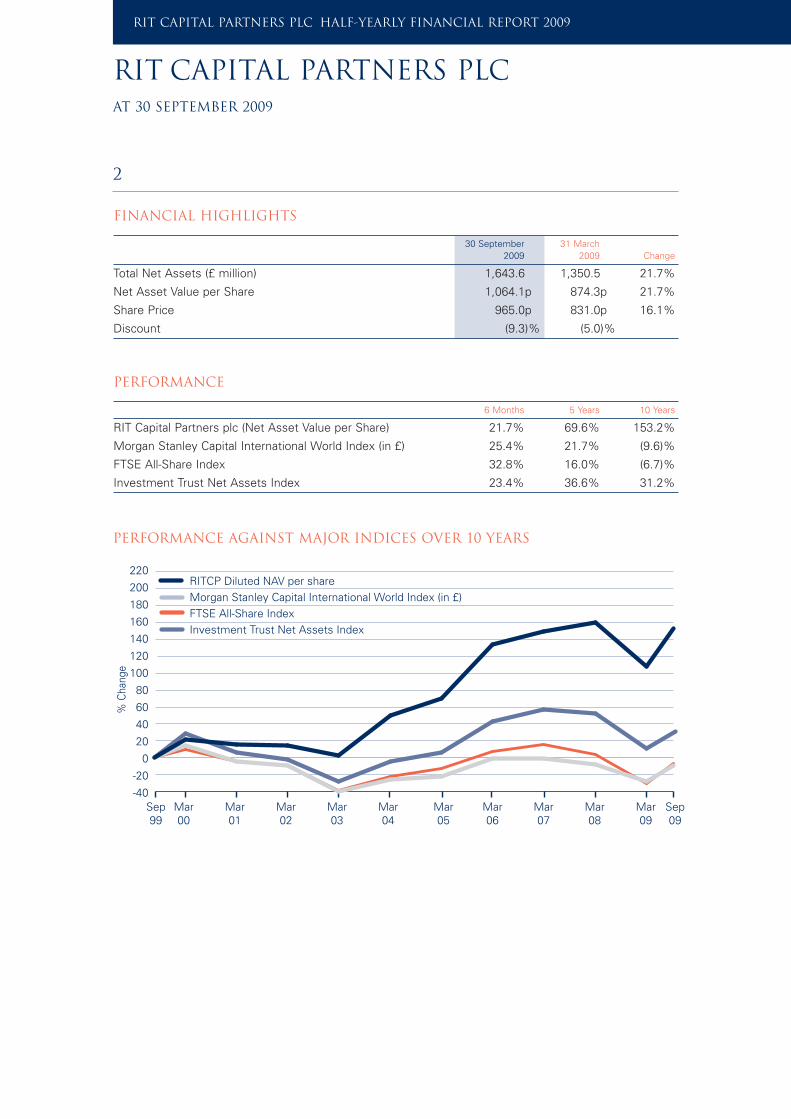
Total Net Assets (£ million) 1,643.6 1,350.5 21.7%
Net Asset Value per Share 1,064.1p 874.3p 21.7%
Share Price 965.0p 831.0p 16.1%
Discount (9.3)% (5.0)%
PERFORMANCE
6 Months 5 Years 10 Years
RIT Capital Partners plc (Net Asset Value per Share) 21.7% 69.6% 153.2%
Morgan Stanley Capital International World Index (in £) 25.4% 21.7% (9.6)%
FTSE All-Share Index 32.8% 16.0% (6.7)%
Investment Trust Net Assets Index 23.4% 36.6% 31.2%
PERFORMANCE AGAINST MAJOR INDICES OVER 10 YEARS
RIT CAPITAL PARTNERS PLCAT 30 SEPTEMBER 2009

PORTFOLIO ANALYSIS AND CURRENCY EXPOSURE
0% 10% 20% 30% 40% 50%
Quoted Investments
Percentage of portfolio
Hedge Funds
Long Equity Funds
Unquoted Investments:Direct
Unquoted Investments:Funds
Government Securitiesand Money Market Funds
Property
at 30 September 2009
at 31 March 2009
0% 10% 20% 30% 40% 50%
US
Europe
UK
Far East
Japan
Canada
Percentage of portfolio
Other
at 30 September 2009
at 31 March 2009
0% 10% 20% 30% 40% 50%
US Dollar
Sterling
Japanese Yen
Canadian Dollar
Euro
Singapore Dollar
Australian Dollar
Norwegian Krone
Percentage of net assets
at 30 September 2009
at 31 March 2009
Swiss Franc
Other
PORTFOLIO ANALYSIS BY COUNTRY/AREA
CURRENCY ANALYSIS OF NET ASSETS
PORTFOLIO ANALYSIS BY ASSET CATEGORY
3

4
RIT CAPITAL PARTNERS PLC HALF-YEARLY FINANCIAL REPORT 2009
CHAIRMAN’S STATEMENT
The extraordinary economic and market events over the past two years have elicitedan extreme policy response to match the severity of the crisis. As I noted in last year’sAnnual Report, the Federal Reserve would do whatever it deemed necessary tocombat deflationary forces: by printing money and reducing interest rates to negligiblelevels, the Fed would both encourage investors and prompt some economic recoveryin the shorter term.
Although the rally in equity markets, credit markets and commodities from their recentlows has been significant, the longer-term consequences of these actions are stillunknown. It is the balance between these shorter-term, positive influences and thesizeable, longer-term risks that will continue to make this such a challengingenvironment for investors. Earlier this year, I expressed the view that such risks were
more tilted to an inflationary outcome. We continue to believe this to be the case but recognise that highunemployment and surplus manufacturing capacity may continue to create fears of deflation in the nearfuture.
It is clear too that the pattern of the last decade, whereby consumption in the West has driven theemerging market economies, which have in turn financed western deficits, cannot last indefinitely.Emerging market economies are likely to rely less on exports and more on growth at home, led bydomestic demand.
Recognising the potential impact of the policy actions mentioned above, we increased our public marketexposure (after adjusting for market hedges) from 35% of net assets at the start of your Company’sfinancial year to 64% at 30 September. When unquoted investments are included, our investment exposureincreased from 71% to 95% at 30 September. Given the longer-term concerns expressed above, we feltthat total exposure should not exceed 100% and that the use of leverage was not warranted.
This increase in market exposure, combined with a number of profitable positions, including longcommodities and short treasury bonds, has resulted in a 21.7% rise in our net asset value per share to1,064.1p in the period under review, participating to a significant extent in the global rally that has seenthe Morgan Stanley Capital International World Index in Sterling appreciate by 25.4%. In US Dollar termsour net asset value per share would have risen by 35.8%. It is also worth noting that the net asset valueat 30 September is only 7.9% below our all-time high, whereas the MSCI in Sterling is still 14.6% belowits recent high point.
The FTSE All-Share Index and the Investment Trust Net Assets Index rose by 32.8% and 23.4%respectively over the period under review.
The net asset value per share at 13 November, the latest available date, was 1,035.9p.
ASSET ALLOCATION
As an investment trust in the “global growth” sector, we are committed to a truly global approach bothin terms of markets and currencies, which leads us generally to be less invested in the UK and Sterlingthan many of our peers. As a result, performance will lag in terms of Sterling when the UK market andSterling rise disproportionately, as has been the case over the period under review. We remain of theview that our global approach will serve shareholders best over time.
Shareholders should be aware that within the MSCI World Index, the widely accepted global index, theUK represents 10% of global market capitalisation, as does Sterling. Whilst we do not manage theportfolio with close reference to benchmark weightings, the portfolio’s typical exposure to the UK and toSterling will be more reflective of these weightings over time. We believe that, in this way, we offer ourshareholders genuine global diversification.
We set out below our asset allocation within the investment portfolio at the period end.
Lord RothschildChairman

% of Portfolio % of Portfolio30 September 31 March
2009 2009
Quoted investments 38.3 25.0Hedge funds 2.0 0.7Long equity funds 17.5 15.3Unquoted investments:
Direct 14.5 15.9Funds 12.0 12.6
Government securities and money market funds 14.2 28.8Investment property 1.5 1.7
100.0 100.0
A more detailed analysis of your Company’s portfolio and currency exposure can be found on page 3.
UNQUOTED PORTFOLIO
Developments in this part of the portfolio were dominated by the sale of our largest investment, RobinHood Holdings, a generic pharmaceuticals business, to the US firm, Watson Pharmaceuticals. Ourinvestment was valued at £93.4 million at 30 September, reflecting RIT’s share of expected proceeds andrepresenting a multiple of 5.1x our original investment, made between 2003 and 2005. We had increasedthe valuation of our holding to £81.3 million at 31 March 2009 to reflect the strong progress of theunderlying business. The transaction is expected to complete before the end of 2009.
Our investment in Robin Hood is the second time that we have made a highly successful investmentwith Tony Tabatznik in a generic pharmaceuticals company founded by him.
BOARD
As I mentioned in the Annual Report, Charles Bailey retired as Chairman of the Audit Committee, witheffect from 30 June 2009, and John Cornish took up this position. Both remain valued members of theBoard and, on behalf of our shareholders, I would like to thank both of them for the detailed and expertattention they give to this onerous committee work.
Rothschild20 November, 2009
5

6
RIT CAPITAL PARTNERS PLC HALF-YEARLY FINANCIAL REPORT 2009
INVESTMENT PORTFOLIOAT 30 SEPTEMBER 2009
Value of Investment % of
Investment Holdings Country Description £ million Portfolio
Quoted InvestmentsPayPoint UK Electronic payment systems 27.5 1.5%ishares MSCI Emerging Markets International Emerging market equities 26.8 1.5%Legg Mason USA Asset management 25.4 1.4%Roche Holding Switzerland Pharmaceuticals 24.4 1.3%Suncor Energy Canada Oil and gas 23.8 1.3%Telstra Australia Telecommunications 20.2 1.1%World Trust Fund Luxembourg Investment company 17.9 1.0%Colgate-Palmolive USA Cosmetics and toiletries 17.9 1.0%Microsoft USA Software 17.8 1.0%HSBC Holdings Hong Kong Banking 17.7 1.0%A P Moller - Maersk Denmark Marine transport 17.7 1.0%Pearl Group Netherlands Life assurance 15.3 0.8%RHJ International Japan Investment company with
Japanese focus 14.3 0.8%Kimberly-Clark USA Health and hygiene products 12.7 0.7%Rio Tinto UK Mining 12.5 0.7%Hartford Financial Services USA Insurance 10.2 0.6%Artio Global Investors USA Asset management 8.9 0.5%Apollo Group USA Higher education provider 7.5 0.4%Willbros Group USA Oilfield services 6.1 0.3%Thermo Fisher Scientific USA Scientific instruments 5.6 0.3%651 Other Quoted Investments 367.9 20.1%
Total Quoted Investments 698.1 38.3%
Long Equity Funds and Hedge Funds Martin Currie Global Energy International Global energy 36.3 2.0%Titan Partners USA American equities 34.0 1.9%Nevsky International Hedge fund (emerging markets) 31.4 1.7%Lansdowne UK Strategic UK UK and global equities 29.2 1.6%Findlay Park Latin America South America South American equities 25.0 1.4%CLSA Water Fund Asia Asian water securities 23.9 1.3%CF Egerton Sterling Investment Europe European equities 21.7 1.2%PK Investment Japan Japanese equities 20.4 1.1%Africa Emerging Markets Fund Africa African equities 19.9 1.1%Pivot Point Capital USA US equities 16.5 0.9%Martin Currie Taiwan Opportunites Taiwan Taiwanese equities 15.8 0.9%Blackrock Gold International Precious metals mining 15.7 0.9%16 Other Long Equity Funds and Hedge Funds 65.3 3.5%
Total Long Equity Funds and Hedge Funds 355.1 19.5%

7
Value of Investment % of
Investment Holdings Country Description £ million Portfolio
Unquoted Investments: DirectRobin Hood Holdings Global Generic pharmaceuticals 93.4 5.1%The Economist Newspaper UK Publishing 25.9 1.4%Mondis Technology USA Intellectual Property 12.5 0.7%Martin Currie UK Asset manager 12.3 0.7%Banca Leonardo Italy Investment bank 12.2 0.7%UK Specialist Hospitals UK Private hospitals 12.0 0.7%Purepower UK Energy generation 12.0 0.7%Harbourmaster Jersey Credit manager 11.7 0.6%40 Other Unquoted Investments 72.4 3.9%
Total Unquoted Investments: Direct 264.4 14.5%
Unquoted Investments: FundsFortress Credit Opportunities USA Diversified fixed income 20.9 1.1%Summit Water Development USA US and Australian water rights 12.1 0.7%Sageview Capital Partners USA Unquoted and listed US equity 11.9 0.7%Darwin Private Equity I UK Unquoted investments 11.1 0.6%Audax Private Equity Fund II USA US mid-market private equity 9.1 0.5%Tinicum Capital Partners II USA Unquoted investments 8.3 0.5%Pomona Capital VI USA Fund of private equity funds 6.5 0.4%92 Other Private Equity Funds 139.1 7.5%
Total Unquoted Investments: Funds 219.0 12.0%
Government Securities And Money Market Funds Bundesrepublik 3 1/4% 2010 Germany Government stock 197.4 10.8%Dreyfus US Treasury Fund USA Money market fund 42.5 2.3%Treasury 3 1/4% 2011 UK Government stock 15.6 0.9%Dreyfus Universal Sterling Fund UK Money market fund 4.1 0.2%
Total Government Securities And Money Market Funds 259.6 14.2%
PropertySpencer House and other properties in St James’s Place, London 28.0 1.5%
Total Investments 1,824.2 100.0%

8
RIT CAPITAL PARTNERS PLC HALF-YEARLY FINANCIAL REPORT 2009
RESPONSIBILITY STATEMENT OF THEDIRECTORS IN RESPECT OF THE HALF-YEARLY FINANCIAL REPORT
In accordance with the Disclosure and Transparency Rules 4.2.7R and 4.2.8R, we confirm that to thebest of our knowledge:
(a) The condensed set of financial statements has been prepared in accordance with InternationalAccounting Standard 34, Interim Financial Reporting, as adopted by the European Union, asrequired by the Disclosure and Transparency Rule 4.2.4R;
(b) The Chairman’s Statement includes a fair review of the information required to be disclosed underthe Disclosure and Transparency Rule 4.2.7R, interim management report. This includes (i) anindication of important events that have occurred during the first six months of the financial year,and their impact on the condensed set of financial statements presented in the half-yearly financialreport and (ii) a description of the principal risks and uncertainties for the remaining six months ofthe financial year; and
(c) There were no changes in the transactions or arrangements with related parties as described in theGroup’s annual report for the year ended 31 March 2009 that would have had a material effect onthe financial position or performance of the Group in the first six months of the current financialyear.
Duncan BudgeDirector and Chief Operating Officer
20 November 2009
For and on behalf of the Board, the members of which are listed on page 20.
9
INDEPENDENT REVIEW REPORT TORIT CAPITAL PARTNERS PLC
INTRODUCTIONWe have been engaged by the Company to review the condensed set of financial statements in the half-yearly financial report for the six months ended 30 September 2009, which comprises the consolidatedincome statement, consolidated statement of comprehensive income, consolidated balance sheet,consolidated statement of changes in equity, consolidated cash flow statement and related notes. Wehave read the other information contained in the half-yearly financial report and considered whether itcontains any apparent misstatements or material inconsistencies with the information in the condensedset of financial statements.
DIRECTORS’ RESPONSIBILITIESThe half-yearly financial report is the responsibility of, and has been approved by, the directors. Thedirectors are responsible for preparing the half-yearly financial report in accordance with the Disclosureand Transparency Rules of the United Kingdom’s Financial Services Authority.
As disclosed in note 1, the annual financial statements of the group are prepared in accordance withIFRSs as adopted by the European Union. The condensed set of financial statements included in this half-yearly financial report has been prepared in accordance with International Accounting Standard 34,“Interim Financial Reporting”, as adopted by the European Union.
The half-yearly financial report is published on the Company’s website at www.ritcap.co.uk which ismaintained by the Company’s management. The maintenance and integrity of the RIT Capital Partners plcwebsite is the responsibility of the directors; the work carried out by the auditors does not involveconsideration of these matters and, accordingly, the auditors accept no responsibility for any changes thatmay have occurred to the financial statements since they were initially presented on the website.Legislation in the United Kingdom governing the preparation and dissemination of financial statementsmay differ from legislation in other jurisdictions.
OUR RESPONSIBILITYOur responsibility is to express to the Company a conclusion on the condensed set of financialstatements in the half-yearly financial report based on our review. This report, including the conclusion,has been prepared for and only for the Company for the purpose of the Disclosure and TransparencyRules of the Financial Services Authority and for no other purpose. We do not, in producing this report,accept or assume responsibility for any other purpose or to any other person to whom this report isshown or into whose hands it may come save where expressly agreed by our prior consent in writing.
SCOPE OF REVIEWWe conducted our review in accordance with International Standard on Review Engagements (UK andIreland) 2410, “Review of Interim Financial Information Performed by the Independent Auditor of theEntity”, issued by the Auditing Practices Board for use in the United Kingdom. A review of interimfinancial information consists of making enquiries, primarily of persons responsible for financial andaccounting matters, and applying analytical and other review procedures. A review is substantially less inscope than an audit conducted in accordance with International Standards on Auditing (UK and Ireland)and consequently does not enable us to obtain assurance that we would become aware of all significantmatters that might be identified in an audit. Accordingly, we do not express an audit opinion.
CONCLUSIONBased on our review, nothing has come to our attention that causes us to believe that the condensed setof financial statements in the half-yearly financial report for the six months ended 30 September 2009 isnot prepared, in all material respects, in accordance with International Accounting Standard 34 asadopted by the European Union and the Disclosure and Transparency Rules of the United Kingdom’sFinancial Services Authority.
PricewaterhouseCoopers LLPChartered Accountants
20 November 2009
London

10
CONSOLIDATED INCOME STATEMENT
Six months ended30 September 2009
Revenue Capitalreturn return Total
Notes £ million £ million £ million
IncomeInvestment income 16.5 – 16.5Other income 1.1 – 1.1Gains on dealing investments held at fair value 68.2 – 68.2
85.8 – 85.8Gains on portfolio investments held at fair value – 255.1 255.1Other capital items – (3.5) (3.5)
85.8 251.6 337.4ExpensesAdministrative expenses (7.8) (2.2) (10.0)Investment management fees (1.3) (1.3) (2.6)
Profit before finance costs and tax 76.7 248.1 324.8Finance costs (11.7) – (11.7)
Profit before tax 65.0 248.1 313.1Taxation (16.0) 1.2 (14.8)
Profit for the period 49.0 249.3 298.3
Earnings per ordinary share 2 31.7p 161.4p 193.1p
The total column of this statement represents the Group’s Income Statement, prepared in accordancewith International Financial Reporting Standards. The supplementary revenue return and capital returncolumns are both prepared under guidance published by the Association of Investment Companies. Allitems in the above statement derive from continuing operations.
RIT CAPITAL PARTNERS PLC HALF-YEARLY FINANCIAL REPORT 2009

11
Six months ended Year ended30 September 2008 31 March 2009
Revenue Capital Revenue Capitalreturn return Total return return Total
Notes £ million £ million £ million £ million £ million £ million
IncomeInvestment income 17.9 – 17.9 56.6 – 56.6Other income 1.0 – 1.0 1.9 – 1.9Losses on dealinginvestments held at fair value (32.0) – (32.0) (18.7) – (18.7)
(13.1) – (13.1) 39.8 – 39.8Losses on portfolio investments held at fair value – (134.8) (134.8) – (381.2) (381.2)Other capital items – 15.8 15.8 – 58.1 58.1
(13.1) (119.0) (132.1) 39.8 (323.1) (283.3)ExpensesAdministrative expenses (7.8) (0.9) (8.7) (15.1) 1.3 (13.8)Investment managementfees (3.3) 0.7 (2.6) (7.1) (0.5) (7.6)
Loss before finance costs and tax (24.2) (119.2) (143.4) 17.6 (322.3) (304.7)Finance costs (6.1) – (6.1) (12.7) – (12.7)
Loss before tax (30.3) (119.2) (149.5) 4.9 (322.3) (317.4)Taxation (0.9) (0.5) (1.4) (1.7) 1.4 (0.3)
Loss for theperiod (31.2) (119.7) (150.9) 3.2 (320.9) (317.7)
Earnings per ordinary share 2 (20.2)p (77.3)p (97.5)p 2.1p (202.3)p (205.2)p
The total column of this statement represents the Group’s Income Statement, prepared in accordancewith International Financial Reporting Standards. The supplementary revenue return and capital returncolumns are both prepared under guidance published by the Association of Investment Companies. Allitems in the above statement derive from continuing operations.

12
RIT CAPITAL PARTNERS PLC HALF-YEARLY FINANCIAL REPORT 2009
CONSOLIDATED STATEMENT OFCOMPREHENSIVE INCOME
Six months ended30 September 2009
Revenue Capitalreturn return Total
Notes £ million £ million £ million
Profit for the period 49.0 249.3 298.3
Other comprehensive incomeCash flow hedges 6.9 – 6.9Exchange movements arising on consolidation (0.5) – (0.5)
Total comprehensive income for the period 55.4 249.3 304.7

13
Six months ended Year ended30 September 2008 31 March 2009
Revenue Capital Revenue Capitalreturn return Total return return Total
Notes £ million £ million £ million £ million £ million £ million
Loss for the period (31.2) (119.7) (150.9) 3.2 (320.9) (317.7)
Other comprehensive incomeCash flow hedges 3.0 – 3.0 (13.8) – (13.8)Exchange movements arising on consolidation 0.2 – 0.2 0.8 – 0.8
Total comprehensive income for the period (28.0) (119.7) (147.7) (9.8) (320.9) (330.7)

CONSOLIDATED BALANCE SHEET
14
RIT CAPITAL PARTNERS PLC HALF-YEARLY FINANCIAL REPORT 2009
30 September 31 March 30 September2009 2009 2008
Notes £ million £ million £ million
Non-current assetsInvestments held at fair value 4 1,796.2 1,593.2 1,682.4Investment property 4 28.0 28.5 29.2Property, plant and equipment 0.3 0.4 0.3Derivative financial instruments – – 5.8Deferred tax asset 1.7 0.3 –
1,826.2 1,622.4 1,717.7
Current assetsDealing investments held at fair value 5.0 11.3 3.8Sales for future settlement 107.2 14.7 56.8Derivative financial instruments 29.0 6.0 3.8Other receivables 11.9 13.5 14.1Tax receivable 0.9 0.9 1.0Cash at bank 72.4 98.5 115.7
226.4 144.9 195.2
Total assets 2,052.6 1,767.3 1,912.9
Current liabilitiesBank loans and overdrafts – (0.1) (0.5)Purchases for future settlement (69.2) (19.5) (53.4)Derivative financial instruments (8.0) – (5.9)Tax payable (17.3) (1.8) (1.9)Other payables (2.5) (4.9) (2.2)
(97.0) (26.3) (63.9)
Net current assets 129.4 118.6 131.3
Total assets less current liabilities 1,955.6 1,741.0 1,849.0
Non-current liabilitiesDerivative financial instruments (11.6) (13.7) (2.7)Bank loans (288.8) (369.3) (296.3)Provisions (10.6) (7.0) (12.7)Retirement benefit liability (1.0) (0.5) –Deferred tax liability – – (1.2)
(312.0) (390.5) (312.9)
Net assets 1,643.6 1,350.5 1,536.1
Equity attributable to equity holdersCalled up share capital 154.5 154.5 154.8Capital redemption reserve 35.7 35.7 35.4Cash flow hedging reserve (6.8) (13.7) 3.1Foreign currency translation reserve 0.1 0.6 –Capital reserve 1,416.2 1,166.9 1,370.7Revenue reserve 43.9 6.5 (27.9)
Total shareholders’ equity 1,643.6 1,350.5 1,536.1
Net asset value per ordinary share 1,064.1p 874.3p 992.2p

15
CONSOLIDATED STATEMENT OF CHANGES IN EQUITY
ForeignCapital Cash flow currency
Share redemption hedging translation Capital Revenuecapital reserve reserve reserve reserve reserve Total
Six months ended 30 September 2009 £ million £ million £ million £ million £ million £ million £ million
Balance at 31 March 2009 154.5 35.7 (13.7) 0.6 1,166.9 6.5 1,350.5Profit for the period – – – – 249.3 49.0 298.3Cash flow hedges
Gains/(losses) taken to equity – – (0.8) – – – (0.8)Transferred to the income statement for the period – – 7.7 – – – 7.7
Exchange movements arising on consolidation – – – (0.5) – – (0.5)Ordinary dividend paid – – – – – (11.6) (11.6)
Balance at 30 September 2009 154.5 35.7 (6.8) 0.1 1,416.2 43.9 1,643.6
ForeignCapital Cash flow currency
Share redemption hedging translation Capital Revenuecapital reserve reserve reserve reserve reserve Total
Six months ended 30 September 2008 £ million £ million £ million £ million £ million £ million £ million
Balance at 31 March 2008 154.8 35.4 0.1 (0.2) 1,490.4 9.5 1,690.0Loss for the period – – – – (119.7) (31.2) (150.9)Cash flow hedges
Gains taken to equity – – 3.1 – – – 3.1Transferred to the income statement for the period – – (0.1) – – – (0.1)
Exchange movements arising on consolidation – – – 0.2 – – 0.2Ordinary dividend paid – – – – – (6.2) (6.2)
Balance at 30 September 2008 154.8 35.4 3.1 – 1,370.7 (27.9) 1,536.1
ForeignCapital Cash flow currency
Share redemption hedging translation Capital Revenuecapital reserve reserve reserve reserve reserve Total
Year ended 31 March 2009 £ million £ million £ million £ million £ million £ million £ million
Balance at 31 March 2008 154.8 35.4 0.1 (0.2) 1,490.4 9.5 1,690.0Loss for the year – – – – (320.9) 3.2 (317.7)Cash flow hedges
Losses taken to equity – – (13.8) – – – (13.8)Transferred to the incomestatement for the period – – – – – – –
Exchange movements arisingon consolidation – – – 0.8 – – 0.8Ordinary dividend paid – – – – – (6.2) (6.2)Purchase of own shares (0.3) 0.3 – – (2.6) – (2.6)
Balance at 31 March 2009 154.5 35.7 (13.7) 0.6 1,166.9 6.5 1,350.5
16
CONSOLIDATED CASH FLOW STATEMENT
Six months Six months Yearended ended ended
30 September 30 September 31 March2009 2008 2009
£ million £ million £ million
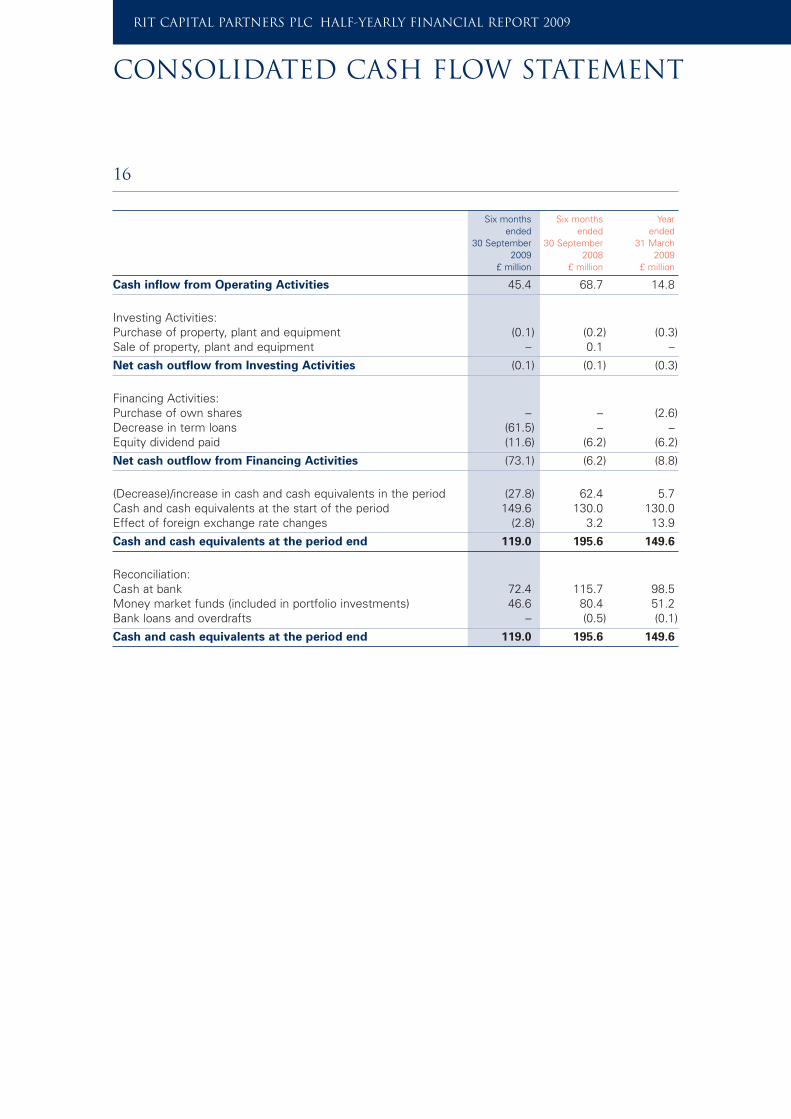
Cash inflow from Operating Activities 45.4 68.7 14.8
Investing Activities:Purchase of property, plant and equipment (0.1) (0.2) (0.3)Sale of property, plant and equipment – 0.1 –
Net cash outflow from Investing Activities (0.1) (0.1) (0.3)
Financing Activities:Purchase of own shares – – (2.6)Decrease in term loans (61.5) – –Equity dividend paid (11.6) (6.2) (6.2)
Net cash outflow from Financing Activities (73.1) (6.2) (8.8)
(Decrease)/increase in cash and cash equivalents in the period (27.8) 62.4 5.7Cash and cash equivalents at the start of the period 149.6 130.0 130.0Effect of foreign exchange rate changes (2.8) 3.2 13.9
Cash and cash equivalents at the period end 119.0 195.6 149.6
Reconciliation:Cash at bank 72.4 115.7 98.5Money market funds (included in portfolio investments) 46.6 80.4 51.2Bank loans and overdrafts – (0.5) (0.1)
Cash and cash equivalents at the period end 119.0 195.6 149.6
RIT CAPITAL PARTNERS PLC HALF-YEARLY FINANCIAL REPORT 2009

NOTES TO THE FINANCIAL STATEMENTS
17
1. BASIS OF ACCOUNTINGThese financial statements are the half-yearly consolidated financial statements of RIT Capital Partnersplc and its subsidiaries for the six months ended 30 September 2009. They are prepared in accordancewith the Disclosure and Transparency Rules of the Financial Services Authority and with InternationalAccounting Standard IAS 34, Interim Financial Reporting, as adopted by the European Union, and wereapproved on 20 November 2009. These half-yearly financial statements should be read in conjunctionwith the Annual Report and Accounts for the year ended 31 March 2009 as they provide an update ofpreviously reported information. The half-yearly consolidated financial statements have been prepared inaccordance with the accounting policies set out in the notes to the consolidated financial statements forthe year ended 31 March 2009. The Group has adopted IAS 1 (Revised), ‘Presentation of financialstatements’ for the first time in these financial statements.
The unquoted portfolio has been re-valued as at 30 September 2009 by the Valuation Committee as partof its detailed, six-monthly review of the fair value of these investments.
2. EARNINGS PER ORDINARY SHAREThe earnings per ordinary share for the six months ended 30 September 2009 is based on the net profitof £298.3 million (six months ended 30 September 2008: net loss of £150.9 million; year ended 31 March2009: net loss of £317.7 million) and the weighted average number of ordinary shares in issue during theperiod of 154.5 million (six months ended 30 September 2008: 154.8 million; year ended 31 March 2009:154.8 million).
The earnings per ordinary share figure detailed above can be further analysed between revenue andcapital as set out below:
Six months Six months Yearended ended ended
30 September 30 September 31 March2009 2008 2009
£ million £ million £ million
Net revenue profit/(loss) 49.0 (31.2) 3.2
Net capital profit/(loss) 249.3 (119.7) (320.9)
298.3 (150.9) (317.7)
Pence Pence Penceper share per share per share
Revenue earnings/(loss) per ordinary share 31.7 (20.2) 2.1
Capital earnings/(loss) per ordinary share 161.4 (77.3) (207.3)
193.1 (97.5) (205.2)
3. NET ASSET VALUE PER ORDINARY SHAREThe net asset value per ordinary share as at 30 September 2009 is based on the net assets attributable toequity shareholders of £1,643.6 million (30 September 2008: £1,536.1 million; 31 March 2009: £1,350.5million) and the number of ordinary shares in issue at 30 September 2009 of 154.5 million (30 September2008: 154.8 million; 31 March 2009: 154.5 million).

18
RIT CAPITAL PARTNERS PLC HALF-YEARLY FINANCIAL REPORT 2009
NOTES TO THE FINANCIAL STATEMENTS
4. MOVEMENTS IN INVESTMENTS
Long Unquoted UnquotedHedge Equity Investments: Investments: Other Investment
Quoted Funds Funds Direct Funds Securities Property Total£ million £ million £ million £ million £ million £ million £ million £ million
Cost at 31 March 2009 488.7 13.3 305.2 258.0 191.0 459.5 25.2 1,740.9
Appreciation/(depreciation) at 31 March 2009 (82.6) (2.3) (57.1) (0.4) 12.9 7.0 3.3 (119.2)
Valuation at 31 March 2009 406.1 11.0 248.1 257.6 203.9 466.5 28.5 1,621.7
Additions 770.3 28.0 52.8 1.8 20.3 209.1 – 1,082.3
Disposals (591.7) (7.1) (36.8) (25.1) (9.2) (415.2) – (1,085.1)
Revaluation 113.4 4.4 54.7 30.1 4.0 (0.8) (0.5) 205.3
Valuation at 30 September 2009 698.1 36.3 318.8 264.4 219.0 259.6 28.0 1,824.2
Cost at 30 September 2009 639.3 33.3 319.6 242.7 207.9 257.0 25.2 1,725.0
Appreciation/(depreciation)at 30 September 2009 58.8 3.0 (0.8) 21.7 11.1 2.6 2.8 99.2
Other securities comprise government securities and investments in money market funds.
5. DIVIDENDS PAID
Six months Six months Yearended ended ended
30 September 30 September 31 March2009 2008 2009
£ million £ million £ million
Dividends paid 11.6 6.2 6.2
Pence per share 7.5p 4.0p 4.0p
6. COMPARATIVE INFORMATIONThe financial information contained in this half-yearly financial report does not constitute statutoryaccounts as defined in section 434 of the Companies Act 2006. The financial information for the halfyears ended 30 September 2009 and 30 September 2008 has not been audited.
The information for the year ended 31 March 2009 has been extracted from the latest published auditedfinancial statements. The audited financial statements for the year ended 31 March 2009 have been filedwith the Registrar of Companies and the report of the auditors on those accounts contained noqualification or statement under section 498(2) or (3) of the Companies Act 2006.

19
SHARE PRICE INFORMATIONThe Company’s £1 ordinary shares are listed on the London Stock Exchange and may be identified usingthe following codes:
TIDM: RCP LNSEDOL: 0736639 GBISIN: GB0007366395
The closing price of the shares is published in the Financial Times, the Times, the Daily Telegraph, theIndependent and the London Evening Standard. Daily and 15 minute delay share price information isdisplayed on the Company’s website: www.ritcap.co.uk.
REGISTRARThe Company’s registrar may be contacted as follows:
Computershare Investor Services PLCThe PavilionsBridgwater RoadBristol BS99 6ZYTel: 0870 703 6307Overseas: +44 870 703 6307
Shareholders (but not ISA or savings scheme members) may contact the registrar should they need tonotify a change of name or address, or have a query regarding the registration of their holding or thepayment of a dividend. Shareholders who wish to have dividends credited directly to their bank accountrather than paid by cheque may do so by arrangement with the Company’s registrar. Shareholders mayalso arrange with the Company’s registrar to have their dividend payment converted into RIT CapitalPartners plc ordinary shares.
ELECTRONIC COMMUNICATIONRegistered holders of ordinary shares of RIT Capital Partners plc may elect to communicate with theCompany electronically as an alternative to receiving hard copy accounts and circulars. This facility isprovided by the Company’s registrars, Computershare Investor Services PLC, and shareholders shouldregister online at www.computershare.com/investors and select the Electronic ShareholderCommunications section to participate. To complete the registration process shareholders will need theirpostcode or country of residence, along with their Shareholder Reference Number, as shown on theirshare certificates or dividend advices. You will also be asked to agree to the Terms and Conditions forElectronic Communication with Shareholders.
The registration may also be effected through the Company’s website and registered shareholders alsohave the facility to check their shareholding or cast proxy votes at general meetings electronically if theywish.
THE RIT CAPITAL PARTNERS PLC INDIVIDUAL SAVINGS ACCOUNT (ISA) ANDSAVINGS SCHEMEInvestors may purchase the Company’s shares through its ISA or Savings Scheme, rather than through astockbroker or other intermediary. ISA and Savings Scheme investments may be either lump sum or byregular monthly payments. Application forms and full details of the Scheme’s operation and its terms andconditions are contained in the ISA and Savings Scheme brochures, which may be downloaded from ourwebsite www.ritcap.co.uk or requested either direct from the Company (020 7514 1923) or from theISA/Savings Scheme Administrator, whose contact details are as follows:
The RIT Capital Partners plc ISA/Savings Schemec/o The Bank of New York Mellon Limited12 Blenheim PlaceEdinburgh EH7 5JHTel: 08448 920 917
INVESTOR INFORMATION

RIT CAPITAL PARTNERS PLC HALF-YEARLY FINANCIAL REPORT 2009
Perivan Financial Print 216064
DIRECTORS AND ADVISERS
DIRECTORSThe Lord Rothschild (Chairman)Charles BaileyMikael Breuer-WeilDuncan BudgeJohn CornishJohn ElkannJames Leigh-PembertonMichael MarksSandra RobertsonNathaniel RothschildIan Wace
SECRETARY AND REGISTERED OFFICEJ. Rothschild Capital Management Limited(a wholly-owned subsidiary of RITCP)27 St James’s PlaceLondon SW1A 1NR
AUDITORSPricewaterhouseCoopers LLPHay’s Galleria1 Hay’s LaneLondon SE1 2RD
SOLICITORSLinklaters LLPOne Silk StreetLondon EC2Y 8HQ
REGISTRARS AND TRANSFER OFFICEComputershare Investor Services PLCRegistrar’s DepartmentThe PavilionsBridgwater RoadBristol BS99 6ZYTelephone: 0870 703 6307/Overseas: +44 870 703 6307
ISA/SAVINGS SCHEME ADMINISTRATORThe Bank of New York Mellon Limited12 Blenheim PlaceEdinburgh EH7 5JHTelephone: 08448 920 917/Overseas: +44 8448 920 917
AICThe Company is a member of the Association of Investment Companieswww.theaic.co.uk
FOR INFORMATION27 St James’s PlaceLondon SW1A 1NRTel: 020 7493 8111Fax: 020 7493 5765email: [email protected]
www.ritcap.co.uk
20

