half-yearly financial report - home - vastned retail … eng.pdf · 2010-08-12 · 1 half-yearly...
TRANSCRIPT

haLf-yearLy fInanCIaL report
of the board of directorsfor the period 01.01 tot 30.06.2010

1
Half-yearly financial report
antwerp, 3 august 2010
InterIm management report
1.1. Operating activities of the first semester 2010
the strong interest for investments in Belgian qualitative commercial real estate also remains in 2010 and has incited the independent property experts of the property investment fund intervest retail to improve the yields in the first semester 2010 for a number of inner-city locations as well as for a number of retail warehouses. the value of the real estate portfolio of intervest retail increased by 1 % during the first semester 2010. the yield1 of the inner-city shops of intervest retail amounts to 5,8 % on 30 June 2010. an average yield of 7,4 % is obtained for retail warehouses. the top yield of the real estate portfolio of the property invest-ment fund amounts to 4,9 % for the shop located on Meir 99 in antwerp.
in the first semester 2010, some lease contracts take effect, for retail warehouses as well as for inner-city shops, generating considerable higher rental income. Here, it concerns lease contracts concluded in 2009 that now enter into force.
the past semester all new lease contracts and rental renewals of intervest retail have been concluded at higher rents reaching a rental increase up to even 38 %. these rental trans-actions, representing together 3 % of the annual rents, will take effect in 2010 or 2011. exception to this evolution is the commercial centre Shopping Julianus in tongres, where market rents are currently under pressure.
intervest retail runs an intensive marketing policy with targeted animation activities for Shopping Julianus in order to attract additional visitors. Besides, the tourist office of the city of tongres is located in Shopping Julianus and since January 2010 the shops also open once a month on Sunday. these initiatives which increase the footfall have a positive effect on the turnover of the shops.
the operating distributable result of intervest retail increases for the first semester 2010 and amounts to € 1,25 per share compared to € 1,23 for the first semester of prior financial year. this represents an increase by 1,5 % per share.
the operating distributable result improves by 1,5 %
increase of fair value of the real estate portfolio by 1 %
expected gross dividend 2010 between € 2,45 and € 2,55 per share
1 the yield is calculated as the relation between current rents (increased by the estimated rental value of vacant locations for rent) and the fair value of investment properties.
regulated information - embargo 03/08/2010, 8.30 am
n1
torfs - Shopping Julianus - tongres
2
Half-yearly financial report
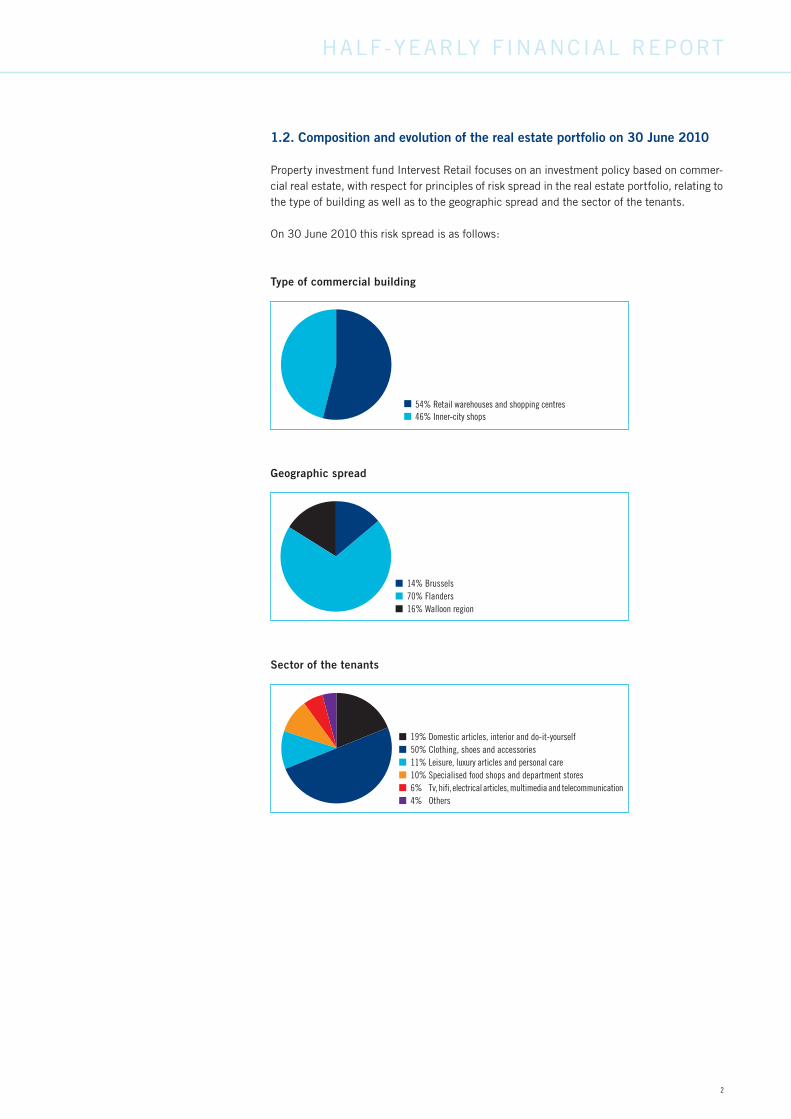
1.2. Composition and evolution of the real estate portfolio on 30 June 2010
property investment fund intervest retail focuses on an investment policy based on commer-cial real estate, with respect for principles of risk spread in the real estate portfolio, relating to the type of building as well as to the geographic spread and the sector of the tenants.
on 30 June 2010 this risk spread is as follows:
Type of commercial building
Geographic spread
Sector of the tenants
46% Inner-city shops54% Retail warehouses and shopping centres
16% Walloon region70% Flanders14% Brussels
4% Others6% Tv, hifi, electrical articles, multimedia and telecommunication10% Specialised food shops and department stores11% Leisure, luxury articles and personal care50% Clothing, shoes and accessories19% Domestic articles, interior and do-it-yourself
3
Half-yearly financial report
REAL ESTATE PATRIMONY 30.06.2010 31.12.2009 30.06.2009
fair value of investment properties (€ 000) 327.637 324.338 328.100
investment value of investment properties
(€ 000) 335.828 332.446 336.303
assets held for sale (€ 000) 285 7.649 591
total leasable space (m²) 159.467 159.633 162.564
occupancy rate (%) 99,1 % 99,1 % 99,2 %
on 30 June 2010, the fair value of the investment properties amounts to € 328 million (€ 324 million on 31 December 2009). this increase by 1 % mainly comes from the increase in fair value of the existing commercial portfolio as a result of the improved situation on the com-mercial real estate investment market.
the occupancy rate2 of the portfolio amounts to 99,1 % on 30 June 2010 and thus remains unchanged compared to 31 December 2009.
regarding the assets held for sale, intervest retail signed in January 2010 the sales deed with the buyer of the development project Shopping park olen3. the sales price (€ 7,2 million) was also received in January 2010.
Valuation of the portfolio by the independent property experts on 30 June 2010:
Valuator Fair value investment properties (€ 000)
cushman & Wakefield 145.445
cB richard ellis 164.652
de crombrugghe & partners 17.540
Total 327.637
2 the occupancy rate is calculated as the ratio of the rental income to the same rental income plus the estimated rental value of the vacant locations for rent.3 See press release of 8 December 2009: intervest retail disinvests site “Shopping park olen”.
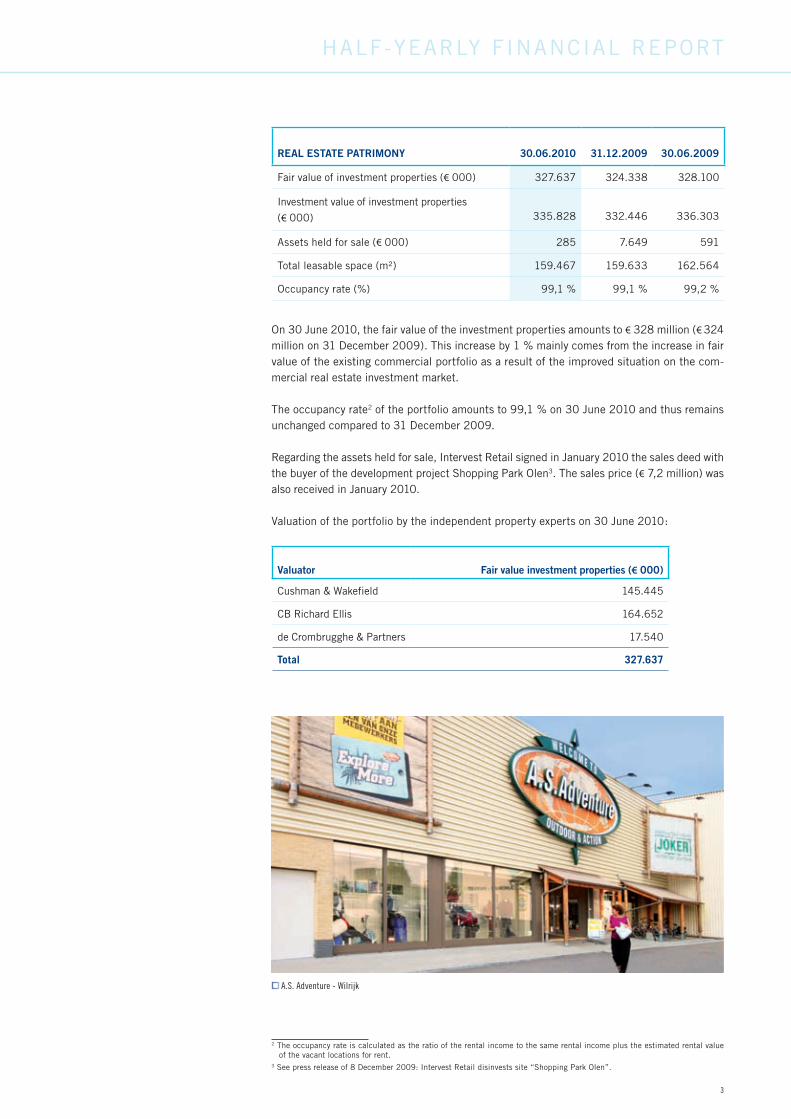
a.S. adventure - Wilrijk
4
Half-yearly financial report
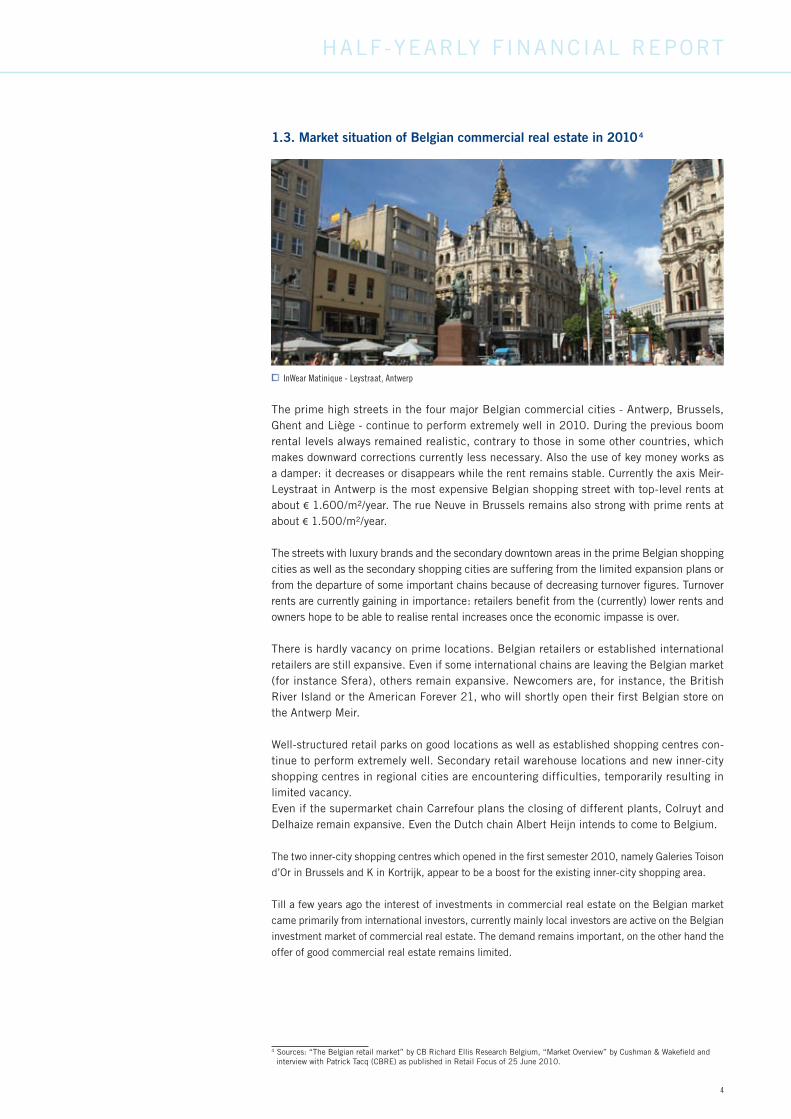
1.3. Market situation of Belgian commercial real estate in 2010 4
the prime high streets in the four major Belgian commercial cities - antwerp, Brussels, Ghent and liège - continue to perform extremely well in 2010. During the previous boom rental levels always remained realistic, contrary to those in some other countries, which makes downward corrections currently less necessary. also the use of key money works as a damper: it decreases or disappears while the rent remains stable. currently the axis Meir-leystraat in antwerp is the most expensive Belgian shopping street with top-level rents at about € 1.600/m²/year. the rue neuve in Brussels remains also strong with prime rents at about € 1.500/m²/year.
the streets with luxury brands and the secondary downtown areas in the prime Belgian shopping cities as well as the secondary shopping cities are suffering from the limited expansion plans or from the departure of some important chains because of decreasing turnover figures. turnover rents are currently gaining in importance: retailers benefit from the (currently) lower rents and owners hope to be able to realise rental increases once the economic impasse is over.
there is hardly vacancy on prime locations. Belgian retailers or established international retailers are still expansive. even if some international chains are leaving the Belgian market (for instance Sfera), others remain expansive. newcomers are, for instance, the British river island or the american forever 21, who will shortly open their first Belgian store on the antwerp Meir.
Well-structured retail parks on good locations as well as established shopping centres con-tinue to perform extremely well. Secondary retail warehouse locations and new inner-city shopping centres in regional cities are encountering difficulties, temporarily resulting in limited vacancy.even if the supermarket chain carrefour plans the closing of different plants, colruyt and Delhaize remain expansive. even the Dutch chain albert Heijn intends to come to Belgium.
the two inner-city shopping centres which opened in the first semester 2010, namely Galeries toison
d’or in Brussels and K in Kortrijk, appear to be a boost for the existing inner-city shopping area.
till a few years ago the interest of investments in commercial real estate on the Belgian market
came primarily from international investors, currently mainly local investors are active on the Belgian
investment market of commercial real estate. the demand remains important, on the other hand the
offer of good commercial real estate remains limited.
4 Sources: “the Belgian retail market” by cB richard ellis research Belgium, “Market overview” by cushman & Wakefield and interview with patrick tacq (cBre) as published in retail focus of 25 June 2010.
InWear matinique - Leystraat, antwerp
5
Half-yearly financial report
1.4. Analysis of the results 5
the net rental income of intervest retail increases during the first semester 2010 by € 0,2 million to € 10,6 million (€ 10,4 million) through higher rental income from rental renewals and indexations within the existing real estate portfolio.
in the first semester 2010, the property charges slightly increase and amount to € 1,1 million (€ 1,0 million). the increase is due to higher technical and commercial costs, partly compen-sated by lower property management costs.
the general costs amount to € 0,5 million and remain at the same level as in the first semester of 2009.
as a result of the increase of the net rental income the operating result before result on portfolio increases by almost € 0,2 million to € 9,0 million (€ 8,8 million).
in the first semester 2010, the positive change in fair value of investment properties amounts to € 3,5 million or approximately 1 % on the value of the portfolio compared to a value decrease of - € 1,7 million in the first semester 2009. this positive effect comes from the increases in value as a result of the valuation by the independent property experts due to the improved situation on the commercial real estate investment market and due to rental renewals in the commercial portfolio of intervest retail, leading to higher rents.
the financial result (excl. the changes in fair value of financial assets and liabilities (ineffective hedges - IAS 39)) amounts to - € 2,5 million for the first semester 2010 (- € 2,5 million). for the first semester 2010, the average interest rate of the property investment fund is approxi-mately 4,2 % including bank margins (4,0 %). intervest retail has prolonged a financing of a credit facility, which expired on 31 March 2010, for an amount of € 25 million. the existing credit facility has been refinanced with a duration of 5 years by the same banker at market rates. through this refinancing, on 30 June 2010, 87 % of the credit lines are long-term finan-cings for an average remaining period of 2,5 years. on 30 June 2010, 65 % of the withdrawn credit facilities have a fixed interest rate, 35 % a variable interest rate. the fixed interest rates are fixed for an average remaining period of 3,6 years.
in the first semester 2010, the changes in fair value of financial assets and liabilities (ineffec-tive hedges - IAS 39) comprise a decrease of the market value of the interest rate swaps which in accordance to iaS 39 cannot be classified as cash flow hedge instrument, for an amount of - € 1,1 million (- € 0,4 million).
for the first semester 2010, the net result of intervest retail amounts to € 8,8 million (€ 4,7 million) and can be divided in:
the • operating distributable result of € 6,4 million (€ 6,3 million) or an increase by 1,5 % mainly as a result of the improvement of the net rental income.
the • result on portfolio of € 3,6 million (- € 1,3 million) as a result of the valuation of the property experts through the improved situation on the commercial real estate market and through rental renewals in the commercial portfolio of intervest retail, leading to higher rents.
the • changes in fair value of financial assets and liabilities (ineffective hedges - IAS 39) and other non-distributable elements for an amount of - € 1,1 million (- € 0,3 million).
5 Between brackets comparable figures on 30 June 2009.
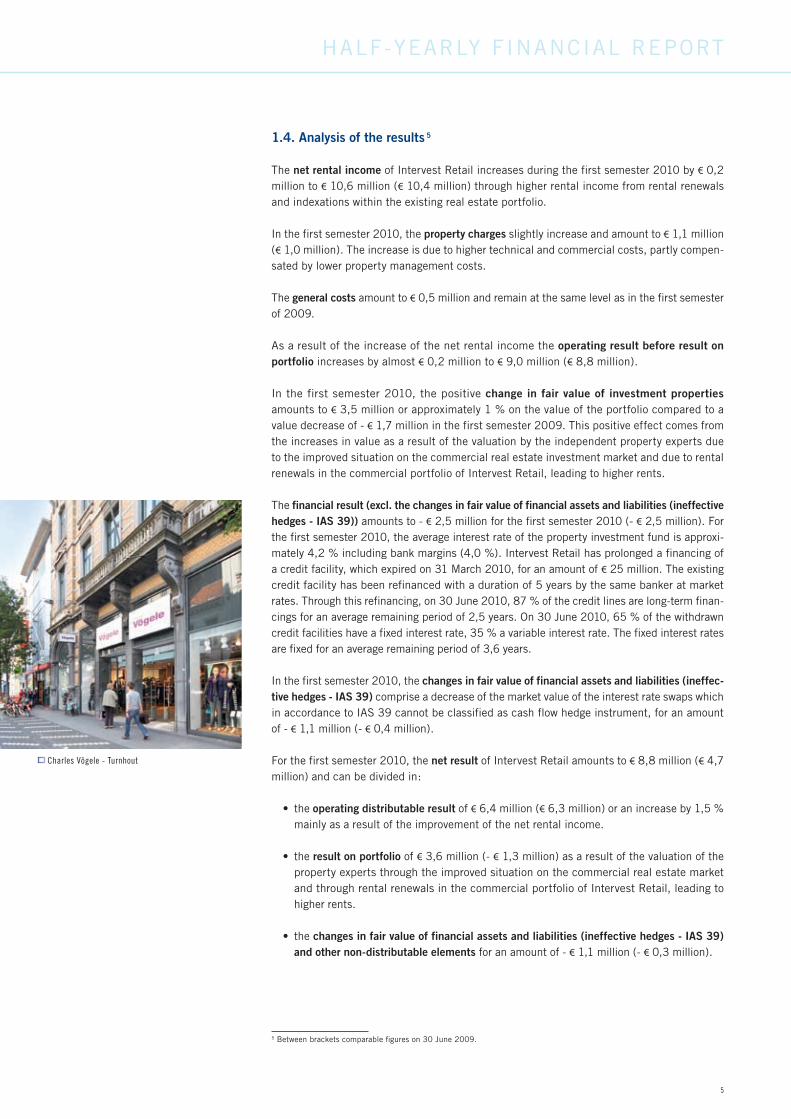
Charles Vögele - turnhout

6
Half-yearly financial report
this represents per share for the first semester 2010 an operating distributable result of € 1,25 (€ 1,23) or an increase by approximately 1,5 % per share.
on the consolidated balance sheet of intervest retail, the non-current assets mainly comprise the investment properties of the property investment fund. on 30 June 2010, the fair value of these investment properties amounts to € 328 million (€ 324 million on 31 December 2009). this increase by 1 % mainly results from the increase in fair value of the existing commercial portfolio through the improved situation on the commercial real estate investment market.
the current assets decrease by € 8 million and amount on 30 June 2010 to € 5 million (€ 13 million on 31 December 2009). this decrease mainly comes from the settlement of the sale of Shopping park olen in the first quarter 2010.
on 30 June 2010, the net asset value (fair value) of the share is € 38,48 (€ 39,30 on 31 December 2009). Given that the share price on 30 June 2010 is € 38,90, the intervest retail share is quoted with a premium of 1 % compared to this net asset value (fair value).
compared to 2009, the non-current liabilities increase by € 24 million to € 113 million and mainly consist of long-term bank financings of which the expiry date is after 30 June 2011. this increase is principally explained by the refinancing of a credit facility which expired on 31 March 2010, for an amount of € 25 million at market rates by the same financial institution as the one which granted the existing credit facility. through this refinancing the current liabilities decrease for the same amount.
the debt ratio of the property investment fund remains unchanged at 39 % on 30 June 2010 (39 % on 31 December 2009), calculated in accordance with the royal Decree of 21 June 2006.
CONSOLIDATED KEY FIGURES PER SHARE 30.06.2010 31.12.2009 30.06.2009
number of shares entitled to dividend 5.078.525 5.078.525 5.078.525
net result (6 months/1 year/6 months) (€) 1,74 2,39 0,93
operating distributable result
(6 months/1 year/6 months) (€) 1,25 2,44 1,23
net asset value (fair value) (€) 38,48 39,30 37,82
net asset value (investment value) (€) 40,08 40,90 39,44
Share price on closing date (€) 38,90 37,60 30,75
premium (+)/discount (-) to net asset value (fair value) (%) 1 % - 4 % - 19 %
7
Half-yearly financial report
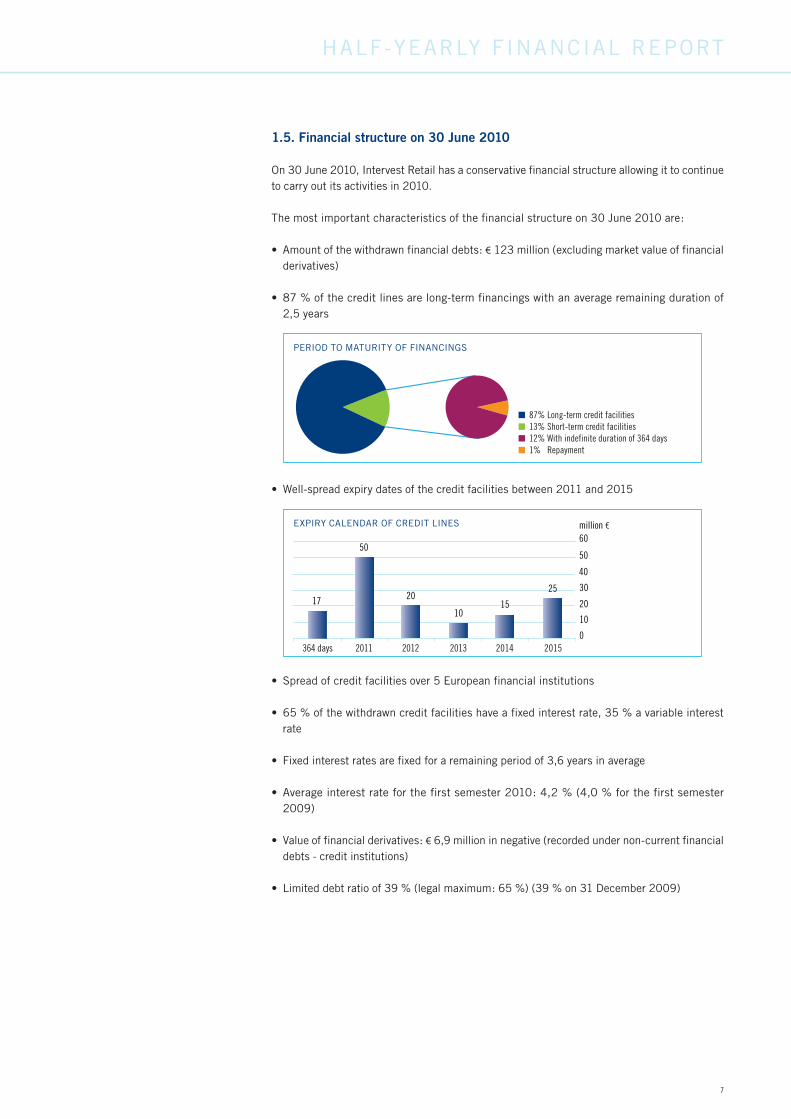
1.5. Financial structure on 30 June 2010
on 30 June 2010, intervest retail has a conservative financial structure allowing it to continue to carry out its activities in 2010.
the most important characteristics of the financial structure on 30 June 2010 are:
amount of the withdrawn financial debts: • € 123 million (excluding market value of financial derivatives)
87 % of the credit lines are long-term financings with an average remaining duration of •2,5 years
Well-spread expiry dates of the credit facilities between 2011 and 2015•
Spread of credit facilities over 5 european financial institutions•
65 % of the withdrawn credit facilities have a fixed interest rate, 35 % a variable interest •rate
fixed interest rates are fixed for a remaining period of 3,6 years in average•
average interest rate for the first semester 2010: 4,2 % (4,0 % for the first semester •2009)
Value of financial derivatives: • € 6,9 million in negative (recorded under non-current financial debts - credit institutions)
limited debt ratio of 39 % (legal maximum: 65 %) (39 % on 31 December 2009)•
perioD to MatUrity of financinGS
1% Repayment 12% With indefinite duration of 364 days13% Short-term credit facilities87% Long-term credit facilities
364 days 2011 2012 2013 2014 2015
17
0
10
20
30
40
50
60 50
20
1015
25
million € eXpiry calenDar of creDit lineS
8
Half-yearly financial report
1.6. Risks for the remaining months of 2010
intervest retail estimates the main risk factors and uncertainties for the remaining months of the financial year 2010 as follows:
Rental risks:• Given the nature of the buildings which are mainly let to national and international com-panies, the real estate portfolio is to a certain degree sensitive to the economic situation. on the short term no direct risks are recognized that can fundamentally influence the results of the financial year 2010. furthermore, within the property investment fund, there are clear and efficient internal control procedures to limit the debtors’ risk.
Evolution of the value of the real estate portfolio:•Given the persisting difficult economic context the Belgian retail market (the rental market as well as the investment market) remains, compared to other european countries, very stable. the best locations still enjoy popularity. the possibility of increasing vacancy and decreasing value of the portfolio is limited.
Evolution of the interest rates: •Due to the financing with borrowed capital, the return of the property investment fund depends on the evolution of the interest rate. to limit this risk an appropriate ratio between borrowed capital with variable interest rate and borrowed capital with fixed interest rate is pursued at the composition of the credit facilities portfolio. on 30 June 2010, 65 % of the credit facilities portfolio consist of loans with a fixed interest rate or fixed through interest rate swaps. 35 % of the credit facilities portfolio have a variable interest rate which is subject to unforeseen rises of the currently low interest rates.
1.7. Forecast for 2010
Despite the fact that the economic crisis is certainly not yet over and that it is expected that consumer spending will remain under pressure in 2010, intervest retail is nevertheless positive regarding the second semester of the year 2010. except for unexpected evolutions, such as important bankruptcies of tenants and unforeseen increases of interest rates, the company expects that the operating distributable result and the dividend will slightly increase in 2010 compared to 2009.
firstly, the relatively low debt ratio of 39 % offers a stable balance sheet position and allows intervest retail to proceed to additional investments. new investments will largely depend on the further evolution on the market of commercial real estate and on the financing possibilities.
Besides, the current rental levels of intervest retail are below the currently common market rents, which support the continuity of the rents. the occupancy rate of the real estate portfolio amounts to 99,1 %, showing the quality of the commercial real estate.
on the basis of the half-yearly results on 30 June 2010, intervest retail expects that for the entire year 2010 the gross dividend will slightly increase compared to the dividend of 2009 which amounted to € 2,44. intervest retail estimates to be able to propose its shareholders a gross dividend per share between € 2,45 and € 2,55. Based on the closing share price on 30 June 2010 (€ 38,90), this represents a gross dividend yield between 6,3 % and 6,6 %.
Company - antwerp

9
Half-yearly financial report
CondenSed ConSoLIdated haLf-yearLy fIgureS
2.1. Condensed consolidated income statement
in thousands € 30.06.2010 30.06.2009
rental income 10.589 10.375
rental-related expenses -26 -20
NET RENTAL INCOME 10.563 10.355
recovery of rental charges and taxes normally payable by tenants on let properties 591.053 88
rental charges and taxes normally payable by tenants on let properties -591.053 -88
other rental-related income and expenses -12 -1
PROPERTY RESULT 10.551 10.354
technical costs -342 -289
commercial costs -97 -41
charges and taxes on unlet properties -50 -52
property management costs -572 -637
other property charges -2 -2
PROPERTY CHARGES -1.063 -1.021
OPERATING PROPERTY RESULT 9.488 9.333
General costs -525 -553
other operating income and costs 11 34
OPERATING RESULT BEFORE RESULT ON PORTFOLIO 8.974 8.814
result on sales of investment properties and development projects 94 490
changes in fair value of investment properties and development projects 3.454 -1.744
OPERATING RESULT 12.522 7.560
financial income 3 14
interest charges -2.513 -2.506
other financial charges -7 -18
changes in fair value of financial assets and liabilities (ineffective hedges - iaS 39) -1.107 -350
FINANCIAL RESULT -3.624 -2.860
RESULT BEFORE TAXES 8.898 4.700
TAXES -75 6
NET RESULT 8.823 4.706
Note:
Operating distributable result 6.366 6.272
Result on portfolio 3.548 -1.254
Changes in fair value of financial assets and liabilities (ineffective hedges - IAS 39) and other non-distributable elements -1.091 -312
attributable to:
equity holders of the parent company 8.823 4.706
Minority interests 0 0
n2
10
Half-yearly financial report
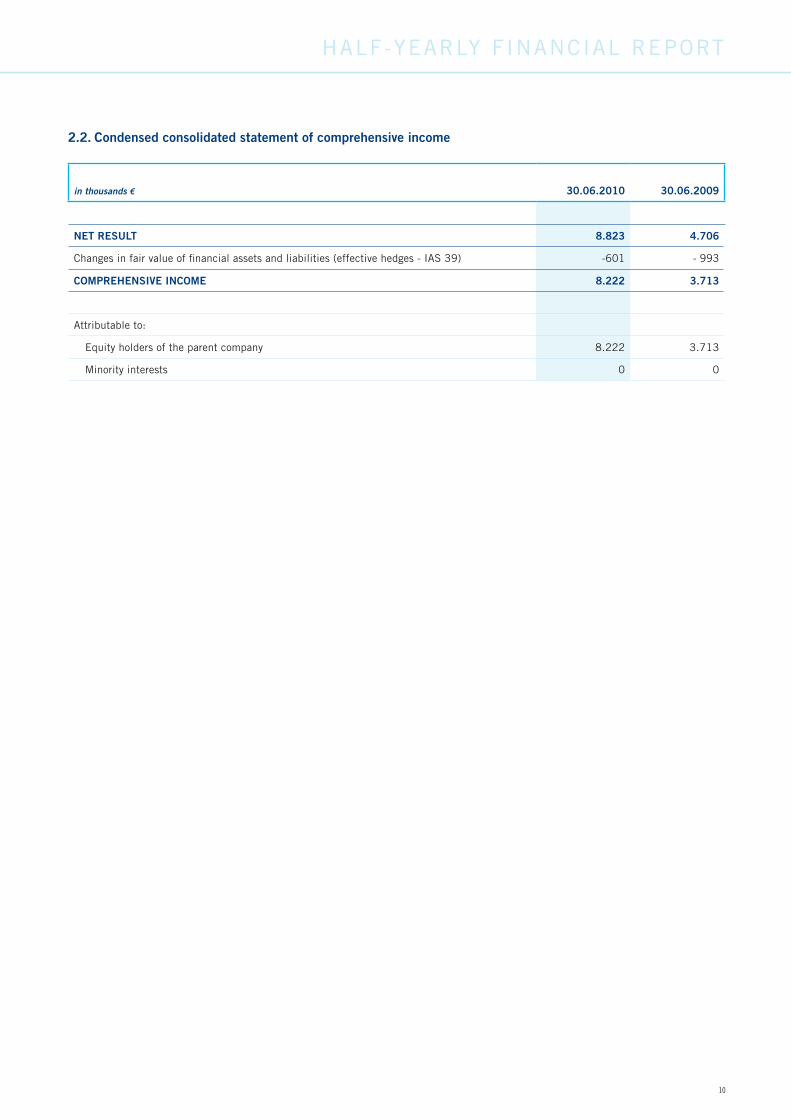
2.2. Condensed consolidated statement of comprehensive income
in thousands € 30.06.2010 30.06.2009
NET RESULT 8.823 4.706
changes in fair value of financial assets and liabilities (effective hedges - iaS 39) -601 - 993
COMPREHENSIVE INCOME 8.222 3.713
attributable to:
equity holders of the parent company 8.222 3.713
Minority interests 0 0

11
Half-yearly financial report
2.3. Condensed consolidated balance sheet
ASSETS in thousands € 30.06.2010 31.12.2009
Non-current assets 327.838 324.574
intangible assets 20 27
investment properties6 327.637 324.338
other tangible assets 163 191
trade receivables and other non-current assets 18 18
Current assets 4.569 12.643
assets held for sale 285 7.649
trade receivables 583 357
tax receivables and other current assets 2.309 3.403
cash and cash equivalents 1.013 1.074
Deferred charges and accrued income 379 160
TOTAL ASSETS 332.407 337.217
SHAREHOLDERS’ EQUITY AND LIABILITIES in thousands € 30.06.2010 31.12.2009
Shareholders’ equity 195.418 199.588
Shareholders’ equity attributable to the shareholders of the parent company 195.418 199.588
Share capital 97.213 97.213
Share premium 4.183 4.183
reserves 107.941 110.688
impact on fair value of estimated transaction rights and costs resulting from the hypothetical disposal of investment properties -8.108 -8.108
changes in fair value of financial assets and liabilities -5.811 -4.388
Minority interests 0 0
Liabilities 136.989 137.629
Non-current liabilities 112.755 88.477
provisions 288 320
non-current financial debts 112.317 88.010
Credit institutions 112.302 87.993
Financial lease 15 17
other non-current liabilities 48 51
Deferred taxes - liabilities 102 96
Current liabilities 24.234 49.152
current financial debts 17.806 43.002
Credit institutions 17.803 42.999
Financial lease 3 3
trade debts and other current debts 4.516 4.301
other current liabilities 583 681
accrued charges and deferred income 1.329 1.168
TOTAL SHAREHOLDERS’ EQUITY AND LIABILITIES 332.407 337.217
6 including development projects.

12
Half-yearly financial report
2.4. Condensed consolidated cash flow statement
in thousands € 30.06.2010 30.06.2009
CASH AND CASH EQUIVALENTS AT THE BEGINNING OF THE FINANCIAL YEAR 1.074 498
1. Cash flow from operating activities 7.542 5.121
Operating result 12.522 7.560
Interests paid (exclusive capitalised interest expenses) -2.481 -2.810
Other non-operating elements -1.257 -353
Adjustment of the result for non-cash flow transactions -2.376 1.610
- Depreciations on intangible and other tangible assets 54 55
- result on the sale of investment properties and development projects -94 -490
- Spread of rental discounts and benefits granted to tenants 10 -31
- changes in fair value of investment properties and development projects -3.454 1.744
- changes in fair value of financial assets and liabilities (ineffective hedges - iaS 39) 1.107 350
- other non-cash flow transactions 1 -18
Changes in working capital 1.134 -886
- Movement of assets 649 890
- Movement of liabilities 485 -1.776
2. Cash flow from investment activities 7.389 -1.300
acquisition of intangible and other tangible assets -19 -28
investments in existing investment properties -38 -2.910
investments in development projects 0 -93
investments in assets held for sale -2 -435
capitalised interest expenses 0 -14
proceeds of the sale of investment properties and development projects 7.448 2.180
3. Cash flow from financing activities -14.992 -3.311
repayment of loans -2.595 -185
Drawdown of loans 0 7.750
repayment of financial lease liabilities -2 -2
receipts from non-current liabilities as guarantee -3 -6
Dividend paid -12.392 -10.868
CASH AND CASH EQUIVALENTS AT THE END OF THE SEMESTER 1.013 1.008
13
Half-yearly financial report
in t
hous
ands
€S
hare
capi
tal
Sha
re p
rem
ium
Res
erve
sIm
pact
on
the
fair
valu
e*
Cha
nges
in
fair
val
ue o
f fin
anci
al a
sset
s an
d lia
bilit
ies
Min
orit
y in
tere
sts
Tota
l sh
areh
olde
rs’
equi
ty
Bal
ance
at
31
Dec
embe
r 2
00
89
7.2
13
4.1
83
10
9.4
70
-8.1
85
-3.4
36
31
99
.24
8
com
preh
ensi
ve in
com
e of
the
firs
t se
mes
ter
20
09
4.7
06
-99
33
.71
3
tran
sfer
s:
impa
ct o
n fa
ir v
alue
*•
18
-18
0
cha
nge
in f
air
valu
e of
fina
ncia
l ass
ets
and
• li
abili
ties
thr
ough
the
inco
me
stat
emen
t
3
50
-35
00
Div
iden
ds fi
nanc
ial y
ear
20
08
-1
0.8
68
-10
.86
8
Bal
ance
at
30
Jun
e 2
00
99
7.2
13
4.1
83
10
3.6
76
-8.2
03
-4.7
79
31
92
.09
3
Bal
ance
at
31
Dec
embe
r 2
00
9 7
97
.21
34
.18
31
10
.68
8-8
.10
8-4
.38
80
19
9.5
88
com
preh
ensi
ve in
com
e of
the
firs
t se
mes
ter
20
10
8.8
23
-60
18
.22
2
tran
sfer
of t
he c
hang
e in
fair
valu
e of
fina
ncia
l ass
ets
and
liabi
litie
s th
roug
h th
e in
com
e st
atem
ent
2009
82
2-8
22
0
Div
iden
ds fi
nanc
ial y
ear
20
09
-12
.39
2-1
2.3
92
Bal
ance
at
30
Jun
e 2
01
09
7.2
13
4.1
83
10
7.9
41
-8.1
08
-5.8
11
01
95
.41
8
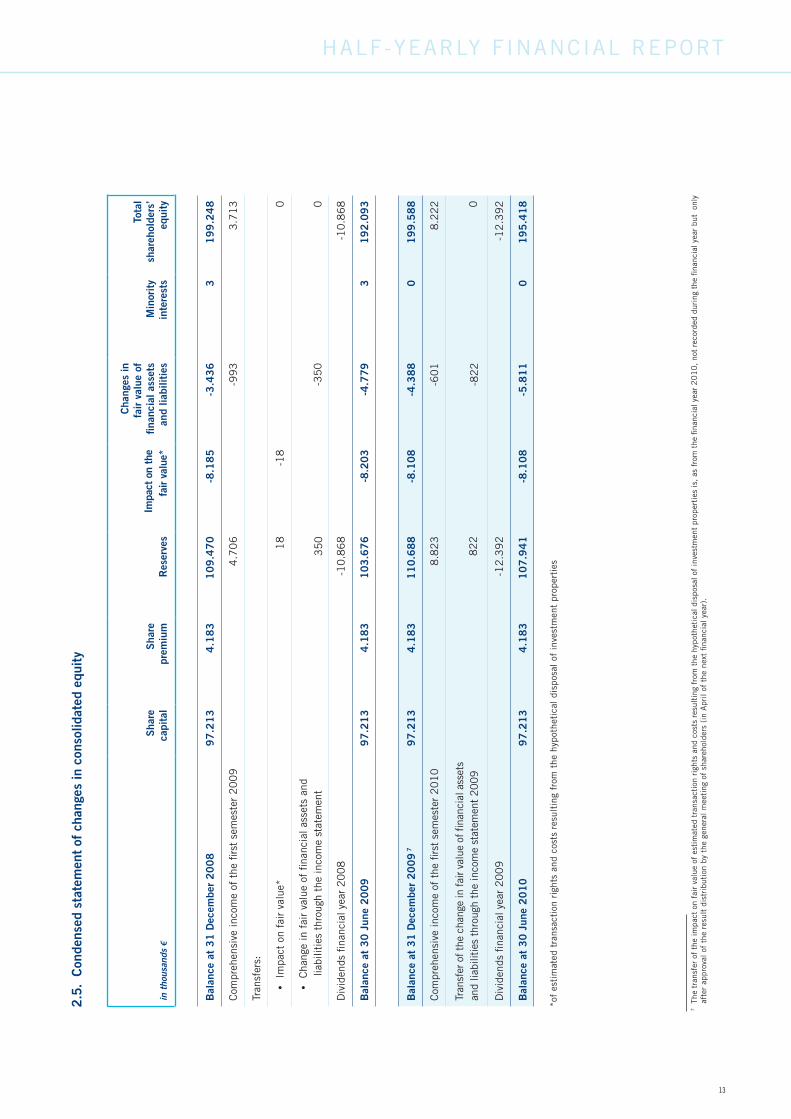
*of
esti
mat
ed t
rans
acti
on r
ight
s an
d co
sts
resu
ltin
g fr
om t
he h
ypot
heti
cal di
spos
al o
f in
vest
men
t pr
oper
ties
2.5.
Con
dens
ed s
tate
men
t of
cha
nges
in c
onso
lidat
ed e
quit
y
7 th
e tr
ansf
er o
f th
e im
pact
on
fair
val
ue o
f es
tim
ated
tra
nsac
tion
rig
hts
and
cost
s re
sult
ing
from
the
hyp
othe
tica
l dis
posa
l of
inve
stm
ent
prop
erti
es is
, as
fro
m t
he fi
nanc
ial y
ear
20
10
, no
t re
cord
ed d
urin
g th
e fin
anci
al y
ear
but
onl
y af
ter
appr
oval
of
the
resu
lt d
istr
ibut
ion
by t
he g
ener
al m
eeti
ng o
f sh
areh
olde
rs (
in a
pril
of t
he n
ext
finan
cial
yea
r).

14
Half-yearly financial report
2.6. Notes to the condensed consolidated half-yearly figures
Condensed consolidated segmented income statement
BUSINESS SEGMENTInner-city
shopsRetail warehouses & shopping centres Corporate TOTAL
in thousands €
30.06.2010
30.06.2009
30.06.2010
30.06.2009
30.06.2010
30.06.2009
30.06.2010
30.06.2009
rental income 4.869 4.579 5.720 5.796 10.589 10.375
rental-related expenses 0 -8 -26 -12 -26 -20
rental-related costs and income 0 0 -12 -1 -12 -1
PROPERTY RESULT 4.869 4.571 5.682 5.783 10.551 10.354
OPERATING RESULT BEFORE RESULT ON PORTFOLIO 4.678 4.424 5.388 5.564 -1.092 -1.174 8.974 8.814
result on sales of investment properties and development projects 0 0 94 490 0 0 94 490
changes in fair value of investment properties and development projects 3.976 -1.497 -522 -247 0 0 3.454 -1.744
OPERATING RESULT OF THE SEGMENT 8.654 2.927 4.960 5.807 -1.092 -1.174 12.522 7.560
financial result -3.624 -2.860 -3.624 -2.860
taxes -75 6 -75 6
NET RESULT 8.654 2.927 4.960 5.807 -4.791 -4.028 8.823 4.706
BUSINESS SEGMENT: KEY FIGURES Inner-city shopsRetail warehouses& shopping centres TOTAL
in thousands € 30.06.2010 30.06.2009 30.06.2010 30.06.2009 30.06.2010 30.06.2009
fair value of investment properties 167.859 160.934 159.778 167.166 327.637 328.100
investment value of investment properties 172.055 164.958 163.773 171.345 335.828 336.303
accounting yield of the segment (%) 2,9 % 5,7 % 3,6 % 6,9 % 3,2 % 6,3 %
total leasable space (m²) 32.147 32.147 127.320 130.417 159.467 162.564
occupancy rate (%) 100,0 % 99,3 % 98,3 % 99,1 % 99,1 % 99,2 %

15
Half-yearly financial report
Principles for the preparation of the half-yearly figures
the condensed consolidated half-yearly figures are prepared on the basis of the principles of financial information in accordance with iaS 34 “interim financial information”. in these condensed half-yearly figures the same principles of financial information and calculation methods are used as those used for the consolidated annual accounts on 31 December 2009.
Evolution of investment properties
Investment properties Development projects TOTAL
in thousands € 30.06.2010 30.06.2009 30.06.2010 30.06.2009 30.06.2010 30.06.2009
Amount at the end of the financial year 324.338 320.043 0 7.355 324.338 327.398
Sales of investment properties -188 -601 0 0 -188 -601
investments in existing investment propertiesand development projects 38 2.910 0 93 38 3.003
capitalised interest expenses 0 14 0 0 0 14
change in fair value of investment properties (+/-) 3.449 -1.052 0 -662 3.449 -1.714
Amount at the end of the semester 327.637 321.314 0 6.786 327.637 328.100
Overview of future minimum rental income
the cash value of the future minimum rental income until the first expiry date of the lease contracts is subject to the following collection terms:
in thousands € 30.06.2010 30.06.2009
receivables with a remaining duration of:
less than one year 20.229 20.150
Between one and five years 25.175 19.470
Total of future minimum rental income 45.404 39.620
Non-current and current liabilities
an update of the financial structure on 30 June 2010 is provided in paragraph 1.5. (supra) of the interim management report.
Off-balance sheet obligations
in the first semester 2010, there were no changes in the off-balance sheet obligations as described in note 23 of the financial report of the annual report 2009.
Post-balance sheet event
there are no significant events to be mentioned that occurred after the closing of the accounts as at 30 June 2010.
16
Half-yearly financial report
2.7. Statutory auditor’s report
interVeSt retail Sa,pUBlic property inVeStMent fUnD UnDer BelGian laW
liMiteD reVieW report on tHe conSoliDateD Half-year financial inforMation for tHe SiX-MontH perioD enDeD 30 JUne 2010
to the board of directors
We have performed a limited review of the accompanying consolidated condensed balance sheet, condensed income statement, condensed statement of comprehensive income, condensed cash flow statement, condensed statement of changes in equity and selective notes (jointly the “interim financial information”) of interVeSt retail Sa, pUBlic property inVeStMent fUnD UnDer BelGian laW (“the company”) and its subsidiaries (jointly “the group”) for the six-month period ended 30 June 2010. the board of directors of the company is responsible for the preparation and fair presentation of this interim financial information. our responsibility is to express a conclusion on this interim financial information based on our review. the interim financial information has been prepared in accordance with iaS 34, “Interim Financial Reporting” as adopted by the eU.
our limited review of the interim financial information was conducted in accordance with the recommended auditing standards on limited reviews applicable in Belgium, as issued by the ”institut des réviseurs d’entreprises/instituut van de Bedrijfsrevisoren”. a limited review consists of making inquiries of group management and applying analytical and other review procedures to the interim financial information and underlying financial data. a limited review is substantially less in scope than an audit performed in accor-dance with the auditing standards on consolidated annual accounts as issued by the ”institut des réviseurs d’entreprises/instituut van de Bedrijfsrevisoren”. accordingly, we do not express an audit opinion.
Based on our limited review, nothing has come to our attention that causes us to believe that the interim financial information for the six-month period ended 30 June 2010 is not prepared, in all material respects, in accordance with iaS 34, ”Interim Financial Reporting” as adopted by the eU.
antwerp, 3 august 2010
The statutory auditor
DELOITTE Bedrijfsrevisoren / Réviseurs d’EntreprisesBV o.v.v.e. cVBa / Sc s.f.d. Scrl
represented by
frank Verhaegen Kathleen De Brabander

17
Half-yearly financial report
in accordance with article 13 § 2 of the royal Decree of 14 november 2007, reinier van Gerrevink, managing director and member of the management committee and Hubert roovers, managing director, declare that according to their knowledge,
a) the condensed half-yearly figures, prepared in accordance with the principles of financial information in accordance with ifrS and in accordance with iaS 34 “Interim Financial Information” as accepted by the european Union, give a true and fair view of the equity, the financial position and the results of intervest retail and the companies included in the consolidation
b) the interim annual management report gives a true statement of the main events which occurred during the first six months of the current financial year, their influence on the condensed half-yearly figures, the main risk factors and uncertainties regarding the remaining months of the financial year, as well as the main transactions between related parties and their possible effect on the condensed half-yearly figures if these transactions should have a significant importance and were not concluded at normal market conditions.
these condensed half-yearly figures have been approved for publication by the board of directors of 2 august 2010.
Note to the editors: for more information, please contact: interVeSt retail Sa, public property investment fund under Belgian law, Jean-paul Sols - ceo or inge tas - cfo, t + 32 3 287 67 87, www.intervestretail.be
Statement to the haLf-yearLy fInanCIaL reportn3