half-yearly monetary and financial stability report
TRANSCRIPT

HALF-YEARLY MONETARY ANDFINANCIAL STABILITY REPORT
December 2008
This Report reviews statistical information between end-May and end-November 2008.

Summary
HALF-YEARLY MONETARY AND FINANCIAL STABILITY REPORT DECEMBER 20082
Summary
The external economic environment has deteriorated markedly since the
last Report. Major advanced industrial economies are in, or on the brink
of, recession. Conditions in financial markets are precarious. Against
this background a significant economic downturn is inevitable in Hong
Kong, and financial conditions will become unusually challenging.
Measures introduced by the Hong Kong Monetary Authority to ease
tensions in the local interbank market have provided a measure of relief
from the financial tensions, and the fiscal actions proposed by the
Government are likely to give some support to the real economy. These
actions, together with the strong initial position of local financial
institutions, will help the economy weather the global financial crisis
relatively well.
Projections for economic growth have been revised downwards
continually as the effects of the global financial crisis are being
transmitted to the real economy. For example, the projections by
the International Monetary Fund (IMF) for real GDP growth in the
US in 2008 have been reduced to 1.4% in its November report from
1.6% in the October report. The corresponding projections for the
euro area are 1.2% and 1.3% respectively. More revealing is the
reduction in forecasts for 2009. The US economy is now expected to
contract by 0.7% (against a positive growth rate of 0.1% projected in
October) and the euro area is expected to contract by 0.5% (versus a
positive 0.2% growth rate projected in October). Projections for the
economy of Mainland China also point to a declining growth rate.
The recently announced fiscal stimulus package will provide helpful
support and may be sufficient to maintain real GDP growth in the
8-9% range for the current and coming year. The slowdown in
Mainland exports will have a significant knock-on effect on regional
economies. As discussed in Box 1, in spite of the increased exports
to the Mainland, these economies remain predominantly dependent
on imports from the US and other industrial countries. The reason
is that their exports to the Mainland contain a large proportion of
goods that are used as inputs in the production of China’s exports to
the US and Europe.
An economic downturn in Hong Kong’s trading partners inevitably
results in a downturn of the local economy. The effects of the
sharp decline in the local stock market on household consumption
and the impact of tightened credit on business investment will add
to the downward pressure on aggregate demand. The November
consensus forecast for real GDP growth in Hong Kong is 3.6% in
2008 and 1.4% in 2009. Most recently, however, a group of major
private sector banks have revised their forecast for 2009 down to
an average of -0.3%.

Summary
3HALF-YEARLY MONETARY AND FINANCIAL STABILITY REPORT DECEMBER 2008
Together with the recent decline in food and energy prices, the
downturn in economic activity will have a moderating influence
on inflation. The latest market consensus forecast for 2008 is a
year-on-year headline rate of 4.5%, implying a 5.8% rate if special
measures are excluded. In view of the likely further softening of
economic growth in 2009 and the rapidly declining rental rates for
residential property, the headline inflation rate for 2009 is likely to
decline further to the 2-4% range.
The financial problems that originated about a year and a half ago
in a small segment of the US mortgage market have now
transformed into a full-scale global financial crisis. Interbank
markets are not functioning properly as shown by the significant
spreads of term interbank rates over current and expected future
overnight rates in major financial centres. In addition, the cost of
insuring against the risk of default of financial institutions has
soared, and banks’ lending to the corporate and household sectors
has been curtailed in many jurisdictions. Hong Kong has not been
spared from the effects of the financial crisis. Chapter 3 in the
Report documents the evolving tensions in the local interbank
market and the offsetting measures taken by the Hong Kong
Monetary Authority. These include a reduction in the discount
rate, a widening of the types of assets accepted as collateral for
such borrowing, and an extension of the term from overnight to
three months. In order to buttress confidence in the banking
system, the Government has also expanded deposit protection and
provided conditional capital support for local financial
institutions. These measures, as well as the accumulated
credibility of the Linked Exchange Rate system, have ensured that
no significant pressure has appeared in the foreign exchange
market. While the strong-side convertibility undertaking has been
hit a number of times, requiring purchases of US dollars by the
HKMA, there have been no signs of speculative pressure on the
Hong Kong dollar.
Chapter 3 also documents that despite the increase in interest rate
risk and credit risk, and notwithstanding the decline in the
profitability of local retail banks, the systemic risk of the banking
sector in Hong Kong appears to be contained as capitalisation
levels remain strong. The recent increase in interbank interest
rates has heightened the basis risk for financial institutions that
fund loans in this market. At the same time, the credit risk of
loans to the corporate sector has increased in view of the
deteriorating economic conditions. The credit risk associated with
mortgage lending has also increased as real estate prices have
started to decline. The interplay between tightened liquidity
conditions in the interbank market and the increased default risk

Summary
HALF-YEARLY MONETARY AND FINANCIAL STABILITY REPORT DECEMBER 20084
of banks is studied in a newly-developed stress testing framework
described in Box 6. This framework highlights the potentially
destabilising dynamics linking the liquidity risk and credit risk of
financial institutions, but concludes that the conditions in Hong
Kong’s banking system are such that the likelihood of a self-
perpetuating deterioration in liquidity and credit risk is minimal.
The risks facing both the real and financial sectors of the economy
are particularly pronounced at this time. The evolution of the
external environment is, as usual, crucial for the prospects for
Hong Kong. The nature, speed, and magnitude of policy measures
taken by the authorities in the major economies are, therefore, of
critical importance. At the 15 November meeting of the leaders of
the G-20 economies, agreement was reached on the need for
policy actions to stabilise the world’s financial system, to support
aggregate demand, and to maintain an open international trading
system. How well these goals are attained will have a decisive
bearing on Hong Kong’s economy in the coming year.
The Half-Yearly Report on Monetary and Financial Stability is prepared
by the staff of the Research Department of the Hong Kong
Monetary Authority.

5HALF-YEARLY MONETARY AND FINANCIAL STABILITY REPORT DECEMBER 2008
Half-Yearly Monetary and Financial Stability ReportDecember 2008
Table of Contents
1. Global and regional setting 6
External environment 61.1 Real activities and trade 61.2 Global financial conditions 13
Mainland China 181.3 Output growth, external trade and inflation 181.4 Monetary conditions, asset prices and the renminbi
exchange rate 211.5 Policy response 24
2. Domestic economy 26
Demand 262.1 Aggregate demand 262.2 Domestic demand 272.3 External trade 28
Output and supply 302.4 Output 302.5 Labour and productivity 31
Prices and wages 332.6 Labour costs 332.7 Commodity and import prices 372.8 Consumer prices 37
Asset markets 392.9 Equity market 392.10 Property market 40
Public finances 432.11 Public finances 43
3. Monetary and financial sector 45
Exchange rate, interest rates and monetary developments 453.1 Exchange rate and interest rates 453.2 Monetary Base and the Backing Ratio 533.3 Money, credit and monetary conditions 533.4 Balance of Payments 55
Banking sector performance 563.5 Profitability and capitalisation 563.6 Liquidity and funding 583.7 Interest rate risk 683.8 Credit risk 683.9 Systemic risk of the banking system 753.10 Foreign currency position 76
4. Outlook, risks and uncertainties 78
4.1 Global outlook 784.2 Domestic outlook 814.3 Uncertainties and risks 84
Box 1. Trade linkage between East Asian economies and major exportmarkets through processing trade in China 9
Box 2. Measuring financial market interdependence and assessingpossible contagion risk in the Asia-Pacific region 14
Box 3. Labour market flexibility in Hong Kong 35Box 4. Measures undertaken by the HKMA and the Financial Secretary
in response to the global financial crisis 50Box 5. An indicative decomposition of the HIBOR – OIS spreads 61Box 6. A liquidity risk stress-testing framework with interaction between
market and credit risks 64
Glossary of terms
Abbreviations
HALF-YEARLY MONETARY AND FINANCIAL STABILITY REPORT DECEMBER 20086
1. Global and regional setting
1 For the US, the euro area, the UK, Japan and non-Japan Asia(ex-Mainland China), all quarterly real GDP percentage changes areon a seasonally-adjusted annualised basis, unless otherwise stated.
-4
-2
0
2
4
6
8% qoq annualised
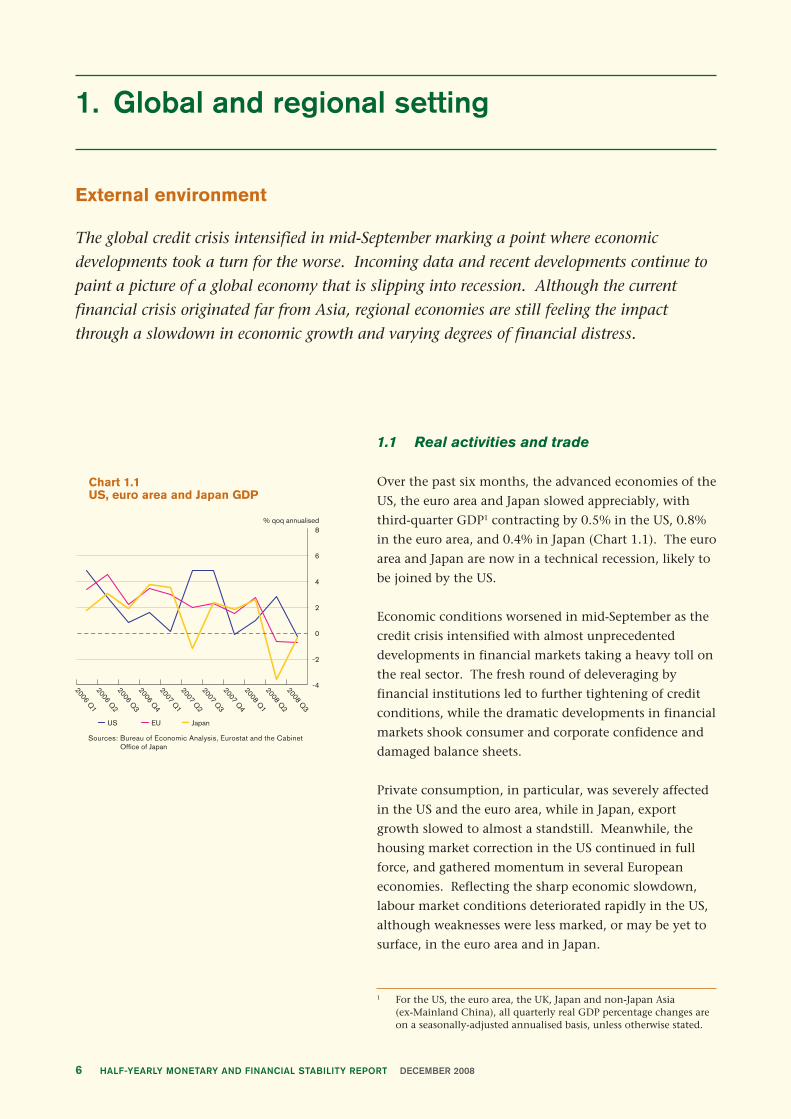
Chart 1.1 US, euro area and Japan GDP
US EU Japan2006 Q
12006 Q
22006 Q
32006 Q
42007 Q
12007 Q
22007 Q
32007 Q
42008 Q
12008 Q
22008 Q
3
Sources: Bureau of Economic Analysis, Eurostat and the Cabinet Office of Japan
External environment
The global credit crisis intensified in mid-September marking a point where economic
developments took a turn for the worse. Incoming data and recent developments continue to
paint a picture of a global economy that is slipping into recession. Although the current
financial crisis originated far from Asia, regional economies are still feeling the impact
through a slowdown in economic growth and varying degrees of financial distress.
1.1 Real activities and trade
Over the past six months, the advanced economies of the
US, the euro area and Japan slowed appreciably, with
third-quarter GDP1 contracting by 0.5% in the US, 0.8%
in the euro area, and 0.4% in Japan (Chart 1.1). The euro
area and Japan are now in a technical recession, likely to
be joined by the US.
Economic conditions worsened in mid-September as the
credit crisis intensified with almost unprecedented
developments in financial markets taking a heavy toll on
the real sector. The fresh round of deleveraging by
financial institutions led to further tightening of credit
conditions, while the dramatic developments in financial
markets shook consumer and corporate confidence and
damaged balance sheets.
Private consumption, in particular, was severely affected
in the US and the euro area, while in Japan, export
growth slowed to almost a standstill. Meanwhile, the
housing market correction in the US continued in full
force, and gathered momentum in several European
economies. Reflecting the sharp economic slowdown,
labour market conditions deteriorated rapidly in the US,
although weaknesses were less marked, or may be yet to
surface, in the euro area and in Japan.
Global and regional setting
7HALF-YEARLY MONETARY AND FINANCIAL STABILITY REPORT DECEMBER 2008
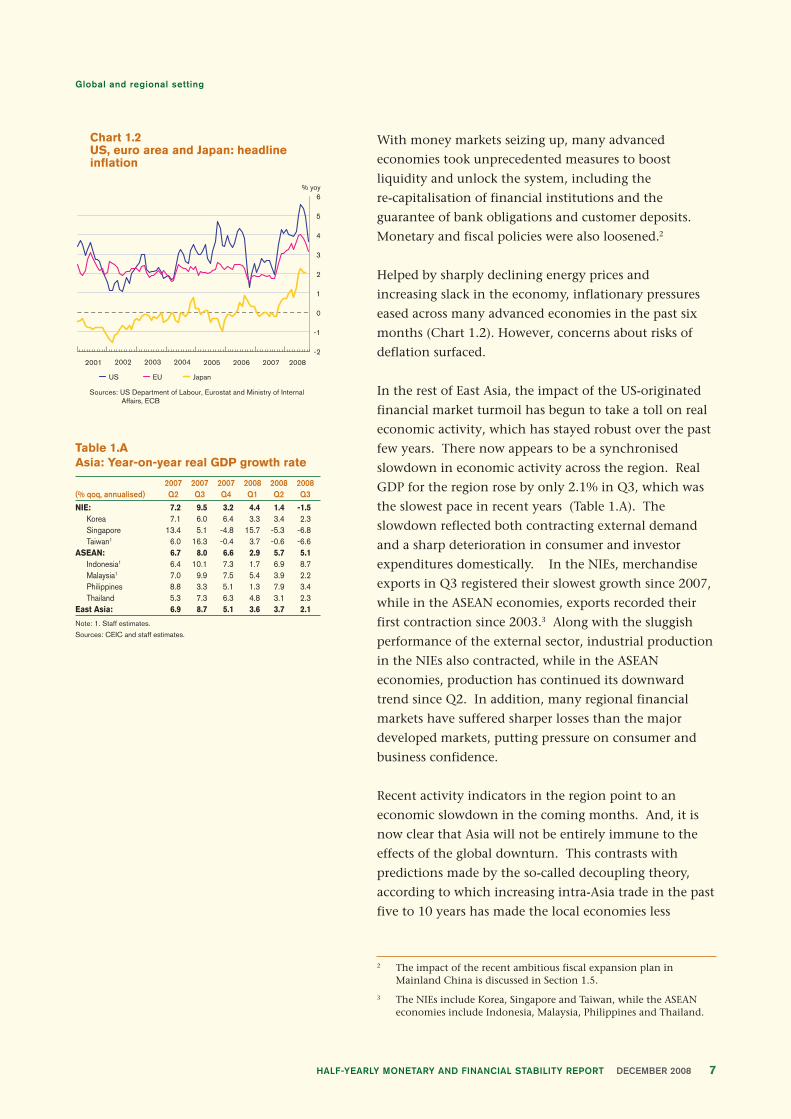
Chart 1.2 US, euro area and Japan: headline inflation
US EU Japan
Sources: US Department of Labour, Eurostat and Ministry of Internal Affairs, ECB
-2
-1
0
1
2
3
4
5
6% yoy
2001 2002 2003 2004 2005 2006 2007 2008
2 The impact of the recent ambitious fiscal expansion plan inMainland China is discussed in Section 1.5.
3 The NIEs include Korea, Singapore and Taiwan, while the ASEANeconomies include Indonesia, Malaysia, Philippines and Thailand.
Table 1.AAsia: Year-on-year real GDP growth rate
2007 2007 2007 2008 2008 2008(% qoq, annualised) Q2 Q3 Q4 Q1 Q2 Q3
NIE: 7.2 9.5 3.2 4.4 1.4 -1.5Korea 7.1 6.0 6.4 3.3 3.4 2.3Singapore 13.4 5.1 -4.8 15.7 -5.3 -6.8Taiwan1 6.0 16.3 -0.4 3.7 -0.6 -6.6
ASEAN: 6.7 8.0 6.6 2.9 5.7 5.1Indonesia1 6.4 10.1 7.3 1.7 6.9 8.7Malaysia1 7.0 9.9 7.5 5.4 3.9 2.2Philippines 8.8 3.3 5.1 1.3 7.9 3.4Thailand 5.3 7.3 6.3 4.8 3.1 2.3
East Asia: 6.9 8.7 5.1 3.6 3.7 2.1
Note: 1. Staff estimates.
Sources: CEIC and staff estimates.
With money markets seizing up, many advanced
economies took unprecedented measures to boost
liquidity and unlock the system, including the
re-capitalisation of financial institutions and the
guarantee of bank obligations and customer deposits.
Monetary and fiscal policies were also loosened.2
Helped by sharply declining energy prices and
increasing slack in the economy, inflationary pressures
eased across many advanced economies in the past six
months (Chart 1.2). However, concerns about risks of
deflation surfaced.
In the rest of East Asia, the impact of the US-originated
financial market turmoil has begun to take a toll on real
economic activity, which has stayed robust over the past
few years. There now appears to be a synchronised
slowdown in economic activity across the region. Real
GDP for the region rose by only 2.1% in Q3, which was
the slowest pace in recent years (Table 1.A). The
slowdown reflected both contracting external demand
and a sharp deterioration in consumer and investor
expenditures domestically. In the NIEs, merchandise
exports in Q3 registered their slowest growth since 2007,
while in the ASEAN economies, exports recorded their
first contraction since 2003.3 Along with the sluggish
performance of the external sector, industrial production
in the NIEs also contracted, while in the ASEAN
economies, production has continued its downward
trend since Q2. In addition, many regional financial
markets have suffered sharper losses than the major
developed markets, putting pressure on consumer and
business confidence.
Recent activity indicators in the region point to an
economic slowdown in the coming months. And, it is
now clear that Asia will not be entirely immune to the
effects of the global downturn. This contrasts with
predictions made by the so-called decoupling theory,
according to which increasing intra-Asia trade in the past
five to 10 years has made the local economies less
Global and regional setting
HALF-YEARLY MONETARY AND FINANCIAL STABILITY REPORT DECEMBER 20088
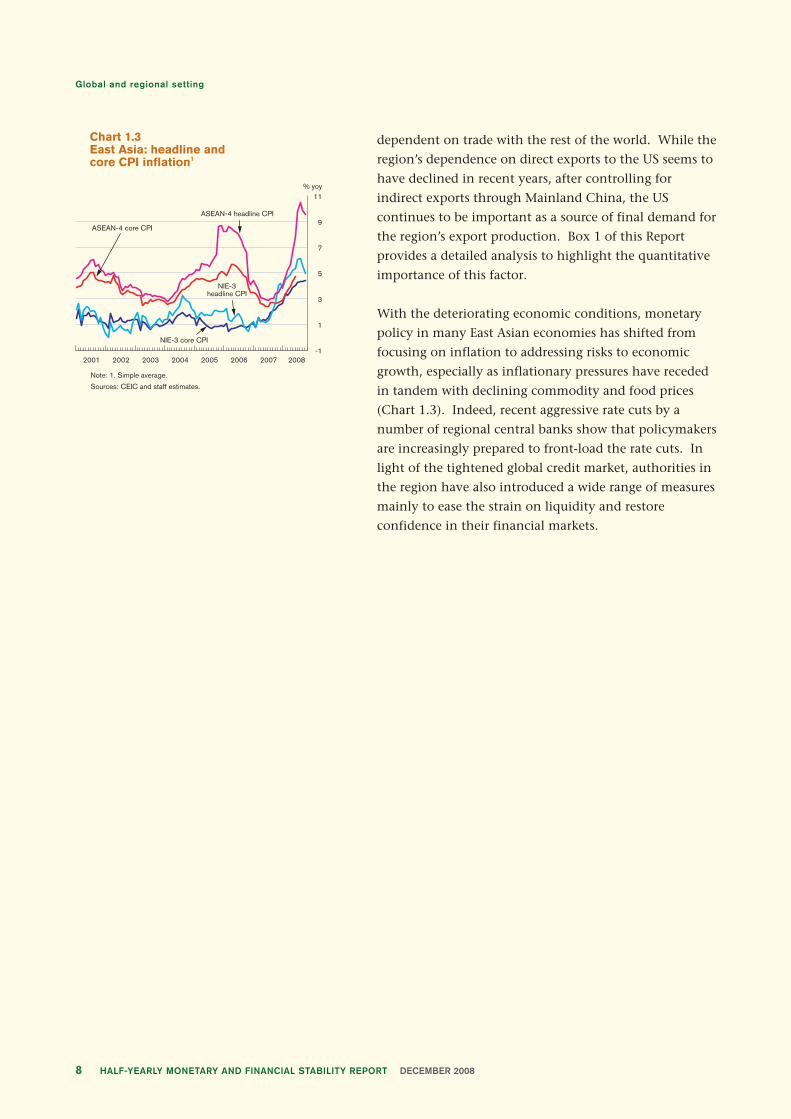
Note: 1. Simple average.
Sources: CEIC and staff estimates.
-1
1
3
5
7
9
11
2001 2002 2003 2004 2005
% yoy
NIE-3 core CPI
NIE-3headline CPI
ASEAN-4 core CPI
ASEAN-4 headline CPI
2006 2007 2008
Chart 1.3East Asia: headline and core CPI inflation1
dependent on trade with the rest of the world. While the
region’s dependence on direct exports to the US seems to
have declined in recent years, after controlling for
indirect exports through Mainland China, the US
continues to be important as a source of final demand for
the region’s export production. Box 1 of this Report
provides a detailed analysis to highlight the quantitative
importance of this factor.
With the deteriorating economic conditions, monetary
policy in many East Asian economies has shifted from
focusing on inflation to addressing risks to economic
growth, especially as inflationary pressures have receded
in tandem with declining commodity and food prices
(Chart 1.3). Indeed, recent aggressive rate cuts by a
number of regional central banks show that policymakers
are increasingly prepared to front-load the rate cuts. In
light of the tightened global credit market, authorities in
the region have also introduced a wide range of measures
mainly to ease the strain on liquidity and restore
confidence in their financial markets.

Global and regional setting
9HALF-YEARLY MONETARY AND FINANCIAL STABILITY REPORT DECEMBER 2008
4 This Box is prepared on the basis of a forthcoming HKMA Working Paperwhich will provide more details on the methodology and findings.
Chart B1.1Direct export exposures 2006
5 10 15 20 25 305
10
15
20
25
30
Export exposure to the US
Source: Staff estimates.
Export exposure to C
hina
Korea
Singapore Japan
Philippines
Malaysia
Indonesia
Thailand
Box 1Trade linkage between East Asian economies and major export
markets through processing trade in China4
The economic slowdown in major developed economies
is set to affect the emerging markets in East Asia. Some
believe that the rise of Mainland China as a major
trading partner with East Asian economies will mitigate
the decline in demand from the US, Japan, and Europe.
For example, in 2000, the US was a more important
export market for Korea than Mainland China. In that
year, 22% of Korea’s exports went to the US, while 17%
went to China. Gravity seems to have shifted since then.
In 2006, the Mainland accounted for 27% of Korean
exports, while the US accounted for 13%. Similar
dynamics also occurred in other emerging markets in
East Asia. Chart B1.1 illustrates the relative importance
of the Mainland and the US as export markets for a
group of East Asian economies in 2006, using bilateral
trade data as the basis. According to this Chart,
Mainland China is more important than the US as an
export market for Korea and Singapore. For Japan,
Thailand, and the Philippines, the Mainland and the US
have roughly equal importance.
But a large share of the exports from East Asian
economies to the Mainland might actually be driven by
demand from developed economies rather than from
Mainland China. The vertical integration in the global
supply chain has led to higher exports from East Asian
economies to the Mainland and higher exports from the
Mainland to OECD countries. There is consensus among
researchers that some exports from East Asia to Mainland
China are processed and re-exported to developed
economies, but accurate estimates for such indirect
export exposures are not available because of a lack of
data on the Mainland’s processing trade.
This study uses a unique firm level database to gauge
quantitatively the bilateral trade linkage between East
Asian emerging markets and their major trading partners
through the processing trade channel on the Mainland.

Global and regional setting
HALF-YEARLY MONETARY AND FINANCIAL STABILITY REPORT DECEMBER 200810
The firm level database covers the imports and exports
by every firm that engaged in international trade in
Mainland China from 2003 to 2005. The advantage of
using this data is that it allows us to calculate accurately
how much of each East Asian economy’s exports to the
Mainland was processed and re-exported to Japan, the
US, and other industrialised countries. It records the
source of each import transaction and the export market
of each export transaction for each firm. It also records
whether the imported goods were used for processing
trade, that is, if they were used as intermediate inputs for
export purposes. Tax rebates were granted for such
imported goods. The classification of processing versus
normal trade makes it possible to control for the indirect
export exposure between East Asian economies and their
trading partners.
Once the processing trade factor for the Mainland is
controlled, the picture on the trade linkage between East
Asian economies and their export markets changes
significantly. Table B1.A shows the estimated trade linkage
between eight East Asian economies and their major
trading partners on a bilateral basis, with export exposure
broken down to the direct channel through bilateral trade
and the indirect channel through processing trade in
Mainland China. The main findings are:
• The size of the indirect export exposure is large for
all the countries except for Indonesia and Vietnam.
The exports to the Mainland that were re-exported to
other countries accounted for 9.2% of Japan’s total
exports. The same statistic is 13.5% for Korea, 10.7%
for the Philippines, 9.9% for Singapore, 7.7% for
Thailand, and 6.2% for Malaysia. For these six
economies, roughly half their total exports to the
Mainland were used as inputs for exports to other
countries. Interestingly, Indonesia stands out as an
outlier, as 9.2% of its exports went to China in 2006,
but only 2.8% were used as inputs for processing trade
on the Mainland. In the case of Vietnam, there were
virtually no exports to Mainland China that were
used as inputs for processing trade, so the indirect
channel of export exposure is not relevant.5
Table B1.ABilateral export exposure for selectedeconomies in 2006
Direct Indirect CombinedExport export export export
Exporter market exposure exposure exposure
Japan US 22.8 1.9 24.7Japan Japan 0 1.1 1.1Japan Rest of OECD 18.0 1.6 19.6Japan China 20.0 -9.2 10.8Japan Rest of World 39.2 4.7 43.9Indonesia US 11.5 0.5 12.0Indonesia Japan 19.4 0.3 19.7Indonesia Rest of OECD 15.8 0.5 16.3Indonesia China 9.2 -2.8 6.4Indonesia Rest of World 44.0 1.6 45.6Korea US 13.3 2.8 16.1Korea Japan 8.1 1.5 9.6Korea Rest of OECD 16.1 2.2 18.3Korea China 27.2 -13.5 13.7Korea Rest of World 35.3 7.0 42.3Malaysia US 18.8 1.5 20.3Malaysia Japan 8.9 0.6 9.5Malaysia Rest of OECD 16.3 1.2 17.5Malaysia China 12.2 -6.2 6.0Malaysia Rest of World 43.8 2.9 46.7Philippines US 18.3 2.5 20.8Philippines Japan 16.5 1.0 17.5Philippines Rest of OECD 20.0 2.1 22.1Philippines China 17.7 -10.7 7.0Philippines Rest of World 27.6 5.0 32.6Singapore US 10.2 2.3 12.5Singapore Japan 5.5 1.0 6.5Singapore Rest of OECD 15.5 1.9 17.4Singapore China 19.9 -9.9 10.0Singapore Rest of World 49.0 4.6 53.6Thailand US 15.0 1.9 16.9Thailand Japan 12.6 0.8 13.4Thailand Rest of OECD 18.6 1.5 20.1Thailand China 14.6 -7.7 6.9Thailand Rest of World 39.2 3.5 42.7Vietnam US 21.2 0 21.2Vietnam Japan 12.3 0 12.3Vietnam Rest of OECD 30.6 0 30.6Vietnam China 7.1 0 7.1Vietnam Rest of World 28.8 0 28.8
Note: Staff estimates. The direct exposure is based on the share of economyA’s exports to five export markets relative to its total exports, withouttaking into account its exports to Mainland China that were processedand re-exported to other economies. The indirect exposure is A’sexports to the Mainland that were processed and re-exported to otherexport markets, as a share of A’s total exports. The two measurescombined provide an accurate estimate for bilateral export exposure.
5 The data are based on exports from Vietnam from 2003 to 2005.Anecdotal evidence indicates that exports from Vietnam in recentyears might have a higher content for processing trade.

Global and regional setting
11HALF-YEARLY MONETARY AND FINANCIAL STABILITY REPORT DECEMBER 2008
• The role of demand from the developed economies
is substantially under-estimated if the indirect
trade channel is not fully accounted for.
Comparing columns 3 and 5 in Table B1.A, the
difference is striking. In the case of Korea, if only the
direct export exposure is considered, Mainland China
is twice as important as the US, as it accounts for
27.2% of the exports from Korea, while the US is only
13.3%. But after controlling for the indirect export
exposure, the picture is reversed, with 16.1% of the
Korean exports eventually ending up in the US, while
13.7% were consumed on the Mainland. Similar
drastic comparisons also apply to the other
economies.
• The demand from Mainland China for East Asian
economies is smaller than commonly perceived.
After controlling for the indirect export exposure, the
Mainland accounts for only 6-7% of exports from
Indonesia, Malaysia, the Philippines and Thailand.
For Japan, Korea, and Singapore, the Mainland plays a
relatively more important role, accounting for 10.8%,
13.7%, and 10% of their exports respectively.
Nonetheless, the purchasing power of Chinese
consumers is not large enough to match that of US
consumers.
Chart B1.2 plots the export exposures for East Asian
economies to Mainland China and the US, taking into
account both the direct exports from these economies to
the US and their exports to the Mainland that were re-
exported to the US and the other markets. The
difference between Chart B1.1 and Chart B1.2 is large.
Chart B1.2 shows that for Korea and Singapore, the
demand from the US is as important as the demand from
the Mainland. For other East Asian economies, the US
market is far more important.
Chart B1.2True export exposures 2006(including direct and indirect exportexposures)
5 10 15 20 25 30
Export exposure to the US
Source: Staff estimates.
Export exposure to C
hina
5
10
15
20
25
30
Korea
Singapore Japan
PhilippinesMalaysia
IndonesiaThailand

Global and regional setting
HALF-YEARLY MONETARY AND FINANCIAL STABILITY REPORT DECEMBER 200812
Has the demand from Mainland China become more
important over the years? A close look at the trend of
the export exposures of East Asian economies indicates
that, once we control for the indirect export exposure
through processing trade in Mainland China, the relative
importance of the consumers in the developed
economies and the Mainland has changed only
moderately since 2000 (Chart B1.3). The change is
higher for Korea (5.4%) and Japan (4.7%), and relatively
low for Indonesia (2%), Malaysia (2.3%), and Thailand
(2.6%). The supply side of the global economy changed
drastically, but the demand side did not.
Chart B1.3 Export exposure to Mainland China(including indirect exposure)
Source: Staff estimates.
0
2
4
6
8
10
12
14
16
2000 2001 2002 2003 2004 2005 2006
KoreaJapan
Vietnam
Singapore
Malaysia
Philippines
Thailand
Indonesia
Export exposure to C
hina
Global and regional setting
13HALF-YEARLY MONETARY AND FINANCIAL STABILITY REPORT DECEMBER 2008
1.2 Global financial conditions
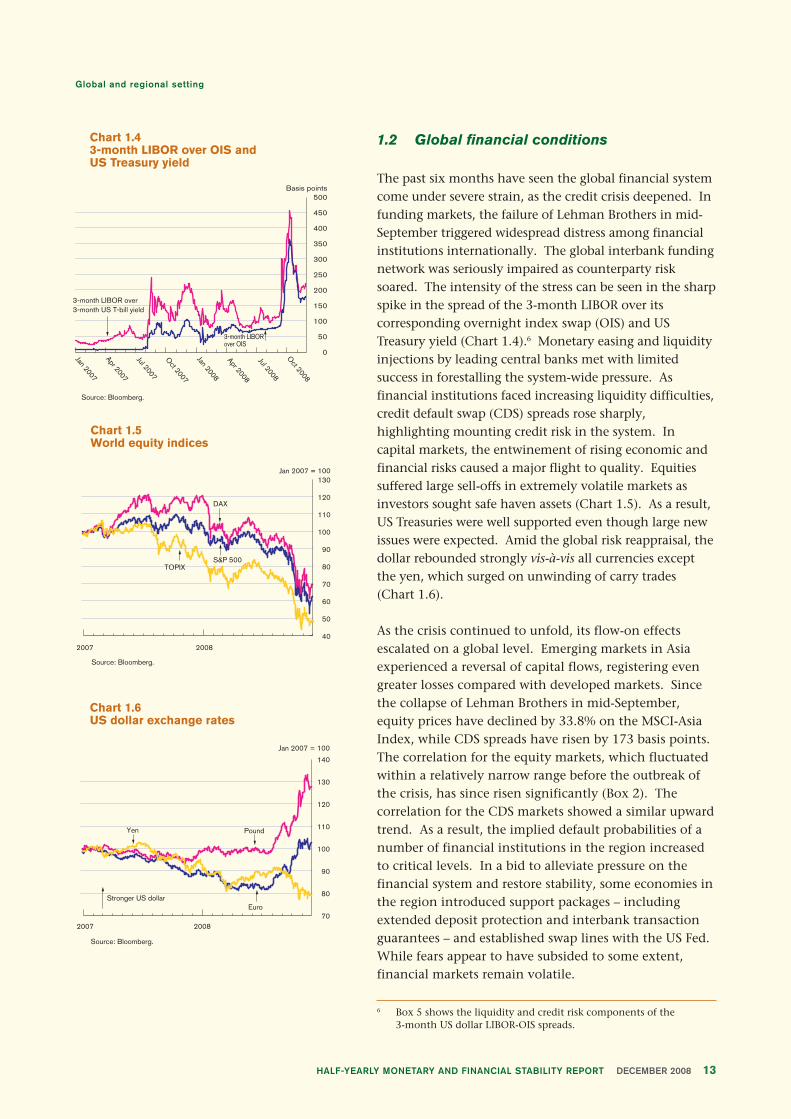
The past six months have seen the global financial systemcome under severe strain, as the credit crisis deepened. Infunding markets, the failure of Lehman Brothers in mid-September triggered widespread distress among financialinstitutions internationally. The global interbank fundingnetwork was seriously impaired as counterparty risksoared. The intensity of the stress can be seen in the sharpspike in the spread of the 3-month LIBOR over itscorresponding overnight index swap (OIS) and USTreasury yield (Chart 1.4).6 Monetary easing and liquidityinjections by leading central banks met with limitedsuccess in forestalling the system-wide pressure. Asfinancial institutions faced increasing liquidity difficulties,credit default swap (CDS) spreads rose sharply,highlighting mounting credit risk in the system. Incapital markets, the entwinement of rising economic andfinancial risks caused a major flight to quality. Equitiessuffered large sell-offs in extremely volatile markets asinvestors sought safe haven assets (Chart 1.5). As a result,US Treasuries were well supported even though large newissues were expected. Amid the global risk reappraisal, thedollar rebounded strongly vis-à-vis all currencies exceptthe yen, which surged on unwinding of carry trades(Chart 1.6).
As the crisis continued to unfold, its flow-on effectsescalated on a global level. Emerging markets in Asiaexperienced a reversal of capital flows, registering evengreater losses compared with developed markets. Sincethe collapse of Lehman Brothers in mid-September,equity prices have declined by 33.8% on the MSCI-AsiaIndex, while CDS spreads have risen by 173 basis points.The correlation for the equity markets, which fluctuatedwithin a relatively narrow range before the outbreak ofthe crisis, has since risen significantly (Box 2). Thecorrelation for the CDS markets showed a similar upwardtrend. As a result, the implied default probabilities of anumber of financial institutions in the region increasedto critical levels. In a bid to alleviate pressure on thefinancial system and restore stability, some economies inthe region introduced support packages – includingextended deposit protection and interbank transactionguarantees – and established swap lines with the US Fed.While fears appear to have subsided to some extent,financial markets remain volatile.
Chart 1.43-month LIBOR over OIS and US Treasury yield
Apr 2007
Jul 2007
Oct 2007
Jan 2008
Apr 2008
Jul 2008
Oct 2008
0
50
100
150
200
250
300
350
400
450
500Basis points
3-month LIBORover OIS
3-month LIBOR over3-month US T-bill yield
Jan 2007
Source: Bloomberg.
2007 2008
40
50
60
70
80
90
100
110
120
130Jan 2007 = 100
TOPIXS&P 500
DAX
Chart 1.5World equity indices
Source: Bloomberg.
2007 200870
80
90
100
110
120
130
140
Jan 2007 = 100
Yen
EuroStronger US dollar
Pound
Chart 1.6US dollar exchange rates
Source: Bloomberg.
6 Box 5 shows the liquidity and credit risk components of the3-month US dollar LIBOR-OIS spreads.

Global and regional setting
HALF-YEARLY MONETARY AND FINANCIAL STABILITY REPORT DECEMBER 200814
Box 2Measuring financial market interdependence and assessing
possible contagion risk in the Asia-Pacific region
The risk of cross-border financial contagion has increased
with intensified links in a world of high capital mobility,
particularly when the region’s economies are more
interdependent. At times of financial crises, such
contagion may have important consequences for
financial stability. It is, therefore, essential to provide
policymakers with appropriate measures to assess the
co-movement of financial asset prices (or their returns).
This will help define policy responses and contingency
plans.
Dynamic Conditional Correlation and Spillover IndexThe terms interdependence and contagion are often
interchangeable. In a broad sense, they are sometimes
referred to as the co-movement of asset return or
cross-country transmission of shocks. In this Box, we
distinguish between the two terms, and refer such broad
definition of co-movement as asset return correlation or
return volatility spillover. Two measures discussed here –
the Dynamic Conditional Correlation (DCC) proposed
by Engle (2002)7, and the Spillover Index (SI) proposed
by Diebold and Yilmaz (2008) – are related to this type of
financial asset price relationship.
The DCC model is commonly used to examine the
time-varying correlation dynamics among asset returns.8
Similar to other conventional correlation measures, a
higher correlation between markets implies a higher
7 For details on the DCC model, see Engle (2002), “DynamicConditional Correlation: A Simple Class of Multivariate GeneralizedAutoregressive Conditional Heteroskedasticity Models”, Journal ofBusiness & Economic Statistics, Vol. 20, pp. 339-350.
8 Yu et al. (2007) employs DCC as an indicator to monitor thedevelopment, measure progress and assess the state of equity marketintegration in Asia. For details, see Yu, Fung and Tam (2007),“Assessing Financial Market Integration in Asia - Equity Markets”,HKMA Working Paper 04/2007. IMF (2008) also uses DCC to examinethe cross-country equity price correlations between emerging marketeconomies and the US. See IMF (2008), “Spillovers to EmergingEquity Markets”, Global Financial Stability Report, October, pp. 131-151.

Global and regional setting
15HALF-YEARLY MONETARY AND FINANCIAL STABILITY REPORT DECEMBER 2008
return co-movement in the markets. The SI focuses on
variance decomposition under a simple vector
autoregressive model of equity returns, in which the
index can be interpreted as an aggregate of spillovers
across markets.9 A higher SI implies that a larger
proportion of the volatility in any one market can be
accounted for by shocks originating in other markets. A
higher SI implies a larger volatility in one market will
incur a larger fluctuation of return within the whole
system.
Using these two measures, the equity market
interdependences among the Asia-Pacific economies and
the US are examined.10 Chart B2.1 depicts the time-
varying average return correlation between the equity
markets in the Asia-Pacific economies and the US using
the DCC method. The DCC between the equity return
in the US and those in the Asia-Pacific economies
increased from the second half of 2007 onwards. The
figure surged dramatically in mid-September 2008 on the
back of the bankruptcy filing of the US investment bank
Lehman Brothers, and subsequently rose to almost 0.5 in
mid-October with the sharp fall in global equity prices.
Such changes are also found within the Asia-Pacific
economies illustrated in Charts B2.2a to B2.2c.
Source: HKMA estimates.
Chart B2.1Average correlation between Asia-Pacific economies and the US
Jan 2000 Jan 2002 Jan 2004 Jan 2006 Jan 2008
0.1
0.2
0.3
0.4
0.5
Increase in return correlation
Oct 2008
Source: HKMA estimates.
Hong Kong
ChinaKorea
Japan
Jan 2000 Jan 2002 Jan 2004 Jan 2006 Jan 2008
0
0.1
0.2
0.3
0.4
0.5
0.6
0.7
Oct 2008
Chart B2.2aAverage correlation among equitymarkets (Northeast Asia)
Increase in return correlation
Source: HKMA estimates.
Indonesia
ThailandSingapore
Malaysia Philippines
Chart B2.2bAverage correlation among equitymarkets (Southeast Asia)
Oct 2008Jan 2000 Jan 2002 Jan 2004 Jan 2006 Jan 2008
0
0.1
0.2
0.3
0.4
0.5
0.6
0.7
Increase in return correlation
9 For details on the SI model, see Diebold and Yilmaz (2008), “MeasuringFinancial Asset Return and Volatility Spillovers, with Application toGlobal Equity Markets”, NBER Working Paper, No. 13811.
10 The benchmark equity market indices are expressed in terms of theUS dollar. The conversion is done by dividing the local currencyindex level by the local currency per US dollar exchange rate.

Global and regional setting
HALF-YEARLY MONETARY AND FINANCIAL STABILITY REPORT DECEMBER 200816
Chart B2.3 shows two series of the Spillover Index: one is
the SI between equity markets in the Asia-Pacific
economies and the US, and the second is the SI of just
the Asia-Pacific economies.11 The SI between Asia-Pacific
economies and the US increased to above the 50% level
in 2008 Q1, and jumped to 58% at the end of October.
The SI, excluding the US, moved in a similar direction,
but its increase since mid-September was even greater
than that of the SI including the US. This large
co-movement within the Asia-Pacific economies in part
reflects the intensified linkages within the region, and
these could be tightened significantly by a common
external shock.12
Existence of contagionIn a more restrictive sense, contagion is the transmission
of shocks to other countries or the cross-country
correlation, beyond any fundamental linkage among the
countries and beyond common shocks. In an even more
restrictive definition, which is commonly used in the
literature of empirical analysis on financial markets,
‘contagion occurs when cross-country correlations
increase during “crisis times” relative to correlations
during “tranquil times”.’ This needs to control for
general volatility rising during financial crises. The
fundamental linkages are again not acknowledged, and
only increases in correlation are recognised as contagion.
It is this very restrictive definition that forms the basis of
our test for the existence of financial contagion between
the Asia-Pacific economies and the US.
Source: HKMA estimates.
Australia New Zealand
Chart B2.2cAverage correlation among equitymarkets (Pacific)
Jan 2000 Jan 2002 Jan 2004 Jan 2006 Jan 2008
0
0.1
0.2
0.3
0.4
0.5
0.6
0.7
Oct 2008
Increase in return correlation
Source: HKMA estimates.
Spillover Index
Spillover Index (without contributions from/to the US)O
ct 1997O
ct 1998O
ct 1999O
ct 2000O
ct 2001O
ct 2002O
ct 2003O
ct 2004O
ct 2005O
ct 2006O
ct 2007O
ct 2008
Chart B2.3Spillover Index of Asia-PacificEconomies and the US
20
25
30
35
40
45
50
55
60Spillover Index (%)
11 Both SI series are estimated based on a vector autoregressive systemwith all Asia-Pacific economies and the US. However, thecalculation of the SI (excluding the US) dismissed the contributionsof variance from and to the US. The system is estimated with a200-week rolling sample.
12 The increase in correlation may also be due to the increase in returnvolatility inherent from the external shock. Forbes and Rigobon(2002) showed that, under some mild assumptions between a pair ofreturns, their correlation coefficient is an increasing function ofvolatility. For details, see Forbes and Rigobon (2002), “NoContagion, Only Interdependence: Measuring Stock MarketCo-movements”, Journal of Finance, Vol. LVII, No. 5.

Global and regional setting
17HALF-YEARLY MONETARY AND FINANCIAL STABILITY REPORT DECEMBER 2008
We compare the cross-market return correlation
coefficients during the pre-defined “stable period” and
the “turmoil period” to examine the existence of
contagion between the Asia-Pacific economies and the
US by using the method proposed by Forbes and Rigobon
(2002).13 Based on our narrow definition of financial
contagion, two markets could have high
interdependence, but not contagion. This could occur
even if their correlation coefficient increases during the
turmoil period, but not to the extent of being
significantly higher than the stable period. In this test,
the correlation between a pair of equity returns during
the turmoil period is adjusted against the upward bias
due to heteroskedasticity of return volatility.14 The
cross-market correlation coefficients for the test are
estimated under a vector autoregressive framework, and
the dates of stable and turmoil periods are determined by
screening the conditional variance of return of the US.15
Table B2.A shows the results.
The results indicate that, although the correlation
coefficients rose during the current turmoil, the
increments are not significant to prove the existence of
contagion between the Asia-Pacific economies and the
US. It should be noted that the results do not suggest
that markets are not closely linked during the current
crisis. Instead, the correlation coefficients indicate a
high level of market co-movement between the Asia-
Pacific economies and the US throughout the whole
period under consideration, which implies high
interdependence.
Table B2.AContagion test between the US andAsia-Pacific economies
Correlation coefficients (US, individual economy)Turmoil Turmoil
Stable period2 period2 Testperiod1 (unadjusted) (adjusted) stat.3 Contagion?
China -0.02 0.20 0.18 1.1 NoJapan 0.30 0.54 0.41 0.9 NoHong Kong 0.45 0.38 0.35 -0.8 NoKorea 0.30 0.28 0.20 -0.7 NoSingapore 0.40 0.44 0.42 0.2 NoIndonesia 0.19 0.10 0.09 -0.7 NoMalaysia 0.19 0.32 0.30 0.8 NoPhilippines 0.25 0.34 0.33 0.6 NoThailand 0.28 0.40 0.30 0.1 NoAustralia 0.49 0.64 0.52 0.3 NoNew Zealand 0.34 0.61 0.50 1.4 No
Notes:
1. Stable period refers to January 1994 to August 2007
2. Turmoil period refers to September 2007 to October 2008
3. H0: Correlation coefficient in the turmoil period is not higher than that in thestable period.
Source: HKMA estimates.
13 The standard correlation t-test is used to compare the size ofcorrelation coefficients in different states.
14 Return volatility always increases during the crisis period, whileunder some mild assumptions, the correlation coefficient is anincreasing function of it. A test comparing the size of correlationcoefficients between stable and turmoil periods thus tends to resultin evidence of spurious contagion. See Forbes and Rigobon (2002)for details.
15 The conditional variance of return is estimated by a simpleunivariate GARCH model. The variance is compared with itsHP-filtered trend series. A period is identified as a beginning ofmarket turmoil if the conditional variance is larger than the trend bymore than 50% and the return is smaller than its long term average.
Global and regional setting
HALF-YEARLY MONETARY AND FINANCIAL STABILITY REPORT DECEMBER 200818
Mainland China
Growth momentum continued to decelerate, although the source of the slowdown is
somewhat unclear. Inflationary pressure receded due to falling food and commodity prices.
The RMB/USD exchange rate stabilised after appreciating substantially earlier in the year.
The market now expects the renminbi to depreciate moderately in 2009. In response to the
weak economic outlook, the Mainland authorities announced a large fiscal stimulus package,
and loosened monetary policy.
1.3 Output growth, external trade andinflation
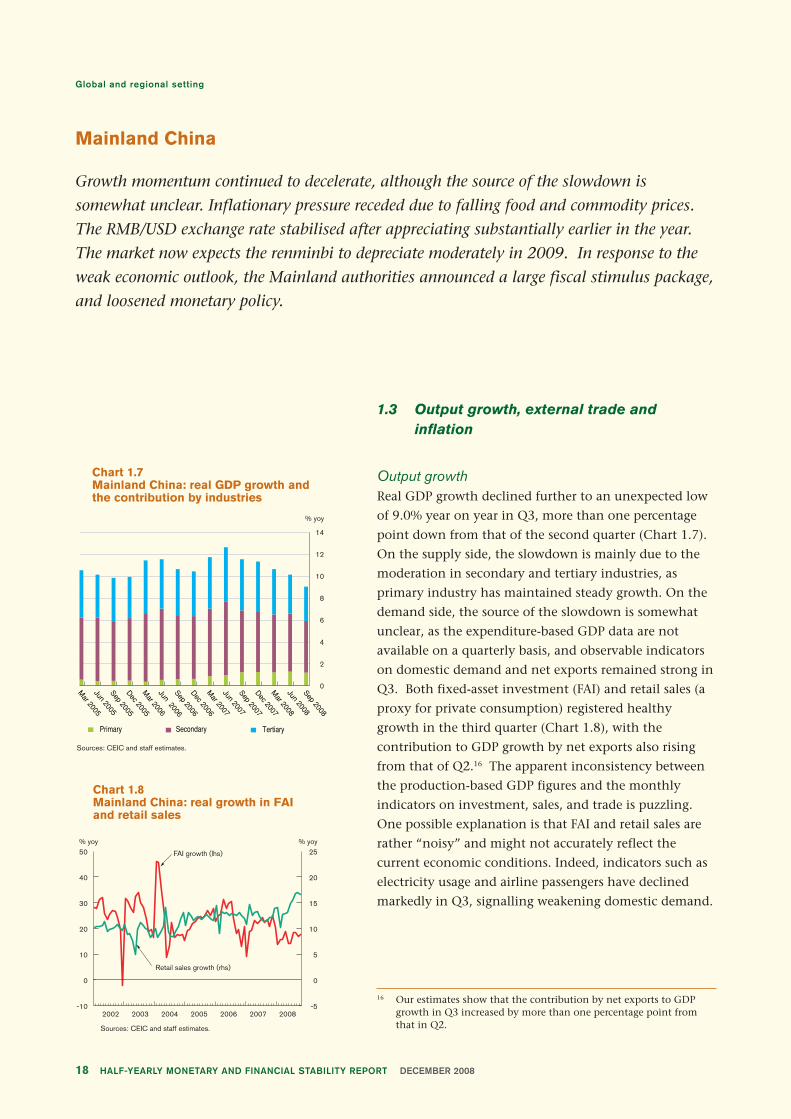
Output growthReal GDP growth declined further to an unexpected low
of 9.0% year on year in Q3, more than one percentage
point down from that of the second quarter (Chart 1.7).
On the supply side, the slowdown is mainly due to the
moderation in secondary and tertiary industries, as
primary industry has maintained steady growth. On the
demand side, the source of the slowdown is somewhat
unclear, as the expenditure-based GDP data are not
available on a quarterly basis, and observable indicators
on domestic demand and net exports remained strong in
Q3. Both fixed-asset investment (FAI) and retail sales (a
proxy for private consumption) registered healthy
growth in the third quarter (Chart 1.8), with the
contribution to GDP growth by net exports also rising
from that of Q2.16 The apparent inconsistency between
the production-based GDP figures and the monthly
indicators on investment, sales, and trade is puzzling.
One possible explanation is that FAI and retail sales are
rather “noisy” and might not accurately reflect the
current economic conditions. Indeed, indicators such as
electricity usage and airline passengers have declined
markedly in Q3, signalling weakening domestic demand.
Chart 1.7Mainland China: real GDP growth and the contribution by industries
Mar 2005
Jun 2005Sep 2005Dec 2005M
ar 2006Jun 2006Sep 2006Dec 2006M
ar 2007Jun 2007Sep 2007Dec 2007M
ar 2008Jun 2008Sep 2008
TertiarySecondaryPrimary
Sources: CEIC and staff estimates.
0
2
4
6
8
10
12
14
% yoy
Chart 1.8Mainland China: real growth in FAIand retail sales
Sources: CEIC and staff estimates.
2002 2003 2004 2005 2007 20082006-10
0
10
20
30
40
50% yoy % yoy
-5
0
5
10
15
20
25FAI growth (lhs)
Retail sales growth (rhs)
16 Our estimates show that the contribution by net exports to GDPgrowth in Q3 increased by more than one percentage point fromthat in Q2.

Global and regional setting
19HALF-YEARLY MONETARY AND FINANCIAL STABILITY REPORT DECEMBER 2008
External tradeThe year-on-year growth in exports stabilised in past
quarters from the impressive rates in 2007 and posted
23.1% in Q3, marginally above that of the previous
quarter (Chart 1.9). Deteriorating external conditions
and the appreciation of the real effective exchange rate
(REER) of the renminbi have been the main factors
affecting exports of the Mainland. Moreover, production
costs, such as land prices and wages, rose substantially in
the two delta areas, which account for 70% of Mainland
China’s ordinary exports and 90% of processing exports.
Some exporters moved their production bases from the
deltas to inland provinces with lower labour costs, which
led to a divergence of export growth from these two areas
(Chart 1.10). Looking ahead, the Mainland’s exports are
likely to slow in the coming months as real economic
activity in the major economies decelerates further. Our
estimation suggests the impact of the global slowdown
on Mainland exports is likely to be large for most
products (Table 1.B). To lessen the impact of the
shrinking external demand, the authorities have recently
raised tax rebates for numerous labour-intensive and
high-technology products. This could alleviate the rapid
slowdown in exports for some products, but is unlikely
to reverse the slowing trend in total exports.
Chart 1.9Mainland China: external trade
Sources: CEIC and staff estimates.
US$ bn% yoy
-20
-10
0
10
20
30
40
50
60
-30
-20
-10
0
10
20
30
40
50
60
70
80
90
2002 2003 2004 2005 2006 2007 2008
Export (lhs)Import (lhs)
Trade balance (rhs)
-10
0
10
20
30
40
50
% yoy
6,000
7,000
8,000
9,000
10,000
11,000
12,000
2002 2003 2004 2005 2006 2007 2008
RMBDelta areas(lhs)
Otherareas(lhs)Wage
differential(rhs)
(Estimated)
Chart 1.10Mainland China: export growth acrossregions
Note: Delta areas include Guangdong, Jiangsu, Shanghai and Zhejiang. Wage differential is the average annual wage of the delta areas minus that of other areas, with the 2008 number being an estimated value.
Sources: CEIC and staff estimates.
Table 1.BMainland China: export elasticity of majorindustries with respect to world GDP
World % ofGDP total
Products elasticity T-stat. exports
Electrical machinery 4.41 4.70 10.5Metallic mineral manufactures 4.01 4.78 3.8Telecom and sound recording
equipment 3.51 3.33 13.5Garment and other fibre products 3.01 3.66 11.5Textile industry 2.61 2.83 4.8Furniture manufacturing 2.09 2.10 2.2Office machinery and ADP -0.48 -0.35 12.1
Ordinary trade 4.27 4.83 44.2
Processing trade 3.12 4.65 50.7
Note: The elasticity is estimated by regressing the yoy growth in exports onthe yoy changes in the REER of the RMB and the one-period lag of theaverage of GDP growth of the Mainland’s 10 largest export markets.Estimation is undertaken with quarterly data of 2001 Q1 - 2008 Q2.Shares of sectoral exports in total exports are 2007 data.
Sources: CEIC and staff estimates.

Global and regional setting
HALF-YEARLY MONETARY AND FINANCIAL STABILITY REPORT DECEMBER 200820
The growth in imports fell by more than six percentage
points from that of Q2 year on year, owing to weakening
domestic demand as well as declining commodity prices.
While the growth in imports of intermediate goods
remained robust, that of consumer and capital goods saw
a remarkable contraction (Chart 1.11). In particular, the
year-on-year growth in imports of capital goods dropped
from 14.4% in May to -3.0% in October. As a result, the
quarterly trade balance recorded an historic high of
US$83.3 billion, US$25 billion up from that of Q2. As
the manufacturing sector persistently contributed to the
trade surplus, crude materials and mineral fuels in the
primary sector continued to be the main areas running
deficits.
InflationHeadline CPI inflation slid further to 5.3% year on year
in Q3, 2.6 percentage points below that of the previous
quarter, and registered 4.0% in October (Chart 1.12).
While the food component was the main factor dragging
down aggregate inflation, non-food price inflation also
showed signs of stabilising. PPI inflation eased to 9.1%
year on year in September and declined further to 6.6%
in October, after rising for 13 consecutive months and
peaking at 10.1% in August (Chart 1.13). The recent
moderation in PPI inflation is mainly due to falling
commodity prices. Raw material PPI inflation, for
instance, contracted from 14.4% year on year in August
to 9.0% in October. Corporate goods-price inflation also
kept falling for six consecutive months after touching a
recent high of over 10% in April. Inflationary pressure is
likely to continue to diminish in view of the lacklustre
economic outlook and declining global commodity
prices.
Chart 1.11Mainland China: growth of imports
-10
-5
0
5
10
15
20
25
30
35
2005 2006 2007 2008
% yoy, 3m moving avg.
Consumer goods Intermediate goods Capital goods
Sources: CEIC and staff estimates.
Chart 1.12Mainland China: contributions to CPIinflation
Sources: CEIC and staff estimates.
Non-food Food CPI inflation
-2
0
2
4
6
8
10
2002 2003 2004 2005 2006 2007 2008
% yoy
Chart 1.13 Mainland China: other price indicators
Source: CEIC.
-9
-6
-3
0
3
6
9
12
15
18
2002 2003 2004 2005 2006 2007 2008
% yoy
PPI
Producer price(raw material) index
Corporate goods price index

Global and regional setting
21HALF-YEARLY MONETARY AND FINANCIAL STABILITY REPORT DECEMBER 2008
1.4 Monetary conditions, asset prices and therenminbi exchange rate
Monetary conditionsThe year-on-year growth in broad money (M2) dropped
by over two percentage points from that of Q2 to a
13-quarter low in Q3, and posted 15.0% in October
(Chart 1.14). In addition, it continued to outpace that of
narrow money (M1), with a widening gap of six
percentage points in Q3, partly reflecting back flows of
capital from the stock markets to banks as a result of
falling share prices. The growth in financial institution
loans largely remained tame and inched up by
0.4 percentage points year on year compared with Q2,
possibly reflecting the credit easing on small and
medium-sized enterprises (SMEs) launched in late July.
Despite the relaxed control on credit expansion, the
softening trend of loans may not be reversed any time
soon given banks’ reluctance to lend because of the
gloomy economic outlook.
Foreign exchange reserves rose at a slower pace, gaining
US$97 billion in the third quarter, compared with an
average rise of US$140 billion in the first two quarters
(Chart 1.15). While the trade balance and foreign direct
investment (FDI) remained the main contributors to
foreign currency reserves, net portfolio flows turned
negative in Q3. The recent reversal of net portfolio flows,
led mainly by reduced initial public offering (IPO)
proceeds of Mainland companies raised outside
Mainland China, declining domestic asset prices and
tight liquidity in global financial markets, has raised the
concern of Mainland authorities over capital outflows.
The People’s Bank of China (PBoC) successfully sterilised
capital inflows in Q3, as evidenced by the mild growth in
reserve money (Chart 1.16). However, triggered by the
intensifying global financial crisis, receding inflationary
pressure and weakening economic outlook, the PBoC has
recently shifted its monetary policy stance to be more
expansionary. It has joined the concerted efforts of major
Sources: CEIC and staff estimates.
Chart 1.14Mainland China: growth in money andfinancial institution loans
0
5
10
15
20
25
30
2002 2003 2004 2005 2006 2007 2008
M2
Loans
% yoy
Target M2 (16%)
M1
Chart 1.15Mainland China: external capital flows
Trade balance and FDI (rhs)
Net portfolio inflow (rhs) Foreign exchange reserves (lhs)
Sources: CEIC and staff estimates.
0
200
400
600
800
1,000
1,200
1,400
1,600
1,800
2,000US$ bn
-20
-10
0
10
20
30
40
50
60
70
80
2004 2005 2006 2007 2008
US$ bn
Domestic credit contributionForeign reserve contribution
Total reserve money
Note: Total reserve money is adjusted for increases in reserve requirement ratio beyond 7.5%.
Sources: CEIC and staff estimates.
Chart 1.16Mainland China: contribution to reserve money growth
-40
-30
-20
-10
0
10
20
30
40
50
2002 2003 2004 2005 2006 2007 2008
% yoy
Sterilisation
Global and regional setting
HALF-YEARLY MONETARY AND FINANCIAL STABILITY REPORT DECEMBER 200822
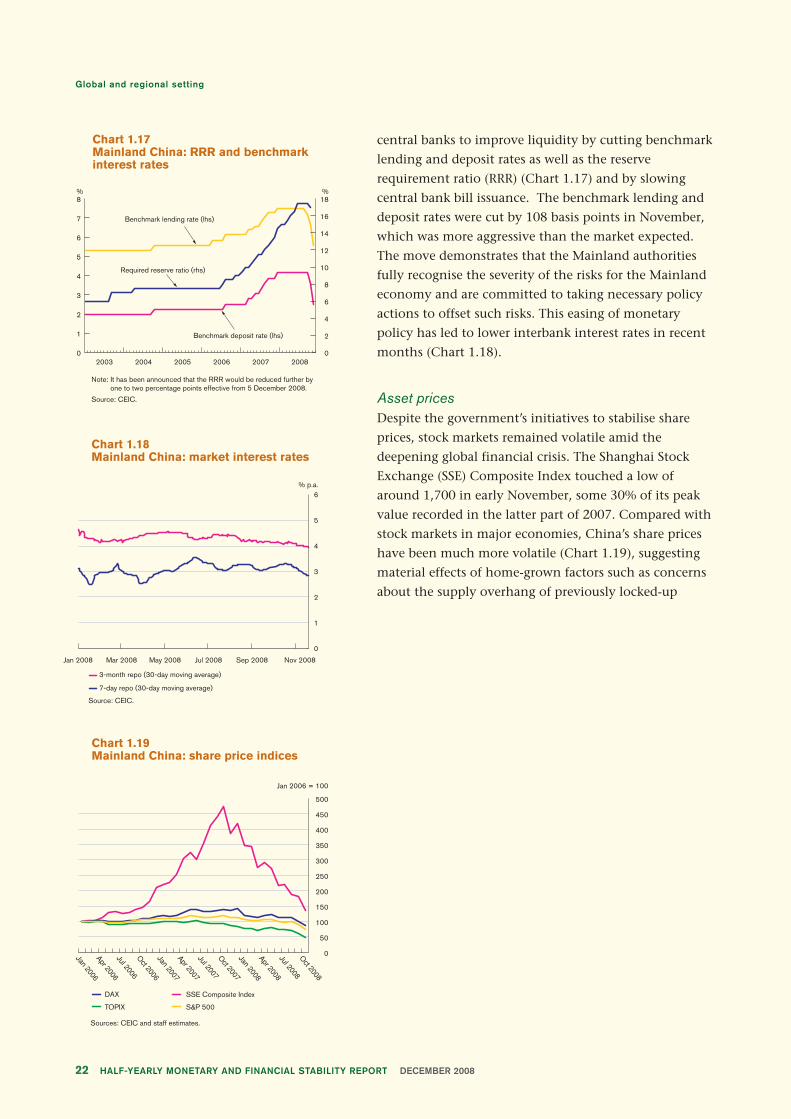
central banks to improve liquidity by cutting benchmark
lending and deposit rates as well as the reserve
requirement ratio (RRR) (Chart 1.17) and by slowing
central bank bill issuance. The benchmark lending and
deposit rates were cut by 108 basis points in November,
which was more aggressive than the market expected.
The move demonstrates that the Mainland authorities
fully recognise the severity of the risks for the Mainland
economy and are committed to taking necessary policy
actions to offset such risks. This easing of monetary
policy has led to lower interbank interest rates in recent
months (Chart 1.18).
Asset pricesDespite the government’s initiatives to stabilise share
prices, stock markets remained volatile amid the
deepening global financial crisis. The Shanghai Stock
Exchange (SSE) Composite Index touched a low of
around 1,700 in early November, some 30% of its peak
value recorded in the latter part of 2007. Compared with
stock markets in major economies, China’s share prices
have been much more volatile (Chart 1.19), suggesting
material effects of home-grown factors such as concerns
about the supply overhang of previously locked-up
Chart 1.17Mainland China: RRR and benchmarkinterest rates
0
1
2
3
4
5
6
7
8
0
2
4
6
8
10
12
14
16
18
2003 2004 2005 2006 2007 2008
Benchmark deposit rate (lhs)
Required reserve ratio (rhs)
Benchmark lending rate (lhs)
% %
Note: It has been announced that the RRR would be reduced further by one to two percentage points effective from 5 December 2008.
Source: CEIC.
Sources: CEIC and staff estimates.
Chart 1.19Mainland China: share price indices
DAX
TOPIX
SSE Composite Index
S&P 500
Jan 2006Apr 2006Jul 2006O
ct 2006Jan 2007Apr 2007Jul 2007O
ct 2007Jan 2008Apr 2008Jul 2008O
ct 2008
0
50
100
150
200
250
300
350
400
450
500
Jan 2006 = 100
Source: CEIC.
Chart 1.18Mainland China: market interest rates
Jan 2008 Mar 2008 May 2008 Jul 2008 Sep 2008 Nov 2008
0
1
2
3
4
5
6% p.a.
3-month repo (30-day moving average)
7-day repo (30-day moving average)

Global and regional setting
23HALF-YEARLY MONETARY AND FINANCIAL STABILITY REPORT DECEMBER 2008
shares. The volatility of share prices has varied noticeably
across sectors, with property the most affected
(Chart 1.20).
Based on historical evidence on the relationship between
private consumption and stock returns, some observers
of the Mainland’s economy have pointed to the weak
wealth effects of asset markets. However, our estimation
with panel data at the provincial level of 2006 Q1- 2008
Q3, indicates a non-negligible impact of stock prices on
household expenditure, as the market participation ratio
for urban population rose dramatically from about 13%
in early 2007 to about 23% in October 2008. To be
precise, a 10% drop in stock prices is associated with a
0.5% decline in household expenditure.
The growth in property prices in major cities continued
to trend downwards (Chart 1.21). The year-on-year
growth in housing prices in Shenzhen turned negative in
June and slid dramatically to -12.6% in October. The sub-
prime mortgage crisis in the US has intensified worries
about the possible adverse impact of a deteriorating
property market on the Mainland through the negative
wealth effect as well as the balance sheets of real estate
developers and banks.
Sources: CEIC and staff estimates.
Chart 1.20Mainland China: share prices acrosssectors
0
100
200
300
400
500
600
700
800
Jan 2006 =100
Properties
Industrial
Utilities
Commerce
Apr 2007Jul 2007O
ct 2007
Apr 2006Jul 2006O
ct 2006
Jan 2008Apr 2008Jul 2008
Oct 2008
Jan 2006
Jan 2007
Chart 1.21Mainland China: housing prices inmajor Mainland cities
Source: CEIC.
Overall
Shanghai
Beijing
Shenzhen
-15
-10
-5
0
5
10
15
20
25
2005 2006 2007 2008
% yoy

Global and regional setting
HALF-YEARLY MONETARY AND FINANCIAL STABILITY REPORT DECEMBER 200824
The renminbi exchange rateThe RMB/USD spot rate has stabilised in the past few
months after appreciating persistently for about three
years (Chart 1.22). This possibly reflected the Mainland
government’s intention to keep the exchange rate stable
against the backdrop of a depressed global economic
outlook. Nevertheless, the renminbi continued to
appreciate in effective terms. While the REER appreciated
5.2% by October from June, the third-country nominal
effective exchange rate (NEER) appreciated 17.0% during
the same period, implying a softening in the
competitiveness of Mainland China’s exporters relative
to their rivals in the major export markets.
The non-deliverable forward (NDF) rates in late
November suggest that markets expect the renminbi to
depreciate against the US dollar by about 1.5% in three
months and 3% in 12 months (Chart 1.23). This may
reflect investors’ concern over the potential slowdown in
the Mainland’s exports due to recessions in developed
economies and the fast depreciation of other emerging
market currencies.
1.5 Policy response
As the risks to economic growth heightened and
inflationary pressure subsided, the Mainland authorities
shifted their stance to a “pro-active” fiscal policy and
appropriately easier monetary policy to help stimulate
domestic demand. The State Council announced a fiscal
stimulus package amounting to RMB4 trillion, of which
RMB100 billion will be spent on public investment in Q4
2008, with the rest being spent in 2009 and 2010. The
package covers a wide range of areas, including spending
on public housing, rural and transport infrastructure,
health and education, environmental development,
post-earthquake reconstruction, and subsidies for farmers
and low-income households. The package also calls for
faster VAT reform and the facilitation of more bank loans
for project financing.
The fiscal stimulus package has been generally welcomed
by authorities in other economies and market analysts.
The size of the package is equivalent to 14% of Mainland
China’s GDP in 2007. It is not clear what impact the
package will have on the fiscal deficit, or what
-12
-10
-8
-6
-4
-2
0
2
4
6%
2005 2006 2007
Implied by 3-month NDF
Implied by 1-year NDF
2008
Note: The expected rate of appreciation of the renminbi is calculated as the percentage difference between the spot rate and the NDF rate. A negative number implies an appreciation of the renminbi against the US dollar.
Sources: Bloomberg and staff estimates.
Chart 1.23Mainland China: expected appreciationof the renminbi
Note: The third-country NEER reflects China’s external competitiveness in a third market. The third-country NEER takes into account the competition that China faces in foreign markets from other economies which export similar products. The methodology of constructing the third-country effective exchange rate is presented in Box 2 of the December 2006 issue of this Report.
Sources: Bloomberg, CEIC and staff estimates.
Chart 1.22Mainland China: REER, NEER and spotrate of RMB/USD
6.8
7.0
7.2
7.4
7.6
7.8
8.0
8.2
8.4
80
85
90
95
100
105
110
115
120
125
130
2005 2006 2007 2008
REER (rhs)
NEER (rhs)
Jan 2002 =100RMB/USD
Third country NEER (rhs)
Spot rate (lhs)

Global and regional setting
25HALF-YEARLY MONETARY AND FINANCIAL STABILITY REPORT DECEMBER 2008
contribution it could make to GDP growth, but market
consensus is that it will help the economy to achieve the
government’s growth target for 2009.
Monetary policy has also been loosened to promote
growth. Interest rates and the RRR have been reduced.
The challenge is to ensure the banking sector will
provide financing for enterprises instead of tightening
credit supply in response to the weak economic outlook.
The growth of outstanding loans has also declined since
early 2008, but has remained stable in recent months
(Chart 1.24). The introduction of the fiscal package is
likely to lead to higher bank loans to construction
projects, although there could be a time lag between the
announcement of the package (10 November) and the
commencement of projects.
In recent months, the US dollar has appreciated strongly
and currencies in other emerging markets have
depreciated. If Mainland authorities had targeted a stable
NEER, the renminbi would have depreciated strongly
against the US dollar since August (Chart 1.25).
However, they resisted the pressure and kept the
RMB/USD exchange rate at a stable level. This was similar
to the experience during the Asian financial crisis, as a
stable renminbi exchange rate helps to avoid a vicious
circle of competitive devaluations of emerging market
currencies, and potential capital outflows from Mainland
China.
Source: CEIC.
Chart 1.24Mainland China: growth of outstandingloans
Apr 1998 Apr 2000 Apr 2002 Apr 2004 Apr 2006 Apr 2008
5
10
15
20
25% yoy
Note: The currencies in the hypothetical basket are the US dollar, euro, Japanese yen, Korean won, Singapore dollar, Malaysian ringgit, Australian dollar, Russian ruble, British pound, Thai baht and Canadian dollar. The weights of these currencies are the shares of China’s trade with plus FDI from these countries in China’s total trade and FDI.
Sources: Bloomberg and staff estimates.
6.70
6.90
7.10
7.30
7.50
7.70
7.90
8.10
8.30
RMB/USD
(6.8311)
(8.1671)
Implied RMB/USD rate Market RMB/USD rate
12 Dec 200619 Apr 200724 Aug 2007
24 Nov 200531 M
ar 200607 Aug 2006
31 Dec 200707 M
ay 200811 Sep 2008
20 Jul 2005
Chart 1.25Mainland China: market and impliedexchange rates of the renminbi

HALF-YEARLY MONETARY AND FINANCIAL STABILITY REPORT DECEMBER 200826
Demand
The Hong Kong economy registered two consecutive quarters of negative sequential growth in
Q2 and Q3. The contraction in economic activity was due mainly to sluggish private
consumption, while merchandise exports were also lacklustre in the face of weakening demand
from major overseas markets. As the global financial crisis intensified and the unemployment
rate has started to rise, the contraction in demand will likely become more severe in the future.
2.1 Aggregate demand
Real GDP grew by 1.7% year on year in Q3, after rising
by 7.3% and 4.2% in Q1 and Q2 respectively (Chart 2.1).
On a seasonally-adjusted quarter-on-quarter basis, real
GDP contracted by 1.4% in Q2 and 0.5% in Q3.
The decline in year-on-year economic growth in Q3 was
in part due to weak private consumption, in particular
consumer spending on financial services amid the dismal
performance of the local equity market, which resulted
in decreases in market turnover and falls in service
charges. Growth in investment slowed further in Q3,
dragged down by cutbacks in spending on building and
construction. The merchandise trade balance remained
in deficit in Q3, due to lacklustre growth in merchandise
exports. However, net exports of services held up
relatively well on the back of offshore trading activities,
which more than offset the negative contribution of
merchandise trade deficits to the overall GDP figure.
2. Domestic economy
Chart 2.1GDP at constant market prices
Source: Census and Statistics Department (C&SD).
Seasonally-adjusted quarter-on-quarter growthYear-on-year growth
-5
0
5
10
15
%
2003 2004 2005 2006 2007 2008
Domestic economy
27HALF-YEARLY MONETARY AND FINANCIAL STABILITY REPORT DECEMBER 2008
2.2 Domestic demand
Domestic demand was a significant drag on economic
growth. On a year-on-year comparison, domestic
demand grew by 1.7% in Q3 following a 3.5% expansion
in Q2 (Table 2.A). While capital investment and
government consumption still managed to maintain
positive year-on-year growth, expansion in private
consumption almost came to a standstill in Q3.
Inventory change still made a positive contribution to
GDP growth in Q3, but it was not clear whether the
inventory accumulation was voluntary.
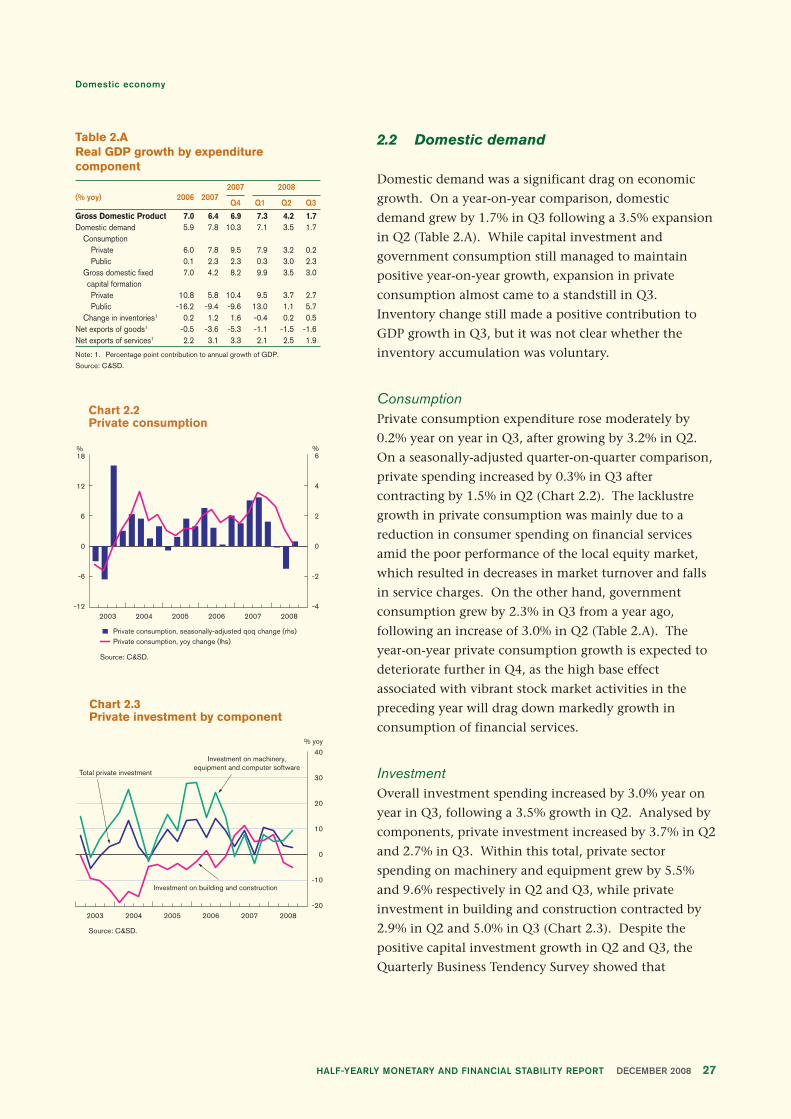
ConsumptionPrivate consumption expenditure rose moderately by
0.2% year on year in Q3, after growing by 3.2% in Q2.
On a seasonally-adjusted quarter-on-quarter comparison,
private spending increased by 0.3% in Q3 after
contracting by 1.5% in Q2 (Chart 2.2). The lacklustre
growth in private consumption was mainly due to a
reduction in consumer spending on financial services
amid the poor performance of the local equity market,
which resulted in decreases in market turnover and falls
in service charges. On the other hand, government
consumption grew by 2.3% in Q3 from a year ago,
following an increase of 3.0% in Q2 (Table 2.A). The
year-on-year private consumption growth is expected to
deteriorate further in Q4, as the high base effect
associated with vibrant stock market activities in the
preceding year will drag down markedly growth in
consumption of financial services.
InvestmentOverall investment spending increased by 3.0% year on
year in Q3, following a 3.5% growth in Q2. Analysed by
components, private investment increased by 3.7% in Q2
and 2.7% in Q3. Within this total, private sector
spending on machinery and equipment grew by 5.5%
and 9.6% respectively in Q2 and Q3, while private
investment in building and construction contracted by
2.9% in Q2 and 5.0% in Q3 (Chart 2.3). Despite the
positive capital investment growth in Q2 and Q3, the
Quarterly Business Tendency Survey showed that
Table 2.AReal GDP growth by expenditurecomponent
2007 2008(% yoy) 2006 2007
Q4 Q1 Q2 Q3
Gross Domestic Product 7.0 6.4 6.9 7.3 4.2 1.7Domestic demand 5.9 7.8 10.3 7.1 3.5 1.7
ConsumptionPrivate 6.0 7.8 9.5 7.9 3.2 0.2Public 0.1 2.3 2.3 0.3 3.0 2.3
Gross domestic fixed 7.0 4.2 8.2 9.9 3.5 3.0capital formationPrivate 10.8 5.8 10.4 9.5 3.7 2.7Public -16.2 -9.4 -9.6 13.0 1.1 5.7
Change in inventories1 0.2 1.2 1.6 -0.4 0.2 0.5Net exports of goods1 -0.5 -3.6 -5.3 -1.1 -1.5 -1.6Net exports of services1 2.2 3.1 3.3 2.1 2.5 1.9
Note: 1. Percentage point contribution to annual growth of GDP.
Source: C&SD.
Chart 2.2 Private consumption
Private consumption, seasonally-adjusted qoq change (rhs)Private consumption, yoy change (lhs)
Source: C&SD.
-12
-6
0
6
12
18%
-4
-2
0
2
4
6%
2003 2004 2005 2006 2007 2008
Chart 2.3 Private investment by component
Source: C&SD.
-20
-10
0
10
20
30
40
% yoy
2003 2004 2005 2006 2007 2008
Total private investment
Investment on building and construction
Investment on machinery,equipment and computer software

Domestic economy
HALF-YEARLY MONETARY AND FINANCIAL STABILITY REPORT DECEMBER 200828
business owners in most sectors turned pessimistic about
business prospects in Q4. The cautious business
sentiment may translate into worse capital investment
spending growth in the near term.
Public investment on building and construction rose by
2.0% year-on-year in Q3 following a 6.6% contraction in
Q2. Public expenditure on machinery and equipment
rose by 41.2% in Q2 and by 18.5% in Q3 year on year.
In the face of the current economic downturn, the
Government pledged to accelerate infrastructure projects
to boost public investment expenditure.
2.3 External trade
Merchandise exports rose by 4.4% and 1.4% year on year
in Q2 and Q3 respectively, compared with 8.3% in Q1
(Chart 2.4). On a seasonally-adjusted quarter-on-quarter
basis, the volume of merchandise exports decreased by
2.3% in Q3, after rising by 1.8% in Q1 and 1% in Q2.
The moderation in merchandise export growth was led
by re-exports, whose growth rate slipped from 5.6% in
Q2 to 2.5% in Q3. Domestic exports also recorded large
year-on-year declines of 22.3% in Q2 and 22.8% in Q3.
Analysed by destination, exports to the EU and Taiwan
continued to register robust growth in Q2 and Q3, while
exports to the Mainland, Korea and ASEAN slowed and
exports to the US and Japan remained subdued
(Table 2.B).
Chart 2.4 Merchandise exports by components (in real terms)
Source: C&SD.
-40
-30
-20
-10
0
10
20
30
60
50
40
% yoy
2003 2004 2005 2006 2007 2008
Domestic exports
Merchandise exports
Re-exports
Table 2.BTotal exports of goods by major market1
(% yoy) Share22006 2007
2007 2008
% Q4 Q1 Q2 Q3
China 49 14 13 11 11 8 4United States 14 3 -1 -3 -1 -1 1European Union 14 5 6 6 8 8 10ASEAN53 + Korea 7 8 9 11 15 9 3Japan 4 1 -1 -1 -2 -1 3Taiwan 2 3 2 -2 3 7 5Others 10 11 18 20 30 24 17
Total 100 9 9 8 10 8 6
Notes:
1. Within the total, re-exports accounted for 96% in 2007.
2. Share in 2007.
3. ASEAN5 includes Indonesia, Malaysia, Philippines, Singapore andThailand.
Sources: C&SD and CEIC.
Domestic economy
29HALF-YEARLY MONETARY AND FINANCIAL STABILITY REPORT DECEMBER 2008
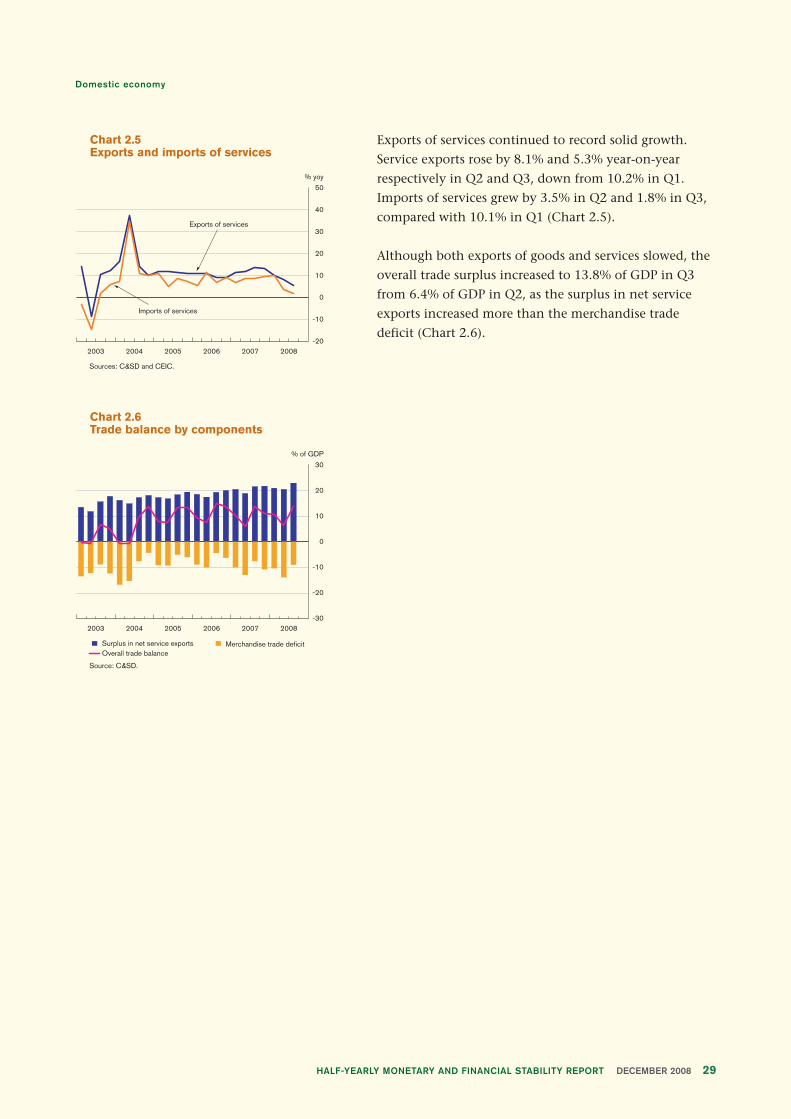
Exports of services continued to record solid growth.
Service exports rose by 8.1% and 5.3% year-on-year
respectively in Q2 and Q3, down from 10.2% in Q1.
Imports of services grew by 3.5% in Q2 and 1.8% in Q3,
compared with 10.1% in Q1 (Chart 2.5).
Although both exports of goods and services slowed, the
overall trade surplus increased to 13.8% of GDP in Q3
from 6.4% of GDP in Q2, as the surplus in net service
exports increased more than the merchandise trade
deficit (Chart 2.6).
Chart 2.5 Exports and imports of services
Sources: C&SD and CEIC.
-20
-10
0
10
20
30
50
40
% yoy
2003 2004 2005 2006 2007 2008
Exports of services
Imports of services
Chart 2.6 Trade balance by components
Source: C&SD.
Surplus in net service exports Merchandise trade deficitOverall trade balance
-30
-20
-10
0
10
20
30
% of GDP
2003 2004 2005 2006 2007 2008

Domestic economy
HALF-YEARLY MONETARY AND FINANCIAL STABILITY REPORT DECEMBER 200830
Output and supply
Output growth slowed sharply in Q2, with the manufacturing and construction sectors
contracting and the service sector showing a broad-based slowdown. The economic
downturn is exerting pressure on the labour market with a rise in the unemployment rate.
The adverse effect of the global financial crisis on employment is expected to become more
visible in the future, with the financial services and import/export sectors likely to be the
hardest hit. Labour productivity has started to fall as a result of the cyclical contraction in
output.
2.4 Output
GDP at factor cost grew by 3.5% year on year in Q2, a
significant slowdown from the 6.5% growth registered in
Q1 (Table 2.C). The manufacturing and construction
sectors contracted year on year, while the service sector
showed a broad-based slowdown across different
sub-segments. Analysis of the contribution of different
sectors suggests that the slowdown in GDP growth in Q2
was mainly driven by declining growth in the service
sector (Table 2.D). While most service sub-segments
continued to make positive contributions to year-on-year
GDP growth in Q2, the dismal Q3 expenditure-based
GDP growth figure indicated that certain service
segments were likely to have been hit hard in Q3 and
may witness year-on-year contraction in the second half
of the year. In particular, the financing, insurance and
business services segment is likely to have contracted
sharply in the second half of 2008 amid the lingering
global financial crisis, while the wholesale, retail,
restaurant and hotel segment is also likely to be dragged
down by the slump in private consumption. In addition,
the slowdown in trade flows may affect the import/
export and transportation/storage segments.
Table 2.CReal GDP growth by major economicsectors (year-on-year)
(% yoy) 2006 20072007 2008
Q3 Q4 Q1 Q2
GDP at factor cost 6.2 6.7 6.5 7.1 6.5 3.5Industrial sector -2.3 -0.8 -1.4 -0.9 2.7 -3.5
Of which:Manufacturing 2.2 -1.5 -2.1 -0.3 -4.4 -4.2Construction -9.8 -2.1 -2.8 -2.6 8.3 -2.7
Service sector 7.1 7.5 7.3 7.8 6.8 4.2Of which:Wholesale, retail, 8.1 9.1 10.3 11.3 6.8 5.0
restaurants and hotelsImport and export 9.0 6.7 6.8 6.3 9.5 7.7Transport and storage 6.6 5.6 6.5 7.4 7.9 4.2Financing, insurance 15.6 16.3 17.5 17.5 9.5 4.6
and business services
Source: C&SD.
Table 2.DContribution to real GDP growth by majoreconomic sectors (year-on-year)
(Percentage point) 2006 20072007 2008
Q3 Q4 Q1 Q2
GDP at factor cost 6.2 6.7 6.5 7.1 6.5 3.5Industrial sector -0.2 -0.1 -0.1 -0.1 0.2 -0.3
Of which:Manufacturing 0.1 0 -0.1 0 -0.1 -0.1Construction -0.3 -0.1 -0.1 -0.1 0.2 -0.1
Service sector 6.4 6.8 6.6 7.2 6.3 3.8Of which:Wholesale, retail, 0.5 0.6 0.6 0.7 0.5 0.3
restaurants and hotelsImport and export 1.9 1.4 1.6 1.5 1.9 1.5Transport and storage 0.5 0.4 0.5 0.6 0.6 0.3Financing, insurance 3.0 3.4 3.3 3.6 2.2 1.1
and business services
Source: C&SD.
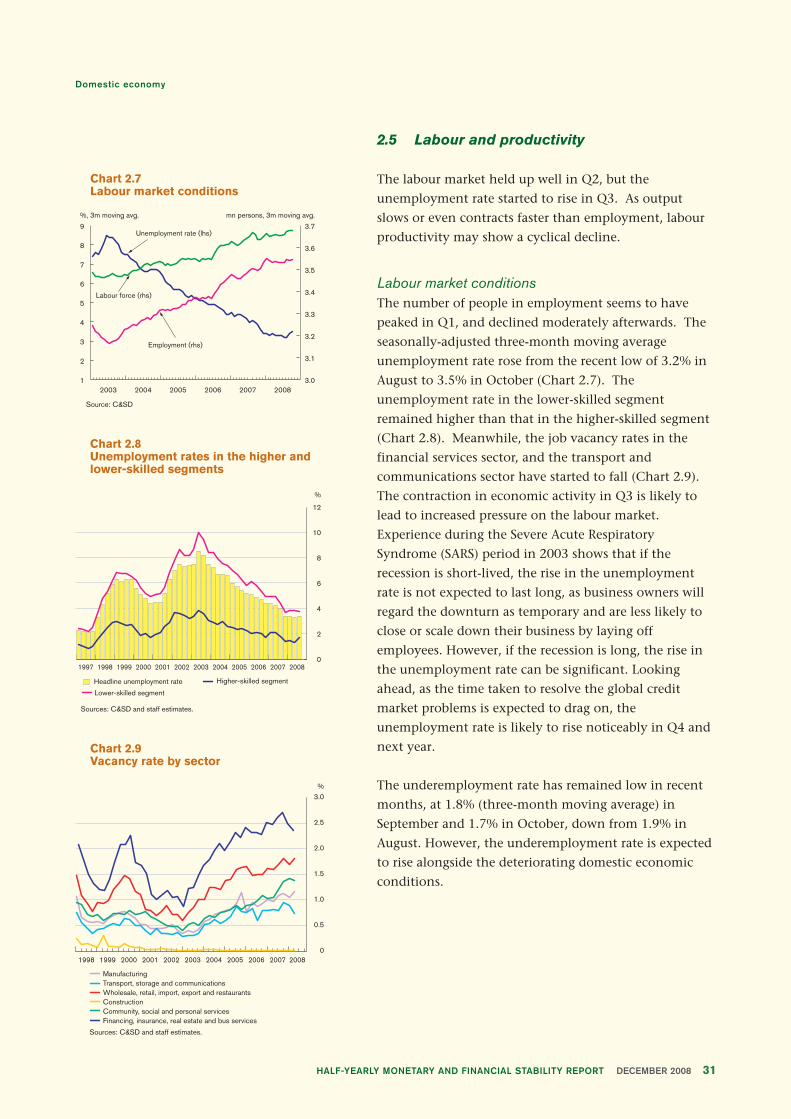
Domestic economy
31HALF-YEARLY MONETARY AND FINANCIAL STABILITY REPORT DECEMBER 2008
2.5 Labour and productivity
The labour market held up well in Q2, but the
unemployment rate started to rise in Q3. As output
slows or even contracts faster than employment, labour
productivity may show a cyclical decline.
Labour market conditionsThe number of people in employment seems to have
peaked in Q1, and declined moderately afterwards. The
seasonally-adjusted three-month moving average
unemployment rate rose from the recent low of 3.2% in
August to 3.5% in October (Chart 2.7). The
unemployment rate in the lower-skilled segment
remained higher than that in the higher-skilled segment
(Chart 2.8). Meanwhile, the job vacancy rates in the
financial services sector, and the transport and
communications sector have started to fall (Chart 2.9).
The contraction in economic activity in Q3 is likely to
lead to increased pressure on the labour market.
Experience during the Severe Acute Respiratory
Syndrome (SARS) period in 2003 shows that if the
recession is short-lived, the rise in the unemployment
rate is not expected to last long, as business owners will
regard the downturn as temporary and are less likely to
close or scale down their business by laying off
employees. However, if the recession is long, the rise in
the unemployment rate can be significant. Looking
ahead, as the time taken to resolve the global credit
market problems is expected to drag on, the
unemployment rate is likely to rise noticeably in Q4 and
next year.
The underemployment rate has remained low in recent
months, at 1.8% (three-month moving average) in
September and 1.7% in October, down from 1.9% in
August. However, the underemployment rate is expected
to rise alongside the deteriorating domestic economic
conditions.
Source: C&SD
Chart 2.7Labour market conditions
20082003 2004 2005 2006 20071
2
3
4
5
6
7
8
9
3.0
3.1
3.2
3.3
3.4
3.5
3.6
3.7
%, 3m moving avg. mn persons, 3m moving avg.
Unemployment rate (lhs)
Labour force (rhs)
Employment (rhs)
Sources: C&SD and staff estimates.
Higher-skilled segmentHeadline unemployment rate
Lower-skilled segment
Chart 2.8 Unemployment rates in the higher and lower-skilled segments
1997 1998 1999 2000 2001 2002 2003 2004 2005 2006 2007 20080
2
4
6
8
10
12
%
Chart 2.9 Vacancy rate by sector
ManufacturingTransport, storage and communicationsWholesale, retail, import, export and restaurants
Sources: C&SD and staff estimates.
ConstructionCommunity, social and personal servicesFinancing, insurance, real estate and bus services
1998 1999 2000 2001 2002 2003 2004 2005 2006 2007 20080
0.5
1.0
1.5
2.0
2.5
3.0%

Domestic economy
HALF-YEARLY MONETARY AND FINANCIAL STABILITY REPORT DECEMBER 200832
ProductivityOutput per worker – an indicator of labour productivity –
grew at a slower pace of 0.5% year on year in Q3, down
from 2.8% in Q2 and 5% in Q1 (Chart 2.10). Seasonally-
adjusted quarter on quarter, labour productivity
contracted by 1.5% in Q2 and 0.9% in Q3. The decline in
labour productivity was due to a marked cyclical decline
in output growth in Q2 and Q3, while employment only
changed slightly. In the near future, as long as output
contracts at a faster pace than employment, labour
productivity growth will remain lacklustre.
Chart 2.10 Output per worker
Sources: C&SD and staff estimates.
Seasonally-adjusted quarter-on-quarter growthYear-on-year growth
-8
-4
0
4
8
12
%
1996 20081997 1998 1999 2000 2001 2002 2003 2004 2005 2006 2007
Average annual growthin the past 10 years
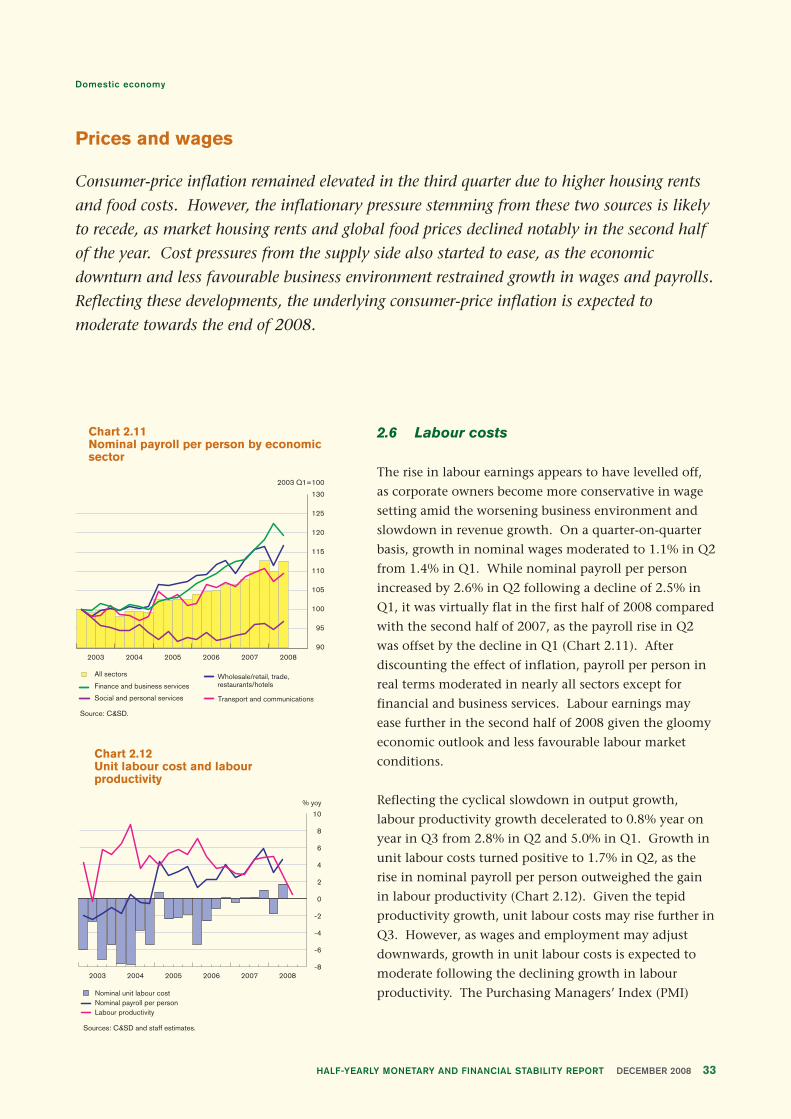
Domestic economy
33HALF-YEARLY MONETARY AND FINANCIAL STABILITY REPORT DECEMBER 2008
Prices and wages
Consumer-price inflation remained elevated in the third quarter due to higher housing rents
and food costs. However, the inflationary pressure stemming from these two sources is likely
to recede, as market housing rents and global food prices declined notably in the second half
of the year. Cost pressures from the supply side also started to ease, as the economic
downturn and less favourable business environment restrained growth in wages and payrolls.
Reflecting these developments, the underlying consumer-price inflation is expected to
moderate towards the end of 2008.
2.6 Labour costs
The rise in labour earnings appears to have levelled off,
as corporate owners become more conservative in wage
setting amid the worsening business environment and
slowdown in revenue growth. On a quarter-on-quarter
basis, growth in nominal wages moderated to 1.1% in Q2
from 1.4% in Q1. While nominal payroll per person
increased by 2.6% in Q2 following a decline of 2.5% in
Q1, it was virtually flat in the first half of 2008 compared
with the second half of 2007, as the payroll rise in Q2
was offset by the decline in Q1 (Chart 2.11). After
discounting the effect of inflation, payroll per person in
real terms moderated in nearly all sectors except for
financial and business services. Labour earnings may
ease further in the second half of 2008 given the gloomy
economic outlook and less favourable labour market
conditions.
Reflecting the cyclical slowdown in output growth,
labour productivity growth decelerated to 0.8% year on
year in Q3 from 2.8% in Q2 and 5.0% in Q1. Growth in
unit labour costs turned positive to 1.7% in Q2, as the
rise in nominal payroll per person outweighed the gain
in labour productivity (Chart 2.12). Given the tepid
productivity growth, unit labour costs may rise further in
Q3. However, as wages and employment may adjust
downwards, growth in unit labour costs is expected to
moderate following the declining growth in labour
productivity. The Purchasing Managers’ Index (PMI)
Sources: C&SD and staff estimates.
Chart 2.12Unit labour cost and labour productivity
Nominal unit labour costNominal payroll per personLabour productivity
20082003 2004 2005 2006 2007-8
-6
-4
-2
0
2
4
6
8
10
% yoy
All sectors Wholesale/retail, trade, restaurants/hotels
Transport and communications
Finance and business services
Social and personal services
Chart 2.11Nominal payroll per person by economic sector
Source: C&SD.
2003 2004 2005 20082006
2003 Q1=100
90
95
100
105
110
115
120
125
130
2007

Domestic economy
HALF-YEARLY MONETARY AND FINANCIAL STABILITY REPORT DECEMBER 200834
shows that the staff cost component declined to the
dividing line of 50 in November from 54.1 in Q3.
A slower growth in labour costs helps contain domestic
cost pressures to maintain the competitiveness of the
services sector in the face of the global economic
downturn. An HKMA study shows little sign of
downward wage rigidity in Hong Kong, suggesting that
the domestic labour market is flexible in adjusting to
changes in the external environment. The key findings
of the study are summarised in Box 3.

Domestic economy
35HALF-YEARLY MONETARY AND FINANCIAL STABILITY REPORT DECEMBER 2008
Box 3Labour market flexibility in Hong Kong
The currency board system in Hong Kong requires a
flexible labour market so the economy can adjust
efficiently to external shocks. Indeed, the labour market
is generally perceived as flexible with limited
government intervention, while collective bargaining
does not play a large role in negotiating terms of
employment. This Box provides some empirical
evidence on how wages and employment have behaved
during periods of economic downturn.
Statistical evidence suggests wages in Hong Kong are
flexible. The average nominal wage declined during the
Asian financial crisis, the bursting of the tech bubble,
and the SARS outbreak (Chart B3.1). While nominal
wage cuts are rare in countries with labour market
rigidities, wages in Hong Kong showed strong downward
flexibility during the SARS outbreak (Chart B3.2) as well
as in other periods.
In response to large negative economic shocks, a flexible
labour market should exhibit changes in both wages and
employment. Indeed, this is what happened in Hong
Kong. The SARS outbreak led to a reshuffling across
industries, with labour moving away from
manufacturing, which is less competitive, to more
productive sectors (financial services, trade, and retail
business). At the same time, wages were reduced across
industries to regain competitiveness (Chart B3.3).
-4
-2
0
2
4
6
8
10
12
14
%
1993 1995 1997 1999 2001 2003 2005
Nominal wages growth rate Average inflation
Chart B3.1Hong Kong: inflation and growthin wages
Source: CEIC.
Chart B3.2 Hong Kong: distribution of changesin wages, 2002-04
Note: Based on the average wages for 46 Hong Kong StandardIndustrial Classification (HSIC) 4-digit industries with4-6 occupational groups per industry.
Source: C&SD.
0
20
40
60
80
100
120
-15 -12 -9 -6 -3 0 3 6 9 12 15
% change in nominal wages
Num
ber of occupational groups
-20
-15
-10
-5
0
5
10
-2.5 -0.5 1.5 3.5 5.5 7.5
% change in wages
% change in the num
ber of workers
Manufacturing
Electricity, gas, and water
Transportation
Financial and business services
Retail, wholesale, and trade
Chart B3.3Hong Kong: changes in wages andemployment in five industries, 2003-04
Source: C&SD.

Domestic economy
HALF-YEARLY MONETARY AND FINANCIAL STABILITY REPORT DECEMBER 200836
One way to test the flexibility of Hong Kong’s labour
market is to compare it with the labour market in the US,
which is also generally regarded as flexible (Table B3.A).
This test shows that Hong Kong has had a substantial
amount of wage cuts (42.41% to 14.4% for the US), when
we compare the available data from two prolonged
periods of the two economies. However, the contrast
might be due to different shocks the two economies
experienced during their respective samples. This can be
illustrated by the difference in the average inflation rates
(0.24 for Hong Kong and 3.5 for the US). A more
informative comparison requires matching two similar
periods.
The labour markets in Hong Kong and the US behaved in
a remarkably similar way once we compare the two
economies for periods with similar inflation rates. First,
we look at the period when both economies experienced
inflation of around 6-7%. Both encountered a median
wage growth rate of around 7%, which closely followed
the inflation rate. And, the shares of observations below
zero were low for both economies (7% for Hong Kong
and 8.7% for the US). Next, we turn to comparing “low
inflation years”, when the inflation rate was 2-3% for
both economies. The median wage growth for Hong
Kong and the US was close (1.4% and 2.1% respectively).
Hong Kong shows wage cuts of 27.2%, compared with
22.2% in the US. Therefore, this exercise shows that the
Hong Kong labour market has at least comparable
flexibility with the US market.
Table B3.ADistribution of changes in wages, HongKong and the US
Hong Kong
Summary stat. on changes in wages
No. of % of obs.
Sample obs. Median Std. dev. <0 =0 Inflation
1996-2006 3,476 1.12 5.81 42.41 15.82 0.24
1996 316 6.56 4.58 6.96 1.90 6.33
2006 316 1.40 3.84 27.22 17.41 2.02
US
Summary stat. on changes in wages
No. of % of obs.
Sample obs. Median Std. dev. <0 =0 Inflation
1981-1998 92,862 3.4 10.8 14.4 17.6 3.5
High inflation 17,247 6.9 9.7 8.7 10.6 7.34
Low inflation 15,917 2.1 10.2 17.6 22.2 3.15
Notes:
1. High inflation years: 1981, 1982 and 1990.
2. Low inflation years: 1987, 1993 and 1995.
Sources: C&SD, and Lebow, Saks and Wilson (2003), “Downward NominalWage Rigidity: Evidence from the Employment Cost Index”,Advances in Macroeconomics, Vol. 3(1), Article 2.

Domestic economy
37HALF-YEARLY MONETARY AND FINANCIAL STABILITY REPORT DECEMBER 2008
2.7 Commodity and import prices
Import-price inflation moderated somewhat as global
commodity prices slipped from their peak in mid-2008.
On a quarter-on-quarter basis, import-price inflation
picked up to 10.1% (annualised) in Q3 from 6.6% in Q2;
both were lower than the reading of 13.6% in Q1. The
rise in prices of retained imports was driven by higher
costs of raw materials, food and capital goods
(Chart 2.13). With global food and crude oil prices
falling since the middle of the year, import-price
inflation is expected to ease further in Q4. The
stabilisation of food prices in Mainland China will also
alleviate the price pressures on fresh food in the domestic
market.
With weakening global demand, commodity prices
declined across the board in the second half of the year.
The average crude oil price dropped by almost two-thirds
from the peak of US$132 a barrel in July to below US$50
in November. Non-fuel commodity prices fell by more
than a quarter (Chart 2.14). Reflecting a stronger US
dollar, the Hong Kong dollar nominal effective exchange
rate strengthened by 2.2% in Q3. Lower commodity
prices, together with a stronger US dollar, are likely to
contain import-price inflation in Hong Kong.
2.8 Consumer prices
Consumer-price inflation continued to rise in Q3, but is
likely to peak soon. After netting out the effects of
various government relief measures, the underlying CCPI
inflation picked up to 6.3% year on year in Q3 from
5.7% in Q2, largely driven by higher food costs and
private housing rents. On a three-month-on-three-
month comparison, the annualised rate of CCPI inflation
eased to 3.7% in October from 8.8% in April, mainly due
to a moderation in food-price inflation. Excluding basic
food and energy, core inflation declined to 3.7% from 6.0%
over the same period, reflecting a smaller increase in the
costs of dining out and other services (Chart 2.15).
Sources: C&SD and IMF.
Chart 2.14Commodity and import prices
20082003 2004 2005 2006 200780
90
100
110
120
130
140
150
160
0
50
100
150
200
250
300
400
350
500
450
Jan 2003 = 100Jan 2003 = 100
Oil prices (rhs)
HKD nominal effectiveexchange rate (lhs)
World non-fuelcommodity prices (rhs)
Unit value index ofretained imports (lhs)
Sources: C&SD and staff estimates.
Chart 2.15Different measures of consumer-price inflation
2004 2005 2006 2007 2008
CCPI inflation excluding basic food and energy(3m-on-3m, annualised)
Underlying CCPI inflation (yoy)
-4
-2
0
2
4
6
8
10%
Underlying CCPI inflation (3m-on-3m, annualised)
Sources: C&SD and staff estimates.
Food
Consumer goods
Raw materials
Fuel
Capital goods
Others
Chart 2.13Contributions to import-price inflation
2003 2007 2008200620052004
% qoq annualised, non-seasonally adjusted
-15
-10
-5
0
5
10
15
20Retained importsunit value index

Domestic economy
HALF-YEARLY MONETARY AND FINANCIAL STABILITY REPORT DECEMBER 200838
Disaggregate data show that price pressures receded in
the tradable and service sectors except for housing rents.
Growth of the tradable goods component of the CCPI
dropped to 4.7% (annualised) quarter on quarter in Q3
from the peak of 13.2% in Q1, reflecting a smaller
increase in basic food prices and declines in durable
goods prices (Chart 2.16). Inflation pressures also
diminished in the service sector excluding housing, as
the rise in commercial rents and labour costs moderated,
alleviating the operating costs for service providers
(Chart 2.17). The rental component registered the fastest
growth rate in the CCPI, with housing rents rising by
10.9% (annualised) quarter on quarter in Q3 following a
gain of 8.8% in Q1. The rapid growth in housing rents
in part reflected the property market boom in the first
half of 2008, with residential property prices growing by
7.4% during the period. If the rental component is
excluded from the CCPI, the quarter-on-quarter
consumer-price inflation would be 3.1% (annualised) in
Q3, lower than the underlying inflation of 5.3% and core
inflation (excluding food and energy) of 4.7%.
With the easing of import-price inflation, the near-term
inflation outlook will depend on developments in
domestic cost factors. While the rental component has
been the key driver of CCPI inflation, residential
property prices declined notably by nearly 5% quarter on
quarter in Q3. The market rental index of residential
property also fell in tandem, by 2.2% over the same
period. This suggests that the rapid rise in the rental
component will end soon. On the supply side, growth in
nominal payroll per person is expected to moderate as
well given weaker domestic demand and less favourable
labour market conditions. Monthly indicators show that
growth in housing rents and basic food prices continued
to decline in Q4, which will exert downward pressure on
consumer-price inflation towards the end of this year
(Chart 2.18).
Chart 2.17Service-price inflation excluding rent
Cost of dining out (rhs) Other services ex-rent (rhs)
Service-price inflation (rhs)
Sources: C&SD and staff estimates.
Payroll per person (lhs)Retail rent (lhs)
2003 20082004 2005 20072006
2003 Q1 = 100 % qoq annualised
70
80
90
100
110
120
130
140
-6
-4
-2
0
2
4
6
8
Chart 2.18Private housing rents andbasic food prices
% yoy
200820042001 20052002 2006 20072003
Sources: C&SD, and Rating and Valuation Department (R&VD).
-20
0
-5
-10
-15
5
10
15
20
25
Private housing rents
Basic food prices
Chart 2.16Consumer-price inflation by broad component
Sources: C&SD and staff estimates.
Rentals
Tradables
Non-tradables excluding rentals
20082003 2004 2005 2006 2007
% 3m-on-3m annualised
-12
-8
-4
0
4
8
12
16

Domestic economy
39HALF-YEARLY MONETARY AND FINANCIAL STABILITY REPORT DECEMBER 2008
Asset markets
Local equity prices slumped as the global financial crisis intensified. In the property market,
house prices declined notably in the third quarter after the sharp increases in late 2007 and
early 2008. Weakened sentiment and less favourable labour market conditions will continue
to weigh on property market activity in the coming months. In the commercial property
segment, rental values of office spaces and retail premises moderated as a result of the
worsening external environment and domestic economic prospects.
2.9 Equity market
Local share prices have fallen sharply over the past six
months (Chart 2.19). At the beginning of the review
period, the market continued to be weighed down by
concerns stemming from further monetary tightening
and an overhang of non-tradable shares on the
Mainland. However, as the economic outlook weakened,
the Mainland authorities shifted their policy emphasis
from controlling inflation to safeguarding growth. This
provided short-lived support to local shares, especially
H-shares and other China-related stocks. However, as
the global financial crisis continued to unfold, a series of
events – including the failure of Lehman Brothers, the
near-collapse of AIG and the hiccup in passing the
US$700 billion rescue package in the US – sparked
system-wide concerns about the safety of financial
institutions, with interbank funding networks paralysed,
depositor confidence badly shaken, and a credit crunch
about to take hold. This triggered a major risk
reappraisal in international capital markets. The local
stock market went into a tailspin as risk appetite fell in
October (Chart 2.20).17 In a drive to restore confidence
and stability in mid-October, the HKSAR Government
joined other governments around the world in
introducing extraordinary measures to unfreeze credit
markets and protect depositors. However, the sell-off
continued until the end of the month as heavy
redemptions in investment funds accelerated amid
Chart 2.20Risk Appetite Index
Long term average of RAI = 101
HSI (rhs)RAI (lhs)
Dec 2006 Jun 2007 Dec 2007 Jun 2008
Risk Appetite Index (RAI) (Jun 2004 = 100) HSI
0
20
40
60
80
100
120
140
160
0
5,000
10,000
15,000
20,000
25,000
30,000
35,000
Increasing risk appetite
Sources: Bloomberg and HKMA staff estimates (HKMA Working Paper 05/2007).
Chart 2.19Equity prices in Hong Kong
Jan 2006 = 100
200820072006
Hang Seng Index (HSI)
Source: Bloomberg.
H-share
50
100
150
200
250
300
350
17 Yu and Tam (2007), “Measuring Market Sentiment in Hong Kong’sStock Market”, HKMA Working Paper 05/2007.
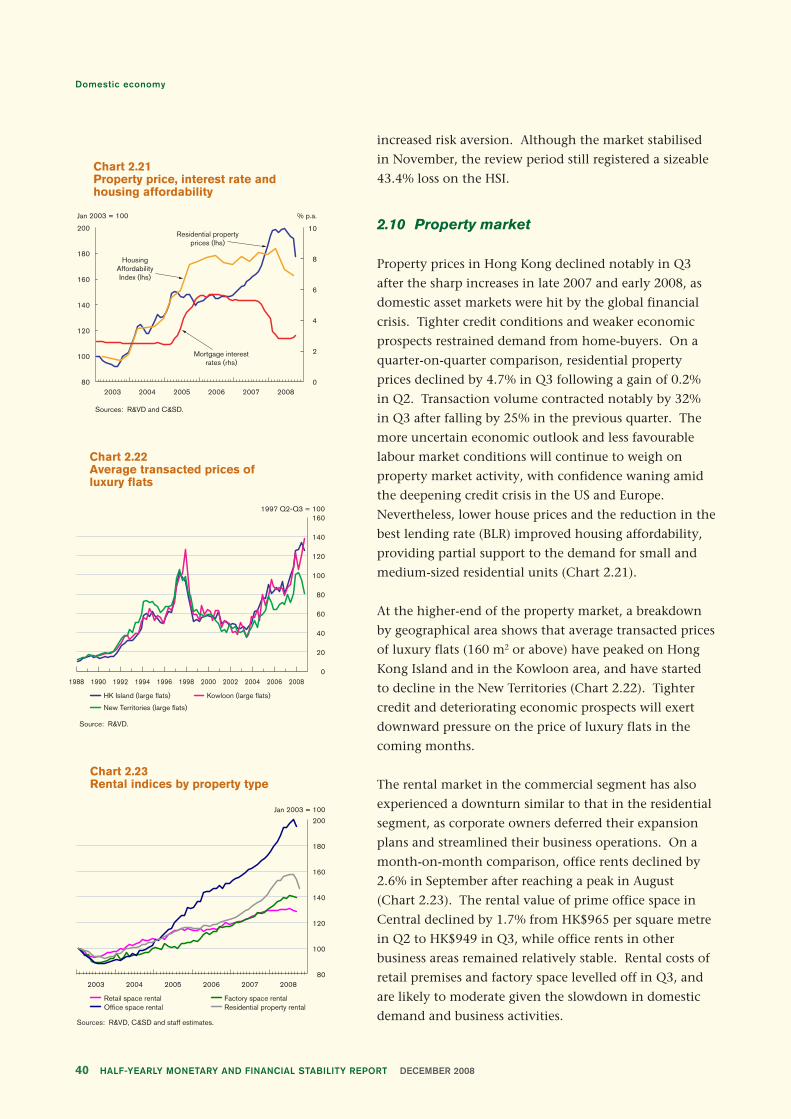
Domestic economy
HALF-YEARLY MONETARY AND FINANCIAL STABILITY REPORT DECEMBER 200840
increased risk aversion. Although the market stabilised
in November, the review period still registered a sizeable
43.4% loss on the HSI.
2.10 Property market
Property prices in Hong Kong declined notably in Q3
after the sharp increases in late 2007 and early 2008, as
domestic asset markets were hit by the global financial
crisis. Tighter credit conditions and weaker economic
prospects restrained demand from home-buyers. On a
quarter-on-quarter comparison, residential property
prices declined by 4.7% in Q3 following a gain of 0.2%
in Q2. Transaction volume contracted notably by 32%
in Q3 after falling by 25% in the previous quarter. The
more uncertain economic outlook and less favourable
labour market conditions will continue to weigh on
property market activity, with confidence waning amid
the deepening credit crisis in the US and Europe.
Nevertheless, lower house prices and the reduction in the
best lending rate (BLR) improved housing affordability,
providing partial support to the demand for small and
medium-sized residential units (Chart 2.21).
At the higher-end of the property market, a breakdown
by geographical area shows that average transacted prices
of luxury flats (160 m2 or above) have peaked on Hong
Kong Island and in the Kowloon area, and have started
to decline in the New Territories (Chart 2.22). Tighter
credit and deteriorating economic prospects will exert
downward pressure on the price of luxury flats in the
coming months.
The rental market in the commercial segment has also
experienced a downturn similar to that in the residential
segment, as corporate owners deferred their expansion
plans and streamlined their business operations. On a
month-on-month comparison, office rents declined by
2.6% in September after reaching a peak in August
(Chart 2.23). The rental value of prime office space in
Central declined by 1.7% from HK$965 per square metre
in Q2 to HK$949 in Q3, while office rents in other
business areas remained relatively stable. Rental costs of
retail premises and factory space levelled off in Q3, and
are likely to moderate given the slowdown in domestic
demand and business activities.
Chart 2.21Property price, interest rate andhousing affordability
Jan 2003 = 100 % p.a.
Sources: R&VD and C&SD.
0
2
4
6
8
10
HousingAffordabilityIndex (lhs)
Mortgage interestrates (rhs)
Residential propertyprices (lhs)
80
100
120
140
160
180
200
2003 2004 2005 2006 2007 2008
Chart 2.22Average transacted prices ofluxury flats
1997 Q2-Q3 = 100
HK Island (large flats) Kowloon (large flats)
Source: R&VD.
New Territories (large flats)
0
20
40
60
80
100
120
160
1988 1990 1992 1994 1996 1998 2000 2002 2004 2006 2008
140
Chart 2.23Rental indices by property type
Jan 2003 = 100
2003 2004 2006 20072005
Retail space rental Factory space rental
Sources: R&VD, C&SD and staff estimates.
Office space rental Residential property rental
80
100
120
140
160
180
200
2008
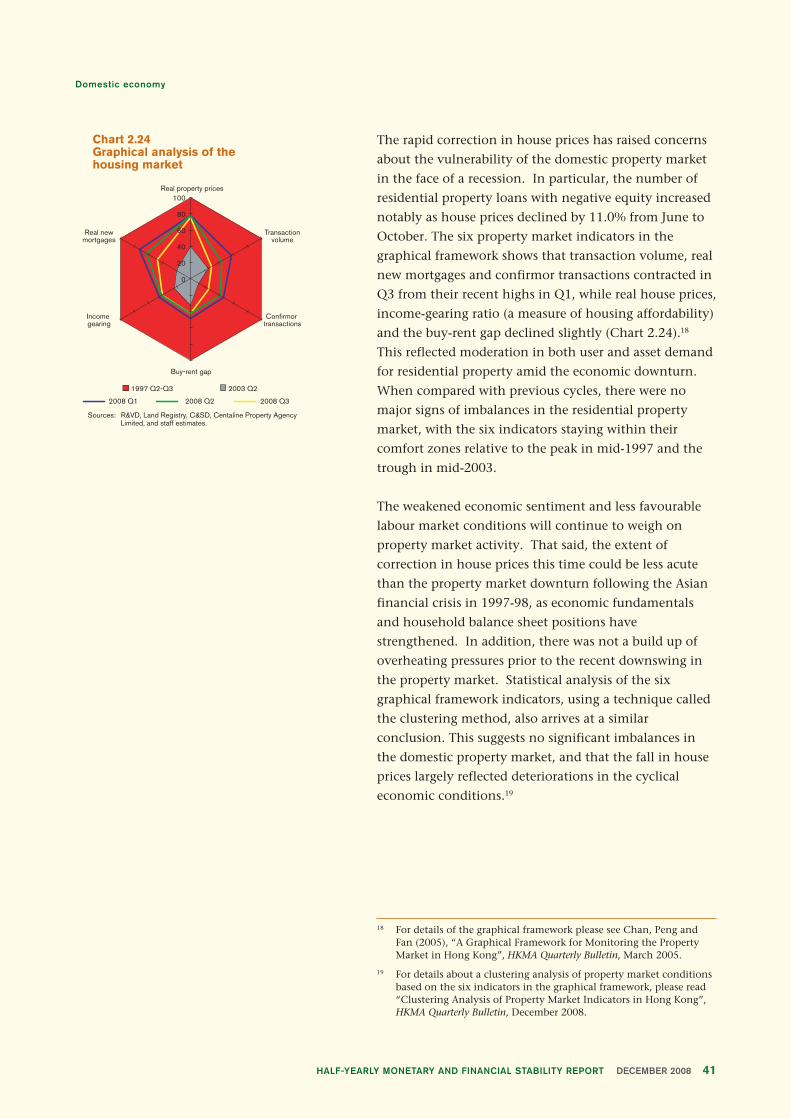
Domestic economy
41HALF-YEARLY MONETARY AND FINANCIAL STABILITY REPORT DECEMBER 2008
The rapid correction in house prices has raised concerns
about the vulnerability of the domestic property market
in the face of a recession. In particular, the number of
residential property loans with negative equity increased
notably as house prices declined by 11.0% from June to
October. The six property market indicators in the
graphical framework shows that transaction volume, real
new mortgages and confirmor transactions contracted in
Q3 from their recent highs in Q1, while real house prices,
income-gearing ratio (a measure of housing affordability)
and the buy-rent gap declined slightly (Chart 2.24).18
This reflected moderation in both user and asset demand
for residential property amid the economic downturn.
When compared with previous cycles, there were no
major signs of imbalances in the residential property
market, with the six indicators staying within their
comfort zones relative to the peak in mid-1997 and the
trough in mid-2003.
The weakened economic sentiment and less favourable
labour market conditions will continue to weigh on
property market activity. That said, the extent of
correction in house prices this time could be less acute
than the property market downturn following the Asian
financial crisis in 1997-98, as economic fundamentals
and household balance sheet positions have
strengthened. In addition, there was not a build up of
overheating pressures prior to the recent downswing in
the property market. Statistical analysis of the six
graphical framework indicators, using a technique called
the clustering method, also arrives at a similar
conclusion. This suggests no significant imbalances in
the domestic property market, and that the fall in house
prices largely reflected deteriorations in the cyclical
economic conditions.19
Chart 2.24 Graphical analysis of thehousing market
Sources: R&VD, Land Registry, C&SD, Centaline Property Agency Limited, and staff estimates.
Real property prices
Transactionvolume
Confirmor transactions
Buy-rent gap
Income gearing
Real newmortgages
1997 Q2-Q3 2003 Q2
0
20
40
60
80
100
2008 Q1 2008 Q2 2008 Q3
18 For details of the graphical framework please see Chan, Peng andFan (2005), “A Graphical Framework for Monitoring the PropertyMarket in Hong Kong”, HKMA Quarterly Bulletin, March 2005.
19 For details about a clustering analysis of property market conditionsbased on the six indicators in the graphical framework, please read“Clustering Analysis of Property Market Indicators in Hong Kong”,HKMA Quarterly Bulletin, December 2008.
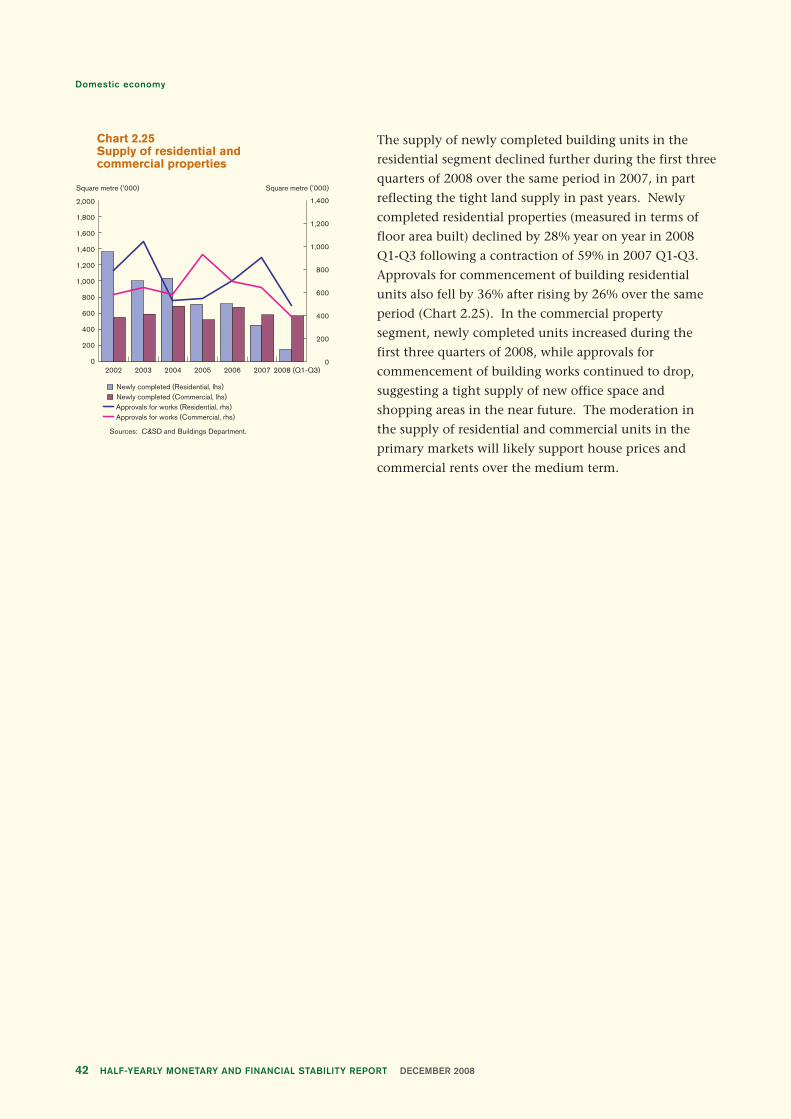
Domestic economy
HALF-YEARLY MONETARY AND FINANCIAL STABILITY REPORT DECEMBER 200842
The supply of newly completed building units in the
residential segment declined further during the first three
quarters of 2008 over the same period in 2007, in part
reflecting the tight land supply in past years. Newly
completed residential properties (measured in terms of
floor area built) declined by 28% year on year in 2008
Q1-Q3 following a contraction of 59% in 2007 Q1-Q3.
Approvals for commencement of building residential
units also fell by 36% after rising by 26% over the same
period (Chart 2.25). In the commercial property
segment, newly completed units increased during the
first three quarters of 2008, while approvals for
commencement of building works continued to drop,
suggesting a tight supply of new office space and
shopping areas in the near future. The moderation in
the supply of residential and commercial units in the
primary markets will likely support house prices and
commercial rents over the medium term.
Chart 2.25Supply of residential andcommercial properties
20072003 2004 20052002 2008 (Q1-Q3)2006
Square metre (’000) Square metre (’000)
Sources: C&SD and Buildings Department.
Newly completed (Residential, lhs)Newly completed (Commercial, lhs)
Approvals for works (Commercial, rhs)Approvals for works (Residential, rhs)
0
200
400
600
800
1,000
1,200
1,400
1,600
1,800
2,000
0
200
400
600
800
1,000
1,200
1,400

Domestic economy
43HALF-YEARLY MONETARY AND FINANCIAL STABILITY REPORT DECEMBER 2008
Public finances
The fiscal outturn for 2008/09 is likely to record a larger deficit than the Budget estimates,
reflecting declines in tax revenue, stamp duties and land premium as the domestic economy
experiences a cyclical downturn. On the back of sizable fiscal reserves, the policy measures
unveiled in the 2008/09 Budget and the relief measures announced in July by the Chief
Executive provide a timely fiscal stimulus to mitigate the negative impact of a synchronised
global economic downturn.
2.11 Public finances
The Government is expected to record a deficit in 2008/
09, in part reflecting various tax concessions and short-
term relief measures. With the expansion in
infrastructure investment and other public spending, the
expansionary fiscal policy will help the domestic
economy to counter the global financial crisis. The
projection made in the Budget Speech suggests a deficit
of HK$7.5 billion (0.4% of GDP) in the current financial
year. However, as growth in the domestic economy is
forecast to slow considerably to 3-3.5% in 2008,
compared with 4-5% envisaged in the Budget, direct tax
revenue is likely to be lower than the budget estimates.
Proceeds from stamp duties are expected to shrink given
the contraction in stock market turnover and property
transactions. Land premium could decline sharply as the
near-term outlook for the property market worsens
(Chart 2.26). While investment income from the
placement of fiscal reserves with the Exchange Fund will
not be affected by the sharp declines in financial asset
prices, the actual fiscal deficit for 2008/09 could be much
larger than the Budget projection.
With sizable fiscal reserves, which stood at 30% of GDP
at the end of 2007/08, the Government can afford to
adopt an expansionary fiscal policy to cushion the
domestic economy against external shocks emanating
from the global credit crisis. With economic growth
having slowed considerably and inflationary pressures
receding, the policy measures proposed in the Budget
Speech and the relief measures announced by the Chief
Chart 2.26Land premium and turnover in stockand property markets1 & 2
HK$ bn
2001 2004 2006 20072005
Notes: 1. Land premium is measured on a fiscal year basis, and the figure for
2008 is annualised based on the proceeds received in the first half of 2008/09.
2. The 2008 figure of stock market average daily turnover covers the period from January to November. The 2008 figure of property market average monthly turnover covers the period from January to October.
Sources: CEIC, Government Treasury and staff estimates.
2002 2003 20080
10
20
30
40
50
60
70
80
90
100
Land premium
Monthly property market transactionsDaily stock market turnover

Domestic economy
HALF-YEARLY MONETARY AND FINANCIAL STABILITY REPORT DECEMBER 200844
Executive in July 2008 provide a timely stimulus to
support economic growth. The Government has also
pledged to accelerate capital spending on public works
and infrastructure to create employment opportunities in
the building and construction sectors. Other policy
initiatives, such as the expansion of government
guarantees to bank lending to SMEs and the provision of
short-term loans to business owners to meet their
operational and investment needs can also help
corporations that are vulnerable to the credit crunch.
Taken together, if the fiscal deficit widens to around 2%
of GDP from the budget projection of 0.4%, the fiscal
impulse would be equivalent to 5% of GDP, boosting
domestic economic growth by over one percentage
point.

45HALF-YEARLY MONETARY AND FINANCIAL STABILITY REPORT DECEMBER 2008
3.1 Exchange rate and interest rates
After trading within a narrow range of 7.7960 and 7.8139
between June and August, the Hong Kong dollar spot
exchange rate strengthened towards the strong-side
Convertibility Undertaking (CU) of 7.75 in September
and October (Chart 3.1). The strengthening was
reportedly due to the unwinding of the long-US-dollar-
short-Hong-Kong-dollar carry trades and possible
repatriation of funds into Hong Kong dollars by domestic
corporations. As market participants continued to
deleverage and reduce their exposure to risk, strong
demand for Hong Kong dollars persisted. In late October
and November, the spot exchange rate stayed close to
7.75, with the strong-side CU being triggered 27 times
between 31 October and 28 November.
Under the Linked Exchange Rate system, movements in
the bilateral exchange rates of the Hong Kong dollar
against other currencies closely follow those in the
bilateral exchange rates of the US dollar. From July to
November, the US dollar appreciated sharply against
other currencies except for the Japanese yen. The broad
3. Monetary and financial sector
Exchange rate, interest rates and monetary developments
The Hong Kong dollar spot exchange rate strengthened to the strong-side Convertibility
Undertaking of 7.75 during the review period. After the global financial crisis deepened in
mid-September, Hong Kong dollar interbank interest rates rose markedly. To ease money
market stress, the HKMA conducted foreign exchange operations to inject liquidity into the
banking system, announced five temporary measures to provide liquidity assistance to banks,
amended the formula for the calculation of the Base Rate effectively lowering borrowing costs
at the Discount Window, and increased the supply of Exchange Fund paper. As pre-emptive
measures to bolster public confidence in the banking system, the Financial Secretary also
announced a contingent capital facility for banks and introduced a temporary 100% deposit
protection arrangement. As a result, local interbank interest rates moderated.
Chart 3.1 Hong Kong dollar exchange rate
Source: HKMA.
2005 20082006 2007
Q1 Q2 Q3 Q1 Q2 Q3 Q4 Q1 Q2Q4 Q3 Q4 Q3 Q4Q2Q17.69
7.71
7.73
7.75
7.77
7.79
7.81
7.83
7.85HKD/USD
Market exchange rate
Weak-side Convertibility Undertaking
Strong-side ConvertibilityUndertaking

Monetary and financial sector
HALF-YEARLY MONETARY AND FINANCIAL STABILITY REPORT DECEMBER 200846
rebound in the US dollar reflected a number of factors,
including a flight to safety, sustained deleveraging,
worsening international economic prospects, and
expected cuts in policy interest rates outside the US. As a
result, the Hong Kong dollar generally strengthened
during the same period, with the Australian dollar, the
Korean won and the British pound recording some of the
largest depreciations against the Hong Kong dollar
(Chart 3.2).
Accompanying the rally in the US dollar, the trade
weighted nominal effective exchange rate index of the
Hong Kong dollar appreciated by around 4.8% between
July and October (Chart 3.3). The trade weighted real
effective exchange rate index also rebounded by 2.4% in
October, but it remained broadly stable in the third
quarter of 2008 because the effect of a stronger Hong
Kong dollar was offset by the impact of a decline in Hong
Kong’s headline inflation rate relative to its trading
partners. In the second quarter of 2008, both indices
were little changed along with a generally stable US
dollar.
The US Fed cut the federal funds target rate by a total of
225 basis points in the first four months of 2008, and
kept the target rate at 2% afterwards for about five
months (Chart 3.4). Despite the aggressive easing of US
monetary policy, term interbank interest rates for the US
dollar stayed firm, signalling persistent tightness in the
wholesale funding market. Against this background, the
term HIBORs rose to higher levels in late May and June,
partly because of worries about the deteriorating global
macroeconomic outlook and its associated negative
impact on money markets. From April to August, the
overnight HIBOR gradually tightened, possibly reflecting
Chart 3.2 Bilateral exchange rates of theHong Kong dollar since mid-2008
3020100-10-20-30-40-50-60
Note: Data ended on 29 November 2008.Source: HKMA.
Japanese yen
RenminbiThai baht
New Taiwan dollar
Singapore dollar
Malaysian ringgit
Swiss franc
Philippine peso
Canadian dollar
British pound
Euro
US dollar
Korean won
Australian dollar
depreciateagainst HK dollar
appreciateagainst HK dollar
%
Chart 3.3 Nominal and real effective exchangerates
Note: Monthly average figures. Real effective exchange rate index is seasonally adjusted.
Sources: HKMA staff estimates and C&SD.
70
75
80
85
90
95
100
105
Real effective exchange rate index
Nominal effective exchange rate index
Jan 2000 = 100
Q1 Q2 Q3 Q1 Q2 Q3 Q4 Q1 Q2Q4 Q3 Q4 Q3 Q4Q2Q1
2005 20082006 2007
Chart 3.4 Interest rates of the Hong Kong dollar and US dollar
US Federal Funds Target Rate
3-month HIBOR
0
1.0
2.0
3.0
4.0
6.0
5.0
7.0
8.0% p.a.
Source: HKMA.
2005 20082006 2007
Q1 Q2 Q3 Q1 Q2 Q3 Q4 Q1 Q2Q4 Q3 Q4 Q3Q2Q1 Q4
3-month LIBOR

Monetary and financial sector
47HALF-YEARLY MONETARY AND FINANCIAL STABILITY REPORT DECEMBER 2008
Chart 3.6 Interest rates of the Hong Kong dollar
% p.a.
Source: HKMA.
2005 20082006 2007
Q1 Q2 Q3 Q1 Q2 Q3 Q4 Q1 Q2Q4 Q3 Q4 Q3Q2Q1 Q4-2.0
-1.0
0
1.0
2.0
3.0
4.0
5.0
6.0
1-month Exchange Fund Bill yield
1-month HIBOR
tighter funding conditions associated with increases in
the Hong Kong dollar loan-to-deposit ratio (Chart 3.5).
Global money market conditions tightened considerably
after the investment bank Lehman Brothers filed
bankruptcy in the US on 15 September. Because of the
heightened perception of counterparty credit risk and
stockpiling of liquidity for contingencies, Hong Kong
dollar interbank interest rates spiked in tandem with
soaring US dollar counterparts (Charts 3.4 and 3.5). The
overnight and one-month HIBORs surged to intraday
highs of 4% and 6% respectively on 18 September.
Interest rate volatility also rose, and the HIBOR-LIBOR
differentials fluctuated sharply, with interest rate
discounts occasionally turning into premia. Term
spreads in the local money market increased, as banks
demanded higher compensation for borrowing periods
longer than overnight.
On 24 September, a brief, small-scale retail deposit run
on a local bank somewhat intensified tensions in the
local interbank credit market. The mini-run was caused
by unfounded rumours, spread by telephone short
messages, about the bank’s financial soundness. This led
to some concerns among domestic banks that possible
withdrawals by nervous depositors might increase
pressure on their funding despite a bank’s sound
fundamentals. In Hong Kong’s interbank market, there
were also reports of a tiering of pricing, with local and
foreign banks paying different costs for borrowings.
Credit lines among some banks were also reportedly
tightened due to prudential considerations. From mid-
September to mid-October, unusually strong demand for
Exchange Fund paper by banks for liquidity management
purposes drove the yields of short-dated Exchange Fund
paper to very low levels or below zero, resulting in a
divergence between local interbank interest rates and the
yields of corresponding Exchange Fund paper
(Chart 3.6).
In view of the sharp increases in local interbank interest
rates and the potential fragility of banking confidence
caused by a small-scale local bank run, the HKMA
proactively operated within the Convertibility Zone on
18 and 25 September to inject liquidity into the banking
Source: HKMA.
Chart 3.5 Overnight and policy interest rates
US Federal Funds Target Rate
Base Rate
0
1
2
3
4
6
5
7
8% p.a.
2005 20082006 2007
Q1 Q2 Q3 Q1 Q2 Q3 Q4 Q1 Q2Q4 Q3 Q4 Q3Q2Q1 Q4
Overnight HIBOR

Monetary and financial sector
HALF-YEARLY MONETARY AND FINANCIAL STABILITY REPORT DECEMBER 200848
system, purchasing US dollars against Hong Kong dollars
and increasing the Aggregate Balance by HK$1.6 billion
on 22 September and HK$3.9 billion on 29 September
(Chart 3.7). The overnight and one-month HIBORs
temporarily eased as a result.
In late September and early October, the term HIBORs
continued to climb despite the softening overnight
HIBOR following the HKMA’s liquidity injections into
the banking system (Chart 3.8). To address heightened
credit and liquidity concerns among banks, the HKMA
implemented five temporary measures on 2 October to
provide additional longer term funding for licensed
banks against a wider-than-usual range of collateral (Box
4 discusses various measures that have been taken by the
HKMA and the Financial Secretary since late September).
The one-month and three-month HIBORs generally
eased along with their US dollar counterparts following
the change of the Base Rate formula on 8 October and
the introduction of pre-emptive measures to bolster
public confidence in the banking system on 14 October
(Chart 3.8). According to the new Base Rate formula (the
prevailing US federal funds target rate plus 50 basis
points), the Base Rate was lowered twice to a historical
low of 1.5% at the end of November, following two
50-basis-point reductions in the federal funds target rate
on 8 October and 29 October. Reflecting the reduced
borrowing cost at the Discount Window, the overnight
HIBOR declined further.
The easing in the term HIBORs continued when the
HKMA announced on 20 October that it would supply
additional three-month Exchange Fund Bills to meet
increased demand for such paper by the banks. On that
date, the HKMA operated within the Convertibility Zone
to neutralise the expected impact of the Exchange Fund
Bill issuance on the level of the Aggregate Balance. The
initial HK$4 billion increase in the Aggregate Balance was
subsequently offset in two steps by completing the
allotments of the additional Exchange Fund Bills in late
October and early November.
Chart 3.7 Aggregate Balance (before DiscountWindow Activity)
HK$ bn
Source: HKMA.
2005 20082006 2007
Q1 Q2 Q3 Q1 Q2 Q3 Q4 Q1 Q2Q4 Q3 Q4 Q3Q2Q1 Q40
10
20
30
40
50
60
70
80
90
Chart 3.8 Base Rate and the interbank interestrates of the Hong Kong dollar
Source: HKMA.
% p.a.
1 Sep 15 Sep 29 Sep 13 Oct 27 Oct 10 Nov 24 Nov0
0.5
1.0
1.5
2.0
2.5
3.0
3.5
4.0
4.5
5.0
Overnight HIBOR
1-month HIBOR
3-month HIBOR
Base Rate

Monetary and financial sector
49HALF-YEARLY MONETARY AND FINANCIAL STABILITY REPORT DECEMBER 2008
As the term HIBORs showed signs of renewed tightness
in late October on concerns about the fallout from
turbulence in certain emerging markets, the HKMA
carried out three more within-zone foreign exchange
operations, one on 23 October and two on 27 October,
raising the Aggregate Balance further by a total of
HK$19.4 billion to HK$31.5 billion on 29 October.
Repeated triggering of the strong-side Convertibility
Undertaking between 31 October and 28 November
further improved interbank liquidity in the local money
market. Reflecting persistent capital inflows, the
Aggregate Balance expanded to HK$84.3 billion on 28
November, compared with the previous historic high of
around HK$55 billion in early 2004 when the market
speculated that the Hong Kong dollar would strengthen
on the appreciation of the renminbi.
Local interbank interest rates moderated further in early
November and became broadly stable afterwards. The
overnight HIBOR closed at 0.1% on 28 November,
compared with an intraday high of 4% on 18 September.
The one-month and three-month HIBORs also declined
to 1.1% and 1.9% respectively, after reaching more than
4% in mid-October.
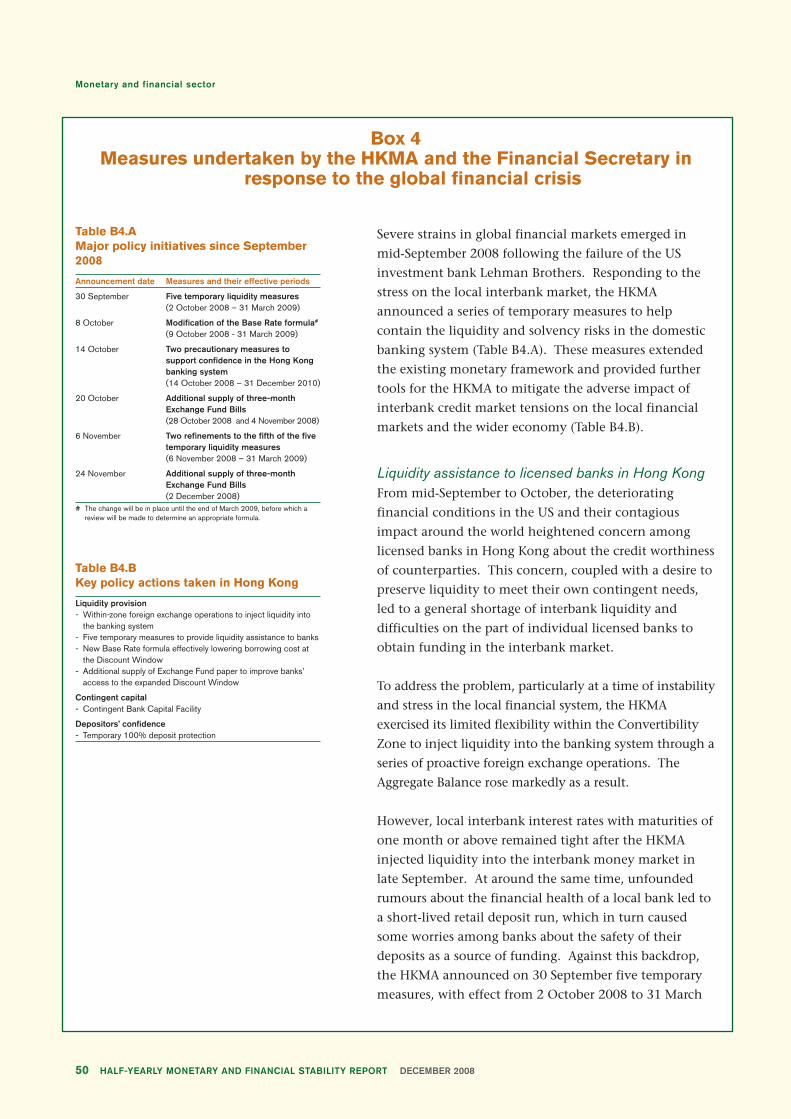
Monetary and financial sector
HALF-YEARLY MONETARY AND FINANCIAL STABILITY REPORT DECEMBER 200850
Box 4Measures undertaken by the HKMA and the Financial Secretary in
response to the global financial crisis
Severe strains in global financial markets emerged in
mid-September 2008 following the failure of the US
investment bank Lehman Brothers. Responding to the
stress on the local interbank market, the HKMA
announced a series of temporary measures to help
contain the liquidity and solvency risks in the domestic
banking system (Table B4.A). These measures extended
the existing monetary framework and provided further
tools for the HKMA to mitigate the adverse impact of
interbank credit market tensions on the local financial
markets and the wider economy (Table B4.B).
Liquidity assistance to licensed banks in Hong KongFrom mid-September to October, the deteriorating
financial conditions in the US and their contagious
impact around the world heightened concern among
licensed banks in Hong Kong about the credit worthiness
of counterparties. This concern, coupled with a desire to
preserve liquidity to meet their own contingent needs,
led to a general shortage of interbank liquidity and
difficulties on the part of individual licensed banks to
obtain funding in the interbank market.
To address the problem, particularly at a time of instability
and stress in the local financial system, the HKMA
exercised its limited flexibility within the Convertibility
Zone to inject liquidity into the banking system through a
series of proactive foreign exchange operations. The
Aggregate Balance rose markedly as a result.
However, local interbank interest rates with maturities of
one month or above remained tight after the HKMA
injected liquidity into the interbank money market in
late September. At around the same time, unfounded
rumours about the financial health of a local bank led to
a short-lived retail deposit run, which in turn caused
some worries among banks about the safety of their
deposits as a source of funding. Against this backdrop,
the HKMA announced on 30 September five temporary
measures, with effect from 2 October 2008 to 31 March
Table B4.BKey policy actions taken in Hong Kong
Liquidity provision- Within-zone foreign exchange operations to inject liquidity into
the banking system- Five temporary measures to provide liquidity assistance to banks- New Base Rate formula effectively lowering borrowing cost at
the Discount Window- Additional supply of Exchange Fund paper to improve banks’
access to the expanded Discount Window
Contingent capital- Contingent Bank Capital Facility
Depositors’ confidence- Temporary 100% deposit protection
Table B4.AMajor policy initiatives since September2008
Announcement date Measures and their effective periods
30 September Five temporary liquidity measures(2 October 2008 – 31 March 2009)
8 October Modification of the Base Rate formula#
(9 October 2008 - 31 March 2009)
14 October Two precautionary measures tosupport confidence in the Hong Kongbanking system(14 October 2008 – 31 December 2010)
20 October Additional supply of three-monthExchange Fund Bills(28 October 2008 and 4 November 2008)
6 November Two refinements to the fifth of the fivetemporary liquidity measures(6 November 2008 – 31 March 2009)
24 November Additional supply of three-monthExchange Fund Bills(2 December 2008)
# The change will be in place until the end of March 2009, before which areview will be made to determine an appropriate formula.

Monetary and financial sector
51HALF-YEARLY MONETARY AND FINANCIAL STABILITY REPORT DECEMBER 2008
2009, to provide liquidity assistance to licensed banks in
Hong Kong (Table B4.C).
The five temporary measures provided additional longer-
term funding to banks against a wider range of collateral
at a potentially lower interest rate cost. As a result of
these backstop liquidity facilities, the banks should be
more assured about the availability of funds, and be
more willing to lend in the interbank market. Shortly
after the measures were implemented, the overnight
HIBOR gradually eased. However the liquidity in the
longer end of the interbank market, especially beyond
one month, remained tight in early October, reflecting
persistent concerns about counterparty credit risk.
Subsequently, the HKMA announced on 6 November two
refinements to the last of the five temporary liquidity
measures introduced on 30 September, extending the
maximum tenor of the collateralised term lending from
one month to three months and lowering the interest
rate for such lending. This partly reflected the secured
nature of such term lending amid distortions and
frictions in the term interbank funding market.
After the term HIBORs continued to climb in early
October, despite easing overnight interbank interest
rates, the HKMA announced on 8 October an adjustment
in the methodology for the determination of the Base
Rate in Hong Kong. (Table B4.D provides a summary of
the structure of the Discount Rate and the Base Rate prior
to 30 September 2008). With effect from 9 October, the
formula for determining the Base Rate was changed by
reducing the spread of 150 basis points above the
prevailing US Federal Funds Target Rate (FFTR) to 50 basis
points. The other leg relating to the moving averages of
the relevant interbank interest rates was removed from
the formula until 31 March 2009.
Under the expanded Discount Window, the borrowing
cost is effectively lowered after adopting the new Base
Rate formula (the prevailing US FFTR plus 50 basis
points), overnight borrowings are charged at the unified
Base Rate and term borrowings are charged at a premium
over the Base Rate (Table B4.E). To further improve
banks’ access to the various newly-introduced liquidity
Table B4.CLiquidity assistance to licensed banks inHong Kong: five temporary liquiditymeasures announced on 30 September
(i) Wider scope of collateral under the Discount WindowExpanding eligible securities under the Discount Window toinclude US dollar assets of credit quality acceptable to theHKMA
(ii) Term Discount Window borrowingExtending the term of the liquidity provided through theDiscount Window from overnight to maturities up to three months
(iii) Lowering interest rate at the Discount WindowWaiving the penalty rate for using over 50% of the ExchangeFund paper holding in accessing the Discount Window
(iv) Foreign exchange swapsConducting foreign exchange swaps (between US dollars andHong Kong dollars of various durations) with individuallicensed banks when necessary
(v) Term lending against collateralLending term money to individual licensed banks againstacceptable collaterals when necessary, and interest rate for suchlending is determined with reference to market interest rates
Table B4.DThe Base Rate and the Discount Ratebefore 30 September
Percentage of ApplicableExchange Discount Rate Discount RateFund paper consists of (or Base Rate)held by a bank two tiers formula
First 50% Base Rate (a) 150 basis points +which is the US Federal Funds Target
Ratehigher of:
(b) Simple average of the5-day moving averagesof the overnight andone-month HIBORs
Next 50% Base Rate with (c) Base Rate + 5%penal element,which is the (d) Base Rate + overnighthigher of: HIBOR
Note: Parts (c) and (d) were removed under the third of the five temporaryliquidity measures, and, in the adjustment of the Base Rate formula, part(b) was removed and the 150-basis-point spread in part (a) waschanged to 50 basis points.
Table B4.EThe expanded Discount Window
Applicable Discount Rate
Eligible collateral Overnight 1 to 3-month
Exchange Fund Paper Base Rate Base Rate + premium
US Treasuries Base Rate Base Rate + premium
Note: The Base Rate is determined as the prevailing US FFTR plus 50 basispoints.

Monetary and financial sector
HALF-YEARLY MONETARY AND FINANCIAL STABILITY REPORT DECEMBER 200852
facilities, the HKMA announced on 20 October the
issuance of HK$4 billion of additional three-month
Exchange Fund Bills in the tenders on 28 October and
4 November. On the announcement day, and in order to
maintain the prevailing level of liquidity of the banking
system, the HKMA operated within the Convertibility
Zone by purchasing US dollars against Hong Kong
dollars, so that the initial increase in the Aggregate
Balance would be offset by the additional Exchange Fund
Bill issuance. Subsequently, the HKMA announced on
24 November another issuance of additional
three-month Exchange Fund Bills in a tender on
2 December. The increased supply of Exchange Fund
paper helps to address the strong demand for the paper
by banks for liquidity management, as evidenced by the
very low yields of the short-dated Exchange Fund Bills.
Two new precautionary measures to strengthenconfidence in Hong Kong’s banking systemIn addition to liquidity facilities, the Financial Secretary
announced on 14 October two new precautionary
measures to further strengthen confidence in Hong
Kong’s banking system. First, a Contingent Bank Capital
Facility was introduced to help provide comfort to banks
on the availability of additional capital when necessary,
and thus guard against systemic failures in the financial
system. Secondly, the Exchange Fund will be used to
temporarily guarantee the repayment of all customer
deposits held with all Authorized Institutions in Hong
Kong (including Restricted Licence Banks and Deposit-
taking Companies). The temporary 100% deposit
protection applies to both Hong Kong dollar and foreign
currency deposits, including those held with Hong Kong
branches of overseas institutions. Both measures will
remain in force until the end of 2010. The new
arrangements are not expected to be triggered, as the
Hong Kong banking sector is fundamentally sound. The
deposit guarantee may introduce distortions to the
banking system, for example, by affecting the incentives
for prudent management of risks by banks, the
competitive environment among banks and the need for
depositors to exercise due diligence. This, in turn, may
lead to moral hazard. The HKMA will pay additional
supervisory attention to this potential hazard.

Monetary and financial sector
53HALF-YEARLY MONETARY AND FINANCIAL STABILITY REPORT DECEMBER 2008
Chart 3.10 Hong Kong dollar M3
% HK$ bn
200820062005
M3 (rhs)M1 (rhs)M3: % change over a year ago (lhs)M3: % change over three months ago (lhs)
Note: Hong Kong dollar M1 is not seasonally adjusted.
Source: HKMA.
2007-20
-10
0
10
20
30
40
50
60
70
80
90
100
-1,000
-500
0
500
1,000
1,500
2,000
2,500
3,000
3,500
4,000
4,500
5,000
Chart 3.9 Backing Ratio
%
2005 20082006 2007
Q1 Q2 Q3 Q1 Q2 Q3 Q4 Q1 Q2Q4 Q3 Q4 Q3Q2Q1 Q4104
106
108
110
112
114
Note: The Backing Ratio is the ratio of Backing Assets to the Monetary Base. Under the arrangements for transferring assets between the backing portfolio and the investment portfolio of the Exchange Fund, when the backing ratio reaches 112.5% (the upper trigger level), sufficient assets will be transferred from the backing portfolio to the investment portfolio to reduce the ratio to 110%. Should the backing ratio drop to 105% (the lower trigger level), assets will be transferred from the investment portfolio to the backing portfolio to restore the ratio to 107.5%.
Source: HKMA.
Upper trigger level
Lower trigger level
Backing Ratio
3.2 Monetary Base and the Backing Ratio
The Monetary Base expanded notably between late
September and November, first as a result of a transitory
increase in the Certificates of Indebtedness (CIs) and
subsequently because of rises in the Aggregate Balance.
In late September, as customers withdrew deposits amid a
mini-run on a local bank, demand for legal tender notes
and coins increased. This, coupled with the effects of
month-end and a long holiday for Mainland visitors,
caused a temporary surge in the CIs. In late October and
November, the Aggregate Balance rose markedly on the
back of foreign exchange operations conducted by the
HKMA and the frequent triggering of the strong-side CU.
Reflecting the combined effects of the increase in the
Monetary Base and valuation losses associated with the
strengthening of the Hong Kong dollar against the US
dollar, the Backing Ratio generally decreased after
reaching 111.88% on 21 September (Chart 3.9). The
Backing ratio closed at 109.99% on 28 November and it
has not surpassed the upper trigger level of 112.5% since
22 January 2008.
3.3 Money, credit and monetary conditions
After peaking at the end of October 2007, Hong Kong
dollar M3 broadly declined between November 2007 and
August 2008 (Chart 3.10). As a result, the year-on-year
growth rates of the broad money trended downward and
the quarter-on-quarter growth rates turned negative. The
contraction in broad money was due partly to a reversal
of exceptional credit demand associated with vibrant IPO
activities in 2007. A portfolio shift from Hong Kong
dollar deposits to foreign currency deposits, notably the
renminbi, also partially constrained the money creation
process in local currency. Indeed, Hong Kong dollar
deposits accounted for 50.3% of total deposits at the end
of August this year, down from 52.4% at the end of
December 2007.
Hong Kong dollar broad money rebounded somewhat in
September when stress in the local interbank credit
market began to intensify. Analysed by the asset-side
counterparts of Hong Kong dollar M3, the rebound was
mainly due to a rise in the net foreign currency assets.

Monetary and financial sector
HALF-YEARLY MONETARY AND FINANCIAL STABILITY REPORT DECEMBER 200854
This suggests some inflow of funds into Hong Kong
dollars, consistent with the strengthening of the
currency and reports of repatriation of funds. Hong
Kong dollar time deposits also expanded markedly
during that month, partly supported by modest increases
in time deposit interest rates in the second half of
September. In view of the dislocation in the local
wholesale funding market, some banks tried to secure
more stable and longer-term funding by raising their
time deposit interest rates for retail customers. In
October, Hong Kong dollar M3 continued to edge up,
possibly reflecting repatriation of funds from overseas.
The year-on-year growth rates of seasonally-adjusted
Hong Kong dollar M1 declined between January and
October 2008, partly because of weaker transaction
demand alongside an economic slowdown. Legal tender
notes and coins in circulation, where those held by the
non-bank public constituting a component of the narrow
money, posted a marked monthly increase in September,
as a mini-run on a local bank and a long holiday for
Mainland visitors raised the demand for physical
currency.
Local monetary conditions tightened in the latter part of
2008, as indicated by a sharp rebound in the monetary
conditions index (MCI) (Chart 3.11). The tightening was
due to a higher real interest rate in Hong Kong and the
appreciation of both the Hong Kong dollar and the
renminbi real effective exchange rate indices.
While year-on-year growth in loans for use in Hong Kong
remained firm before September, loan growth slowed
visibly afterwards, attributable to the economic
downturn, a weak stock market and the dislocated
interbank funding market. Loans for use in Hong Kong
grew by 9.1% year on year in September and 2.9% in
October, compared with double digit growth in the
previous 12 months (Chart 3.12). Analysed by economic
use, trade financing loans declined by 2.9% in the third
quarter of 2008, on the back of shrinking trade flows. It
was the first time this figure had declined since the
second quarter of 2007. Growth in property-related
loans also decelerated. This partly reflected a quiet
property market amid weaker economic activity. As
Hong Kong dollar loans increased at a slower rate than
deposits in September, the Hong Kong dollar loan-to-
Chart 3.11 Monetary conditions index
%
2005 20082006 2007
Note: MCI is a weighted sum of the real interest rate and the four-quarter changes in the Hong Kong dollar and renminbi REERs.
Sources: HKMA and staff estimates.
-6
-4
-2
0
2
4
6
8
MCI Real interest ratecontribution
HKD REER contribution
RMB REERcontribution
Chart 3.12 Loans for use in Hong Kong andnominal GDP
% yoy
2005 20082006 2007
Sources: HKMA and C&SD.
Loans for use in Hong Kong
Nominal GDP
-10
-5
0
5
10
15
20
25
30

Monetary and financial sector
55HALF-YEARLY MONETARY AND FINANCIAL STABILITY REPORT DECEMBER 2008
deposit ratio decreased by 2.4 percentage points to 81.4%
at the end of September – the first decrease in the ratio
since the beginning of 2008.
Recent evidence also suggests that stress in the interbank
credit market appears to have spread to the retail level,
negatively affecting household and corporate borrowers.
Despite a 25-basis-point reduction in the BLRs in early
November, banks kept their BLRs unchanged when the
US Fed cut its target rate by 50 basis points each on 8 and
29 October. Mortgage interest rates for newly approved
loans also increased slightly. In addition, anecdotal
evidence reveals that lending to SMEs was particularly
affected.
3.4 Balance of Payments
Latest Balance of Payments (BoP) statistics showed an
expansion in reserve assets for the twelfth consecutive
quarter. The rise in reserve assets was due to investment
incomes from foreign currency reserve assets as well as
purchases of US dollars by the HKMA.
The current account remained in surplus in the first half
of 2008, as the persistent surpluses in service trade
exceeded the widened deficits in merchandise trade
(Chart 3.13 and Table 3.A). The service trade surpluses
were mainly due to trade-related services, while the
positive contribution of net exports of financial services
shrank in the second quarter due to a tumbling stock
market.
The non-reserve financial account recorded net outflows
in the second quarter of 2008, after registering net
inflows in the previous quarter (Table 3.A). The portfolio
investment account recorded sizable net outflows of
almost 40% of nominal GDP in the first half of 2008,
partly because non-residents reduced their holdings of
Hong Kong debt securities. The “other investment”
account saw a strong increase in net inflows (about 40%
of nominal GDP) after significant net outflows in the
second half of 2007. The significant net inflows in the
“other investment” account in the first half of 2008
reflected decreases in overseas deposits as well as
reductions in overseas borrowing of the local non-bank
sector.
Table 3.ABalance of Payments Account by standardcomponents
2006 2007 2007 2008
In per cent of GDP Q3 Q4 Q1 Q2
Current Account 12.1 13.5 15.8 14.1 12.6 8.6Capital and Financial Account -14.2 -15.5 -19.4 -17.0 -8.2 -5.1
Capital transfers -0.2 0.7 1.7 0.2 0.6 0.5Financial non-reserve assets -10.9 -9.1 -17.7 0.2 4.5 -3.0(net change)Direct investment 0 3.2 5.4 1.1 13.7 -19.8Portfolio investment -14.1 2.3 2.9 8.6 -45.6 5.9Financial derivatives 1.8 3.6 3.0 0.8 2.6 2.9Other investment 1.4 -18.2 -29.0 -10.4 33.8 8.1
Reserve assets (net change) 3.2 7.1 3.4 17.4 13.4 2.5Net errors and omissions 2.2 2.0 3.6 2.8 -4.4 -3.5Source: C&SD.
Chart 3.13 Contributions to Current Accountsurplus
% of nominal GDP
2006 2007 20082005
Source: C&SD.
GoodsInvestment income
ServicesCurrent transfers
Current Account
-20
-10
0
10
20
30
40

Monetary and financial sector
HALF-YEARLY MONETARY AND FINANCIAL STABILITY REPORT DECEMBER 200856
Banking sector performance
The profitability of retail banks remained healthy despite declining during the assessment
period because of lower interest and non-interest income and a rise in provisions for loans
and investment portfolios. Capitalisation was strong and liquidity was structurally resilient.
Interbank liquidity tightened sharply in mid-September, feeding through from the effects of
the US and European markets, but the situation improved following various pre-emptive
measures taken by the Government and the HKMA. While there were signs of deterioration
in the credit risk to corporate lending, the systemic risk to the banking sector appeared to be
contained. However, as uncertainty has increased and the business environment
deteriorated, banks might seek to protect their balance sheets through tightening credit, which
could adversely affect the economy and, in turn, their own asset quality.
3.5 Profitability and capitalisation
ProfitabilityThe profitability of retail banks, measured by pre-tax
operating profit as a percentage of total assets, continued
to fall in the six-month assessment period20 to September
2008 (Chart 3.14). However, it still remains at a healthy
level. Decreases in net interest income and non-interest
income, together with significant rises in provisions for
bad and doubtful debts and for investment securities
amid the sub-prime crisis, exerted downward pressure on
the banks’ profitability.
20 Unless otherwise stated, the assessment period in this Chapter refersto the six-month period from the end of March 2008 to the end ofSeptember 2008.
Chart 3.14 Profitability of retail banks
% of total assets % of total assets
200820032002 200620052004
General and administrative expenses (lhs)Net charges for provisions (lhs)Non-interest income (lhs)Net interest income (lhs)Pre-tax operating profit (rhs)
Note: Figures for 2008 are annualised figures up to 2008 Q3.
Source: HKMA.
2007-2
-1
0
1
2
3
1.00
1.75
1.25
1.50
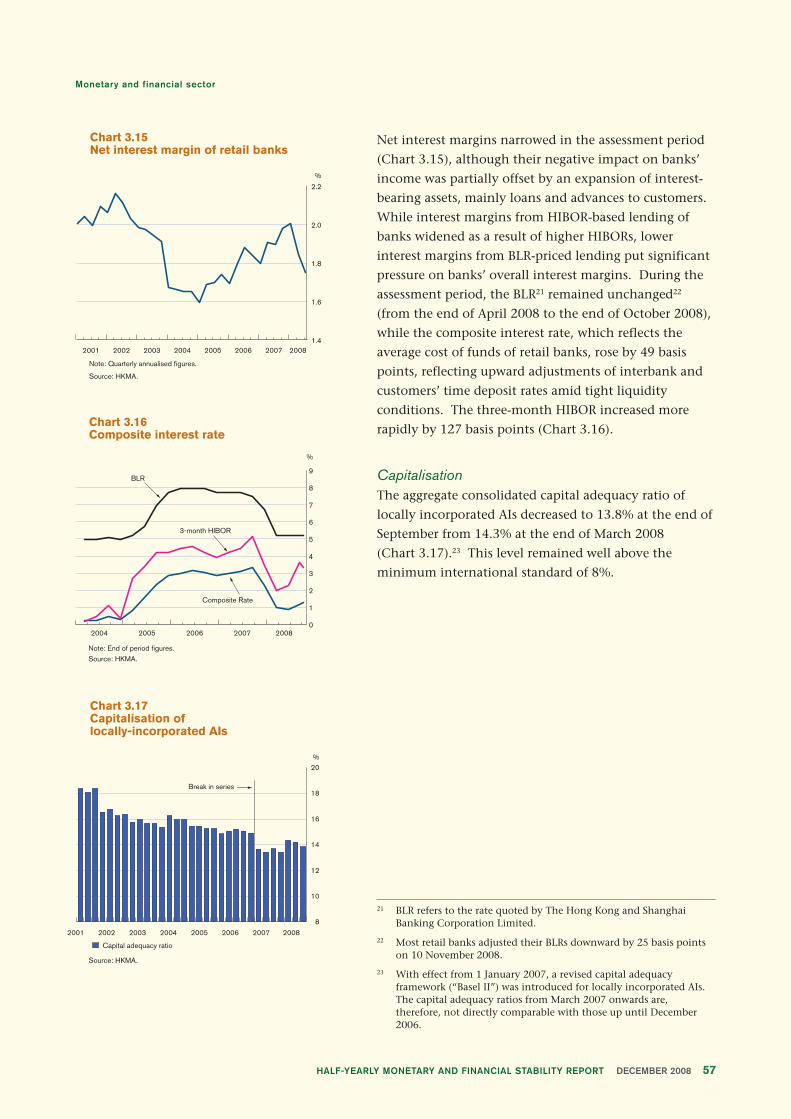
Monetary and financial sector
57HALF-YEARLY MONETARY AND FINANCIAL STABILITY REPORT DECEMBER 2008
Net interest margins narrowed in the assessment period
(Chart 3.15), although their negative impact on banks’
income was partially offset by an expansion of interest-
bearing assets, mainly loans and advances to customers.
While interest margins from HIBOR-based lending of
banks widened as a result of higher HIBORs, lower
interest margins from BLR-priced lending put significant
pressure on banks’ overall interest margins. During the
assessment period, the BLR21 remained unchanged22
(from the end of April 2008 to the end of October 2008),
while the composite interest rate, which reflects the
average cost of funds of retail banks, rose by 49 basis
points, reflecting upward adjustments of interbank and
customers’ time deposit rates amid tight liquidity
conditions. The three-month HIBOR increased more
rapidly by 127 basis points (Chart 3.16).
CapitalisationThe aggregate consolidated capital adequacy ratio of
locally incorporated AIs decreased to 13.8% at the end of
September from 14.3% at the end of March 2008
(Chart 3.17).23 This level remained well above the
minimum international standard of 8%.
21 BLR refers to the rate quoted by The Hong Kong and ShanghaiBanking Corporation Limited.
22 Most retail banks adjusted their BLRs downward by 25 basis pointson 10 November 2008.
23 With effect from 1 January 2007, a revised capital adequacyframework (“Basel II”) was introduced for locally incorporated AIs.The capital adequacy ratios from March 2007 onwards are,therefore, not directly comparable with those up until December2006.
Chart 3.15Net interest margin of retail banks
%
2001 2002 2003 2007 200820062004 20051.4
1.6
1.8
2.0
2.2
Note: Quarterly annualised figures.
Source: HKMA.
Chart 3.16Composite interest rate
Note: End of period figures.Source: HKMA.
0
1
2
3
4
5
6
7
8
9
2004 2005 2006 2007 2008
%
BLR
3-month HIBOR
Composite Rate
Chart 3.17 Capitalisation oflocally-incorporated AIs
Source: HKMA.
Capital adequacy ratio
8
10
12
14
16
18
20
2001 2002 2003 2004 2005 2006 2007 2008
%
Break in series
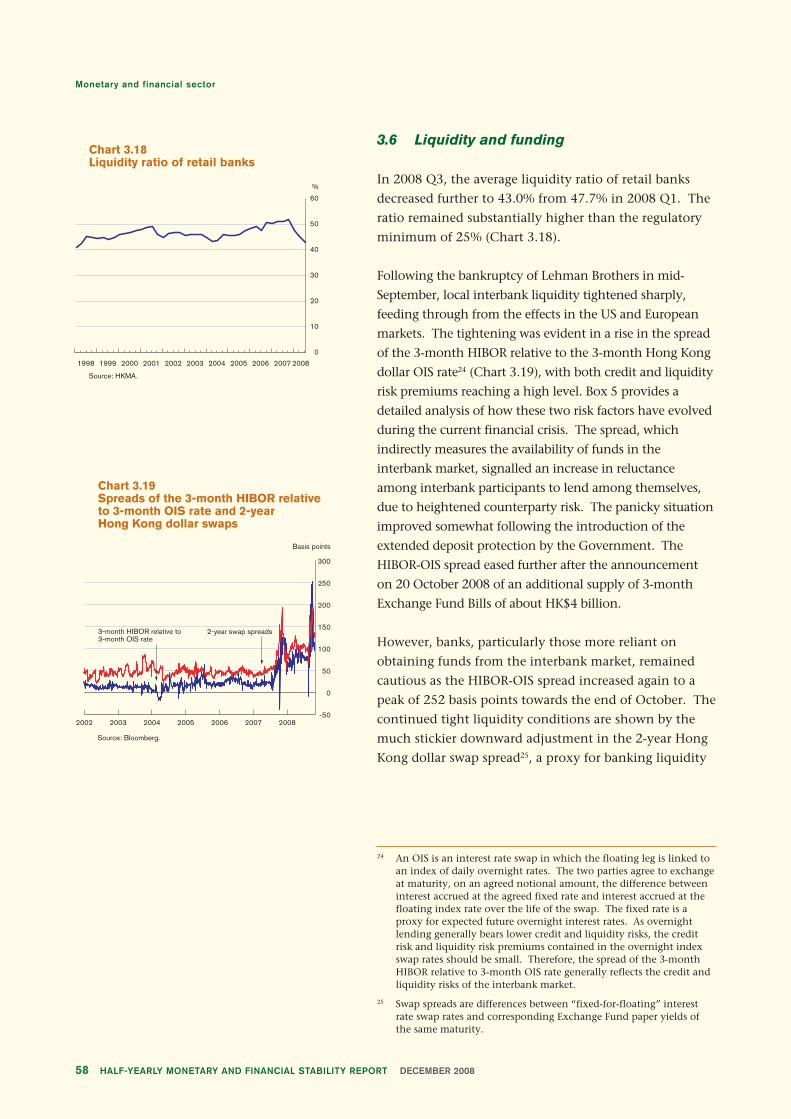
Monetary and financial sector
HALF-YEARLY MONETARY AND FINANCIAL STABILITY REPORT DECEMBER 200858
3.6 Liquidity and funding
In 2008 Q3, the average liquidity ratio of retail banks
decreased further to 43.0% from 47.7% in 2008 Q1. The
ratio remained substantially higher than the regulatory
minimum of 25% (Chart 3.18).
Following the bankruptcy of Lehman Brothers in mid-
September, local interbank liquidity tightened sharply,
feeding through from the effects in the US and European
markets. The tightening was evident in a rise in the spread
of the 3-month HIBOR relative to the 3-month Hong Kong
dollar OIS rate24 (Chart 3.19), with both credit and liquidity
risk premiums reaching a high level. Box 5 provides a
detailed analysis of how these two risk factors have evolved
during the current financial crisis. The spread, which
indirectly measures the availability of funds in the
interbank market, signalled an increase in reluctance
among interbank participants to lend among themselves,
due to heightened counterparty risk. The panicky situation
improved somewhat following the introduction of the
extended deposit protection by the Government. The
HIBOR-OIS spread eased further after the announcement
on 20 October 2008 of an additional supply of 3-month
Exchange Fund Bills of about HK$4 billion.
However, banks, particularly those more reliant on
obtaining funds from the interbank market, remained
cautious as the HIBOR-OIS spread increased again to a
peak of 252 basis points towards the end of October. The
continued tight liquidity conditions are shown by the
much stickier downward adjustment in the 2-year Hong
Kong dollar swap spread25, a proxy for banking liquidity
24 An OIS is an interest rate swap in which the floating leg is linked toan index of daily overnight rates. The two parties agree to exchangeat maturity, on an agreed notional amount, the difference betweeninterest accrued at the agreed fixed rate and interest accrued at thefloating index rate over the life of the swap. The fixed rate is aproxy for expected future overnight interest rates. As overnightlending generally bears lower credit and liquidity risks, the creditrisk and liquidity risk premiums contained in the overnight indexswap rates should be small. Therefore, the spread of the 3-monthHIBOR relative to 3-month OIS rate generally reflects the credit andliquidity risks of the interbank market.
25 Swap spreads are differences between “fixed-for-floating” interestrate swap rates and corresponding Exchange Fund paper yields ofthe same maturity.
Chart 3.18Liquidity ratio of retail banks
Source: HKMA.
0
10
20
30
40
50
60
1998 1999 2000 2001 2002 2003 2004 2005 2006 20082007
%
Chart 3.19Spreads of the 3-month HIBOR relativeto 3-month OIS rate and 2-yearHong Kong dollar swaps
Source: Bloomberg.
20072003 20042002 2005 2006 2008
Basis points
-50
0
50
100
150
200
250
300
2-year swap spreads3-month HIBOR relative to3-month OIS rate

Monetary and financial sector
59HALF-YEARLY MONETARY AND FINANCIAL STABILITY REPORT DECEMBER 2008
over the medium term (Chart 3.19).26 In other words,
although banks may take some comfort from the recent
government action at the short end of the yield curve,
they are still worried by uncertainty over the availability
of funds at the longer end.27
While counterparty risk rose in interbank markets
globally, the contagion risk arising from interbank
exposures in the domestic market appeared to be
contained. For retail banks as a whole, the amount due
to other AIs in Hong Kong accounted for only 2.2% of
total liabilities by September 2008, while the amount due
from other AIs in Hong Kong contributed just 7.3% of
their total assets.
Other structural factors influencing the long-run
liquidity conditions of the banking sector were fairly
stable in the assessment period. Specifically, customer
deposits, which are more stable than other funding
sources, were still the principal sources of retail banks’
funding and accounted for 76% of total liabilities in
September 2008 (Chart 3.20).
Partly due to more attractive time deposit rates being
offered by banks to improve their own liquidity amid
tight interbank conditions, time deposits registered
increases of 8.5% and 2.3% in 2008 Q3 and Q2
respectively. As a result, the share of time deposits rose
to 57.8% in September from 55.2% in March, whereas
that of savings and demand deposits fell to 34.3% (from
36.1%) and 7.9% (from 8.7%) respectively (Chart 3.21).
Chart 3.20 Liabilities structure of retail banks
Due to banks abroad (rhs)Customer deposits (lhs)
Other liabilities (rhs)Debt securities in issue (rhs)
Note: Debt securities comprise negotiable certificates of deposits and all other negotiable debt instruments.
Source: HKMA.
Due to AIs (rhs)
60
62
64
66
68
70
72
74
76
78
1998 2000 2002 2004 2006 20080
2
4
6
8
10
16
14
12
% of total liabilities % of total liabilities
Chart 3.21Structure of customer deposits of retail banks
Source: HKMA.
Time depositsSavings depositsDemand deposits
0
20
40
60
80
100
2000 2001 2002 2003 2004 2005 2006 2007 2008
% of customer deposits
26 The determinants of variations in the Hong Kong dollar swapspreads are investigated in Hui and Lam (2008), “What Drives HongKong Dollar Swap Spreads: Credit or Liquidity?”, HKMA WorkingPaper 10/2008.
27 Both the HIBOR-OIS spread and the 2-year Hong Kong dollar swapspread narrowed significantly to 94 and 127 basis points respectivelyat the end of November, probably reflecting early signs ofstabilisation in the local wholesale fund market. Nevertheless, thespreads are still higher than their respective levels before the crisis.

Monetary and financial sector
HALF-YEARLY MONETARY AND FINANCIAL STABILITY REPORT DECEMBER 200860
Unlike their US and some European counterparts, retail
banks in Hong Kong generally maintained a negative
“customer funding gap”, with the amount of customer
loans being smaller than the amount of customer
deposits. The gap widened slightly to -38.1% in
September 2008 from -37.7% in March (Chart 3.22),
indicating that there should not be structural weaknesses
in the liquidity structure of retail banks.
At the end of September 2008, the all currencies loan-to-
deposit ratio for the banking sector as a whole increased
to 58.6% from 55.0% in March 2008 and that for retail
banks to 50.1% from 49.4%. However, both ratios
decreased in the third quarter as deposit growth slightly
outpaced loan growth. The Hong Kong dollar loan-to-
deposit ratio also increased to 81.4% for the banking
sector, and to 72.9% for retail banks, from 76.5% and
71.1% respectively (Chart 3.23).
As shown by the current financial turmoil, the liquidity
and default risks of banks can stem from their market
risk. Using a new liquidity stress-testing framework with
interaction between market and credit risks, Box 6
assesses the ability of individual banks in Hong Kong to
weather severe liquidity shocks stemming from a
prolonged period of asset market disruptions. The results
suggest that banks can withstand the liquidity shocks.
However, if such shocks were to coincide with interest
rate increases due to monetary policy tightening, some
banks may be more prone to significant liquidity risk.
Notes:1. Measured as assets less liabilities in the balance sheet categories
shown, as a percentage of total assets.2. “Customers” comprises all non-AI borrowers and depositors.3. Debt securities comprise negotiable certificates of deposits and all
other negotiable debt instruments.
Source: HKMA.
Chart 3.22Retail banks’ funding gaps, by type of funding
Customers Interbank Debt securities
-50
-40
-30
-20
-10
0
10
20
30
1998 1999 2000 2001 2002 2003 2004 2005 2006 2007 2008
% of total assets
Chart 3.23Hong Kong dollar loan-to-deposit ratios
Source: HKMA.
60
65
70
75
80
85
90
95
100
2001 2002 2003 2004 2005 2006 2007 2008
%
Banking sector
Retail banks
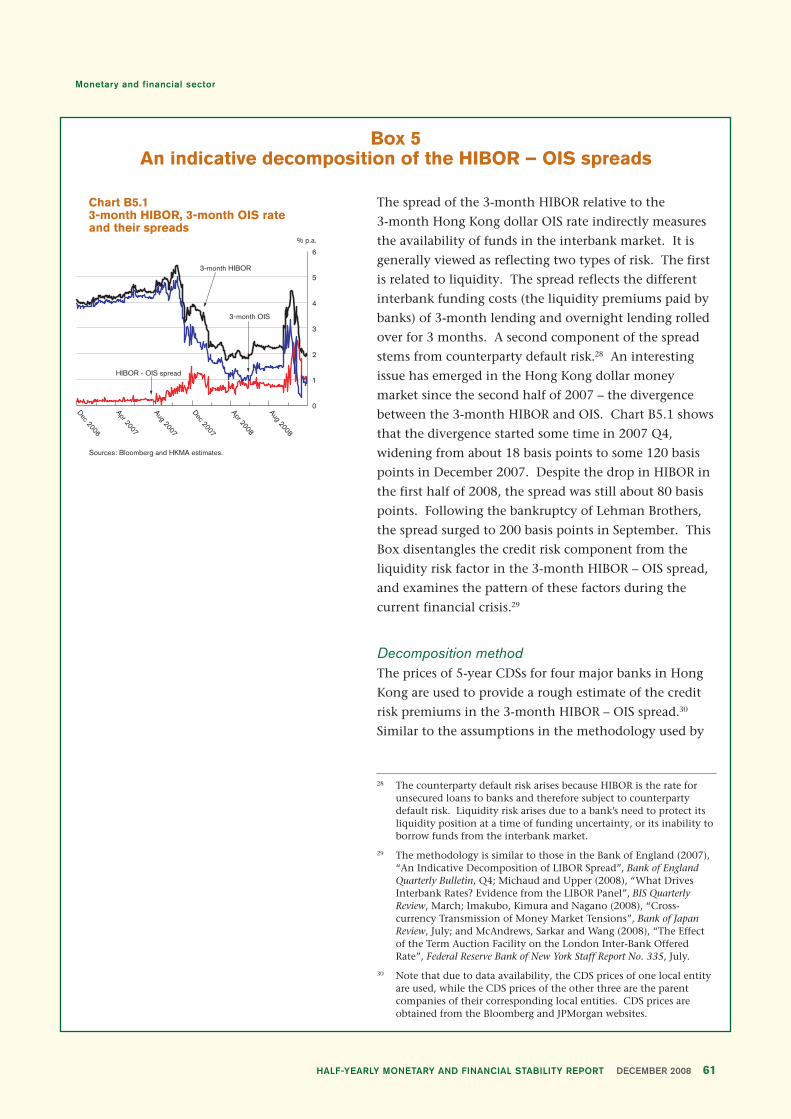
Monetary and financial sector
61HALF-YEARLY MONETARY AND FINANCIAL STABILITY REPORT DECEMBER 2008
Box 5An indicative decomposition of the HIBOR – OIS spreads
The spread of the 3-month HIBOR relative to the
3-month Hong Kong dollar OIS rate indirectly measures
the availability of funds in the interbank market. It is
generally viewed as reflecting two types of risk. The first
is related to liquidity. The spread reflects the different
interbank funding costs (the liquidity premiums paid by
banks) of 3-month lending and overnight lending rolled
over for 3 months. A second component of the spread
stems from counterparty default risk.28 An interesting
issue has emerged in the Hong Kong dollar money
market since the second half of 2007 – the divergence
between the 3-month HIBOR and OIS. Chart B5.1 shows
that the divergence started some time in 2007 Q4,
widening from about 18 basis points to some 120 basis
points in December 2007. Despite the drop in HIBOR in
the first half of 2008, the spread was still about 80 basis
points. Following the bankruptcy of Lehman Brothers,
the spread surged to 200 basis points in September. This
Box disentangles the credit risk component from the
liquidity risk factor in the 3-month HIBOR – OIS spread,
and examines the pattern of these factors during the
current financial crisis.29
Decomposition methodThe prices of 5-year CDSs for four major banks in Hong
Kong are used to provide a rough estimate of the credit
risk premiums in the 3-month HIBOR – OIS spread.30
Similar to the assumptions in the methodology used by
28 The counterparty default risk arises because HIBOR is the rate forunsecured loans to banks and therefore subject to counterpartydefault risk. Liquidity risk arises due to a bank’s need to protect itsliquidity position at a time of funding uncertainty, or its inability toborrow funds from the interbank market.
29 The methodology is similar to those in the Bank of England (2007),“An Indicative Decomposition of LIBOR Spread”, Bank of EnglandQuarterly Bulletin, Q4; Michaud and Upper (2008), “What DrivesInterbank Rates? Evidence from the LIBOR Panel”, BIS QuarterlyReview, March; Imakubo, Kimura and Nagano (2008), “Cross-currency Transmission of Money Market Tensions”, Bank of JapanReview, July; and McAndrews, Sarkar and Wang (2008), “The Effectof the Term Auction Facility on the London Inter-Bank OfferedRate”, Federal Reserve Bank of New York Staff Report No. 335, July.
30 Note that due to data availability, the CDS prices of one local entityare used, while the CDS prices of the other three are the parentcompanies of their corresponding local entities. CDS prices areobtained from the Bloomberg and JPMorgan websites.
Chart B5.13-month HIBOR, 3-month OIS rate and their spreads
0
1
2
3
4
5
6
% p.a.
Sources: Bloomberg and HKMA estimates.
3-month HIBOR
HIBOR - OIS spread
3-month OIS
Dec 2006
Apr 2007
Aug 2007
Dec 2007
Apr 2008
Aug 2008

Monetary and financial sector
HALF-YEARLY MONETARY AND FINANCIAL STABILITY REPORT DECEMBER 200862
the Bank of England (2007), any difference between the
interbank rate – OIS spread and the estimated credit risk
premiums corresponds to the liquidity risk factor in the
interbank market.31
To infer the credit premium from CDS prices, it is
necessary to calculate the market-implied default
probabilities (MIDP) for the underlying securities
embedded in the CDS prices. Such probabilities can be
derived from CDS prices by assuming a specific recovery
rate. Following Gapen et al (2008), the MIDP can be
obtained through the equation as follows: 32
1–exp(–S*t)MIDP =
1–R
where S is the CDS price, t is the time horizon (which is
equal to 5) and R is the recovery rate (assumed to be
constant at 40% in this analysis). As the MIDP derived is
the cumulative default probability for a 5-year horizon, it
is converted into a 3-month horizon using the formula
1 – (1 – MIDP)1/20. The credit premium (CP) can then be
inferred from the annualised 3-month implied default
probability (IDP3) by the following equation: 33
In [(1– R)*exp(– IDP3*(1/4))+R]CP = _
(1/4)
Once the credit premium for each of the four banks is
derived, a simple average of these estimated credit
premiums is taken as the credit premium in the 3-month
HIBOR – OIS spread. The residual of the spread is
assumed to be the non-credit (liquidity) premium.
31 The assumption suggests that the credit and liquidity risks areentirely independent. However, there is an issue concerning thepotentially positive correlation between the credit and liquidityfactors. In addition, the CDS prices may not purely reflect the creditrisk of the entities. Liquidity issues may also factor into these CDSprices due to the possibly illiquid CDS markets. Therefore, theresults should be regarded as an indicative decomposition of thecredit and liquidity factors.
32 See Gapen, Gray, Lim and Xiao (2008), “Measuring and AnalyzingSovereign Risk with Contingent Claims”, IMF Staff Papers, Vol. 55,No. 1.
33 See Manning (2004), “Exploring the Relationship between CreditSpreads and Default Probabilities”, Bank of England Working Paper No.225.
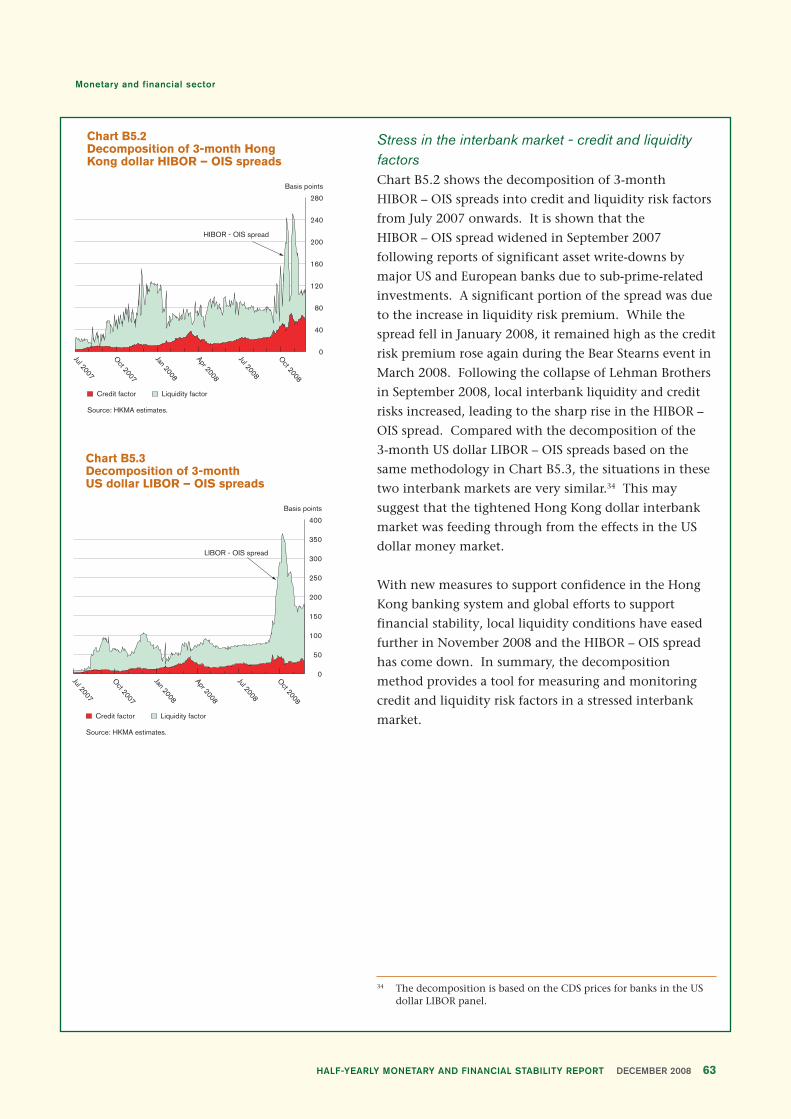
Monetary and financial sector
63HALF-YEARLY MONETARY AND FINANCIAL STABILITY REPORT DECEMBER 2008
Stress in the interbank market - credit and liquidityfactorsChart B5.2 shows the decomposition of 3-month
HIBOR – OIS spreads into credit and liquidity risk factors
from July 2007 onwards. It is shown that the
HIBOR – OIS spread widened in September 2007
following reports of significant asset write-downs by
major US and European banks due to sub-prime-related
investments. A significant portion of the spread was due
to the increase in liquidity risk premium. While the
spread fell in January 2008, it remained high as the credit
risk premium rose again during the Bear Stearns event in
March 2008. Following the collapse of Lehman Brothers
in September 2008, local interbank liquidity and credit
risks increased, leading to the sharp rise in the HIBOR –
OIS spread. Compared with the decomposition of the
3-month US dollar LIBOR – OIS spreads based on the
same methodology in Chart B5.3, the situations in these
two interbank markets are very similar.34 This may
suggest that the tightened Hong Kong dollar interbank
market was feeding through from the effects in the US
dollar money market.
With new measures to support confidence in the Hong
Kong banking system and global efforts to support
financial stability, local liquidity conditions have eased
further in November 2008 and the HIBOR – OIS spread
has come down. In summary, the decomposition
method provides a tool for measuring and monitoring
credit and liquidity risk factors in a stressed interbank
market.
34 The decomposition is based on the CDS prices for banks in the USdollar LIBOR panel.
Chart B5.2Decomposition of 3-month HongKong dollar HIBOR – OIS spreads
0
80
40
120
160
200
240
280
Basis points
Source: HKMA estimates.
Jul 2007
Oct 2007
Jan 2008
Apr 2008
Jul 2008
Oct 2008
HIBOR - OIS spread
Credit factor Liquidity factor
Chart B5.3Decomposition of 3-month US dollar LIBOR – OIS spreads
0
400
Basis points
50
100
150
200
250
300
350
LIBOR - OIS spread
Source: HKMA estimates.
Jul 2007
Oct 2007
Jan 2008
Apr 2008
Jul 2008
Oct 2008
Credit factor Liquidity factor
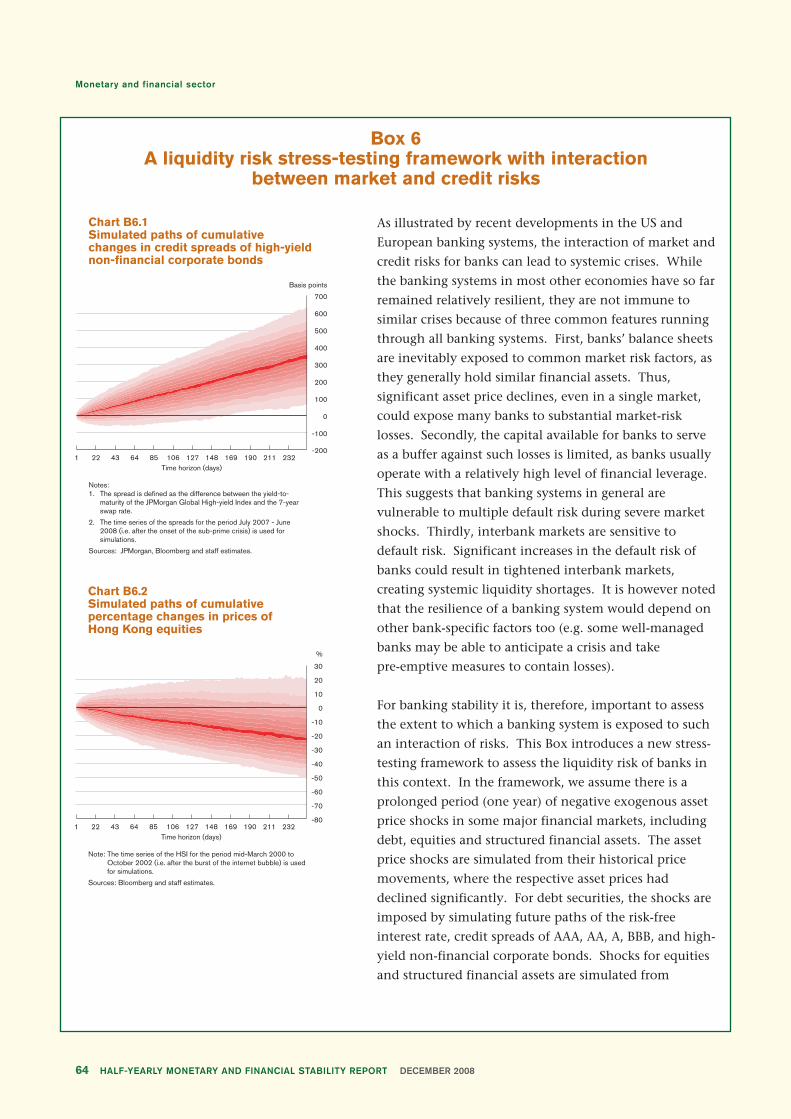
Monetary and financial sector
HALF-YEARLY MONETARY AND FINANCIAL STABILITY REPORT DECEMBER 200864
Box 6A liquidity risk stress-testing framework with interaction
between market and credit risks
As illustrated by recent developments in the US and
European banking systems, the interaction of market and
credit risks for banks can lead to systemic crises. While
the banking systems in most other economies have so far
remained relatively resilient, they are not immune to
similar crises because of three common features running
through all banking systems. First, banks’ balance sheets
are inevitably exposed to common market risk factors, as
they generally hold similar financial assets. Thus,
significant asset price declines, even in a single market,
could expose many banks to substantial market-risk
losses. Secondly, the capital available for banks to serve
as a buffer against such losses is limited, as banks usually
operate with a relatively high level of financial leverage.
This suggests that banking systems in general are
vulnerable to multiple default risk during severe market
shocks. Thirdly, interbank markets are sensitive to
default risk. Significant increases in the default risk of
banks could result in tightened interbank markets,
creating systemic liquidity shortages. It is however noted
that the resilience of a banking system would depend on
other bank-specific factors too (e.g. some well-managed
banks may be able to anticipate a crisis and take
pre-emptive measures to contain losses).
For banking stability it is, therefore, important to assess
the extent to which a banking system is exposed to such
an interaction of risks. This Box introduces a new stress-
testing framework to assess the liquidity risk of banks in
this context. In the framework, we assume there is a
prolonged period (one year) of negative exogenous asset
price shocks in some major financial markets, including
debt, equities and structured financial assets. The asset
price shocks are simulated from their historical price
movements, where the respective asset prices had
declined significantly. For debt securities, the shocks are
imposed by simulating future paths of the risk-free
interest rate, credit spreads of AAA, AA, A, BBB, and high-
yield non-financial corporate bonds. Shocks for equities
and structured financial assets are simulated from
Chart B6.1Simulated paths of cumulativechanges in credit spreads of high-yieldnon-financial corporate bonds
Basis points
1 22 43 64 85 106 127 148 169 190 211 232
Notes:1. The spread is defined as the difference between the yield-to-
maturity of the JPMorgan Global High-yield Index and the 7-year swap rate.
2. The time series of the spreads for the period July 2007 - June 2008 (i.e. after the onset of the sub-prime crisis) is used for simulations.
Sources: JPMorgan, Bloomberg and staff estimates.
-200
-100
0
100
200
300
400
500
600
700
Time horizon (days)
Chart B6.2Simulated paths of cumulativepercentage changes in prices ofHong Kong equities
%
1 22 43 64 85 106 127 148 169 190 211 232
Note: The time series of the HSI for the period mid-March 2000 to October 2002 (i.e. after the burst of the internet bubble) is used for simulations.
Sources: Bloomberg and staff estimates.
Time horizon (days)
-80
-70
-60
-50
-40
-30
-20
-10
0
10
20
30
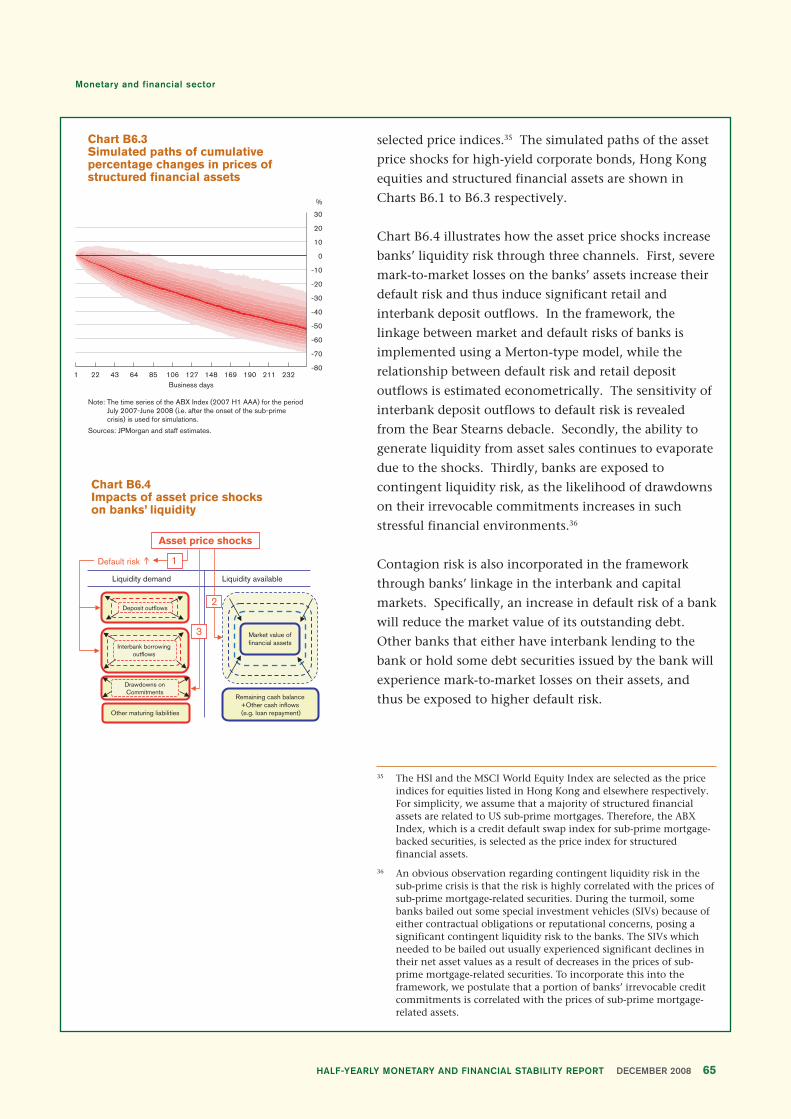
Monetary and financial sector
65HALF-YEARLY MONETARY AND FINANCIAL STABILITY REPORT DECEMBER 2008
selected price indices.35 The simulated paths of the asset
price shocks for high-yield corporate bonds, Hong Kong
equities and structured financial assets are shown in
Charts B6.1 to B6.3 respectively.
Chart B6.4 illustrates how the asset price shocks increase
banks’ liquidity risk through three channels. First, severe
mark-to-market losses on the banks’ assets increase their
default risk and thus induce significant retail and
interbank deposit outflows. In the framework, the
linkage between market and default risks of banks is
implemented using a Merton-type model, while the
relationship between default risk and retail deposit
outflows is estimated econometrically. The sensitivity of
interbank deposit outflows to default risk is revealed
from the Bear Stearns debacle. Secondly, the ability to
generate liquidity from asset sales continues to evaporate
due to the shocks. Thirdly, banks are exposed to
contingent liquidity risk, as the likelihood of drawdowns
on their irrevocable commitments increases in such
stressful financial environments.36
Contagion risk is also incorporated in the framework
through banks’ linkage in the interbank and capital
markets. Specifically, an increase in default risk of a bank
will reduce the market value of its outstanding debt.
Other banks that either have interbank lending to the
bank or hold some debt securities issued by the bank will
experience mark-to-market losses on their assets, and
thus be exposed to higher default risk.
35 The HSI and the MSCI World Equity Index are selected as the priceindices for equities listed in Hong Kong and elsewhere respectively.For simplicity, we assume that a majority of structured financialassets are related to US sub-prime mortgages. Therefore, the ABXIndex, which is a credit default swap index for sub-prime mortgage-backed securities, is selected as the price index for structuredfinancial assets.
36 An obvious observation regarding contingent liquidity risk in thesub-prime crisis is that the risk is highly correlated with the prices ofsub-prime mortgage-related securities. During the turmoil, somebanks bailed out some special investment vehicles (SIVs) because ofeither contractual obligations or reputational concerns, posing asignificant contingent liquidity risk to the banks. The SIVs whichneeded to be bailed out usually experienced significant declines intheir net asset values as a result of decreases in the prices of sub-prime mortgage-related securities. To incorporate this into theframework, we postulate that a portion of banks’ irrevocable creditcommitments is correlated with the prices of sub-prime mortgage-related assets.
Chart B6.3Simulated paths of cumulativepercentage changes in prices ofstructured financial assets
%
1 22 43 64 85 106 127 148 169 190 211 232
Note: The time series of the ABX Index (2007 H1 AAA) for the period July 2007-June 2008 (i.e. after the onset of the sub-prime crisis) is used for simulations.
Sources: JPMorgan and staff estimates.
Business days
-80
-70
-60
-50
-40
-30
-20
-10
0
10
20
30
Chart B6.4Impacts of asset price shockson banks’ liquidity
Liquidity availableLiquidity demand
Asset price shocks
Deposit outflows
Interbank borrowingoutflows
Other maturing liabilities
Drawdowns onCommitments
1
Remaining cash balance +Other cash inflows (e.g. loan repayment)
Market value offinancial assets
3
2
Default risk

Monetary and financial sector
HALF-YEARLY MONETARY AND FINANCIAL STABILITY REPORT DECEMBER 200866
With this framework, daily cash outflows of individual
banks can be simulated given the exogenous asset price
shocks. For any business day t in the 1-year stress
period37, each bank is assumed to counterbalance the
simulated cash outflows by using the cash available at t
(the sum of operating income arrived at t, the interbank
lending, loans to customers and financial assets matured
at t, and the remaining cash balance at the close of the
previous business day). We assume that all banks cannot
generate additional liquidity by taking more deposits,
and they have to liquidate financial assets to offset cash
outflows if there is a shortfall in cash.
Using the Monte Carlo method, the framework
quantifies liquidity risk of individual banks by estimating
two indicators, the expected first cash shortage time
(FCST) and the expected default time (DT). A bank’s
FCST is defined as the first business day that the bank
fails to meet its liquidity outflows by its cash balance,
and DT is defined as the first business day that the bank
fails to meet its liquidity outflows even after liquidating
all its saleable financial assets. Chart B6.5 shows an
illustrative example of simulations of the FCST and DT,
together with the simulated evolution of other important
variables in the stress period amid the asset price shocks,
including the market value of financial assets, the net
cumulative gap (defined as the net cumulative cash
inflows minus the net cumulative cash outflows) and the
1-year default probability of a bank.
The framework is applied to a group of 12 listed banks in
Hong Kong. Data for the banks’ balance sheets,
including the maturity profile of assets and liabilities,
and the composition of financial assets, are mainly from
their 2007 annual financial reports, except for the banks’
exposures on structured financial assets, which are
supplemented by Fitch (2008).38
Two stress scenarios, A and B, are considered in this
study. The severity of major asset price shocks is
assumed to be the same in these two scenarios, but
Scenario B is more severe than Scenario A in other
37 We assume there are 252 business days in the 1-year stress period.
38 Fitch Ratings (2008), “Banks in Asia excluding Japan: Update onExposure to Sub-prime and Structured Credit Products”.
Chart B6.5An illustrative example for simulationsof the first cash shortage timeand default time
HK$ bn
0 21 42 63 84 105 126
Source: Staff estimates.
147 168 189 210 231 2520
0.1
0.2
0.3
0.4
0.5
0.6
0.7
0.8
0.9
1.0 Net Cumulative gap (lhs) (Net cumulative inflows- Net cumulative outflows)
1-year default probability (rhs)
Market value of financialassets (lhs)
Time horizon (days)
First cashshortagetime
Defaulttime
0

Monetary and financial sector
67HALF-YEARLY MONETARY AND FINANCIAL STABILITY REPORT DECEMBER 2008
assumptions. Scenario A assumes a neutral stance of the
US monetary policy and thus the risk-free interest rate
hovers around the initial level in the stress horizon,
while Scenario B assumes that interest rate hikes occur
due to US monetary policy tightening (Charts B6.6 and
B6.7). In addition, other assumptions, such as the extent
to which the asset price disruptions affect the banks’
operating income, the asset quality of their loan
portfolios, and the likelihood of drawdowns of banks’
irrevocable commitments are more severe in Scenario B.
Details of the assumptions in Scenarios A and B are
presented in Table B6.A.
Based on the two indicators, FCST and DT, the stress-
testing results suggest that the liquidity risk of banks in
Hong Kong would be contained in the face of a
prolonged period of asset price shocks under Scenario A.
However, a few banks would be subject to significant
liquidity risk when such shocks coincided with interest
rate hikes due to monetary tightening (in Scenario B).
Such tightening is, however, relatively unlikely in the
context of the shocks.
Table B6.AAssumptions in stress Scenarios A and B
Assumptions Scenario A Scenario B
Stance of the US Neutral Tighteningmonetary policy
Classified loan ratio Increases by Increases by200 basis points 500 basis points
Returns on assets Decreases by 25% Decreases by 50%
Portion of sub-prime 5% 10%mortgage-relatedirrevocablecommitments
Chart B6.6Simulated paths of cumulativechanges in the risk-free interestrate in Scenario A
Basis points
1 22 43 64 85 106 127 148 169 190 211 232
Note: The time series of the 3-month USD LIBOR for the period August 2006 - July 2007 is used for simulations.
Sources: Bloomberg and staff estimates.
Time horizon (days)
-40
-30
-20
-10
0
10
20
30
Chart B6.7Simulated paths of cumulativechanges in the risk-free interestrate in Scenario B
Basis points
1 22 43 64 85 106 127 148 169 190 211 232
Note: The time series of the 3-month USD LIBOR for the period July 2004 - June 2006 is used for simulations.
Sources: Bloomberg and staff estimates.
Time horizon (days)
0
40
80
120
160
200
240

Monetary and financial sector
HALF-YEARLY MONETARY AND FINANCIAL STABILITY REPORT DECEMBER 200868
3.7 Interest rate risk
A major interest rate risk facing the banking sector is the
basis risk stemming from the relationship between the
BLRs and HIBORs. To some extent, this is an outcome of
fierce competition in the mortgage markets, which leads
to thin interest margins to serve as a buffer against the
basis risk. As the mortgages acquired by banks in the
past year or so were generally priced at BLR minus 2.75%
to 3.00%39, the average effective mortgage rate of banks’
mortgage portfolios may be lowered to less than 2.75%
to 3.00%. The recent surge in the HIBORs could turn the
mortgage portfolios of banks that rely on interbank
funding into loss-making assets. Table 3.B presents the
simulation results of the impact of interest rate increases
on RMLs over the next 12 months. The simulation
incorporates the transmission effect of an increase of 200
basis points in HIBORs on BLRs. The results show that, if
a sudden rise in HIBORs by 200 basis points occurs, the
net interest margin of HIBOR-financed RMLs would be
negative (-22 basis points). Banks that are reliant on
interbank markets to fund their mortgage portfolios
should closely monitor the basis risk.
3.8 Credit risk
The asset quality of retail banks remained healthy during
the six months to September 2008. In the June 2008
Report, we pointed out that some signs had appeared of a
modest deterioration in the credit risk of corporate
lending. This risk appears to have increased since the
previous assessment. The classified loan ratio registered
its first increase since December 2001 to 0.88% in June
2008 from 0.81% in March 2008. The ratio increased
further to 0.96% in September. In addition, the ratio of
overdue and rescheduled loans increased to 0.55% in
September 2008 from 0.53% in June, after decreasing
from 0.57% in March 2008 (Chart 3.24).
Table 3.BSimulated impact on the interest marginof mortgage loans acquired in the lastyear1 & 2
Basis points
Average pricing of mortgage loans acquired in the 280last year
HIBOR-financed loansFunding Cost3 221Current Net Mortgage Margin4 19Estimated Reduction of Mortgage Margin 41Simulated Net Mortgage Margin after Impact -22
Time deposit rate-financed loansFunding Cost3 210Current Net Mortgage Margin4 30Estimated Reduction of Mortgage Margin 4Simulated Net Mortgage Margin after Impact 26
Effective deposit rate-financed loansFunding Cost3 112Current Net Mortgage Margin4 128Estimated Reduction of Mortgage Margin 3Simulated Net Mortgage Margin after Impact 125
Notes:
1. For a detailed description of the model, see “Interest Rate Risk in thePricing of Banks’ Mortgage Lending”, HKMA Research Memorandum05/2005. The simulation is for the 12 months ending October 2009.It is based on the market situation up to end-October 2008, with theuse of monthly average data up to that month.
2. Under the scenario of an increase in 200 basis points in HIBORs.
3. Proxied by the simple average of the composite interest rate of selectedretail banks based on their sources of funds.
4. Current net mortgage margin is derived by subtracting the funding cost aswell as the operating and credit costs from the average mortgage pricing.The operating and credit costs are estimated to be 30 basis points and10 basis points respectively.
39 Recent information up to the end of November 2008 showed thatsome mortgage loans were priced at BLR minus 2.25% to 2.5%.
Chart 3.24 Asset quality of retail banks
0
1
2
3
4
5
6
7
8
2001 2002 2003 2004 2005 2006 2007 2008
% of total loans
Note: Classified loans are those loans graded as “substandard”, “doubtful” or “loss”.
Source: HKMA.
Classified loans (gross)
Overdue and rescheduled loans

Monetary and financial sector
69HALF-YEARLY MONETARY AND FINANCIAL STABILITY REPORT DECEMBER 2008
Domestic lending by AIs grew by 4.7% and 2.7% in the
second and third quarters of 2008 respectively, after
expanding by 6.3% in the first quarter. It appears the
growth momentum slowed somewhat amid a highly
uncertain economic environment. The performance of
loans to different economic sectors varied (Table 3.C).
Property-related loans increased. Credit for building,
construction, property development and investment
increased further by 4.4% and 4.6% in 2008 Q3 and Q2
respectively. Against the backdrop of weakening
property market sentiment, residential mortgage lending
edged up by just 0.7% in 2008 Q3, after increasing by
2.7% in 2008 Q2 (Chart 3.25). The share of property-
related loans in total domestic lending decreased slightly
to 47.4% in September 2008, from 47.9% in the June
2008 Report.
Lending to stockbrokers continued to shrink and
registered decreases of 19.0% and 20.6% in 2008 Q2 and
Q3 respectively, in line with the poor performance of the
local stock market in the assessment period. Despite this,
lending to financial concerns, which mainly comprises
lending to investment companies, continued to grow by
9.5% in 2008 Q3, after expanding by 1.4% in 2008 Q2.
With the higher counterparty risk of financial
institutions amid the current financial crisis, the asset
quality of such loans should warrant closer monitoring.
Among other sectors, loans to the information
technology and manufacturing sectors registered
significant growth, while loans to the transport and
transport equipment sector reversed the decline of 0.1%
in 2008 Q2 and expanded by 6.3% in 2008 Q3. By
contrast, loans to the electricity and gas, and trading
financing sectors decreased in 2008 Q3, after expanding
in 2008 Q2. Credit card lending and loans to the
wholesale and retail trade sector increased marginally in
2008 Q3, having increased in 2008 Q2.
The loan growth along with the benign economic
environment of the previous three quarters appears
difficult to maintain in view of the current turmoil.
With the deteriorating business climate, banks might
tighten credit supply and this may have a negative
impact on economic prospects, as an adverse cycle begins
to develop.
Table 3.CLoans for use in Hong Kong by Als
Quarter-on-quarter % changes Share ofDec Mar Jun Sep total (%)2007 2008 2008 2008 Sep 2008
Loans for use in Hong Kong1 -4.5 6.3 4.7 2.7
Of which:Trade financing 4.1 8.4 15.2 -2.9 7.9Mortgages2 2.2 2.4 2.7 0.7 23.5Manufacturing 1.7 16.1 4.9 4.5 5.5Transport and transport 6.0 5.2 -0.1 6.3 5.8
equipmentElectricity and gas 9.4 -2.1 14.1 -5.4 1.1Information technology -11.7 34.6 8.1 25.6 1.3Building, construction, property 4.2 6.2 4.6 4.4 23.9
development and investmentWholesale and retail trade 2.8 16.6 15.5 0 5.6Financial concerns3 9.5 7.2 1.4 9.5 10.7Stockbrokers -86.4 -4.2 -19.0 -20.6 0.4Credit card advances 8.7 -6.1 1.6 0.4 2.5
Notes:1. Including trade financing loans.2. Mortgage loans include loans for the Home Ownership Scheme, the
Private Sector Participation Scheme and the Tenants Purchase Scheme.3. Loans for financial concerns include loans to investment and insurance
companies, futures brokers and finance companies.
Source: HKMA.
Chart 3.25Outstanding and new mortgage loans of surveyed AIs
Source: Residential Mortgage Survey, HKMA.
250
300
350
400
450
500
550
600HK$ bn
0
5
10
15
20
25
30
35
2001 2002 2003 2004 2005 2006 2007 2008
HK$ bn
Outstanding mortgage loans (lhs)
New mortgage loans (rhs)

Monetary and financial sector
HALF-YEARLY MONETARY AND FINANCIAL STABILITY REPORT DECEMBER 200870
Household exposuresLoans to households40 accounted for 31.4% of total loans
for use in Hong Kong41 in September 2008. The share
has dropped steadily since September 2002.
Loans to households grew by 9.7% year on year in
September 2008, slowing from the 11.2% growth in the
June 2008 Report. This was due mainly to the slower
growth momentum of unsecured household loans.
Reflecting this, credit card lending and other loans for
private purposes grew less rapidly by 4.0% and 19.1%
year on year in September 2008 respectively, compared
with 11.6% and 31.3% respectively in the June 2008
Report. By contrast, mortgage loans grew by 8.2%, which
was slightly higher than that in the last assessment
(Chart 3.26).
The indicators of the vulnerability of household sector
debt have been mixed in the six-month period. The
effective housing capital gearing, defined as the ratio of
market value of total housing stocks to their net asset
value42, edged up to 1.16 in September 2008 from 1.14 in
March, as a result of falls in property prices during the
period (Chart 3.27).
However, the index of debt-servicing ratio for new
mortgage loans43, which serves as an indicator of the debt
burden of mortgagors, decreased further to 44.0 in 2008
Q3 from 48.9 in 2008 Q1 (Chart 3.28). The
improvement in the debt-servicing burden of new
mortgages was mainly due to decreases in the average
mortgage loan amount.
40 Loans to households constitute lending to professional and privateindividuals, excluding those for business purposes. Mortgagelending accounts for a major proportion of loans to households,while the remainder comprises mainly unsecured lending via creditcards and other personal loans for private purposes.
41 Loans for use in Hong Kong include trade financing loans.
42 Defined as the market value subtracted by the outstanding mortgagelending from banks.
43 A higher value of the index of debt-servicing ratio indicates thatthere is either a drop in household incomes, or an increase ininterest rates, or an increase in the average mortgage loan amountdrawn by households. Historical movements in the index suggestthat a sharp rise in the index may lead to deterioration in the assetquality of household debt.
Chart 3.26Annual growth of lending to households by AIs
Loans to households MortgageOther loans for private purposesCredit card
Source: HKMA.
-30
-20
-10
0
10
20
30
40
%
1998 1999 2000 2001 2002 2003 2004 2005 2006 20082007
Chart 3.27Effective housing capital gearing ratio
Source: Staff estimates.
1.0
1.1
1.2
1.3
1.4
1.5
1998 1999 2000 2001 2002 2003 2004 2005 2006 2007 2008
Times
Chart 3.28 Household debt-servicing burden ofnew mortgages
Mortgage delinquency and rescheduled loan ratio (lhs)Index of debt-servicing ratio for new mortgages (1998 Q2=100, rhs)
Source: Staff estimates.
0
0.2
0.4
0.6
0.8
1.0
1.2
1.4
1.6
1.8
1997 1998 1999 2000 2001 2002 2003 2004 2005 2006 2007 2008
% 1998 Q2 = 100
0
10
20
30
40
50
60
70
80
90
100
110
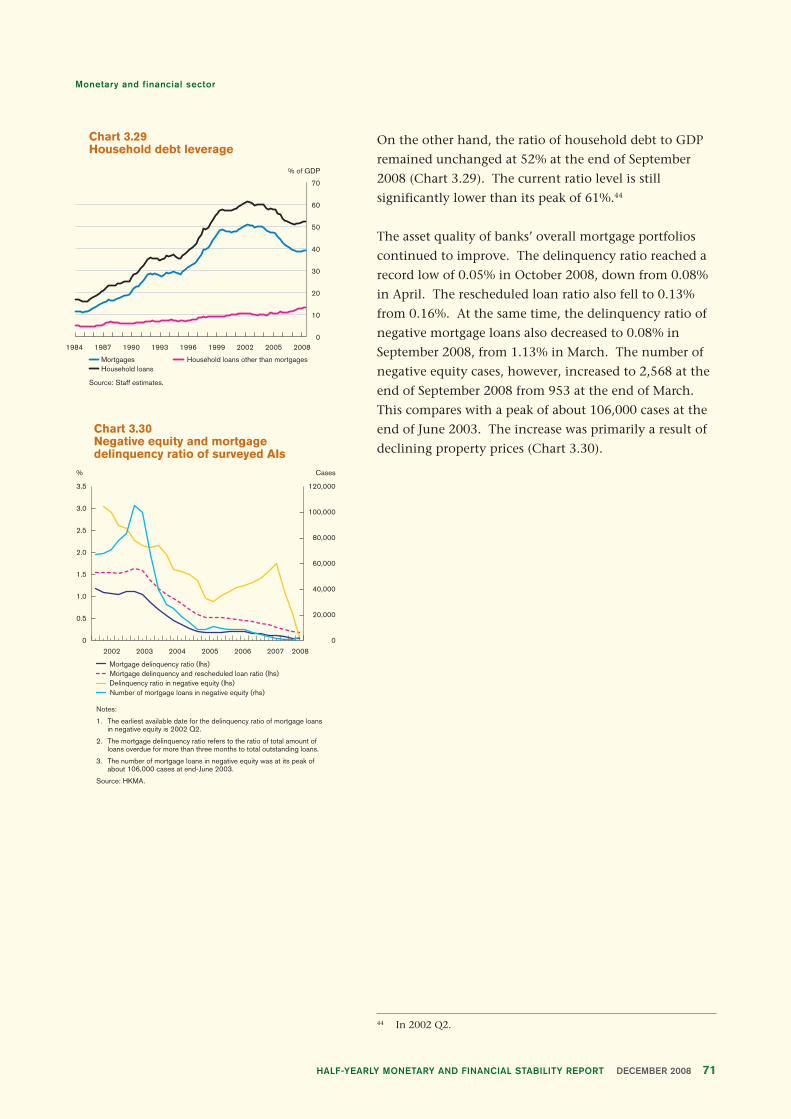
Monetary and financial sector
71HALF-YEARLY MONETARY AND FINANCIAL STABILITY REPORT DECEMBER 2008
On the other hand, the ratio of household debt to GDP
remained unchanged at 52% at the end of September
2008 (Chart 3.29). The current ratio level is still
significantly lower than its peak of 61%.44
The asset quality of banks’ overall mortgage portfolios
continued to improve. The delinquency ratio reached a
record low of 0.05% in October 2008, down from 0.08%
in April. The rescheduled loan ratio also fell to 0.13%
from 0.16%. At the same time, the delinquency ratio of
negative mortgage loans also decreased to 0.08% in
September 2008, from 1.13% in March. The number of
negative equity cases, however, increased to 2,568 at the
end of September 2008 from 953 at the end of March.
This compares with a peak of about 106,000 cases at the
end of June 2003. The increase was primarily a result of
declining property prices (Chart 3.30).
44 In 2002 Q2.
Chart 3.29Household debt leverage
Mortgages Household loans other than mortgages Household loans
Source: Staff estimates.
0
10
20
30
40
50
60
70
1984 1987 1990 1993 1996 1999 2002 2005 2008
% of GDP
Chart 3.30Negative equity and mortgagedelinquency ratio of surveyed AIs
Mortgage delinquency and rescheduled loan ratio (lhs)Mortgage delinquency ratio (lhs)
Number of mortgage loans in negative equity (rhs)Delinquency ratio in negative equity (lhs)
Notes:
1. The earliest available date for the delinquency ratio of mortgage loans in negative equity is 2002 Q2.
2. The mortgage delinquency ratio refers to the ratio of total amount of loans overdue for more than three months to total outstanding loans.
3. The number of mortgage loans in negative equity was at its peak of about 106,000 cases at end-June 2003.
Source: HKMA.
0
0.5
1.0
1.5
2.0
2.5
3.0
3.5
%
0
20,000
40,000
60,000
80,000
100,000
120,000
2002 2003 2004 2005 2006 2007 2008
Cases

Monetary and financial sector
HALF-YEARLY MONETARY AND FINANCIAL STABILITY REPORT DECEMBER 200872
On the asset quality of the credit card portfolio, the
annualised charge-off ratio increased slightly to 2.74% in
2008 Q3 from 2.68% in 2008 Q1 (Chart 3.31). By
contrast, the number of bankruptcy orders made and
petitions presented fell to 8,808 and 9,063 respectively in
the first ten months of 2008, representing decreases of
9.7% and 3.0% compared with the same period last year
(Chart 3.32).
Corporate exposures45
In September 2008, loans to corporations accounted for
68.1% of loans for use in Hong Kong46, and grew less
rapidly by 8.9% year on year in September 2008,
compared with 15.7% growth reported in the June 2008
Report.
With the worsening business climate, various indicators
showed that the credit risk of corporate loans
deteriorated somewhat in the assessment period. The
credit risk of the corporate sector, as shown by statistics
on compulsory winding-up of companies, increased. In
the first ten months of 2008, the number of bankruptcy
petitions presented by companies increased by 5.9%
from the same period last year to 521, while the number
of orders made edged up by 0.8% to 386 (Chart 3.33).
Chart 3.31Charge-off ratio for credit cardreceivables of surveyed AIs
Note: Quarterly annualised figures.
Source: HKMA.
0
2
4
6
8
10
12
14
16
2002 2003 2004 2005 2006 2007 2008
% of total receivables
Chart 3.32Number of bankruptcies
Number of bankruptcy orders madeNumber of bankruptcy petitions
Source: Official Receiver’s Office.
0
1,000
2,000
3,000
4,000
5,000
6,000
7,000
8,000
9,000
10,000
1999 2000 2001 2002 2003 2004 2005 2006 2007 2008
Cases
Chart 3.33Winding-up orders and petitions
Number of winding-up orders madeNumber of petitions
Source: Official Receiver’s Office.
0
50
100
150
200
250
300
350
400
450
500
1999 2000 2001 2002 2003 2004 2005 2006 20082007
Cases
45 Excluding interbank exposures.
46 Loans to corporations comprise loans for use in Hong Kong(including trade financing loans) except lending to professional andprivate individuals.

Monetary and financial sector
73HALF-YEARLY MONETARY AND FINANCIAL STABILITY REPORT DECEMBER 2008
The Altman’s Z-score47, which is a typical credit risk
measure to assess the health of the corporate sector based
on an array of financial ratios reported in companies’
financial statements, indicated that the health of the
non-financial corporate sector in Hong Kong worsened
slightly in 2008 (Chart 3.34).48
At the same time, the aggregate default probability
estimates of the HSI non-financial constituent
companies49 increased to 1.0% in November 2008, from
0.4% in the June 2008 Report (Chart 3.35). The increase
was due mainly to a sharply lower and more volatile
equity market, reflecting a deteriorating credit outlook
for the local corporate sector against the backdrop of a
highly uncertain economic environment. Nevertheless,
compared with the recent peak level of 7.7% following
the bursting of the internet bubble, the current level of
default risk appears to be moderate. The estimates for
individual HSI constituent sectors and the red-chip
constituent stocks broadly follow the same trend.
China exposuresRetail banks’ aggregate exposures to non-bank Chinese
entities increased further to HK$696 billion (9.3% of total
assets) at the end of September 2008, from HK$628 billion
(8.6% of total assets) at the end of March. For the banking
sector as a whole, the total amount of non-bank Chinese
exposures also increased to HK$949 billion (7.9% of total
assets) from HK$890 billion (7.4% of total assets). The
banking sectors’ aggregate exposures to companies and
individuals for purchasing properties in China increased
marginally to HK$12 billion at the end of September
2008.
47 See Altman (2000), “Predicting Financial Distress of Companies:Revisiting the Z-score and ZETA models”, Working Paper, New YorkUniversity. The accounting ratios used to derive the Z-score areworking capital/total assets, retained earnings/total assets, earningsbefore interest and taxes/total assets, market value of equity/bookvalue of total liabilities, and sales/total assets.
48 Non-financial corporations refer to companies listed on the HongKong Main Board and the Growth Enterprise Market, excludingH-share companies, investment companies, and those engaged inbanking, insurance and finance. Data are from Thomson Financial.The 2008 figures are preliminary and cover only a limited numberof companies that had reported their 2008 interim results by thetime of writing. They are subject to revision and should be usedwith caution.
49 Details of the methodology can be found in Yu and Fung (2005),“A Structural Approach to Assessing the Credit Risk of Hong Kong’sCorporate Sector”, HKMA Research Memorandum 24/2005.
Chart 3.34Bankruptcy risk indicators of listednon-financial companies:Altman’s Z-score
Note: A lower Z-score indicates a higher likelihood of a company default.
Source: Staff estimates.
1992 1994 1996 1998 2000 2002 2004 2006 2008
0
1
2
3
4
5
7
675th Percentile
Median
25th Percentile
Source: Staff estimates.
1999 2000 2001 2002 2003 2004 2005 2006 2007 2008
0
1
2
3
4
5
6
7
8
9
10%
Commercial andIndustry sector
Property sector
Utility sector
Internet bubble
HSI red-chipstocks (from 2000)
Aggregate HSI non-financialconstituent companies
Chart 3.35Aggregate default probabilities ofHSI non-financial constituentcompanies
US sub-prime crisis
SARS

Monetary and financial sector
HALF-YEARLY MONETARY AND FINANCIAL STABILITY REPORT DECEMBER 200874
The aggregate default probabilities of the Chinesecorporate sector, which are estimated using equity pricesand financial data of non-financial constituentcompanies of the SSE 180 A-share Index50 & 51, suggestedthat banks in Hong Kong involved in China lending maybe exposed to increasingly high credit risk (Chart 3.36).
Macro stress testing of credit risk 52
Using the macro stress testing framework53, the ability ofthe current Hong Kong banking sector to withstand avariety of macroeconomic shocks is assessed. The shocksinclude reductions in Hong Kong’s real GDP, falls in theMainland real GDP, rises in real interest rates, andreductions in real property prices.54 The assessmentsassume the economic conditions in 2008 Q3 as thecurrent environment, and examine the effect of theseindividual shocks on the credit losses of the bankingsector for a two-year period (up to the end of 2010 Q3).The Monte Carlo simulation method is adopted togenerate the credit loss distribution for each stressscenario. The simulated distributions of credit losses ofthe banking sector for the baseline scenario, whichassumes current economic conditions, and for the fourstressed scenarios with different macroeconomicvariables as the stress origin are presented in Table 3.D.
In the baseline scenario, the expected credit loss rate in2010 Q3 is 0.33% of the total loan portfolios.Introducing the hypothetical shocks substantiallyincreases the expected credit loss rate, which wouldrange from 0.42% (Mainland China GDP shock) to1.19% (Hong Kong GDP shock).
Table 3.DThe mean and VaR statistics of simulatedcredit loss distributions
Stressed scenarios
Property Interest MainlandCredit loss (CL) Baseline GDP price rate China GDP(%)1 scenarios shock2 shock3 shock4 shock5
Mean 0.33 1.19 0.97 0.67 0.42VaR at 90% CL6 0.67 2.02 1.67 1.26 0.85VaR at 95% CL 0.86 2.41 2.04 1.58 1.10VaR at 99% CL 1.38 3.37 2.94 2.43 1.75VaR at 99.9% CL 2.34 4.88 4.47 3.88 2.92VaR at 99.99% CL 3.38 6.56 6.22 5.69 4.86
Notes:
1. Measured as a percentage of the loan portfolios.
2. Reductions in Hong Kong’s real GDP (2005 Chain) by 2.3%, 2.8%, 1.6%,and 1.5% respectively in each of the four consecutive quarters startingfrom 2008 Q4 to 2009 Q3.
3. Reductions in Hong Kong’s real property price by 4.4%, 14.5%, 10.8%,and 16.9% respectively in each of the four consecutive quarters startingfrom 2008 Q4 to 2009 Q3.
4. A rise in real interest rates (HIBORs) by 300 basis points in the firstquarter, followed by no change in the second and third quarters andanother rise of 300 basis points in the fourth quarter.
5. A fall in Mainland China’s real GDP by 3.0% in only the first quarter(i.e. 2008 Q4).
6. CL denotes the confidence level.
Source: Staff estimates.
50 Non-financial corporations refer to all non-financial constituentcompanies (i.e. excluding investment companies and those engagedin banking, insurance and finance) of the SSE 180 A-share Index.The default probabilities are derived from a structural modelproposed by Merton (1974) “On the Pricing of Corporate Debt: TheRisk Structure of Interest Rates”, Journal of Finance Vol. 29, pp. 449-470, in which equity prices, equity volatility, and companiesfinancial liabilities are the determinants of default risk. Details ofthe methodology can be found in Yu and Fung (2005).
51 Following the announcement of the fiscal stimulus package ofRMB4 trillion by the State Council, the aggregate defaultprobabilities of the Chinese corporate sector decreased to around4% at the end of November 2008 from the peak of about 6% at theend of October 2008.
52 Macro stress testing refers to a range of techniques used to assess thevulnerability of a financial system to “exceptional but plausible”macroeconomic shocks.
53 Details of the model specification can be found in Wong et al.(2006), “A Framework for Stress Testing Banks’ Credit Risk,” HKMAResearch Memorandum 15/2006. An updated framework is used forthe current estimations.
54 The shocks are calibrated to be similar to those occurring during theAsian financial crisis. For details, see notes of Table 3.D.
Chart 3.36Aggregate default probabilities of non-financial constituent companiesof the SSE 180 A-share Index
Source: Staff estimates.
2004 20072005 2006 20080
1
2
3
4
7
6
5
8%
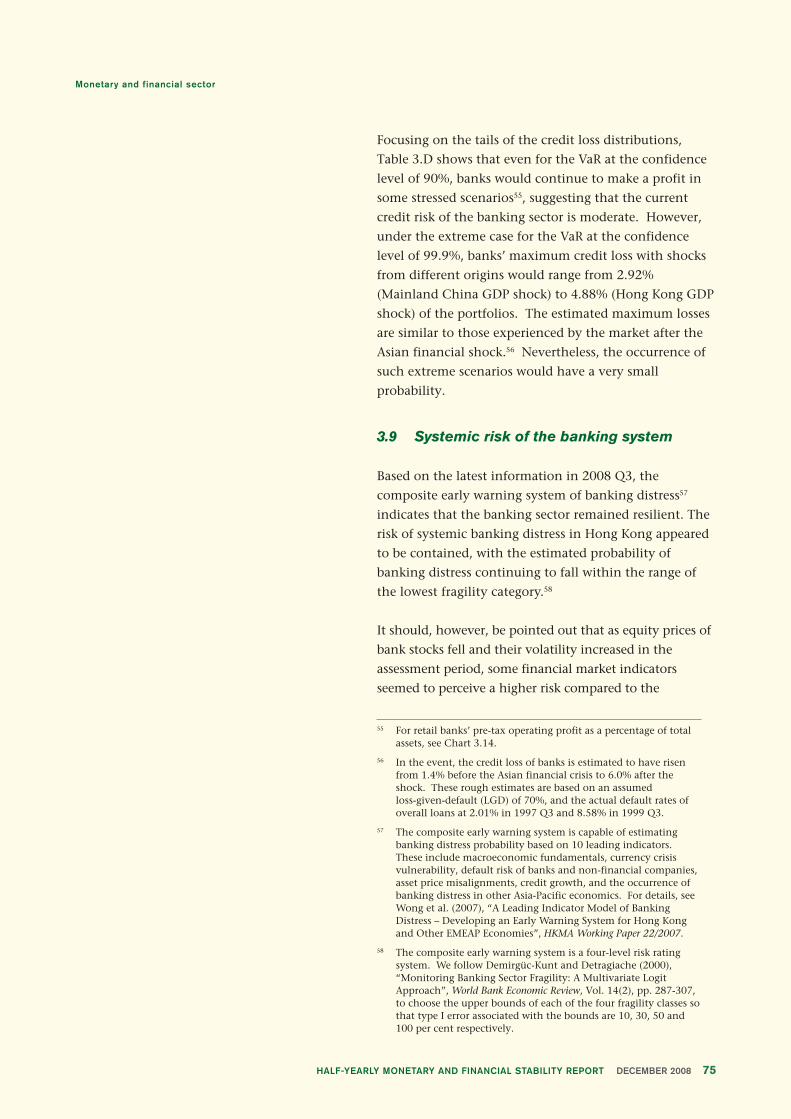
Monetary and financial sector
75HALF-YEARLY MONETARY AND FINANCIAL STABILITY REPORT DECEMBER 2008
Focusing on the tails of the credit loss distributions,
Table 3.D shows that even for the VaR at the confidence
level of 90%, banks would continue to make a profit in
some stressed scenarios55, suggesting that the current
credit risk of the banking sector is moderate. However,
under the extreme case for the VaR at the confidence
level of 99.9%, banks’ maximum credit loss with shocks
from different origins would range from 2.92%
(Mainland China GDP shock) to 4.88% (Hong Kong GDP
shock) of the portfolios. The estimated maximum losses
are similar to those experienced by the market after the
Asian financial shock.56 Nevertheless, the occurrence of
such extreme scenarios would have a very small
probability.
3.9 Systemic risk of the banking system
Based on the latest information in 2008 Q3, the
composite early warning system of banking distress57
indicates that the banking sector remained resilient. The
risk of systemic banking distress in Hong Kong appeared
to be contained, with the estimated probability of
banking distress continuing to fall within the range of
the lowest fragility category.58
It should, however, be pointed out that as equity prices of
bank stocks fell and their volatility increased in the
assessment period, some financial market indicators
seemed to perceive a higher risk compared to the
55 For retail banks’ pre-tax operating profit as a percentage of totalassets, see Chart 3.14.
56 In the event, the credit loss of banks is estimated to have risenfrom 1.4% before the Asian financial crisis to 6.0% after theshock. These rough estimates are based on an assumedloss-given-default (LGD) of 70%, and the actual default rates ofoverall loans at 2.01% in 1997 Q3 and 8.58% in 1999 Q3.
57 The composite early warning system is capable of estimatingbanking distress probability based on 10 leading indicators.These include macroeconomic fundamentals, currency crisisvulnerability, default risk of banks and non-financial companies,asset price misalignments, credit growth, and the occurrence ofbanking distress in other Asia-Pacific economics. For details, seeWong et al. (2007), “A Leading Indicator Model of BankingDistress – Developing an Early Warning System for Hong Kongand Other EMEAP Economies”, HKMA Working Paper 22/2007.
58 The composite early warning system is a four-level risk ratingsystem. We follow Demirgüc-Kunt and Detragiache (2000),“Monitoring Banking Sector Fragility: A Multivariate LogitApproach”, World Bank Economic Review, Vol. 14(2), pp. 287-307,to choose the upper bounds of each of the four fragility classes sothat type I error associated with the bounds are 10, 30, 50 and100 per cent respectively.

Monetary and financial sector
HALF-YEARLY MONETARY AND FINANCIAL STABILITY REPORT DECEMBER 200876
assessment based on the composite early warning
system.59 In particular, the banking distress index60
(January 1998 =100) of banks in Hong Kong, which is
mainly constructed by equity data, increased from about 7
in April 2008 to 25 in September and surged further to
64 at the end of November, reaching a similar level to that
registered following the bursting of the internet bubble
(Chart 3.37). The sharp increase in the index since
September was due mainly to the higher volatility and
co-movements of equity returns of banks both within and
between the Hong Kong and US stock markets, following
the failure of Lehman Brothers (Chart 3.38). Although
this index is a partial indicator compared with the
composite early warning system, its recent sharp spike
does highlight the risk assessment of the banking system
by financial market participants, which probably reflects
the effects of the distressed US and European banking
systems feeding through to the Hong Kong banking
system. Such interdependency was evident in the
tightened interbank liquidity in the US, Europe and Hong
Kong markets during 2008 Q3 (see Section 3.6 above).
The feeding through effect was also reflected in the CDS
market, where CDS spreads of financial institutions in
the US, Europe and Hong Kong increased generally since
mid-September. It should be noted, however, that
compared with their US and European counterparts, the
risk level of individual banks in Hong Kong was still very
moderate (Chart 3.39).
3.10 Foreign currency position
The overall foreign currency position, including both
spot and forward, for all AIs stood at HK$55 billion at the
end of August 2008. The position has been declining
steadily from its record high of HK$98.5 billion at the
end of May 2003.
Key performance indicators of the banking sector are
provided in Table 3.E.
59 Their negative impacts on the composite early warning system,however, were partially offset by improvement in the asset pricemisalignments.
60 The banking distress index was formerly named as the multipledefault risk index of the banking system in Hong Kong in previousreports. For details of the methodology, see Yu et al. (2006),“Assessing the Risk of Multiple Defaults in the Banking System”,HKMA Research Memorandum 06/2006.
Chart 3.37The banking distress index (Jan 1998 = 100)
Source: Staff estimates.
1999 2000 2001 2002 2003 2004 2005 2006 2007 20080
20
40
60
80
100Jan 1998 = 100
Internet bubble
SARS
US sub-prime crisis
Notes:
1. Proportion of variation in changes in daily equity returns explained by the first principal component using a 90-day rolling window.
2. Data to close of business on 28 November 2008.
Source: Staff estimates.
2005 2006 2007 2008
10
20
30
40
50
60
70%
Chart 3.38Co-movement of banks’ equity returns
Hong Kong and US banks
Hong Kong banks
After the failure ofLehman Brothers
Note: Calculated from actively traded CDS spreads of banks. Data to close of business on 28 November 2008.
Source: Bloomberg.
Basis points
Chart 3.39Credit default swap spreads of banksin the US, Europe and Hong Kong
0
500
1,000
1,500
2,000
2,500
3,000
Mid-Sep End-Nov Mid-Sep End-Nov Mid-Sep End-Nov
Maximum
Minimum
25 percentile
Median
75 percentile
US Hong KongEurope

Monetary and financial sector
77HALF-YEARLY MONETARY AND FINANCIAL STABILITY REPORT DECEMBER 2008
Table 3.EKey performance indicators of the banking sector1 (%)
Sep 2007 Jun 2008 Sep 2008
Interest rate1-month HIBOR2 (Quarterly average) 4.62 1.62 2.143-month HIBOR (Quarterly average) 4.64 2.03 2.42BLR3 and 1-month HIBOR spread (Quarterly average) 3.10 3.63 3.11BLR and 3-month HIBOR spread (Quarterly average) 3.08 3.22 2.83Composite interest rate4 3.34 0.85 1.18
Retail banks
Balance sheet developments5
Total deposits 6.7 1.4 4.6Hong Kong dollar 7.6 -2.0 4.2Foreign currency 5.1 6.3 5.2
Total loans 5.4 5.0 2.3Loans to customers inside Hong Kong6 5.2 4.3 2.6Loans to customers outside Hong Kong7 8.7 13.2 -0.3
Negotiable instrumentsNegotiable certificates of deposit issued -11.4 -22.3 -0.9Negotiable debt instruments held 0.2 -2.4r -2.8
Asset quality8
As percentage of total loansPass loans 97.47 97.75 97.61Special mention loans 1.64 1.38 1.43Classified loans9 (gross) 0.89 0.88 0.96Classified loans (net)10 0.67 0.68 0.70Overdue > 3 months and rescheduled loans 0.58 0.53 0.55
ProfitabilityBad debt charge as percentage of average total assets11 0.05r 0.06r 0.16Net interest margin11 1.89r 1.84r 1.75Cost-to-income ratio 40.0r 43.6r 48.2
Liquidity ratio (Quarterly average) 51.0 45.1 43.0
Surveyed institutions
Asset qualityDelinquency ratio of residential mortgage loans 0.13 0.06 0.05Credit card receivables
Delinquency ratio 0.36 0.32 0.31Charge-off ratio - quarterly annualised 3.10 2.78 2.74
- year-to-date annualised 3.10 2.68 2.67
All locally incorporated AIs
Capital adequacy ratio (consolidated) 13.6 14.2 13.8
Notes:
1. Figures related to Hong Kong office(s) only except where otherwise stated.2. With reference to the HKD Interest Settlement Rates released by the Hong Kong Association of Banks.3. With reference to the rate quoted by The Hongkong and Shanghai Banking Corporation Limited.4. The composite interest rate is a weighted average interest rate of all Hong Kong-dollar interest-bearing liabilities, which include deposits from customers,
amounts due to banks, negotiable certificates of deposit and other debt instruments, and Hong Kong-dollar non-interest-bearing demand deposits onthe books of banks. Further details can be found in the HKMA website.
5. Quarterly change.6. Loans for use in Hong Kong plus trade-financing loans.7. Includes “others” (i.e. unallocated).8. Figures related to retail banks’ Hong Kong office(s) and overseas branches.9. Classified loans are those loans graded as “substandard”, “doubtful” or “loss”.10. Net of specific provisions / individual impairment allowances.11. Year-to-date annualised.
r Revised figure.
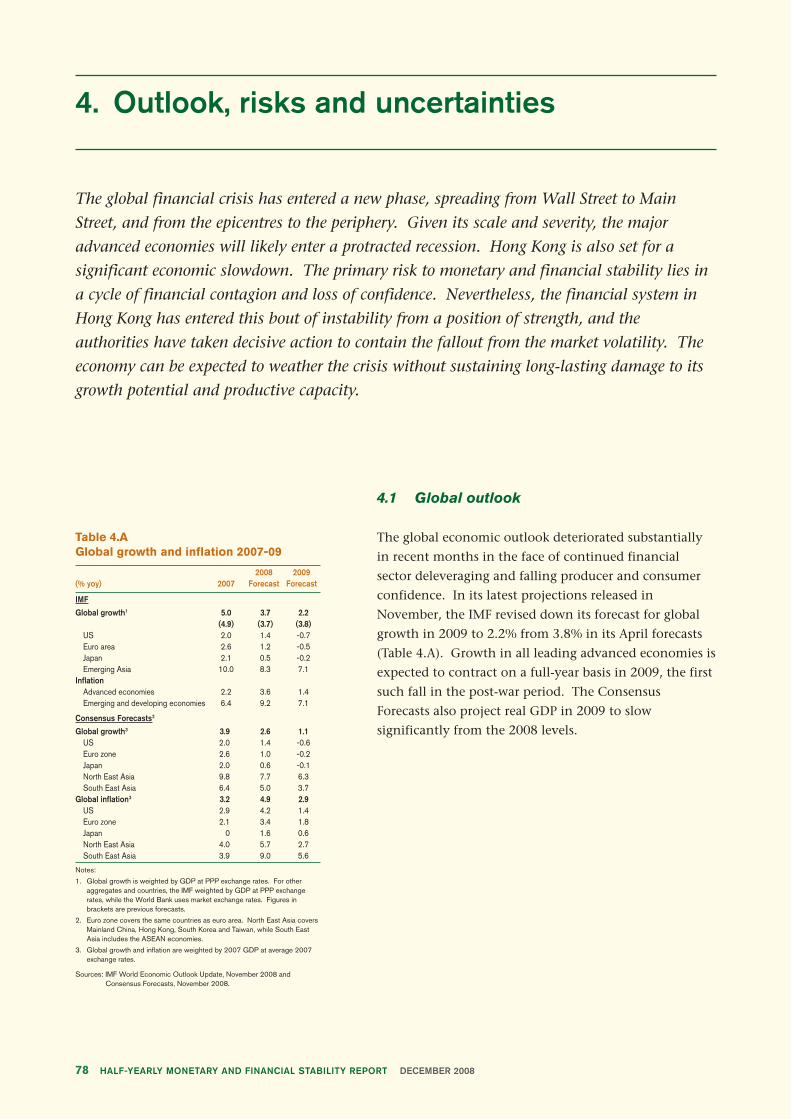
HALF-YEARLY MONETARY AND FINANCIAL STABILITY REPORT DECEMBER 200878
4. Outlook, risks and uncertainties
The global financial crisis has entered a new phase, spreading from Wall Street to Main
Street, and from the epicentres to the periphery. Given its scale and severity, the major
advanced economies will likely enter a protracted recession. Hong Kong is also set for a
significant economic slowdown. The primary risk to monetary and financial stability lies in
a cycle of financial contagion and loss of confidence. Nevertheless, the financial system in
Hong Kong has entered this bout of instability from a position of strength, and the
authorities have taken decisive action to contain the fallout from the market volatility. The
economy can be expected to weather the crisis without sustaining long-lasting damage to its
growth potential and productive capacity.
Table 4.AGlobal growth and inflation 2007-09
2008 2009(% yoy) 2007 Forecast Forecast
IMF
Global growth1 5.0 3.7 2.2(4.9) (3.7) (3.8)
US 2.0 1.4 -0.7Euro area 2.6 1.2 -0.5Japan 2.1 0.5 -0.2Emerging Asia 10.0 8.3 7.1
InflationAdvanced economies 2.2 3.6 1.4Emerging and developing economies 6.4 9.2 7.1
Consensus Forecasts2
Global growth3 3.9 2.6 1.1US 2.0 1.4 -0.6Euro zone 2.6 1.0 -0.2Japan 2.0 0.6 -0.1North East Asia 9.8 7.7 6.3South East Asia 6.4 5.0 3.7
Global inflation3 3.2 4.9 2.9US 2.9 4.2 1.4Euro zone 2.1 3.4 1.8Japan 0 1.6 0.6North East Asia 4.0 5.7 2.7South East Asia 3.9 9.0 5.6
Notes:
1. Global growth is weighted by GDP at PPP exchange rates. For otheraggregates and countries, the IMF weighted by GDP at PPP exchangerates, while the World Bank uses market exchange rates. Figures inbrackets are previous forecasts.
2. Euro zone covers the same countries as euro area. North East Asia coversMainland China, Hong Kong, South Korea and Taiwan, while South EastAsia includes the ASEAN economies.
3. Global growth and inflation are weighted by 2007 GDP at average 2007exchange rates.
Sources: IMF World Economic Outlook Update, November 2008 andConsensus Forecasts, November 2008.
4.1 Global outlook
The global economic outlook deteriorated substantially
in recent months in the face of continued financial
sector deleveraging and falling producer and consumer
confidence. In its latest projections released in
November, the IMF revised down its forecast for global
growth in 2009 to 2.2% from 3.8% in its April forecasts
(Table 4.A). Growth in all leading advanced economies is
expected to contract on a full-year basis in 2009, the first
such fall in the post-war period. The Consensus
Forecasts also project real GDP in 2009 to slow
significantly from the 2008 levels.

Outlook, risks and uncertainties
79HALF-YEARLY MONETARY AND FINANCIAL STABILITY REPORT DECEMBER 2008
Chart 4.1US: probability distribution of growth forecasts for 2009
Source: Staff calculations based on Consensus Forecasts.
GDP growth, % yoy
1.0-1.0 2.0 3.0 4.00
2
4
6
8
10
12Probability density, %
0
Nov 2008 (mean: -0.6%)
Aug 2008 (mean: 1.4%)
May 2008 (mean: 1.9%)
Chart 4.2Euro area: probability distribution of growth forecasts for 2009
Source: Staff calculations based on Consensus Forecasts.
GDP growth, % yoy
-1.0 1.0 2.0 3.0
Probability density, %
0
5
10
15
0
Nov 2008 (mean: -0.2%)
May 2008 (mean: 2%)Aug 2008 (mean: 1.1%)
Chart 4.3Japan: probability distribution of growth forecasts for 2009
Source: Staff calculations based on Consensus Forecasts.
GDP growth, % yoy
Probability density, %
0
2
4
6
8
-1.5 -0.5 0.5 1.5-1.0 0 1.0 2.0 3.52.5 3.0
Nov 2008 (mean: 0%) Aug 2008 (mean: 1.2%)
May 2008 (mean: 1.5%)
In the US, the outlook is for a deeper and more
protracted recession than those experienced in the past
two decades, as households respond to depreciating real
and financial assets and tightening financial conditions.
The IMF forecasts the US economy to contract by 0.7% in
2009, following a slowdown in growth to 1.4% this year.
The mean of Consensus Forecasts for US growth in 2009
has been declining substantially since May 2008 from
slow growth to a contraction of 0.6%, and the
distribution has become less dispersed (Chart 4.1).
Credit conditions, which were already tight, turned more
severe following intensification of the credit crisis, which
will drag on personal consumption and business
investment. Asset price declines have damaged
household and corporate balance sheets, which will take
time to repair, while soft external demand coupled with
a strong dollar will mean less outside support for the
economy. The decline in house prices is expected to
continue due to the worsening credit crunch and
deteriorating labour market conditions.
The euro area also looks set to head into a recession. The
mean of Consensus Forecasts for euro area growth in
2009 suggests a contraction of 0.2%, down from 2%
growth in May (Chart 4.2). Growth in the euro area is
expected to be hard hit, as their banks’ high exposure to
the US credit problems are leading to tightening financial
conditions and falling confidence. Even if
comprehensive support packages to address the growing
concerns are put in place rapidly, it will take time to
return perceptions of counterparty risk to more normal
levels. As such, banks’ deleveraging will weigh
noticeably on economic growth over the coming
quarters.
In Japan, the mean of Consensus Forecasts for growth in
2009 has also been declining since May to just zero
growth (Chart 4.3). Although financial conditions have
tightened to a lesser extent than in other major
economies, in part owing to Japanese banks’ lower
exposure to securitised products, the stock market has
fallen sharply, driven by concerns about the weaker
growth outlook. The support to growth from net exports
is expected to decline. Slowing external demand from
the US and Europe and diminishing profit expectations
are weighing on corporate sentiment and companies’
investment plans.

Outlook, risks and uncertainties
HALF-YEARLY MONETARY AND FINANCIAL STABILITY REPORT DECEMBER 200880
Chart 4.5US: probability distribution of inflation forecasts for 2009
Source: Staff calculations based on Consensus Forecasts.
Inflation, % yoy
0 3 41 2
Probability density, %
0
2
4
6
8
Nov 2008 (mean: 1.4%)
Aug 2008 (mean: 2.9%)
May 2008 (mean: 2.4%)
Chart 4.4Imports in the US during recessions
-20
-15
-10
-5
0
5
10
15
20
25
Mar 1990 Mar 1993 Mar 1996 Mar 1999 Mar 2002 Mar 2005 Mar 2008
Import growth, yoy, 3m moving avg.
%
Sources: CEIC and staff estimates.
Economic growth in Mainland China is expected to
moderate in 2009 due to both weaker domestic and
external demand. On the domestic front, consumer
sentiment has been affected by the decline in asset
prices, and unemployment is on the rise, particularly in
the coastal areas as production slowed. Private
investment is expected to decelerate as profit margins are
squeezed by over-capacity and weakening demand. On
the external side, recessions in the developed economies
are deepening. Analysis of US imports during previous
recessions suggests exports from China may experience
little growth in 2009 (Chart 4.4).
On the policy front, the Mainland authorities kept the
renminbi stable against the US dollar, despite the fast
depreciation of other emerging market currencies. With
the effectiveness of the monetary policy constrained by
banks’ willingness to lend, the growth outlook on the
Mainland largely hinges on the impact of the fiscal
stimulus package. By announcing the RMB4 trillion
package, the Mainland authorities appeared determined
to achieve the 2009 growth target.
Taking Mainland China and other emerging Asian
economies as a group, the IMF also revised downwards
its projections to 7.1% in 2009, from 8.3% in 2008.
Growth in China itself is projected to moderate to 8.5%
in 2009, from the expected still high level of 9.7% in
2008. Developing Asia, including the Mainland
generally have suffered smaller markdowns, because their
financial positions are typically more robust; they have
benefited from improved terms of trade from falling
commodity prices; and they have already initiated a shift
towards macroeconomic policy easing.
Global consumer-price inflation is projected by the IMF
to increase to 4.8% in 2008 from 4.0% in 2007, reflecting
rising fuel and food prices until the middle of this year.
However, the combination of stabilising commodity
prices and increasing economic slack in the face of the
global downturn is expected to help ease inflationary
pressures. The IMF forecasts global consumer-price
inflation to ease to 3.7% in 2009, while the Consensus
Forecasts also project inflation to ease from the 2008
level. For the US, the mean of Consensus Forecasts for
CPI inflation in 2009 has been revised downwards
significantly to 1.4% from August (Chart 4.5).
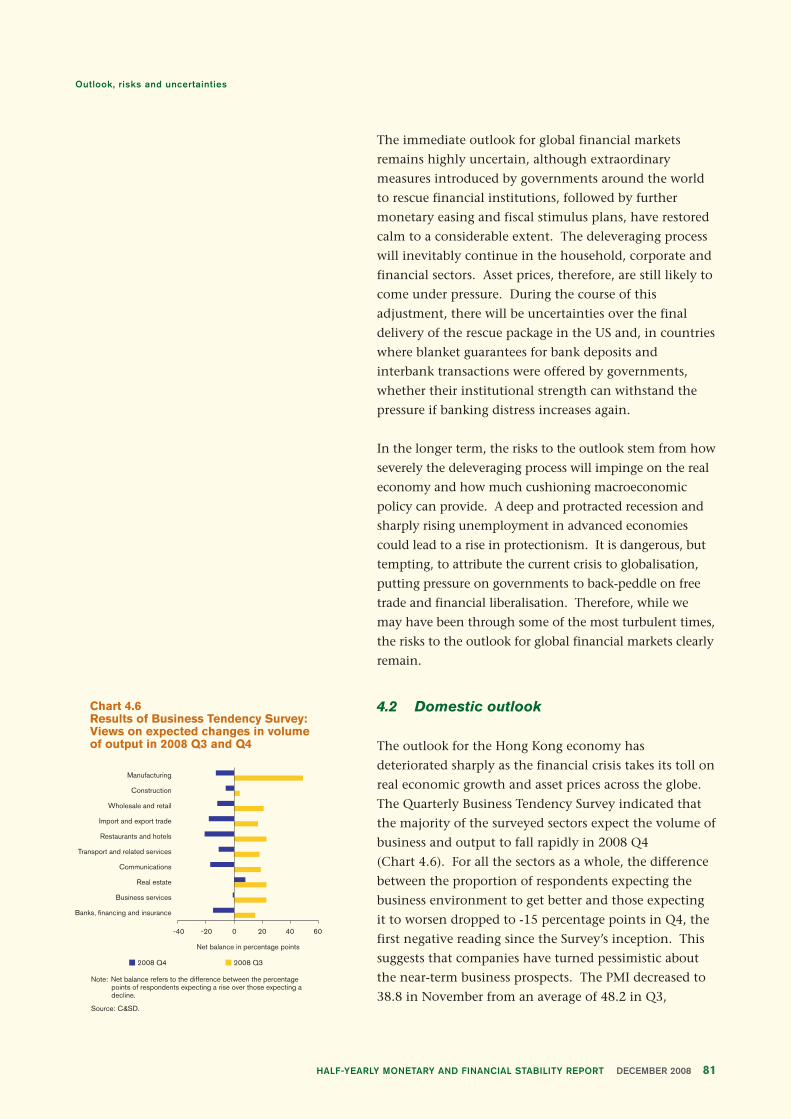
Outlook, risks and uncertainties
81HALF-YEARLY MONETARY AND FINANCIAL STABILITY REPORT DECEMBER 2008
The immediate outlook for global financial markets
remains highly uncertain, although extraordinary
measures introduced by governments around the world
to rescue financial institutions, followed by further
monetary easing and fiscal stimulus plans, have restored
calm to a considerable extent. The deleveraging process
will inevitably continue in the household, corporate and
financial sectors. Asset prices, therefore, are still likely to
come under pressure. During the course of this
adjustment, there will be uncertainties over the final
delivery of the rescue package in the US and, in countries
where blanket guarantees for bank deposits and
interbank transactions were offered by governments,
whether their institutional strength can withstand the
pressure if banking distress increases again.
In the longer term, the risks to the outlook stem from how
severely the deleveraging process will impinge on the real
economy and how much cushioning macroeconomic
policy can provide. A deep and protracted recession and
sharply rising unemployment in advanced economies
could lead to a rise in protectionism. It is dangerous, but
tempting, to attribute the current crisis to globalisation,
putting pressure on governments to back-peddle on free
trade and financial liberalisation. Therefore, while we
may have been through some of the most turbulent times,
the risks to the outlook for global financial markets clearly
remain.
4.2 Domestic outlook
The outlook for the Hong Kong economy has
deteriorated sharply as the financial crisis takes its toll on
real economic growth and asset prices across the globe.
The Quarterly Business Tendency Survey indicated that
the majority of the surveyed sectors expect the volume of
business and output to fall rapidly in 2008 Q4
(Chart 4.6). For all the sectors as a whole, the difference
between the proportion of respondents expecting the
business environment to get better and those expecting
it to worsen dropped to -15 percentage points in Q4, the
first negative reading since the Survey’s inception. This
suggests that companies have turned pessimistic about
the near-term business prospects. The PMI decreased to
38.8 in November from an average of 48.2 in Q3,
Chart 4.6 Results of Business Tendency Survey:Views on expected changes in volumeof output in 2008 Q3 and Q4
Net balance in percentage points
-40 -20 200 40 60
2008 Q4 2008 Q3
Note: Net balance refers to the difference between the percentage points of respondents expecting a rise over those expecting a decline.
Source: C&SD.
Manufacturing
Construction
Wholesale and retail
Import and export trade
Restaurants and hotels
Transport and related services
Communications
Real estate
Business services
Banks, financing and insurance
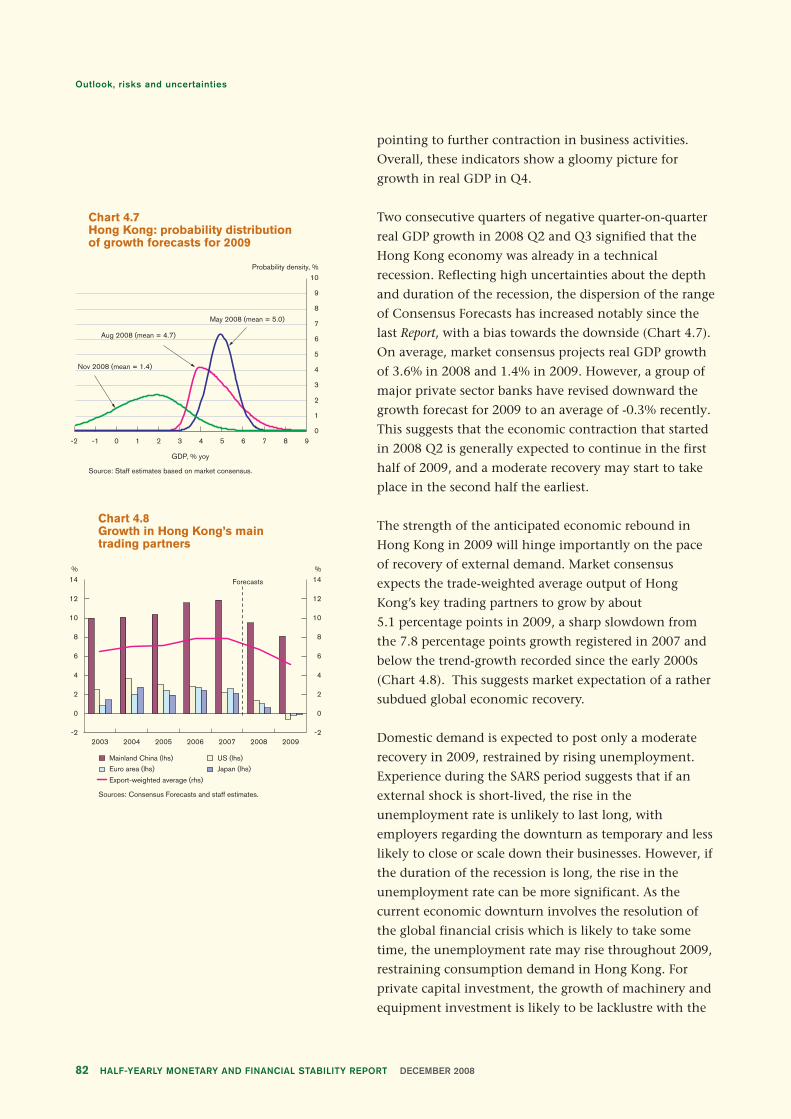
Outlook, risks and uncertainties
HALF-YEARLY MONETARY AND FINANCIAL STABILITY REPORT DECEMBER 200882
Chart 4.7 Hong Kong: probability distributionof growth forecasts for 2009
Source: Staff estimates based on market consensus.
GDP, % yoy
-2 0 2 64 985 730
1
2
3
4
5
6
7
8
9
10Probability density, %
-1 1
Nov 2008 (mean = 1.4)
May 2008 (mean = 5.0)
Aug 2008 (mean = 4.7)
Chart 4.8 Growth in Hong Kong’s main trading partners
Mainland China (lhs) US (lhs)
Euro area (lhs)
Export-weighted average (rhs)
Japan (lhs)
Sources: Consensus Forecasts and staff estimates.
2003 2004 2005 2006 2007 2009
Forecasts
2008-2
0
2
4
6
8
10
12
14%
-2
0
2
4
6
8
10
12
14%
pointing to further contraction in business activities.
Overall, these indicators show a gloomy picture for
growth in real GDP in Q4.
Two consecutive quarters of negative quarter-on-quarter
real GDP growth in 2008 Q2 and Q3 signified that the
Hong Kong economy was already in a technical
recession. Reflecting high uncertainties about the depth
and duration of the recession, the dispersion of the range
of Consensus Forecasts has increased notably since the
last Report, with a bias towards the downside (Chart 4.7).
On average, market consensus projects real GDP growth
of 3.6% in 2008 and 1.4% in 2009. However, a group of
major private sector banks have revised downward the
growth forecast for 2009 to an average of -0.3% recently.
This suggests that the economic contraction that started
in 2008 Q2 is generally expected to continue in the first
half of 2009, and a moderate recovery may start to take
place in the second half the earliest.
The strength of the anticipated economic rebound in
Hong Kong in 2009 will hinge importantly on the pace
of recovery of external demand. Market consensus
expects the trade-weighted average output of Hong
Kong’s key trading partners to grow by about
5.1 percentage points in 2009, a sharp slowdown from
the 7.8 percentage points growth registered in 2007 and
below the trend-growth recorded since the early 2000s
(Chart 4.8). This suggests market expectation of a rather
subdued global economic recovery.
Domestic demand is expected to post only a moderate
recovery in 2009, restrained by rising unemployment.
Experience during the SARS period suggests that if an
external shock is short-lived, the rise in the
unemployment rate is unlikely to last long, with
employers regarding the downturn as temporary and less
likely to close or scale down their businesses. However, if
the duration of the recession is long, the rise in the
unemployment rate can be more significant. As the
current economic downturn involves the resolution of
the global financial crisis which is likely to take some
time, the unemployment rate may rise throughout 2009,
restraining consumption demand in Hong Kong. For
private capital investment, the growth of machinery and
equipment investment is likely to be lacklustre with the

Outlook, risks and uncertainties
83HALF-YEARLY MONETARY AND FINANCIAL STABILITY REPORT DECEMBER 2008
Chart 4.9 CCPI rental component andmarket rents
Note: CCPI rental component is excluding the effects of one-off special relief measures.
Sources: R&VD, C&SD and staff estimates.
1997 1998 1999 2000 2001 2002 2003 2004 2005 2006 2007 2009200850
60
70
80
90
100
110
120Jan 1997=100
Residential rental index
Residential rental index (24-month moving average)
CCPI rental component
presence of spare capacity in the early stages of an
economic recovery. Building and construction
investment is restrained by limited land supply and the
delay in construction of projects by property developers
because of falling property prices. To cope with the
downturn, the Government pledged to speed up public
infrastructure investment, but it may be some time
before the effects are seen.
Underlying inflation is expected to ease in 2009 on the
back of sub-par economic growth, falling global food and
commodity prices and declining housing rents.
Domestically, the sharp rise in property prices from the
second half of 2007 to mid-2008 put upward pressures
on private housing rents feeding through to the rental
component of the CCPI throughout 2008. There is
normally a close relationship between the 24-month
moving average of the private residential rental index
and the CCPI rental component (Chart 4.9). Assuming
that the private residential rental index peaked in 2008
Q3 and declines by 1.2% per month thereafter, the year-
on-year CCPI rental inflation should reach 10.2% and
1.9% in 2008 and 2009 respectively, with the peak in
January 2009. Nevertheless, given the current market
conditions, the pass-through from market rentals to the
rental component of the CCPI may be faster than
implied by the historical relationship. In such a case,
rental inflation is likely to peak sooner. The non-rental
component of the CCPI inflation is also expected to ease
on the back of moderating economic activities and
decreases in food and commodity prices.
Headline inflation may rise at a slower pace than
underlying inflation, mainly reflecting the effects of a
number of one-off special relief measures, such as the
rates waiver for the whole of the 2008/09 fiscal year and
the waiver of electricity fees. The latest market consensus
predicts headline CCPI inflation to rise by 2.7% (in a
range of -0.2% to 4.5%) in 2009 (Chart 4.10).
Chart 4.10 Hong Kong: probability distributionof headline inflation forecasts for 2009
Source: Staff estimates based on market consensus.
CCPI, % yoy
-3 61 873-20
1
2
3
4Probability density, %
2 4-1 50
May 2008 (mean = 4.2)
Aug 2008 (mean = 4.8)
Nov 2008 (mean = 2.7)

Outlook, risks and uncertainties
HALF-YEARLY MONETARY AND FINANCIAL STABILITY REPORT DECEMBER 200884
4.3 Uncertainties and risks
Crisis management on an almost unprecedented scale
worldwide, involving government guarantees and the
bail-out of systemically important financial institutions,
appears to have prevented a meltdown of the global
financial system. However, the crisis has entered a new
phase, spreading from Wall Street to Main Street, and
from advanced countries to emerging market economies.
A credit crunch is underway in the major economies and
a feedback loop between financial-markets deleveraging
and real economic activity has gathered pace. At the
same time, a general flight to safety by investors is
affecting emerging market economies, and some have
sustained sharp depreciations in their currencies and
losses in foreign exchange reserves as risk aversion
escalated.
As an international financial centre and trade entrepôt,
Hong Kong’s financial system has been severely affected
by the global shocks — equity prices have fallen sharply
and money markets have been under pressure. The
primary risk to monetary and financial stability lies in a
cycle of financial contagion and loss of confidence. To
bolster confidence, the Government has taken decisive
action and deployed a wide range of precautionary
measures, including emergency liquidity support, a
temporary full deposit guarantee arrangement, and a
contingent bank capital facility. While these financial
policies should be effective in stemming contagion to the
Hong Kong banking system, they are not meant to resist
movements in asset prices, which will continue to adjust
along with global markets. External shocks through both
the financial market and trade channels will inevitably
have significant fallout for the Hong Kong economy well
into 2009.
Although the global economy looks set to enter a
synchronous downturn, its depth and duration is highly
uncertain. This is because the global economy might be
at a turning point where the potential for non-linearity
in economic and financial developments might
undermine attempts at model-based forecasts for the
economic outturn. As such, it is useful to supplement
quantitative projections with historical episodes of the
US recessions and use them as a basis to gauge the depth
and length of the economic downturn.

Outlook, risks and uncertainties
85HALF-YEARLY MONETARY AND FINANCIAL STABILITY REPORT DECEMBER 2008
Table 4.B shows the contraction in the US GDP and the
rise in the unemployment rate in selected US recessions,
as dated by the National Bureau of Economic Research.
The Great Depression stood out in the severity of its
impact, as output contracted by 30% and the
unemployment rate jumped over 21 percentage points,
while the recession dragged on for almost four years.
Then, the fallout from the stock market crash was
exacerbated by tightening monetary conditions and
inappropriate policies. In the current crisis, advanced
and emerging economies alike introduced extraordinary
measures to stabilise financial market conditions and
support economic activity. These policy measures,
whether financial, monetary, or fiscal, should serve to
put a floor to economic growth, and help buttress the
global economy from a recession in the style of the Great
Depression. To the extent that further systemic events
may be averted and monetary and fiscal policies serve to
keep the economy afloat, extreme and large-scale
interruptions to growth may be avoided.
Nevertheless, a protracted recession in the US may be
unavoidable. The process of deleveraging will continue
given the scale of balance sheet contraction needed by
financial institutions. Credit to businesses and
households will remain highly restrained; household and
corporate balance sheets, damaged by asset price
declines, will take time to be repaired; and housing prices
have yet to stabilise. Together, these point to a
downturn that will be drawn-out and a subsequent
recovery that may only be tepid. Therefore, it may be
optimistic to expect a recession as shallow and short as
those of 2001 or 1990-91. Some economic indicators,
such as retail sales, are already showing signs of sharper
declines than experienced during the past two recessions.
Perhaps the recession in 1981-82 might be a more
comparable scenario for our current situation. Then, the
recession lasted six quarters, unemployment went up 3.6
percentage points, while output contracted by almost 3%
from peak to trough.
For emerging markets, especially relatively open
economies, a prolonged US recession together with
economic contractions in the euro area and Japan will
mean the loss of an important support to growth. The
Baltic Dry Index, which provides an indication of the
Table 4.BUS recessions and related economicindicators
Peak-to-trough Unemployment Global
Time period contraction Duration rate growth1929 Q3 30.5% 15 quarters From 3.2% (1929) n.a.-1933 Q1 to 24.9% (1933)
+21.7% points1980 Q1 2.2% 3 quarters From 5.6% (May 1979) 2.0% yoy-1980 Q3 to 7.8% (Jul 1980) (1980)
+2.2% points1981 Q3 2.9% 6 quarters From 7.2% (Jul 1981) 0.9% yoy-1982 Q4 to 10.8% (Dec 1982) (1982)
+3.6% points1990 Q3 1.3% 3 quarters From 5.2% (Jun 1990) 1.5% yoy-1991 Q1 to 7.8% (Jun 1992) (1991)
+2.6% points2001 Q1 0.4% 4 quarters From 3.9% (Dec 2000) 2.2% yoy-2001 Q4 to 6.3% (Jun 2003) (2001)
+2.4% points
Sources: Bloomberg and IMF.

Outlook, risks and uncertainties
HALF-YEARLY MONETARY AND FINANCIAL STABILITY REPORT DECEMBER 200886
volume of global trade, has already experienced its
sharpest fall since the mid-1980s (Chart 4.11). If the
global economy matched the slowdown observed in
1982, it might only grow by about 1% in 2009.
In such a global economic environment, how badly will
Hong Kong’s economy be affected? Again, it is useful to
supplement quantitative projections with a scenario
analysis based on experience (Table 4.C). Hong Kong has
been through three major recessions in the past decade
involving external shocks – the Asian financial crisis in
1997-98, the bursting of the global IT bubble coupled
with the terrorist attack in the US in 2001, and the
outbreak of SARS in 2003. The economic contraction
during the Asian financial crisis was probably the worst
recession in Hong Kong’s recent history. During that
crisis, the property market bubble burst, putting
households in negative equity positions and damaging
their balance sheets; and the overvaluation of the Hong
Kong dollar real exchange rate posed significant
difficulties for the economy. Indeed, the correction to
the overvaluation resulted in a prolonged period of
deflation. The local economy contracted by almost 9%
from the peak to the trough for five consecutive quarters
from 1997 Q4 to 1998 Q4, while the unemployment rate
rose sharply to peak at 6.3% in December 1999.
The bursting of the IT bubble and the terrorist attack on
11 September hit the US economy in 2001. Hong Kong
was not immune to these developments and experienced
a recession. While domestic demand was not particularly
hard hit, Hong Kong’s exports to major trading partners
shrank notably. The economic contraction was not
deep, with real GDP declining by about 2% from peak to
trough. However, the duration of the recession was quite
long, covering four consecutive quarters and leading to a
significant increase in the unemployment rate.
After the recession in 2001, sustained economic recovery
in Hong Kong was disrupted by the outbreak of SARS
between March and June 2003. The epidemic markedly
weakened domestic demand resulting in a peak-to-trough
decline in output of 2.5% over two quarters. The SARS-
induced recession was short-lived, with the local
economy staging a swift and broad-based rebound. This
helped prevent a sharp rise in the unemployment rate,
which declined shortly after the disease was contained.
Table 4.CPast recessions in Hong Kong and therelated economic indicators
Peak-to-Episodes of Time trough Unemploymentrecessions period contraction Duration rateAsian financial 1997 Q4 8.8% 5 quarters From 2.1% (Sep 1997)crisis -1998 Q4 to 6.3% (Dec 1999)
+4.2% points
Burst of the 2001 Q1 2.1% 4 quarters From 4.4% (Jan 2001)global IT -2001 Q4 to 7.5% (Jul 2002)bubble and the +3.1% points9-11 event
SARS period 2003 Q1 2.5% 2 quarters From 7.3% (Nov 2002)-2003 Q2 to 8.5% (Jun 2003)
+1.2% points
Source: Staff estimates.
Chart 4.11 Baltic Dry Index
Source: Bloomberg.
Jan 1986 Jan 2001 Jan 2006-100
100
50
0
-50
150
200
250% yoy
Jan 1991 Jan 1996

Outlook, risks and uncertainties
87HALF-YEARLY MONETARY AND FINANCIAL STABILITY REPORT DECEMBER 2008
Assessing the depth and duration of a recession in the
Hong Kong economy in 2008 and 2009 based on these
previous episodes, it is plausible to expect a recession
that is more severe and longer than the global IT
downturn and the SARS episode as the current crisis is far
more challenging for the global economy.
However, the depth of the recession is likely to be less
severe than the Asian financial crisis, because the Hong
Kong economy is now in a better shape than it was in
1997; there were no major macroeconomic and financial
imbalances before the crisis began and therefore little
need to correct for economic excesses as in 1997. The
loose monetary policy in the US also cushions the Hong
Kong economy under the Linked Exchange Rate system.
Nevertheless, if the recession in the major economies
turns out to be much deeper and more protracted than
now envisaged, then the economic downturn in Hong
Kong will be worse.
The Hong Kong economy has entered the current global
financial crisis from a position of strength, with the
balance sheets of both the private and public sectors
strong, and both factor and product markets remaining
flexible. In the coming months, the bank credit portfolio
is likely to worsen and credit growth will slow
significantly. The banks will also face pressure on profits
from declining margins as well as the loss of fee income
from a decline in capital market activities. While further
declines in stock and property prices are possible and
difficulties in individual financial institutions cannot be
ruled out, the financial system as a whole is likely to
weather the crisis without long-lasting damage to its
institutional strength and productive capacity.

HALF-YEARLY MONETARY AND FINANCIAL STABILITY REPORT DECEMBER 200888
Glossary of terms
Aggregate BalanceThe sum of balances in the clearing accounts and reserve accounts maintained by commercial banks with
the central bank. In Hong Kong, this refers to the sum of the balances in the clearing accounts maintained
by the banks with the HKMA for settling interbank payments and payments between banks and the HKMA.
The Aggregate Balance represents the level of interbank liquidity, and is a part of the Monetary Base.
Authorized Institution (AI)An institution authorized under the Banking Ordinance to carry on the business of taking deposits. Hong
Kong maintains a Three-tier Banking System, which comprises licensed banks, restricted licence banks
(RLBs) and deposit-taking companies (DTCs).
Backing Assets/Backing PortfolioSpecific US dollar assets of the Exchange Fund that have been designated to provide backing to the
Monetary Base.
Backing RatioThe ratio between the Backing Assets and the Monetary Base. When the Currency Board Account was first
set up, sufficient US dollar assets were transferred to the Currency Board Account to provide a 105% backing
of the Monetary Base (the Backing Portfolio). Under a new arrangement approved by the Financial Secretary
in January 2000, when the Backing Ratio reaches 112.5% (the upper trigger point), assets will be transferred
out of the Backing Portfolio to the Investment Portfolio of the Exchange Fund assets to reduce the ratio to
110%. Conversely, should the ratio drop to 105% (the lower trigger point), assets will be injected from the
Investment Portfolio to restore it to 107.5%. This arrangement enables a higher investment return on excess
assets while ensuring sufficient liquid assets in the Backing Portfolio.
Best Lending RateA benchmark interest rate that banks use to price loans. In Hong Kong, the Best Lending Rate is often used
as a base for quoting interest rates on mortgage loans.
Certificates of Indebtedness (CIs)Certificates issued by the Financial Secretary under the Exchange Fund Ordinance, to be held by note-
issuing banks as cover for the banknotes they issue.
Composite Consumer Price IndexThe headline consumer price index (CPI) for Hong Kong. The Census and Statistics Department compiles
three separate CPI series relating to households in different expenditure ranges. The CPI(A) relates to about
50% of households in the relatively low expenditure range; the CPI(B) relates to the next 30% of households
in the medium expenditure range; and the CPI(C) relates to the next 10% of households in the relatively
high expenditure range. The Composite CPI is compiled based on the aggregate expenditure pattern of all
of the above households taken together.

89HALF-YEARLY MONETARY AND FINANCIAL STABILITY REPORT DECEMBER 2008
Composite Interest RateThe composite interest rate is a weighted average interest rate of all Hong Kong dollar interest bearing
liabilities, which include deposits from customers, amounts due to banks, negotiable certificates of deposit
and other debt instruments, and Hong Kong dollar non-interest bearing demand deposits on the books of
banks. Data from retail banks, which account for about 90% of the total customers’ deposits in the banking
sector, are used in the calculation. It should be noted that the composite interest rate represents only
average interest expenses. There are various other costs involved in the making of a loan, such as operating
costs (e.g. staff and rental expenses), credit cost and hedging cost, which are not covered by the composite
interest rate.
Convertibility UndertakingAn undertaking by a central bank or currency board to convert domestic currency into foreign currency and
vice versa at a fixed exchange rate. In Hong Kong, the HKMA operates Convertibility Undertakings on both
the strong side and the weak side. Under the strong-side Convertibility Undertaking, the HKMA undertakes
to buy US dollars from licensed banks at 7.75. Under the weak-side Convertibility Undertaking, the HKMA
undertakes to sell US dollars at 7.85. Within the Convertibility Zone between 7.75 and 7.85, the HKMA may
choose to conduct market operations consistent with Currency Board principles with the aim of promoting
the smooth functioning of the money and foreign exchange markets.
Convertibility ZoneThe Hong-Kong-dollar-US-dollar exchange rate band, defined by the levels of the strong- and weak-side
Convertibility Undertakings, within which the HKMA may choose to conduct market operations consistent
with Currency Board principles.
Delinquency Ratio in Negative EquityNegative equity residential mortgage loans (RMLs) delinquent for more than three months as a percentage
of total negative equity RMLs.
Discount WindowIn Hong Kong, the facility through which banks can borrow Hong Kong dollar funds from the HKMA
through repurchase agreements using eligible securities as collateral.
Exchange Fund Bills and NotesDebt instruments issued by the HKMA for the account of the Exchange Fund. Introduced in March 1990,
the Exchange Fund Bills and Notes programme has expanded over the years, with a maturity profile ranging
from three months to 15 years. These instruments are fully backed by the foreign reserves. The HKMA has
undertaken that new Exchange Fund paper will only be issued when there is an inflow of funds, thus
enabling the additional paper to be fully backed by the foreign reserves. Since 1 April 1999, interest
payments on Exchange Fund paper have been allowed to expand the Monetary Base. Additional Exchange
Fund paper is issued to absorb such interest payments. This is consistent with the Currency Board discipline
since interest payments on Exchange Fund paper are backed by interest income on the US dollar assets
backing the Monetary Base.
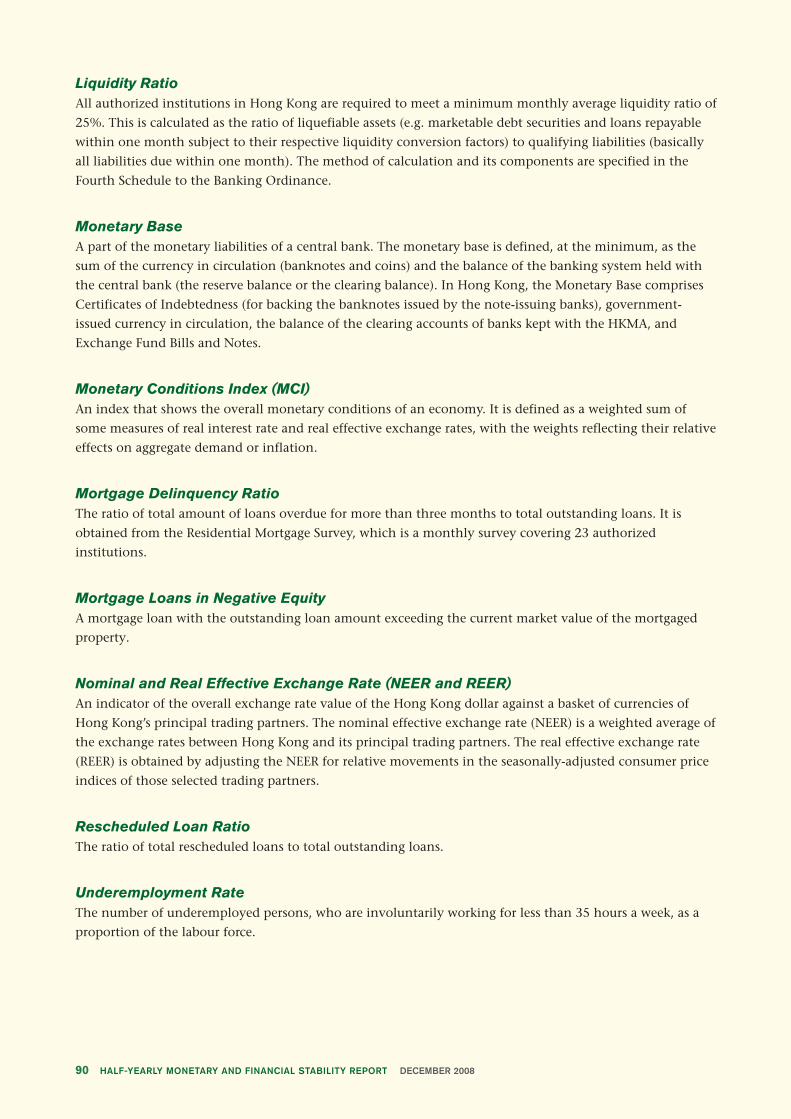
HALF-YEARLY MONETARY AND FINANCIAL STABILITY REPORT DECEMBER 200890
Liquidity RatioAll authorized institutions in Hong Kong are required to meet a minimum monthly average liquidity ratio of
25%. This is calculated as the ratio of liquefiable assets (e.g. marketable debt securities and loans repayable
within one month subject to their respective liquidity conversion factors) to qualifying liabilities (basically
all liabilities due within one month). The method of calculation and its components are specified in the
Fourth Schedule to the Banking Ordinance.
Monetary BaseA part of the monetary liabilities of a central bank. The monetary base is defined, at the minimum, as the
sum of the currency in circulation (banknotes and coins) and the balance of the banking system held with
the central bank (the reserve balance or the clearing balance). In Hong Kong, the Monetary Base comprises
Certificates of Indebtedness (for backing the banknotes issued by the note-issuing banks), government-
issued currency in circulation, the balance of the clearing accounts of banks kept with the HKMA, and
Exchange Fund Bills and Notes.
Monetary Conditions Index (MCI)An index that shows the overall monetary conditions of an economy. It is defined as a weighted sum of
some measures of real interest rate and real effective exchange rates, with the weights reflecting their relative
effects on aggregate demand or inflation.
Mortgage Delinquency RatioThe ratio of total amount of loans overdue for more than three months to total outstanding loans. It is
obtained from the Residential Mortgage Survey, which is a monthly survey covering 23 authorized
institutions.
Mortgage Loans in Negative EquityA mortgage loan with the outstanding loan amount exceeding the current market value of the mortgaged
property.
Nominal and Real Effective Exchange Rate (NEER and REER)An indicator of the overall exchange rate value of the Hong Kong dollar against a basket of currencies of
Hong Kong’s principal trading partners. The nominal effective exchange rate (NEER) is a weighted average of
the exchange rates between Hong Kong and its principal trading partners. The real effective exchange rate
(REER) is obtained by adjusting the NEER for relative movements in the seasonally-adjusted consumer price
indices of those selected trading partners.
Rescheduled Loan RatioThe ratio of total rescheduled loans to total outstanding loans.
Underemployment RateThe number of underemployed persons, who are involuntarily working for less than 35 hours a week, as a
proportion of the labour force.

91HALF-YEARLY MONETARY AND FINANCIAL STABILITY REPORT DECEMBER 2008
Abbreviations
3m moving avg. Three-month moving average3m-on-3m Three-month-on-three-monthADP Automatic Data ProcessingAIG American International GroupASEAN Association of Southeast Asian NationsAIs Authorized Institutionsbn BillionBLR Best Lending RateBoP Balance of PaymentsCCPI Composite Consumer Price IndexCDS Credit Default SwapC&SD Census and Statistics DepartmentCIs Certificates of IndebtednessCPI Consumer Price IndexCU Convertibility UndertakingDAX Deutscher Aktien IndexDCC Dynamic Conditional CorrelationECB European Central BankEU European UnionFAI Fixed-Asset InvestmentFDI Foreign Direct InvestmentFed Federal Reserve BoardFFTR Federal Funds Target RateGDP Gross Domestic ProductHIBOR Hong Kong Interbank Offered RateHKMA Hong Kong Monetary AuthorityHKSAR Hong Kong Special Administrative RegionHSI Hang Seng IndexIMF International Monetary FundIPO Initial public offeringIT Information technologyLIBOR London Interbank Offered Ratelhs Left-hand scaleMCI Monetary Conditions Indexmn Million

HALF-YEARLY MONETARY AND FINANCIAL STABILITY REPORT DECEMBER 200892
MSCI Morgan Stanley Capital Internationaln.a. Not availableNDF Non-deliverable forwardNEER Nominal effective exchange rateNIEs Newly Industrialised EconomiesOECD Organisation for Economic Co-operation and DevelopmentOIS Overnight Index Swapp.a. Per annumPBoC People’s Bank of ChinaPMI Purchasing Managers’ IndexPPP Purchasing Power ParityPPI Producer Price Indexqoq Quarter-on-quarterR&VD Rating and Valuation DepartmentRAI Risk Appetite IndexREER Real effective exchange raterepo Repurchase agreementrhs Right-hand scaleRMB RenminbiRMLs Residential Mortgage LoansRRR Reserve requirement ratioSARS Severe Acute Respiratory SyndromeS&P 500 Standard and Poor’s 500 IndexSI Spillover IndexSMEs Small and medium-sized enterprisesSSE Shanghai Stock ExchangeT-bill Treasury BillTOPIX Tokyo Stock Price IndexUK United KingdomUS United StatesUSD US dollarVaR Value-at-riskVAT Value-added taxyoy Year-on-year

This Report is extracted from theHKMA Quarterly Bulletin
December 2008 issue.
©2008 Hong Kong Monetary Authority
Reproduction for non-commercial
purpose is permitted provided that the
source is properly stated.
Full text of this Report is available on the
HKMA website at www.hkma.gov.hk.
Hong Kong Monetary Authority55th Floor, Two International Finance Centre,
8 Finance Street, Central, Hong Kong
Telephone: (852) 2878 8196
Facsimile: (852) 2878 8197
E-mail: [email protected]
www.hkma.gov.hk
Printed in Hong Kong
HK$60