half-yearly report filethis report is printed on profi bulk 1.1, ... . ... increase in...
TRANSCRIPT

Half-Yearly Report
January – June 2009

© 2009, Nestlé S.A., Cham and Vevey (Switzerland)
In case of doubt or differences of interpretation, the English ver-
sion shall prevail over the French and German text
ConceptNestlé S.A., Group Accounting & Reporting
DesignNestec Ltd., Corporate Identity & Design
PrintingEntreprise d’arts graphiques Jean Genoud SA (Switzerland)
PaperThis report is printed on Profi Bulk 1.1, a paper produced from
well-managed forests and other controlled sources certifi ed by
the Forest Stewardship Council (FSC)
www.nestle.com

1Half-Yearly Report of the Nestlé Group 2009
Overview
Paul Bulcke, CEO of Nestlé: “With 3.5% organic growth
and a 30 basis point EBIT margin improvement, Nestlé
delivered a combination of growth and increased profi t-
ability in the fi rst half of the year, and this in a very chal-
lenging business environment. The success of our effi ciency
initiatives enabled increased investment in consumer-
facing marketing and R&D, which leads me to expect an
acceleration in organic growth in the second half of 2009.
Furthermore, Nestlé’s healthy cash fl ow over the fi rst half
allowed us to return about CHF 6.5 billion in cash to share-
holders. The Group remains committed to its strategic
direction focused on sustainable, long-term profi table growth
and is well placed to capture opportunities as economic
conditions improve.”
Group sales, profi tability and fi nancial position
In the fi rst six months of 2009, Nestlé achieved organic
growth of 3.5%, including 0.5% real internal growth. Dives-
titures, net of acquisitions, reduced Group sales by 0.7%,
whilst the currency effect resulted in a 4.3% reduction due
to the strength of the Swiss franc compared to many other
currencies. These factors resulted in a decline in Nestlé
Group sales of 1.5%, to CHF 52.3 billion. Food and Beve-
rages’ sales reached CHF 48.3 billion, with organic growth
of 3.4%, including real internal growth of 0.1%. This builds
on the strong fi rst half of 2008 when Nestlé achieved organic
growth of 8.9%.
The Group’s EBIT grew to CHF 7.4 billion, resulting in
an increased EBIT margin of 14.1% of sales. This represents
a 30 basis points improvement, both in constant and reporting
currencies. Food and Beverages’ EBIT margin was up
20 basis points in constant currencies and 10 basis points
reported, to 12.4%.
The acceleration of Nestlé Continuous Excellence, the
Group’s effi ciency programme, contributed to a 30 basis
points decline in both the cost of goods sold and distribution
costs. The Group’s commitment to brand building, including
innovation and renovation, is refl ected in the 10 basis points
increase in consumer-facing marketing and in the 20 basis
points increase in Research and Development.
Nestlé’s net profi t margin reached 9.7% of sales. Under-
lying earnings per share grew by 3.5% to CHF 1.46, up 8.5%
in constant currencies.
On 30 June 2009, the Group’s operating cash fl ow was
CHF 6.4 billion, signifi cantly up from CHF 3.5 billion in the
fi rst half of 2008, refl ecting its commitment to capital effi -
ciency. The Group’s net debt was CHF 17.4 billion, down
from CHF 25.8 billion at the end of June 2008. The conti nuing
Share Buy-Back programme and the payment of the dividend
together resulted in about CHF 6.5 billion of cash returned
to shareholders in the fi rst half of 2009.
Share Buy-Back programme
On 28 July 2009, Nestlé completed the fi rst stage of its
CHF 25 billion Share Buy-Back programme, amounting to
CHF 15 billion. A second stage of this programme, amount-
ing to CHF 10 billion, will start on 13 August 2009. Nestlé’s
CHF 25 billion Share Buy-Back programme is foreseen to be
completed by end of 2010.

2 Half-Yearly Report of the Nestlé Group 2009
Sales and EBIT margin by operating segment
In the fi rst half of 2009, the organic growth of Nestlé’s
overall Food and Beverages activities amounted to 0.5%
in Europe, 4.6% in the Americas and 6.6% in Asia, Oceania
and Africa.
Zone Europe: sales of CHF 10.8 billion, 0.2% organic
growth and –1.5% real internal growth. The EBIT margin
was 11.8%, the same level as a year ago. Savings from
the acceleration of the Nestlé Continuous Excellence
Programme compensated temporary volume softness,
additional pension costs and continued investment in
marketing. Great Britain and Eastern Europe, particularly
Russia and the Ukraine, as well as the regional petcare busi-
ness and soluble coffee, achieved high organic growth.
Zone Americas: sales of CHF 15.2 billion, 6.6% organic
growth and 1.9% real internal growth. The EBIT margin
improved by 20 basis points due to growth and signifi cant
cost savings from the Nestlé Continuous Excellence
Programme. Both North and Latin America experienced
strong organic growth, particularly the US, Brazil and
Mexico. Soluble coffee and beverages, frozen food and
petcare did particularly well.
Zone Asia, Oceania and Africa: sales of CHF 7.7 billion,
5.9% organic growth and 2.2% real internal growth. The
EBIT margin improved by 60 basis points due to growth
leverage and operational effi ciencies. There were good
performances across the emerging markets with Africa,
China, India and the Philippines, amongst others, achiev-
ing double-digit organic growth. Soluble coffee, ambient
culinary, powdered and ready-to-drink beverages, petcare
and chocolate all delivered strong organic growth. Popularly
Positioned Products (PPPs), aimed at emerging consumers,
conti nued to achieve double-digit organic growth.
Nestlé Waters: sales of CHF 4.7 billion, –2.9% organic
growth and –3.7% real internal growth. The EBIT margin
increased by 110 basis points, benefi ting from lower oil-
related costs, effi ciencies and supply chain optimisation.
The organic growth refl ects the current environment in the
bottled water industry as a whole, particularly in Western
Europe and North America. The emerging market businesses
achieved double-digit organic growth. Nestlé Pure Life
maintained good momentum around the world and drove
market share gains in the US.
Nestlé Nutrition: sales of CHF 5.0 billion, 1.5% organic
growth and –2.4% real internal growth. The EBIT margin
decreased by 110 basis points, refl ecting upfront investments
in media campaigns and increased support for the accele-
rating NaturNes launch in Europe. All divisions accelerated
during the fi rst half from their fi rst quarter performance.
The infant nutrition business showed signs of improving
momentum in Europe and the US during the period, and
maintained good organic growth in Latin America, Asia,
Oceania and Africa, supported by a strong innovation and
renovation pipeline.
Other Food and Beverages: sales of CHF 4.9 billion,
6.1% organic growth and 2.4% real internal growth. The
EBIT margin increased by 20 basis points due to growth
leverage and operational effi ciencies. Cereal Partners
Worldwide and Nespresso continued to perform well. Nestlé
Professional was affected by a softer out-of-home market
in developed countries but delivered strong performances
in many emer ging markets such as Greater China, the
Philippines and the Middle East, resulting in virtually fl at
organic growth.
Pharma: sales of CHF 4.0 billion, 5.0% organic growth and
5.1% real internal growth. The EBIT margin improved by
80 basis points, mainly due to growth, operational effi ciencies
and a positive product mix.

3Half-Yearly Report of the Nestlé Group 2009
Sales and EBIT margin by product
Powdered and Liquid Beverages: sales of CHF 9.2 billion,
9.7% organic growth and 4.7% real internal growth. The
EBIT margin declined by 110 basis points, mainly due to
the increased support for the enlarged Nescafé Dolce Gusto
roll-out and raw material cost pressures. The strong growth
confi rms the dynamism of Nestlé’s billionaire brands
Nescafé, Nesquik, Nespresso, Milo and Nestea. These
brands benefi ted from a strong pipeline of new products,
ranging from PPP offerings to super-premium. The success ful
roll-out of Nescafé Dolce Gusto continued and allowed
Nestlé to increase its market share in the fast-growing
portioned coffee segment. Nespresso continued its out-
standing performance with organic growth over 25%.
Overall, the product segment achieved double-digit growth
in Eastern Europe, the Americas, Asia, Oceania, the Middle
East and Africa.
Milk products and Ice cream: sales of CHF 9.6 billion,
0% organic growth and –1.3% real internal growth. The
EBIT margin declined by 20 basis points due to lower
pricing in ambient dairy in anticipation of falling raw mate-
rial costs. The EBIT margin in ice cream increased due to
effi ciencies and the exit from underperforming markets.
There were the fi rst signs of a pick up in consumer demand
for ambient dairy in emerging markets after the high prices
seen in 2008. Ice cream’s organic growth improved over
the fi rst half of 2009 thanks to innovations such as Häagen
Dazs 5 in North America and the successful launch of Nestlé
Extrême all natural in Switzerland.
Prepared dishes and cooking aids: sales of CHF 8.2 billion,
1.0% organic growth and 0% real internal growth. The
EBIT margin improved by 90 basis points due to product
range rationalisation. Maggi achieved double-digit organic
growth in Africa, Asia and Eastern Europe. In the US, Hot
Pockets, Stouffer’s and Lean Cuisine frozen prepared meals
delivered a good fi rst half performance. In Europe, frozen
prepared meals were weak while the pizza business conti nued
to perform well.
Confectionery: sales of CHF 5.1 billion, 4.3% organic growth
and –1.3% real internal growth. The EBIT margin increased
by 60 basis points due to effi ciencies and product lines
streamlining. Kit Kat continued its excellent performance
with strong organic growth and market share gains. The
UK business continued to perform well with its focus on
its seven key brands, as did the US. Overall, the emerging
markets in Asia, Africa, the Middle East and Latin America
continued to deliver strong organic growth.
PetCare: sales of CHF 6.4 billion, 9.1% organic growth and
2.7% real internal growth. The EBIT margin increased by
120 basis points due to continued growth of high value-
added strategic brands, together with pricing to offset input
cost pressures. The global petcare business’ excellent perfor-
mance was driven by resilient demand for key premium
and super premium brands such as One, Beneful, Cat Chow,
Pro Plan and Friskies.
Outlook
Nestlé’s fi rst half performance of 3.5% organic growth
combined with a 30 basis points EBIT margin improvement
refl ects the Group’s strength in challenging times while
making it fi tter for the future. Indeed, Nestlé’s successful
effi ciency programmes enabled it both to invest for growth
and deliver this EBIT margin improvement. The Group
expects volume-driven organic growth to accelerate in
the second half as well as an EBIT margin improvement
in constant currencies for the full year. The Group remains
committed to its strategic direction focused on sustainable,
long-term profi table growth and is well placed to capture
opportunities as economic conditions improve.

4 Half-Yearly Report of the Nestlé Group 2009
Key fi gures (consolidated)
January–June January–June
In millions of CHF (except for per share data) 2009 2008
Sales 52 267 53 066
EBIT (Group) Earnings Before Interest, Taxes, restructuring and impairments 7 383 7 341
as % of Sales 14.1% 13.8%
EBIT (Food and Beverages) 6 013 6 077
as % of Sales (Food and Beverages) 12.4% 12.3%
Profi t for the period attributable to shareholders of the parent (Net profi t) 5 071 5 214
as % of Sales 9.7% 9.8%
Capital expenditure 1 521 1 643
as % of Sales 2.9% 3.1%
Equity attributable to shareholders of the parent, end June 50 361 46 233
Market capitalisation, end June 146 688 171 539
Operating cash fl ow 6 431 3 461
Free cash fl ow (a) 4 420 1 542
Net fi nancial debt 17 449 25 806
Per share
Total basic earnings per share CHF 1.41 1.39
Total fully diluted earnings per share CHF 1.40 1.39
Equity attributable to shareholders of the parent, end June CHF 13.98 12.35
(a) Operating cash fl ow less capital expenditure, sale of property, plant and equipment, expenditure on and sale of intangible assets, cash fl ows
with associates as well as with non-controlling interests

5Half-Yearly Report of the Nestlé Group 2009
Principal key fi gures in USD and EUR (Illustrative)
Income statement fi gures translated at average rate; balance sheet fi gures at ending June
exchange rate
January–June January–June
In millions of USD (except for per share data) 2009 2008
Sales 46 233 50 620
EBIT (Group) Earnings Before Interest, Taxes, restructuring and impairments 6 531 7 003
Profi t for the period attributable to shareholders of the parent (Net profi t) 4 486 4 974
Equity attributable to shareholders of the parent, end June 46 650 45 416
Market capitalisation, end June 135 879 168 506
Per share
Total basic earnings per share USD 1.25 1.33
Equity attributable to shareholders of the parent, end June USD 12.95 12.13
In millions of EUR (except for per share data)
Sales 34 701 33 050
EBIT (Group) Earnings Before Interest, Taxes, restructuring and impairments 4 902 4 572
Profi t for the period attributable to shareholders of the parent (Net profi t) 3 367 3 247
Equity attributable to shareholders of the parent, end June 33 029 28 762
Market capitalisation, end June 96 204 106 717
Per share
Total basic earnings per share EUR 0.94 0.87
Equity attributable to shareholders of the parent, end June EUR 9.17 7.68

6 Half-Yearly Report of the Nestlé Group 2009
Consolidated income statement for the period ended 30 June 2009
January–June January–June
In millions of CHF Notes 2009 2008
Sales 3 52 267 53 066
Cost of goods sold (22 214) (22 697)
Distribution expenses (4 215) (4 457)
Marketing and administration expenses (17 484) (17 676)
Research and development costs (971) (895)
EBIT Earnings Before Interest, Taxes, restructuring and impairments 3 7 383 7 341
Net other income/(expenses) 5
Other income 146 132
Other expenses (348) (366)
(202) (234)
Profi t before interest and taxes 7 181 7 107
Net fi nancing cost
Financial income 73 100
Financial expense (394) (637)
(321) (537)
Profi t before taxes and associates 6 860 6 570
Taxes (1 646) (1 591)
Share of results of associates 6 521 612
Profi t for the period 5 735 5 591
of which attributable to non-controlling interests 664 377
of which attributable to shareholders of the parent (Net profi t) 5 071 5 214
As % of Sales
EBIT Earnings Before Interest, Taxes, restructuring and impairments 14.1% 13.8%
Profi t for the period attributable to shareholders of the parent (Net profi t) 9.7% 9.8%
Earnings per share (in CHF)
Basic earnings per share 1.41 1.39
Fully diluted earnings per share 1.40 1.39

7Half-Yearly Report of the Nestlé Group 2009
January–June January–June
In millions of CHF 2009 2008
Profi t for the period recognised in the income statement 5 735 5 591
Currency retranslations 1 605 (3 252)
Fair value adjustments on available-for-sale fi nancial instruments
– Unrealised results (84) (228)
– Recognition of realised results in the income statement 2 8
Fair value adjustments on cash fl ow hedges
– Recognised in hedging reserve 30 162
– Removed from hedging reserve 142 (18)
Actuarial gains/(losses) on defi ned benefi t schemes (360) (33)
Share of other comprehensive income of associates (311) (1 138)
Taxes (121) 63
Other comprehensive income for the period 903 (4 436)
Total comprehensive income for the period 6 638 1 155
of which attributable to non-controlling interests 731 238
of which attributable to shareholders of the parent 5 907 917
Consolidated statement of comprehensive incomefor the period ended 30 June 2009

8 Half-Yearly Report of the Nestlé Group 2009
Consolidated balance sheetas at 30 June 2009
30 June 31 December 30 June
In millions of CHF Notes 2009 2008 2008
Assets
Current assets
Cash and cash equivalents 6 031 5 835 7 301
Short term investments 1 560 1 296 2 671
Inventories 9 835 9 342 10 534
Trade and other receivables 14 013 13 442 14 494
Prepayments and accrued income 828 627 851
Derivative assets 1 479 1 609 1 008
Current income tax assets 590 889 533
Assets held for sale 23 8 74
Total current assets 34 359 33 048 37 466
Non-current assets
Property, plant and equipment 21 936 21 097 20 890
Goodwill 31 462 30 637 31 045
Intangible assets 6 912 6 867 7 014
Investments in associates 7 844 7 796 7 668
Financial assets 3 893 3 868 3 784
Employee benefi ts assets 80 60 1 294
Deferred tax assets 2 748 2 842 1 746
Total non-current assets 74 875 73 167 73 441
Total assets 109 234 106 215 110 907

9Half-Yearly Report of the Nestlé Group 2009
30 June 31 December 30 June
In millions of CHF Notes 2009 2008 2008
Liabilities and equity
Current liabilities
Financial liabilities 16 669 15 383 29 234
Trade and other payables 12 044 12 608 12 558
Accruals and deferred income 2 903 2 931 3 230
Derivative liabilities 1 611 1 477 543
Current income tax liabilities 813 824 869
Liabilities directly associated with assets held for sale 5 – 11
Total current liabilities 34 045 33 223 46 445
Non-current liabilities
Financial liabilities 8 371 6 344 6 544
Employee benefi ts liabilities 5 761 5 464 4 439
Provisions 3 797 3 663 3 135
Deferred tax liabilities 1 401 1 341 1 039
Other payables 1 251 1 264 944
Total non-current liabilities 20 581 18 076 16 101
Total liabilities 54 626 51 299 62 546
Equity
Share capital 7 365 383 383
Treasury shares (2 494) (9 652) (5 147)
Translation reserve (9 550) (11 103) (9 415)
Retained earnings and other reserves 62 040 71 146 60 412
Total equity attributable to shareholders of the parent 50 361 50 774 46 233
Non-controlling interests 4 247 4 142 2 128
Total equity 54 608 54 916 48 361
Total liabilities and equity 109 234 106 215 110 907

Consolidated cash fl ow statementfor the period ended 30 June 2009
January–June January–June
In millions of CHF Notes 2009 2008
Operating activities
Profi t for the period 5 735 5 591
Non-cash items of income and expense 8 1 574 1 259
Decrease/(increase) in working capital (1 356) (2 963)
Variation of other operating assets and liabilities 478 (426)
Operating cash fl ow 6 431 3 461
Investing activities
Capital expenditure (1 521) (1 643)
Expenditure on intangible assets (182) (296)
Sale of property, plant and equipment 68 54
Acquisitions of businesses 9 (151) (665)
Disposals of businesses 9 53 127
Cash fl ows with associates 344 349
Other investing cash fl ows (70) (101)
Cash fl ow from investing activities (1 459) (2 175)
Financing activities
Dividend paid to shareholders of the parent 7 (5 047) (4 573)
Purchase of treasury shares (1 544) (3 542)
Sale of treasury shares 157 144
Cash fl ows with non-controlling interests (650) (282)
Bonds issued 10 2 997 1 923
Bonds repaid 10 (1 122) (1 874)
Increase in other non-current fi nancial liabilities 94 213
Decrease in other non-current fi nancial liabilities (47) (45)
Increase/(decrease) in current fi nancial liabilities 448 7 724
Decrease/(increase) in short-term investments (204) (22)
Cash fl ow from fi nancing activities (4 918) (334)
Currency retranslations 142 (245)
Increase/(decrease) in cash and cash equivalents 196 707
Cash and cash equivalents at beginning of year 5 835 6 594
Cash and cash equivalents at end of period 6 031 7 301
10 Half-Yearly Report of the Nestlé Group 2009

Equity as at 31 December 2008 383 (9 652) (11 103) 71 146 50 774 4 142 54 916
Total comprehensive income 1 553 4 354 5 907 731 6 638
Dividend paid to shareholders of the parent (5 047) (5 047) (5 047)
Dividends paid to non-controlling interests – (653) (653)
Movement of treasury shares (net) (1 366) (21) (1 387) (1 387)
Changes in non-controlling interests – 5 5
Equity compensation plans 134 (20) 114 22 136
Reduction in share capital (18) 8 390 (8 372) – –
Equity as at 30 June 2009 365 (2 494) (9 550) 62 040 50 361 4 247 54 608
Jan
uary
–Ju
ne
20
09
Jan
uary
–Ju
ne
20
08
In millions of CHF
Sh
are
cap
ital
Treasu
ry
share
s
Tran
slatio
n
rese
rve
Reta
ined
earn
ing
s an
d
oth
er
rese
rves
Tota
l eq
uity a
ttri
bu
tab
le t
o
share
ho
lders
of
the p
are
nt
No
n-c
on
tro
llin
g
inte
rest
s
Tota
l
eq
uity
Equity as at 31 December 2007 393 (8 013) (6 302) 66 549 52 627 2 149 54 776
Total comprehensive income (3 113) 4 030 917 238 1 155
Dividend paid to shareholders of the parent (4 573) (4 573) (4 573)
Dividends paid to non-controlling interests – (313) (313)
Movement of treasury shares (net) (2 622) (266) (2 888) (2 888)
Changes in non-controlling interests – 41 41
Equity compensation plans 209 (59) 150 13 163
Reduction in share capital (10) 5 279 (5 269) – –
Equity as at 30 June 2008 383 (5 147) (9 415) 60 412 46 233 2 128 48 361
11Half-Yearly Report of the Nestlé Group 2009
Consolidated statement of changes in equity for the period ended 30 June 2009

12 Half-Yearly Report of the Nestlé Group 2009
13Half-Yearly Report of the Nestlé Group 2009
Notes
Basis of preparation
These fi nancial statements are the unaudited interim consoli-
dated fi nancial statements for the six-month period ended
30 June 2009. They have been prepared in accordance
with IAS 34 – Interim Financial Reporting and should be
read in conjunction with the 2008 Consolidated Financial
Statements.
The accounting conventions and accounting policies
are the same as those applied in the 2008 Consolidated
Financial Statements, except for the changes mentioned
below.
Changes in accounting policies
The Group has applied the following International Financial
Reporting Standards (IFRS) and Interpretations (IFRIC) as
from 1 January 2009 onwards:
IFRS 7 amendments – Financial Instruments: DisclosuresThe IFRS 7 amendments, which require entities to disclose
information about the measurement hierarchy of fi nancial
instruments, will be included in the 2009 year-end Group
fi nancial statements. At the end of June 2009, most of the
Group’s fi nancial instruments are measured on the basis
of prices quoted on active markets (commodity futures)
and on the basis of valuation techniques such as discounted
cash fl ow calculations or other pricing models.
IFRS 8 – Operating segmentsIFRS 8 requires separate reporting of segmental informa-
tion for operating segments. Operating segments refl ect
the Group’s management structure and the way fi nancial
information is regularly reviewed by the Group’s chief
operating decision maker, which is defi ned as the Executive
Board.
The Group is focused in two areas of activity, Food and
Beverages, and Pharmaceuticals. The Group’s Food and
Beverages business is managed through three geographic
Zones and several Globally Managed Businesses (GMBs).
Zones and GMBs, that exceed the quantitative threshold
of 10% of sales, EBIT or assets, are presented on a standalone
basis as reportable segments. Other GMBs that do not meet
the threshold, like Nestlé Professional, Nespresso, and the
food and beverages Joint Ventures, are aggregated and
presented in Other Food and Beverages. The Group’s phar-
maceutical activities are also managed, and presented, sep-
arately. Therefore, the Group’s operating segments are:
– Zone Europe;
– Zone Americas;
– Zone Asia, Oceania and Africa;
– Nestlé Waters;
– Nestlé Nutrition;
– Other Food and Beverages; and
– Pharma.
Comparative information has been restated, considering
that, as from 1 January 2009, Nestlé Professional activities
are managed separately from the three geographic Zones
and, consequently, disclosed in Other Food and Beverages.
As some operating segments represent geographic
zones, information by product is also disclosed. The eight
product groups that are disclosed represent the highest cate-
gories of products that are followed internally. The water
products are now disclosed separately from Powdered
and Liquid Beverages, and the nutrition products from
Milk products and Ice cream. Comparative information
has been restated accordingly.
1. Accounting policies

14 Half-Yearly Report of the Nestlé Group 2009
IAS 1 Revised – Presentation of fi nancial statementsThe standard includes non-mandatory changes of the titles
of the fi nancial statements. The Group has chosen the option
to maintain the existing titles. The standard also introduces
a statement of comprehensive income, but allows present-
ing a two statement approach with a separate income
statement and a statement of comprehensive income,
which is the option that the Group has chosen.
IAS 23 Revised – Borrowing costsThe revised standard removes the option of recognising
as an expense borrowing costs directly attributable to
acquisition, construction or production of a qualifying
asset as previously elected by the Group. This standard
has no material impact on the Group fi nancial statements,
as the construction period of the Group’s main assets is
usually rather short.
IFRIC 13 – Consumer loyalty programmesThis interpretation requires that the fair value of the consid-
eration related to award credits programmes be separately
identifi ed as a component of the sales transaction and rec-
ognised when the awards are redeemed by the customers
and the corresponding obligations are fulfi lled by the Group.
Such programmes are not numerous in the Group and this
interpretation has no material effect on its results. Therefore,
no restatement of comparative information is required.
IFRIC 16 – Hedges of a net investment in a foreign operationThis interpretation deals with the nature of the hedged
risk, its designation and where the hedging instrument
can be held. This interpretation has no impact on the
Group fi nancial statements as the Group already complies
with its requirements.
Improvements and other amendments of IFRSs or IFRICsImprovements or other amendments effective in 2009
do not have a material effect on the Group fi nancial
statements.
Changes in IFRSs that may affect the Group after 31 December 2009
IFRS 3 Revised – Business combinationsThis standard will be effective for the fi rst annual reporting
period beginning on or after 1 July 2009. The Group will
thus apply it prospectively as from 1 January 2010 onwards.
The revised standard will cause the following changes:
– acquisition costs will be expensed;
– for a business combination in which the acquirer
achieves control without buying all of the equity of
the acquiree, the remaining non-controlling interests
are measured either at fair value or at their proportionate
share of the acquiree’s net identifi able assets;
– upon obtaining control in a business combination
achieved in stages, the acquirer shall remeasure its
previously held equity interest at fair value and recognise
a gain or a loss to the income statement; and
– changes in the contingent consideration of an acquisition
will be accounted for outside goodwill, in the income
statement.
IAS 27 Revised – Consolidated and separate fi nancial statements This standard will be applicable prospectively for the fi rst
annual reporting period beginning on or after 1 July 2009.
The Group will thus apply it as from 1 January 2010 onwards.
The revised standard stipulates that a change in the non-
controlling interests of an acquiree that does not result in
a loss of control shall be recognised in equity.

15Half-Yearly Report of the Nestlé Group 2009
Amendments to IAS 39 – Financial Instruments: Recognition and MeasurementAs part of the annual improvements to IFRSs published
in April 2009, IAS 39 was amended to require options that
are exchanged between a buyer and a seller in a business
combination to buy or sell a business at a later date, to be
accounted for as derivative fi nancial instruments. Conse-
quently, such options must be recognised on the balance
sheet and be measured at fair value.
As mentioned in the 2008 Consolidated Financial
Statements, on 7 July 2008, the Group sold 24.8% of
Alcon’s outstanding capital to Novartis. The agreement
further included the option for Novartis to acquire Nestlé’s
remaining shareholding in Alcon at a price of USD 181.–
per share from January 2010 until July 2011. During the
same period, Nestle will have the option to sell its remain-
ing shareholding in Alcon to Novartis at the lower of either
the call price of USD 181.– per share or the average share
price during the week preceding the exercise plus a premium
of 20.5%.
As at June 2009, the outstanding put and call options
are not recognised in the fi nancial statements. As a result of
the amendment to IAS 39, they will have to be recognised
as from 1 January 2010 onwards. The Group is currently
assessing the impact of this amendment.
2. Modifi cation of the scope of consolidation
There were no major acquisitions or disposals affecting the scope of consolidation for this interim period.

16 Half-Yearly Report of the Nestlé Group 2009
Jan
uary
–Ju
ne
20
09
3. Analysis by segment
3.1 Operating segments
In millions of CHF
Zo
ne
Eu
rop
e
Zo
ne
Am
eri
cas
Zo
ne A
sia,
Ocean
ia
an
d A
fric
a
Nest
lé
Wate
rs
Nest
lé
Nu
tritio
n
Sales 12 233 14 355 7 648 4 954 5 176
EBIT Earnings Before Interest, Taxes, restructuring and impairments 1 449 2 152 1 235 357 956
Impairment of segment assets (29) (11) 13 (15) (2)
Restructuring costs (50) (16) (18) (44) (7)
Net other income/(expenses) excluding restructuring and impairments
Net fi nancing cost
Profi t before taxes and associates
Jan
uary
–Ju
ne
20
08
(c)
Sales 10 791 15 197 7 733 4 723 4 995
EBIT Earnings Before Interest, Taxes, restructuring and impairments 1 273 2 307 1 292 392 869
Impairment of segment assets (29) – (1) (9) (1)
Restructuring costs (62) (25) (8) (16) (8)
Net other income/(expenses) excluding restructuring and impairments
Net fi nancing cost
Profi t before taxes and associates
(a) Mainly Nespresso, Nestlé Professional and Food and Beverages Joint Ventures managed on a worldwide basis(b) Mainly corporate expenses as well as research and development costs for Food and Beverages(c) 2008 comparatives have been restated following fi rst application of IFRS 8 to refl ect internal changes in management responsibility as
of 1 January 2009. Globally managed Nestlé Professional activities are now reclassifi ed from the Zones to Other Food and Beverages.
The analysis of sales by geographic area is stated by customer location. Inter-segment sales are not signifi cant.

17Half-Yearly Report of the Nestlé Group 2009
Oth
er
Fo
od
an
d
Bevera
ges
(a)
Un
allo
cate
d
item
s (b
)
Tota
lFo
od
an
dB
eve
rag
es
Ph
arm
a
Tota
l
4 957 49 323 3 743 53 066 Sales
787 (859) 6 077 1 264 7 341 EBIT Earnings Before Interest, Taxes, restructuring and impairments
(6) – (50) (45) (95) Impairment of segment assets
(4) – (139) (22) (161) Restructuring costs
22 Net other income/(expenses) excluding restructuring and impairments
(537) Net fi nancing cost
6 570 Profi t before taxes and associates
4 874 48 313 3 954 52 267 Sales
786 (906) 6 013 1 370 7 383 EBIT Earnings Before Interest, Taxes, restructuring and impairments
– – (40) (21) (61) Impairment of segment assets
(7) – (126) (23) (149) Restructuring costs
8 Net other income/(expenses) excluding restructuring and impairments
(321) Net fi nancing cost
6 860 Profi t before taxes and associates
Jan
uary
–Ju
ne
20
09
Jan
uary
–Ju
ne
20
08
(c)

18 Half-Yearly Report of the Nestlé Group 2009
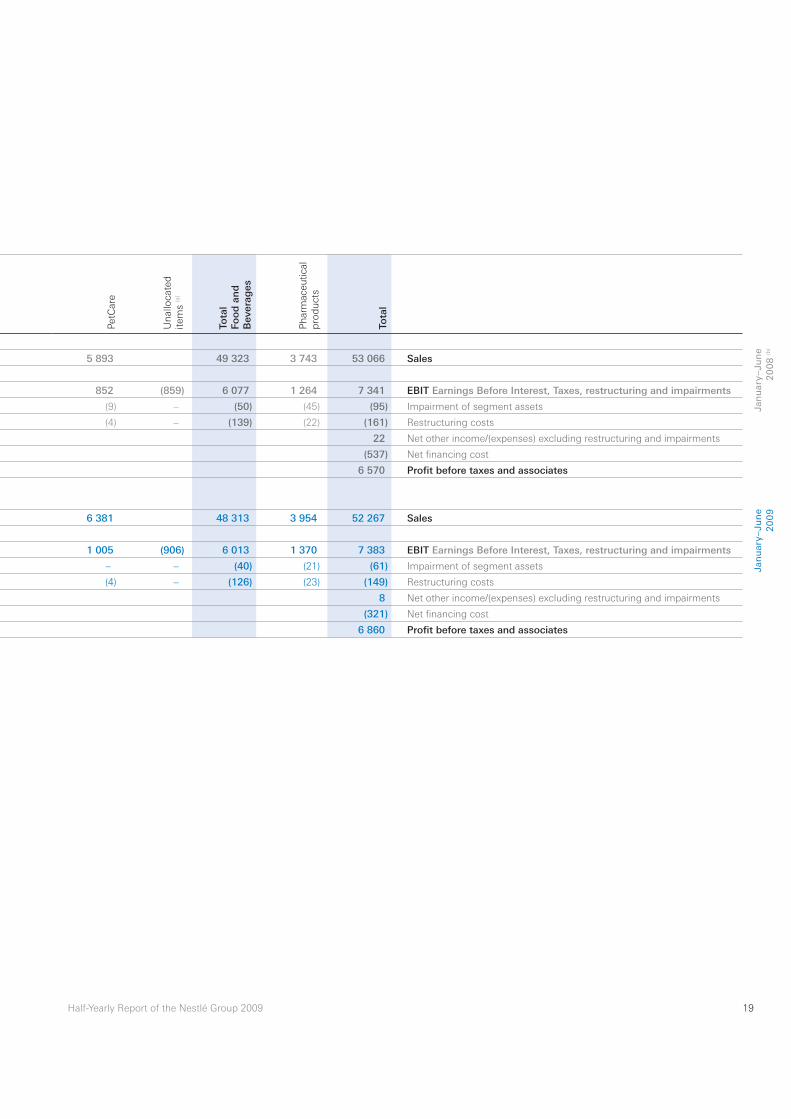
3.2 Products
In millions of CHF
Pow
dere
d
an
d L
iqu
id
Bevera
ges
Wate
r
Milk
pro
du
cts
an
d
Ice c
ream
Nu
tritio
n
Pre
pare
d
dis
hes
an
d
co
okin
g a
ids
Co
nfe
ctio
nery
Sales 9 038 4 957 10 270 5 180 8 555 5 430
EBIT Earnings Before Interest, Taxes, restructuring and impairments 2 071 357 1 148 956 969 583
Impairment of segment assets (1) (15) (7) (2) (16) –
Restructuring costs (12) (44) (23) (8) (35) (13)
Net other income/(expenses) excluding restructuring and impairments
Net fi nancing cost
Profi t before taxes and associates
Sales 9 242 4 726 9 628 4 997 8 221 5 118
EBIT Earnings Before Interest, Taxes, restructuring and impairments 2 016 393 1 057 869 1 003 576
Impairment of segment assets (2) (9) (6) (1) (5) (17)
Restructuring costs (22) (16) (35) (8) (24) (17)
Net other income/(expenses) excluding restructuring and impairments
Net fi nancing cost
Profi t before taxes and associates
(a) Mainly corporate expenses as well as research and development costs for Food and Beverages(b) 2008 comparatives have been restated following fi rst application of IFRS 8. The water products are now disclosed separately from Powdered
and Liquid Beverages, and the nutrition products from Milk products and Ice cream.
Jan
uary
–Ju
ne
20
09
Jan
uary
–Ju
ne
20
08
(b)
19Half-Yearly Report of the Nestlé Group 2009
PetC
are
Un
allo
cate
d
item
s (a
)
Tota
lFo
od
an
dB
eve
rag
es
Ph
arm
aceu
tical
pro
du
cts
Tota
l
5 893 49 323 3 743 53 066 Sales
852 (859) 6 077 1 264 7 341 EBIT Earnings Before Interest, Taxes, restructuring and impairments
(9) – (50) (45) (95) Impairment of segment assets
(4) – (139) (22) (161) Restructuring costs
22 Net other income/(expenses) excluding restructuring and impairments
(537) Net fi nancing cost
6 570 Profi t before taxes and associates
6 381 48 313 3 954 52 267 Sales
1 005 (906) 6 013 1 370 7 383 EBIT Earnings Before Interest, Taxes, restructuring and impairments
– – (40) (21) (61) Impairment of segment assets
(4) – (126) (23) (149) Restructuring costs
8 Net other income/(expenses) excluding restructuring and impairments
(321) Net fi nancing cost
6 860 Profi t before taxes and associates
Jan
uary
–Ju
ne
20
09
Jan
uary
–Ju
ne
20
08
(b)
20 Half-Yearly Report of the Nestlé Group 2009
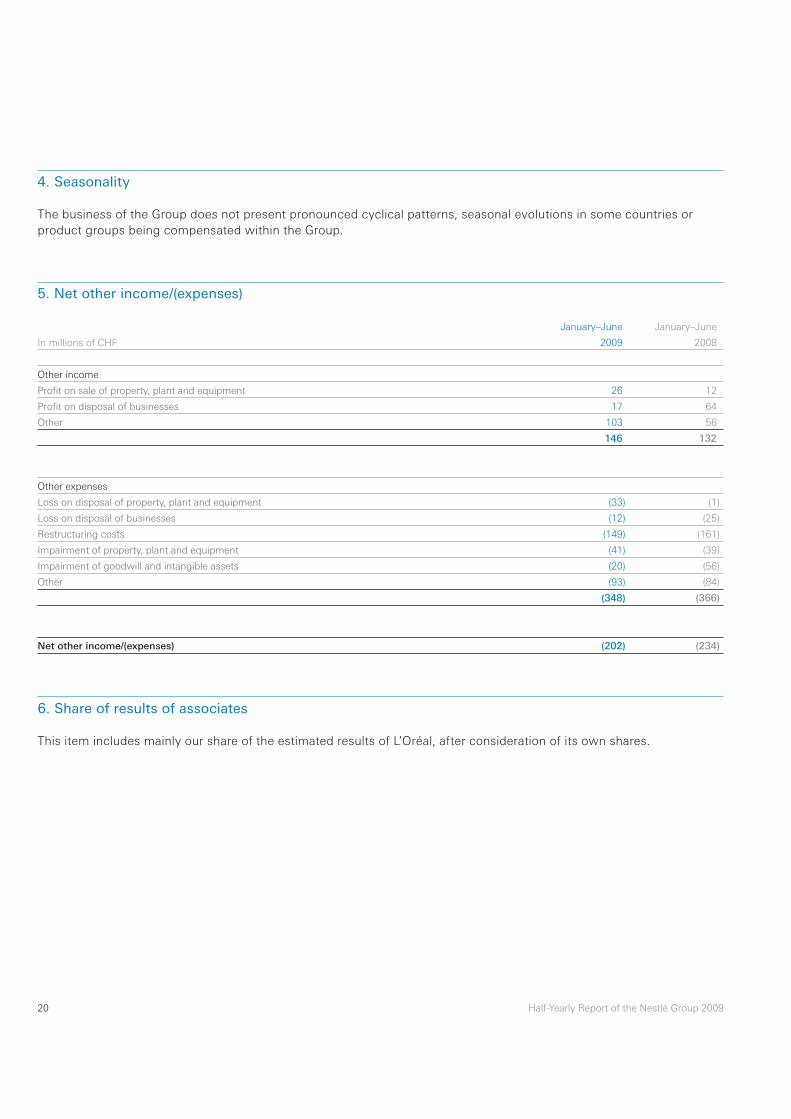
4. Seasonality
The business of the Group does not present pronounced cyclical patterns, seasonal evolutions in some countries or
product groups being compensated within the Group.
5. Net other income/(expenses)
January–June January–June
In millions of CHF 2009 2008
Other income
Profi t on sale of property, plant and equipment 26 12
Profi t on disposal of businesses 17 64
Other 103 56
146 132
Other expenses
Loss on disposal of property, plant and equipment (33) (1)
Loss on disposal of businesses (12) (25)
Restructuring costs (149) (161)
Impairment of property, plant and equipment (41) (39)
Impairment of goodwill and intangible assets (20) (56)
Other (93) (84)
(348) (366)
Net other income/(expenses) (202) (234)
6. Share of results of associates
This item includes mainly our share of the estimated results of L’Oréal, after consideration of its own shares.

21Half-Yearly Report of the Nestlé Group 2009
8. Non-cash items of income and expense
January–June January–June
In millions of CHF 2009 2008
Share of results of associates (521) (612)
Depreciation of property, plant and equipment 1 348 1 294
Impairment of property, plant and equipment 41 39
Impairment of goodwill and intangible assets 20 56
Amortisation of intangible assets 321 300
Net result on disposal of businesses (5) (39)
Net result on disposal of assets (74) 32
Non-cash items in fi nancial assets and liabilities 212 113
Deferred taxes 227 (131)
Taxes in other comprehensive income (121) 63
Equity compensation plans 126 144
1 574 1 259
9. Acquisition and disposal of businesses
Since the valuation of the assets and liabilities of businesses
recently acquired is still in process, the values are determined
provisionally.
Cash outfl ows and infl ows recognised in the fi rst six
months of 2008 and 2009 are related to several small
acquisitions and disposals. The sales and the profi t for
the periods are not signifi cantly impacted by acquisitions
and disposals.
7. Equity
DividendThe dividend related to 2008 was paid on 29 April 2009 in
conformity with the decision taken at the Annual General
Meeting on 23 April 2009. Shareholders approved the pro-
posed dividend of CHF 1.40 per share, resulting in a total
dividend of CHF 5047 million.
Share capitalThe share capital changed twice in the last two fi nancial
years as a consequence of the share buy-back programme
launched in 2007; the cancellation of shares was approved
at the Annual General Meetings of 10 April 2008 and
23 April 2009. In 2008, the share capital was reduced by
10 072 500 shares from CHF 393 million to CHF 383 mil-
lion. In 2009, the share capital was further reduced by
180 000 000 shares from CHF 383 million to CHF 365 million.
At 30 June 2009, the share capital of Nestlé S.A. is
composed of 3 650 000 000 of registered shares with
a nominal value of CHF 0.10 each.

22 Half-Yearly Report of the Nestlé Group 2009
10. Bonds
The following bonds have been issued or repaid during the period:
January–June
In millions of CHF 2009
Issuer
Face value
in millions Coupon
Effective
interest rates
Year of issue/
maturity Comments
New issues
Nestlé Holdings, Inc., USA USD 275 2.00% 2.37% 2009–2013 (a) 307
Nestlé Finance International Ltd., Luxembourg CHF 775 1.25% 1.40% 2009–2012 (b) 768
CHF 875 2.00% 2.08% 2009–2013 (b) 879
CHF 425 2.00% 2.04% 2009–2014 (b) 420
CHF 275 2.13% 2.13% 2009–2014 (b) 277
CHF 350 2.13% 2.20% 2009–2015 (b) 346
Total new issues 2 997
Repayments
Nestlé Holdings, Inc., USA EUR 250 2.13% 2.97% 2005–2009 (a) 358
GBP 200 5.13% 5.38% 2006–2009 (a) 437
Nestlé Finance International Ltd., Luxembourg HUF 25000 7.00% 7.00% 2004–2009 (a) 154
(formerly Nestlé Finance-France S.A., France) EUR 100 3.50% 3.52% 2006–2009 (a) 151
Other 22
Total repayments 1 122
(a) Subject to an interest rate and/or currency swap that creates a liability at fi xed or fl oating rates in the currency of the issuer.(b) Subject to a currency swap to hedge the CHF face value exposure.

23Half-Yearly Report of the Nestlé Group 2009
Principal exchange rates
June December June January–June January–June
CHF per 2009 2008 2008 2009 2008
Ending rates Weighted average rates
1 US Dollar USD 1.080 1.056 1.018 1.131 1.048
1 Euro EUR 1.525 1.488 1.607 1.506 1.606
1 Pound Sterling GBP 1.806 1.527 2.031 1.682 2.071
100 Brazilian Reais BRL 55.248 45.293 63.825 51.663 61.941
100 Japanese Yen JPY 1.131 1.169 0.964 1.179 0.998
100 Mexican Pesos MXN 8.206 7.672 9.888 8.170 9.883
1 Canadian Dollar CAD 0.937 0.868 1.010 0.941 1.038
1 Australian Dollar AUD 0.878 0.731 0.981 0.804 0.971
100 Philippine Pesos PHP 2.245 2.224 2.268 2.367 2.502

24 Half-Yearly Report of the Nestlé Group 2009

Stock exchange listingsNestlé S.A. shares are listed on the SIX Swiss Exchange
(ISIN code: CH0038863350). American Depositary Receipts
(ADRs) (ISIN code: US6410694060) representing Nestlé S.A.
shares are offered in the USA by Citibank.
Registered Offi cesNestlé S.A.
Avenue Nestlé 55, CH-1800 Vevey (Switzerland)
tel. +41 (0)21 924 21 11
Nestlé S.A. (Share Transfer Offi ce)
Zugerstrasse 8, CH-6330 Cham (Switzerland)
tel. +41 (0)41 785 20 20
Further informationTo order additional copies of this document,
please go to
www.nestle.com/Media_Center/order
For additional information, contact
Nestlé S.A., Investor Relations
Avenue Nestlé 55, CH-1800 Vevey (Switzerland)
tel. +41 (0)21 924 35 09
fax +41 (0)21 924 28 13
e-mail: [email protected]
The Half-Yearly Report is available on-line as a PDF fi le
in English, French and German.
As to information concerning the share register
(registrations, transfers, address changes, dividends,
etc.), please contact
Nestlé S.A. (Share Transfer Offi ce)
Zugerstrasse 8, CH-6330 Cham (Switzerland)
tel. +41 (0)41 785 20 20
fax +41 (0)41 785 20 24
e-mail: [email protected]
The Company offers the possibility of depositing, free
of charge, Nestlé S.A. shares traded on the SIX Swiss
Exchange.
Nestlé URL: www.nestle.com
Important dates22 October 2009
Announcement of nine months 2009 sales fi gures;
Autumn press conference
19 February 2010
2009 Full Year Results; press conference
15 April 2010
143rd Annual General Meeting, “Palais de Beaulieu”,
Lausanne
Shareholder information
