half yearly results presentation - ive group
TRANSCRIPT
HALF YEARLY RESULTS PRESENTATION/ FEBRUARY 25, 2016
Geoff Selig – Executive ChairmanDarren Dunkley – Chief Financial Officer
Half Yearly Results Presentation 2
IMPORTANT NOTICENo recommendation, offer, invitation or adviceThis presentation contains general information about the activities of IVE Group Limited (IVE) which is current as at 25 February 2016. It is in summary form and does not purport to be complete. It presents financial information on both a statutory basis (prepared in accordance with Australian accounting standards which comply with International Financial Reporting Standards (IFRS) as well as information provided on a non-IFRS basis. This presentation is not a recommendation or advice in relation to IVE or any product or service offered by IVE’s subsidiaries.
This presentation is not intended to be relied upon as advice to investors or potential investors, and does not contain all information relevant or necessary for an investment decision. It should be read in conjunction with IVE’s other periodic and continuous disclosure announcements filed with the Australian Securities Exchange, and in particular the Half Year Results for the Half Year to 31 December 2015. These are also available at www.ivegroup.com.au. Investors and potential investors should make their own independent assessment of the information in this presentation and obtain their own independent advice from a qualified adviser having regard to their objectives, financial situation and needs before taking any action.
DisclaimerNo representation or warranty, express or implied, is made as to the accuracy, adequacy or reliability of any statements, estimates or opinions or other information contained in this presentation. To the maximum extent permitted by law, IVE, its subsidiaries and their respective directors, officers, employees and agents disclaim all liability and responsibility for any direct or indirect loss or damage which may be suffered by any recipient through use of or reliance on anything contained in or omitted from this presentation. No recommendation is made as to how investors should make an investment decision. Investors must rely on their own examination of IVE, including the merits and risks involved. Investors and potential investors should consult with their own professional advisors in connection with any investment decision in relation to IVE securities.
Forward looking statementsThe information in this presentation is for general information only. To the extent that certain statements contained in this presentation may constitute “forward-looking statements” or statements about “future matters”, the information reflects IVE’s intent, belief or expectations at the date of this presentation. Subject to any continuing obligations under applicable law or any relevant listing rules of the Australian
Securities Exchange, IVE disclaims any obligation or undertaking to disseminate any updates or revisions to this information over time. Any forward-looking statements, including projections, guidance on future revenues, earnings and estimates, are provided as a general guide only and should not be relied upon as an indication or guarantee of future performance. Forward-looking statements involve known and unknown risks, uncertainties and other factors that may cause IVE’s actual results, performance or achievements to differ materially from any future results, performance or achievements expressed or implied by these forward-looking statements.
Investment riskAny investment in IVE securities is subject to investment and other known and unknown risks, some of which are beyond the control of IVE. Any forward-looking statements, opinions and estimates in this presentation are based on assumptions and contingencies which are subject to change without notice, as are statements about market and industry trends, which are based on interpretations of current market conditions. For example, the factors that are likely to affect the results of IVE include, but are not limited to, general economic conditions in Australia, exchange rates, competition in the markets in which IVE operates or may operate and the inherent regulatory risks in the businesses of IVE. Neither IVE, nor any other person, gives any representation, assurance or guarantee that the occurrence of the events expressed or implied in any forward-looking statements in this presentation will actually occur. In addition, please note that past performance is no guarantee or indication of future performance.
JurisdictionThis presentation does not constitute an offer to issue or sell, or solicitation of an offer to buy, any securities or other financial products in any jurisdiction. The distribution of this presentation outside Australia may be restricted by law. Any recipient of this presentation outside Australia must seek advice on and observe any such restrictions. This presentation may not be reproduced or published, in whole or in part, for any purpose without the prior written permission of IVE.
This presentation does not constitute an offer to sell, or a solicitation of an offer to buy, any securities in the United States. Any such securities have not been, and will not be, registered under the U.S. Securities Act of 1933 (Securities Act), or the securities laws of any state or other jurisdiction of the United States and may not be offered or sold, directly or indirectly, in the United States or to, or for the account or benefit of, persons in the United States, except in a transaction exempt from, or not subject to, registration under the Securities Act and applicable US state securities laws.

04 Financial highlights
05 Business highlights
06 Business overview
07 Detailed financials
09 Balance Sheet
10 Cashflow Statement
Table of
CONTENTS
Half Yearly Results Presentation 4
FINANCIAL HIGHLIGHTSPro Forma
H1 FY2016 $’M
H1 FY2015 $’M
% Var $’M
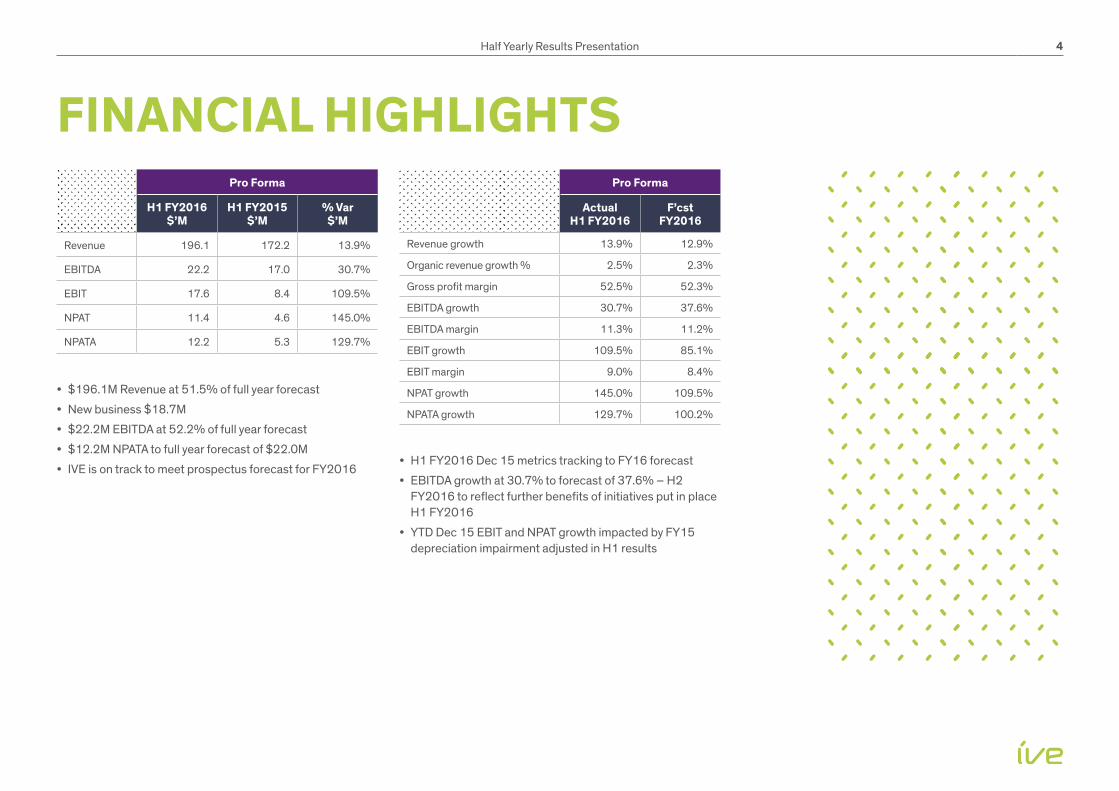
Revenue 196.1 172.2 13.9%
EBITDA 22.2 17.0 30.7%
EBIT 17.6 8.4 109.5%
NPAT 11.4 4.6 145.0%
NPATA 12.2 5.3 129.7%
• $196.1M Revenue at 51.5% of full year forecast
• New business $18.7M
• $22.2M EBITDA at 52.2% of full year forecast
• $12.2M NPATA to full year forecast of $22.0M
• IVE is on track to meet prospectus forecast for FY2016
Pro Forma
ActualH1 FY2016
F’cstFY2016
Revenue growth 13.9% 12.9%
Organic revenue growth % 2.5% 2.3%
Gross profit margin 52.5% 52.3%
EBITDA growth 30.7% 37.6%
EBITDA margin 11.3% 11.2%
EBIT growth 109.5% 85.1%
EBIT margin 9.0% 8.4%
NPAT growth 145.0% 109.5%
NPATA growth 129.7% 100.2%
• H1 FY2016 Dec 15 metrics tracking to FY16 forecast
• EBITDA growth at 30.7% to forecast of 37.6% – H2 FY2016 to reflect further benefits of initiatives put in place H1 FY2016
• YTD Dec 15 EBIT and NPAT growth impacted by FY15 depreciation impairment adjusted in H1 results

Half Yearly Results Presentation 5
REVENUE • Strong new business performance
$18.7m
• Letter of intent executed with Westpac Banking Corporation for the provision of graphic design and print management services. Contract expected to be executed end of March for an expected full service national rollout within the first half of the 2016
• Successful implementation of Vodafone Australia and McDonalds Australia managed solutions contracts in our IVEO division
• Successfully rolled over a number of key contracts across the Group
– Tabcorp, American Express, TAL, Foxtel, RACV, Bupa, QBE Insurance, Flight Centre, Travelcorp, Charles Tyrwhitt, Morris Communications
ACQUISITIONS • The Group continues to actively explore
opportunities for complimentary and earnings accretive acquisitions
• The period saw the successful integration of 3 acquisitions completed late in FY15 (The POS Collective, VaVaVoom, Task2)
• The acquisition of Oxygen8 (completed July 31, 2015) and the Pareto Group (completed October 30, 2015)
CAPITAL EXPENDITURE • The period saw the roll out of a number of
meaningful capital expenditure initiatives across the Group
– Expansion of wide format digital printing footprint in Blue Star DISPLAY ($2.8m)
– Upgrade/replacement sheetfed printing presses in Blue Star PRINT ($2.5m) and Blue Star WEB ($5.7m)
– Automated inline packing solution in Blue Star WEB ($1.7m)
– Relocation of Blue Star DISPLAY, Blue Star PROMOTE and Blue Star CONNECT (Victoria) to new premises ($1.7m)
BUSINESS HIGHLIGHTS

Half Yearly Results Presentation 6
BUSINESS OVERVIEWIVE is a vertically integrated marketing and print communications provider. IVE enables its customers to communicate more effectively with their customers by creating, managing, producing and distributing content across multiple channels.
IVE has an unparalleled product and service offering in Australia and holds leading positions across multiple sectors. IVE delivers its product and service through four operating divisions.
The scale and breadth of IVE’s product and service offering enables customers to access cost effective communications solutions, from a single product or service to a fully integrated multi-channel managed solution.
IVE has sought to position itself in sectors of the industry that allow it to provide broad solutions. In certain sub sectors, the rationalisation and consolidation of the broader print industry over the last 10 to 15 years has improved IVE’s competitive position relative to others and provided it with significant opportunities to strengthen its position in the market and to expand its offering through the execution of its acquisition program.
Given IVE’s diversity of offer, it does not have any one headline competitor that it competes against across its full Addressable Market. Typically IVE has different competitors within each sector.
IVE adopts a solutions-based strategy with its customers. Solutions typically involve the bundling of various products and services to deliver a tailored customer outcome. IVE provides many of its major customers with managed communication solutions that enable a total cost of ownership, focusing on improving the customer’s return on total supply chain or ‘ownership’ cost. This approach has resulted in strong, long-term relationships with customers and provides the opportunity to further expand the range of value added products and services offered to customers.
Figure: IVE’s solutions-based strategy focuses on categories 2 and 3
• Centrally managed, consolidated communications supply chain
• Focus on total supply chain cost, return on marketing spend drives decisions
• Multi-channel campaign management
• Supply chain and inventory management
• Customers typically spend greater than $2m per annum
• Solutions for target industry verticals (e.g. retailing)
• Components of product and service offering bundled to provide a tailored solution
• Customers typically spend greater than $0.5m per annum
• Simple transactional relationships
• Limited engagement on ‘value-add’ opportunities
• Fragmented print procurement with unit cost focus
3.
2.
1.Trend in
customer b
uying
Transactio
nal
Bundled product
and service offerin
g
Total m
anaged
solutions
MA
NY
N
umbe
r of p
rovi
ders
FE
W
LOW Value to customers HIGH
Half Yearly Results Presentation 7
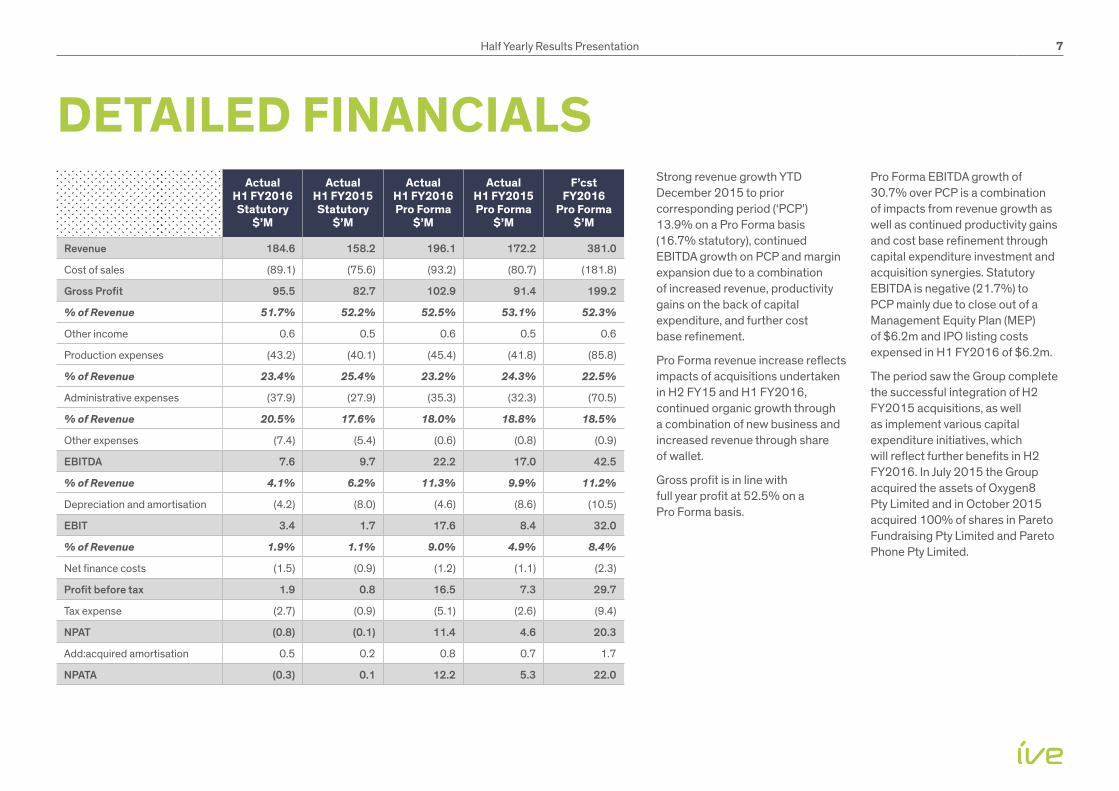
Strong revenue growth YTD December 2015 to prior corresponding period (‘PCP’) 13.9% on a Pro Forma basis (16.7% statutory), continued EBITDA growth on PCP and margin expansion due to a combination of increased revenue, productivity gains on the back of capital expenditure, and further cost base refinement.
Pro Forma revenue increase reflects impacts of acquisitions undertaken in H2 FY15 and H1 FY2016, continued organic growth through a combination of new business and increased revenue through share of wallet.
Gross profit is in line with full year profit at 52.5% on a Pro Forma basis.
Pro Forma EBITDA growth of 30.7% over PCP is a combination of impacts from revenue growth as well as continued productivity gains and cost base refinement through capital expenditure investment and acquisition synergies. Statutory EBITDA is negative (21.7%) to PCP mainly due to close out of a Management Equity Plan (MEP) of $6.2m and IPO listing costs expensed in H1 FY2016 of $6.2m.
The period saw the Group complete the successful integration of H2 FY2015 acquisitions, as well as implement various capital expenditure initiatives, which will reflect further benefits in H2 FY2016. In July 2015 the Group acquired the assets of Oxygen8 Pty Limited and in October 2015 acquired 100% of shares in Pareto Fundraising Pty Limited and Pareto Phone Pty Limited.
DETAILED FINANCIALSActual
H1 FY2016 Statutory
$’M
Actual H1 FY2015 Statutory
$’M
Actual H1 FY2016 Pro Forma
$’M
Actual H1 FY2015 Pro Forma
$’M
F’cst FY2016
Pro Forma $’M
Revenue 184.6 158.2 196.1 172.2 381.0
Cost of sales (89.1) (75.6) (93.2) (80.7) (181.8)
Gross Profit 95.5 82.7 102.9 91.4 199.2
% of Revenue 51.7% 52.2% 52.5% 53.1% 52.3%
Other income 0.6 0.5 0.6 0.5 0.6
Production expenses (43.2) (40.1) (45.4) (41.8) (85.8)
% of Revenue 23.4% 25.4% 23.2% 24.3% 22.5%
Administrative expenses (37.9) (27.9) (35.3) (32.3) (70.5)
% of Revenue 20.5% 17.6% 18.0% 18.8% 18.5%
Other expenses (7.4) (5.4) (0.6) (0.8) (0.9)
EBITDA 7.6 9.7 22.2 17.0 42.5
% of Revenue 4.1% 6.2% 11.3% 9.9% 11.2%
Depreciation and amortisation (4.2) (8.0) (4.6) (8.6) (10.5)
EBIT 3.4 1.7 17.6 8.4 32.0
% of Revenue 1.9% 1.1% 9.0% 4.9% 8.4%
Net finance costs (1.5) (0.9) (1.2) (1.1) (2.3)
Profit before tax 1.9 0.8 16.5 7.3 29.7
Tax expense (2.7) (0.9) (5.1) (2.6) (9.4)
NPAT (0.8) (0.1) 11.4 4.6 20.3
Add:acquired amortisation 0.5 0.2 0.8 0.7 1.7
NPATA (0.3) 0.1 12.2 5.3 22.0

Half Yearly Results Presentation 8
DETAILED FINANCIALSRECONCILIATION STATUTORY REVENUE AND NPAT TO PROFORMA
ActualH1 FY2016
$’M
F’cstFY2016
$’M
Statutory Revenue 184.6 368.2
Pareto Group statutory revenue
11.5 12.8
Proforma revenue 196.1 381.0
Statutory NPAT (0.8) 8.3
Pareto Group statutory PBT 1.9 2.1
Pareto Group acquisition costs 0.6 0.5
Listed company expenses (0.4) (0.5)
Management equity plan 6.2 6.2
Offer costs 6.2 5.9
Net finance costs 0.3 0.4
Deferred consideration on acquisition
0.0 0.3
Tax effect on adjustments (2.7) (2.8)
Pro forma NPAT 11.4 20.3
Main reconciliation items statutory to Pro Forma• Pareto revenue and PBT for pre acquisition period
1st July–31st October 2015.
• Cost to close out MEP
• Costs associated with IPO
Half Yearly Results Presentation 9
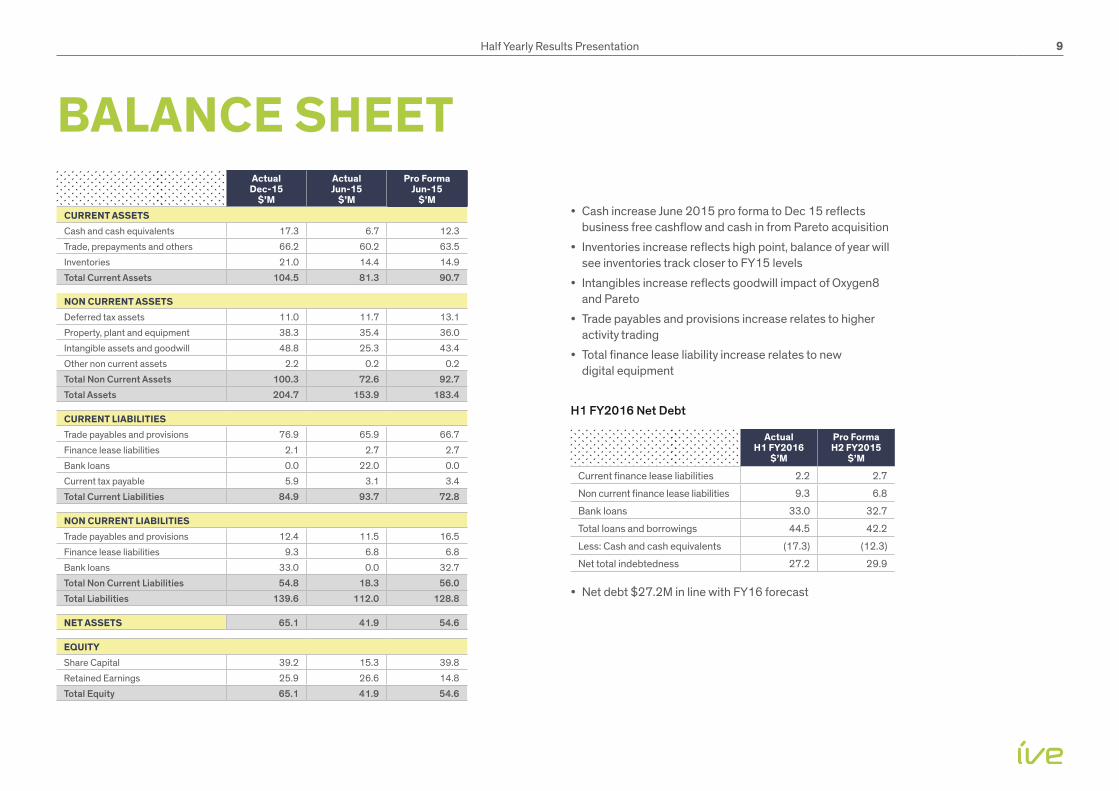
Actual Dec-15
$’M
Actual Jun-15
$’M
Pro Forma Jun-15
$’MCURRENT ASSETSCash and cash equivalents 17.3 6.7 12.3
Trade, prepayments and others 66.2 60.2 63.5
Inventories 21.0 14.4 14.9
Total Current Assets 104.5 81.3 90.7
NON CURRENT ASSETSDeferred tax assets 11.0 11.7 13.1
Property, plant and equipment 38.3 35.4 36.0
Intangible assets and goodwill 48.8 25.3 43.4
Other non current assets 2.2 0.2 0.2
Total Non Current Assets 100.3 72.6 92.7
Total Assets 204.7 153.9 183.4
CURRENT LIABILITIESTrade payables and provisions 76.9 65.9 66.7
Finance lease liabilities 2.1 2.7 2.7
Bank loans 0.0 22.0 0.0
Current tax payable 5.9 3.1 3.4
Total Current Liabilities 84.9 93.7 72.8
NON CURRENT LIABILITIESTrade payables and provisions 12.4 11.5 16.5
Finance lease liabilities 9.3 6.8 6.8
Bank loans 33.0 0.0 32.7
Total Non Current Liabilities 54.8 18.3 56.0
Total Liabilities 139.6 112.0 128.8
NET ASSETS 65.1 41.9 54.6
EQUITYShare Capital 39.2 15.3 39.8
Retained Earnings 25.9 26.6 14.8
Total Equity 65.1 41.9 54.6
• Cash increase June 2015 pro forma to Dec 15 reflects business free cashflow and cash in from Pareto acquisition
• Inventories increase reflects high point, balance of year will see inventories track closer to FY15 levels
• Intangibles increase reflects goodwill impact of Oxygen8 and Pareto
• Trade payables and provisions increase relates to higher activity trading
• Total finance lease liability increase relates to new digital equipment
H1 FY2016 Net Debt
ActualH1 FY2016
$’M
Pro FormaH2 FY2015
$’M
Current finance lease liabilities 2.2 2.7
Non current finance lease liabilities 9.3 6.8
Bank loans 33.0 32.7
Total loans and borrowings 44.5 42.2
Less: Cash and cash equivalents (17.3) (12.3)
Net total indebtedness 27.2 29.9
• Net debt $27.2M in line with FY16 forecast
BALANCE SHEET
Half Yearly Results Presentation 10
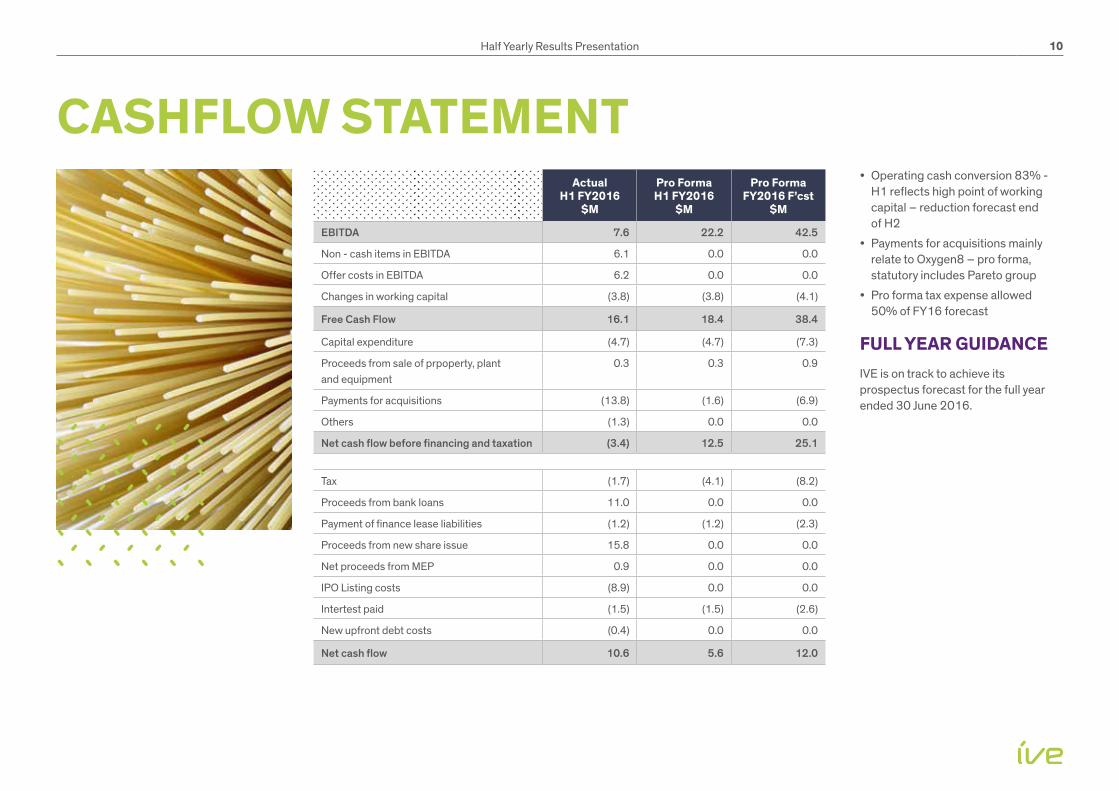
• Operating cash conversion 83% - H1 reflects high point of working capital – reduction forecast end of H2
• Payments for acquisitions mainly relate to Oxygen8 – pro forma, statutory includes Pareto group
• Pro forma tax expense allowed 50% of FY16 forecast
FULL YEAR GUIDANCE IVE is on track to achieve its prospectus forecast for the full year ended 30 June 2016.
CASHFLOW STATEMENTActual
H1 FY2016$M
Pro FormaH1 FY2016
$M
Pro FormaFY2016 F’cst
$M
EBITDA 7.6 22.2 42.5
Non - cash items in EBITDA 6.1 0.0 0.0
Offer costs in EBITDA 6.2 0.0 0.0
Changes in working capital (3.8) (3.8) (4.1)
Free Cash Flow 16.1 18.4 38.4
Capital expenditure (4.7) (4.7) (7.3)
Proceeds from sale of prpoperty, plant and equipment
0.3 0.3 0.9
Payments for acquisitions (13.8) (1.6) (6.9)
Others (1.3) 0.0 0.0
Net cash flow before financing and taxation (3.4) 12.5 25.1
Tax (1.7) (4.1) (8.2)
Proceeds from bank loans 11.0 0.0 0.0
Payment of finance lease liabilities (1.2) (1.2) (2.3)
Proceeds from new share issue 15.8 0.0 0.0
Net proceeds from MEP 0.9 0.0 0.0
IPO Listing costs (8.9) 0.0 0.0
Intertest paid (1.5) (1.5) (2.6)
New upfront debt costs (0.4) 0.0 0.0
Net cash flow 10.6 5.6 12.0
