hampton roads sanitation district y c ll th t g d d t ? h...
TRANSCRIPT

Y C ll Th t G d D t ? H t S i Hampton Roads Sanitation District
You Call That Good Data? How to Survive a Consent Decree Flow Monitoring Program
September | 2011

You Call That Good Data? How to Survive a Consent Decree Flow Monitoring Program
Project Team
HRSD Brown and Caldwell
Project Team
HRSDKim PetersonPhil Hubbard
Brown and CaldwellChris WilsonJoe Swaim
Laura KirkwoodSarah Crawford
Crystal MullerJordan KincaidLisa JeffreyLisa Jeffrey
2Brown and Caldwell

HRSD Service Area
• Serves S th t
HRSD Service Area
Southeast Virginia
• 1.6 million people
• 430 miles of force mainsforce mains
• 80+ PS
• 50 miles gravity g ypipe
• 9 major treatment plantstreatment plants
3Brown and Caldwell

BackgroundBackground
• Previous Consent Orders• Norfolk• Hampton
• Master Metering Program contracts• Boundary metersy• Treatment plants• Some pumping stationsp p g• Data collected through SCADA
• Miscellaneous gravity flow monitoringMiscellaneous gravity flow monitoring
Brown and Caldwell 4

HRSD Flow Monitoring Program• New Consent Order and
Consent Decree
HRSD Flow Monitoring Program
Consent Decree• Regional Hydraulic Model
• Expand existing networkExpand existing network• 117 pressure monitoring sites• 137 flow monitoring sites• 64 rain gauge sites• 21 groundwater monitoring sites• 39 IWD sites 39 IWD sites
• Significant installation effort• Negotiated scheduleNegotiated schedule
• Standardized equipment5Brown and Caldwell

6Brown and Caldwell

Program Changes
• Pressure side to gravity
Program Changes
• Pressure-side to gravity flow metering in some locations
• Meter selection
• Location changesg
• Policy changes
• Schedule delaysSchedule delays
• Kept regulators in the loop• Kept regulators in the loop
7Brown and Caldwell

Data Collection• 12 month program
• Utilizing Telog ® system
Data Collection
• Utilizing Telog system
• Developed Data Quality Standards and Procedures (DQSAP)(DQSAP)
• Reliability requirements: • 75% for each individual 75% for each individual
meter during each monthly monitoring period
• 90% data reliability for all ydata for each sensor type during qualifying wet weather events
8Brown and Caldwell
DQSAPDQSAP
• Additional measurements recorded for QA/QC purposes:• wet well levels• pump run status• pump speed• pump speed
• ~ 190,000 data points go through a daily QA/QC through a daily QA/QC process to ensure data reliabilityreliability
Brown and Caldwell 9

Data Review ProcessData Review Process
• Increased staff based on amount of data to review• HRSD Data Analysis Section (3+ FTEs)y ( )• Consultant staff (2+ FTEs)• Flow monitoring vendorsFlow monitoring vendors
• Manual reviews and automated reviews
• Automation made process more efficient
Brown and Caldwell 10

Automated AlertsAutomated Alerts
•Utilized Telog® Enterprise Utilized Telog Enterprise software
D t t d i SQL •Data stored in SQL server database
•Deviation measured as compared to “normal” conditionscompared to normal conditions
Brown and Caldwell 11
Automated Alerts (continued)Automated Alerts (continued)
• Alert automation using SQL gfunctions that were programmed within the software as well as the data server by Telog®the data server by Telog®
• Added calculated measurements i hi h th l t SQL in which the alert SQL statements would calculate from
• More than 3,000 alerts programmed for the QA/QC processprocess
Brown and Caldwell 12

Alert DefinitionsAlert Potential Anomaly Regime Time Step
Flow, sensor
Potential sensor fouling and/or failure as indicated by flat lining and where there is insufficient difference between minimum,
average and maximum values
Wet and dry weather Hourly
average, and maximum values.
Flow, deviation % deviation from a 4-week dry weather rolling average Dry weather Hourly, Daily
Flow, upstream Upstream flow exceeds downstream Wet and dry weather Daily
Flow, downstream Downstream flow less than upstream Wet and dry weather Daily
Flow, wet weather peak Peak factor outside of expected range Wet weather Daily
P d th k Peak pressure compared to a 4-week D th H lPressure, dry weather peak p pdry weather rolling average Dry weather Hourly
Pressure, sensor
Potential sensor fouling and/or failure as indicated by flat lining and where there is insufficient difference between minimum,
average, and maximum values.
Wet and dry weather Hourly
Pressure Deviation % deviation from a 4-week dry weather rolling average Dry weather Hourly, Daily
Pressure, wet weather peak Peak pressure outside of expected range Wet weather Daily
Rainfall 25% greater than adjacent
Brown and Caldwell 13
Rainfall Rainfall 25% greater than adjacent gauge Wet Weather Hourly

Flow/Pressure Deviation AlertFlow/Pressure Deviation Alert
• Useful in identifying:y g• Inflow/Infiltration (I/I) effects• Recent calibrationRecent calibration• System diversion• System bypassSystem bypass• Instrument fouling or failure
Brown and Caldwell 14

Flow Deviation AlertFlow Deviation Alert
Brown and Caldwell 15

Pressure AlertPressure Alert
Brown and Caldwell 16
Automated Alert ExceptionsAutomated Alert Exceptions
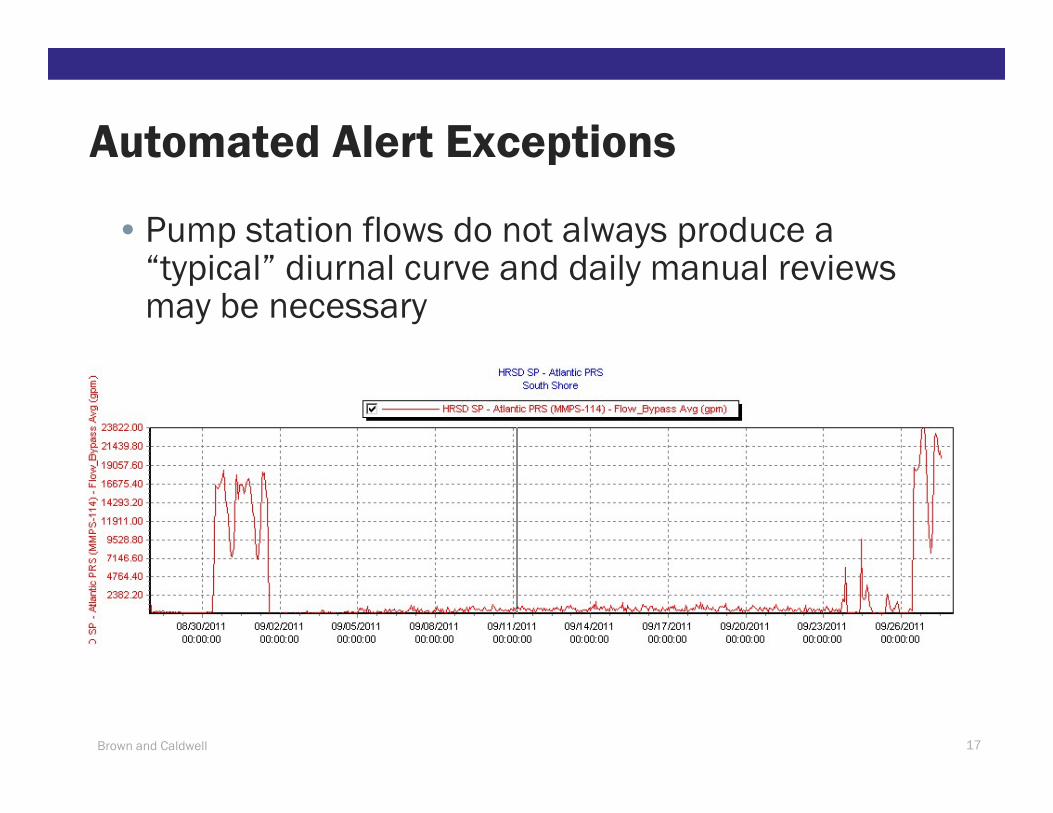
• Pump station flows do not always produce a “typical” diurnal curve and daily manual reviews may be necessary
Brown and Caldwell 17

Automated Work OrdersAutomated Work Orders
T l ® SQL l b b SMS • Telog® SQL alerts can be sent by SMS text, email, or paging system
• Email alerts are routed into the Numara • Email alerts are routed into the Numara Track-It!® software to create automated work orders
• Generated continuously (overnight, weekends, and holidays) and are ready for the analysts to analyze upon their return analyze upon their return
• Automated work orders are reviewed daily and deemed either valid or invalid
Brown and Caldwell 18

Track-It! Work Order SOPTrack It! Work Order SOP• Data analyst reviews automated
alert work orders (or generates alert work orders (or generates work order based on manual review) and forwards to supervisor with sufficient supervisor with sufficient documentation
• Supervisor reviews and issues Supervisor reviews and issues to HRSD Instrumentation or Interceptor Operations staff for field investigationfield investigation
• Upon resolution, Track-It! work order is closed
• Dashboard and reporting useful for management• Dashboard and reporting useful for management
Brown and Caldwell 19

Data Reliability Data Reliability
Approximately 2,000 alerts received and resolved th gh th N T k It!® ft through the Numara Track-It!® software on a monthly basis
Brown and Caldwell 20

Flagging Invalid DataFlagging Invalid Data
• Need to close the loop on data reliabilitreliability
• Analyst identifies start and end times for the invalid datafor the invalid data
• From the timestamp highlighted in Telog® , analyst can report the Telog , analyst can report the percent of valid/invalid data for the selected timeframe
• Standard report was created by Telog® software engineers
Brown and Caldwell 21

Flagging Invalid DataFlagging Invalid Data
22

Change in RequirementsChange in Requirements
• Original data reliability Original data reliability requirements impractical
• Intent was to provide sufficient pdry weather data for model calibration
• Worked with regulators to explain issue
• Adjusted requirement to 75% • Adjusted requirement to 75% reliability at 90% of all sites each month AND 90% of model calibration sites
Brown and Caldwell 23
Other DQSAP ChangesOther DQSAP Changes
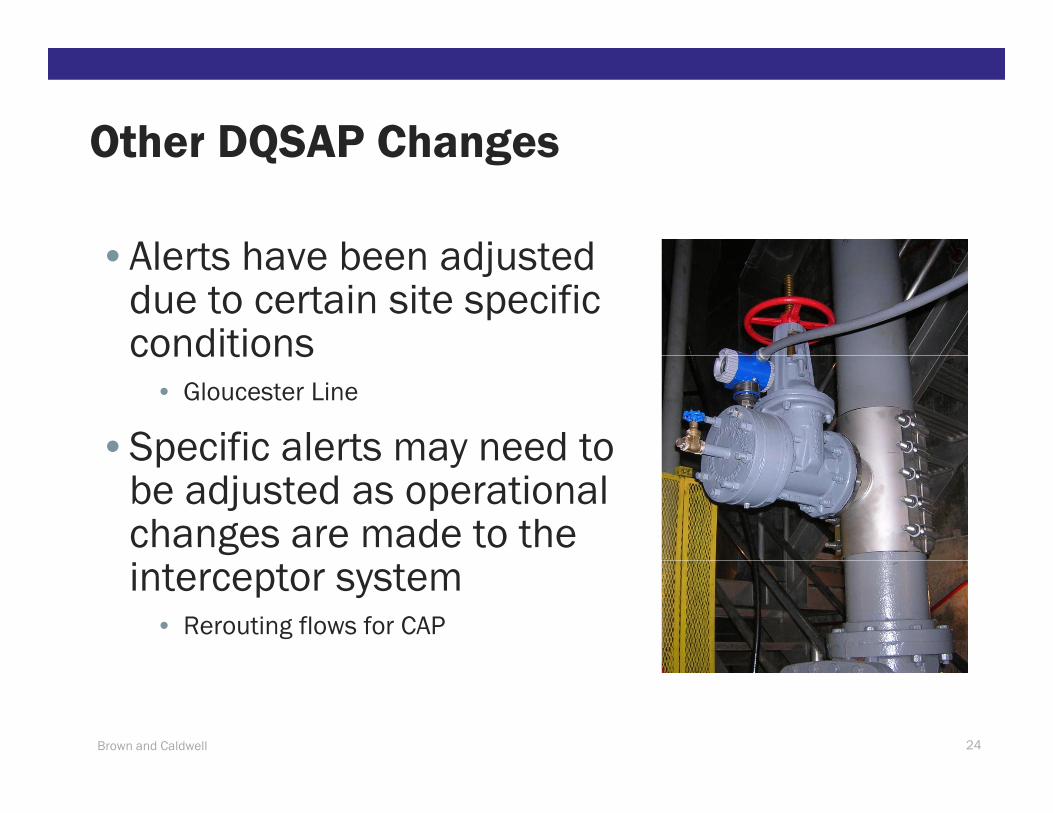
• Alerts have been adjusted • Alerts have been adjusted due to certain site specific conditionsconditions
• Gloucester Line
• Specific alerts may need to Specific alerts may need to be adjusted as operational changes are made to the interceptor system
• Rerouting flows for CAP
Brown and Caldwell 24

Final Results • Collected and reviewed Final Results Collected and reviewed more than 70,000,000 points of raw data
• Captured FPR data from 19 wet weather events
M d d li bili • Met updated reliability standards for all 12 months of programp g
• Regional Hydraulic Model calibration events had aggregate data reliability between 95% and 100% for all three required for all three required events
Brown and Caldwell 25

ReportingReporting
I t i R t• Interim Report• After first 5 months of
data
• Final Report• Overall Summary• Program Changes• Data ReliabilityData Reliability• Tabular Data• Graphs/Scatterplots• Raw data
Brown and Caldwell 26

Report FiguresReport Figures
Brown and Caldwell 27

Lessons LearnedLessons Learned
• Spend lots of time identifying p y gbest places for metering
• Allow schedule float for permanently installed meters
• Plan staffing based on level of data review effortsdata review efforts
• Automate alerts
• Utilize alert tracking system
• Keep regulators in the loop
Brown and Caldwell 28
