hampton roads supply chains and their impact on … white paper hampton roads supply chains and...
TRANSCRIPT

1
WHITE PAPER
Hampton Roads Supply Chains and their Impact on the
City of Portsmouth
February 4, 2009
James Bradley, Ph.D.
Hector Guerrero, Ph.D.
Mason School of Business
College of William and Mary
Williamsburg, VA. 23187-8795

2
Executive Summary This white paper discusses the supply chains that flow through Portsmouth and the Hampton
Roads marine terminals in general, while highlighting the competitive strengths of our port, which include:
1. Deep water to accommodate ships with large capacity, 2. Hamptons Roads’ proximity to a significant portion of the United States population, 3. The future improvement to the Heartland Corridor rail line, and 4. The Virginia Inland Port which extends the footprint of the Port of Virginia past the
immediate Hampton Roads area.
In addition to describing how retailers, railroad, trucking, and barge companies move imports and exports through Portsmouth, we describe various strategies that can improve the capacity of the port (thus reducing time to get goods out of the port and increasing the port’s competitiveness), while attempting to minimize traffic congestion in Portsmouth and the burden on infrastructure that is supported by that municipality.
In some parts of the country, those strategies include construction of large-scale intermodal parks and inland port terminals (such as the Virginia Inland Port), and supporting the development of innovative rail and barge transportation options. Inland ports and large-scale intermodal parks concentrate activity related to imports, which can make investments in rail and barge connections to those locations more economical, thus possibly removing traffic from highways and surfaces streets. We point out, however, four barriers to making those strategies successful.
First, those solutions must be executed in a manner such that they provide for economical and timely movement of goods. If transportation and distribution through the new intermodal parks and inland port terminals are significantly more expensive than existing modes of transit, then we cannot expect shippers and their agents, who are motivated by profit, to use that infrastructure. Furthermore, even if those solutions are economical, transit time is a critical consideration of transportation companies whose customers are increasingly demanding more expedient delivery; thus, these solutions must also minimize transportation delay. We present an in-depth analysis of the Alameda Corridor, which demonstrates that a high-capacity rail link between ports and long-haul rail lines may not be used to the extent expected if access to the corridor is difficult, costs of using the corridor are too expensive, or using the corridor imposes onerous shipping delays.
Second, any monetary or regulatory incentive to artificially shape supply chain flows outside free market mechanisms must be pursued with caution. For example, there are fears that the PierPASS charge for picking up containers at port terminals during heavy-traffic hours at the ports in Long Beach and Los Angeles is driving companies to redirect their supply chains through competing ports. Thus, all the constituents of the port must be mindful of how their actions affect other constituents and the competitiveness of the port in general.
The third barrier flows directly from the previous observation: the planning for the development of the infrastructure serving the port which influences the flow of goods through

3
the Portsmouth marine terminals, and the terminals of Hampton Roads in general, must be done in a collaborative manner involving all constituencies. Fortunately, organizations exist whose mission is precisely to facilitate that collaboration; for example, the Hampton Roads Planning District Commission (HRPDC) as well as many other interest groups and commissions.
Finally, it should be noted that there are important capacity issues related to resources that must be considered. At the time of the writing of this analysis (first quarter of 2009), there has been a substantial slowdown in Port activity that has led to excess capacity of existing resources related to warehousing/distribution. Anecdotally, it is believed that there may be as many as 10 million square feet of warehouse space that is unused or substantially underused in Hampton Roads. The result is a considerable economic difficulty for existing local warehousing/distribution businesses. Under these circumstances, the promotion of alternatives that may add two times to as many as six times more capacity requires very careful analysis—is the capacity that is needed already available, is the appropriate type of capacity by location and capability available, and will adding capacity further exacerbate an already difficult problem for existing businesses?
Our recommendation to Portsmouth is to continue, or to elevate the collaborative approach to planning for traffic out of the port by taking the following measures using these organizations as a conduit for collaboration:
• We would be happy to meet with yourself, George Brisbane, or other appropriate Portsmouth officials to discuss the contents of this report and whether using collaborative partners, like HRPDC, to foster a more collaborative, coordinated approach among the port’s constituents to developing a transportation and distribution solution is desired by Portsmouth.
• Pursue collaborative partner involvement to introduce the issue of broad-based collaboration to partners using this white paper as a motivation.
• Remain open to all stakeholders and constituencies’ input, particularly given the dynamic nature of the port’s part in the overall economy
Summary of Implications and Recommended Action for Portsmouth
There are important implications for Portsmouth’s planning when considering the current and future development of Hampton Roads Port facilities (e.g. Craney Island). These can be summarized as follows:
1. The complexity of the Hampton Roads Supply chains suggests that a thorough and complete understanding of the logistics system in Hampton Roads comprised of the many supply chain resources that are operated by many parties is necessary if economic development and traffic mitigation activities are to be successful. All stakeholders involved must coordinate their efforts through close interaction to create a port that allows shippers economical and expedient logistics, as well as serving the interests of the municipalities in limiting traffic congestion. A scheduled series of focused meetings to maintain awareness of issues and plans is important. This would include stakeholders from the ports (e.g. VPA, VIT, Maersk, etc), transportation (e.g. Commonwealth Railway, NS, CSX, and trucking and barge

4
operations), warehousing/distribution (local warehousing facilities—NYK, Centerpoint Development, Wal-Mart, Target, etc).
2. Other metropolitan areas have experience with strategies for coping with economic growth from ports and are discussed in this paper: for example, the Los Angeles metropolitan area has learned a great deal about rail connections to port terminals through the Alameda Corridor as a form of congestion mitigation, and much analysis has also been done on intermodal parks. As the constituencies mentioned above convene, these histories should be closely studied—they offer an inventory of successes and pitfalls that can help the Hampton Roads area mitigate concerns as strategies to avoid road congestion are pursued. Contacting individuals knowledgeable about, and involved with, these histories will be quite useful and might reveal more opportunities than those documented here. Focusing discussions of the constituencies mentioned above on resolving the performance deficiencies experienced in initiatives such as the Alameda Corridor, intermodal parks, and the existing Commonwealth Railway offers a path toward attaining the best solution possible in maximizing the benefits of rail and barge transportation and, thus, removing traffic from highways and surface streets. Additionally, it is important to understand the limitations of these alternatives, as well as their possible intended and unintended consequences on existing infrastructure capacity.
3. Ultimately, the market place will determine the success of our ports. Hampton Roads has some impressive competitive advantages, but must be cautious in imposing externalities for the sake of traffic management that lead to higher cost of operation for firms using our ports, distribution/warehousing and transportation facilities. These externalities (e.g., road restrictions and tariffs), although often justifiable, can be translated directly into costs that must be borne by firms conducting business with our ports. Close analysis and scrutiny of these initiatives prior to execution should be conducted broadly and with an understanding that they are not costless. This suggests that a holistic, or Cluster, perspective should be considered, a perspective that unites the many and disparate parts of the Supply Chain system.

5
HAMPTON ROADS SUPPLY CHAINS AND THEIR IMPACT ON THE
CITY OF PORTSMOUTH
Introduction
The Ports of Virginia are a powerful economic engine for the Hampton Roads (HR) area. In
2008 the Virginia Port Authority (VPA) reported- “Annually, port-related business provides over
343,000 jobs, $13.5 billion in payroll revenues, and $1.2 billion in local tax revenues.”1 A recent
economic impact study also found the port-related business generated over 100,000 jobs with a
total compensation over $4 billion in HR, as well as over $12 billion in revenues for local
companies.2 The HR area benefits greatly from this financial activity, particularly as defense
spending begins to slow its pace of increase.3
1 Virginia Port Authority, Comprehensive Financial Annual Report, June 30, 2008--found on the official VPA
site http://www.vaports.com/index.asp
Along with the benefits of our ports come the
inevitable disruptions to daily activities (traffic congestion, development, etc.) that accompany
any commercial enterprise. This white paper is intended to provide the reader with an
understanding of the structure, operations, and implications of modern supply chains and supply
chain logistics system, how those supply chains affect municipal traffic flows, and how the
effects of increased economic activity can be managed. As is the case with most white papers, it
is also focused on providing the reader with information that permits good decision making.
2 The Fiscal year 2006 Virginia Economic and Fiscal Impacts of Virginia Port Authority Operations, The Compete Center of the College of William and Mary, January 2008.
3 In past decades HR has seen double digit growth in defense spending and this is quickly coming to an end. Compounding this decline is the possible loss of a carrier strike force.

6
The past several years have been among some of the most volatile and disruptive in decades.
Economic turmoil and commodity volatility have led to difficulties in prediction and planning
for the orderly flow of goods into and out of our ports, and it appears that we will continue to
experience these disruptions into the foreseeable future. This is all the more reason that a firm
understanding of the drivers affecting supply chains and supply chain logistics is important to
their future development in the HR area. For example:
1. The cost of fuel often affects the transportation mode selection process.
2. The availability of supply chain links, such as warehousing, cross-dock facilities, and
intermodal links determines how shipping choices are made.
3. The conditions of the domestic and world economy (demand for goods and the
location of supply) dictate the broad decisions of locating assets such as intermodal
parks, rail lines and yards, and new roads and/or road expansion.
In §1.0, Introduction to Modern Supply Chains, we discuss the supply chains and supply
chain logistics and the drivers mentioned above. This section includes several subsections:
Supply Chain Essentials, Logistics, Transportation as a Cluster, and Supply Chains in Hampton
Roads Marine Terminals. In §2.0 we discuss in general terms Product Flows through Hampton
Roads Marine Terminals. Two case studies, Alameda Corridor and Centerpoint Intermodal
Park Development, relevant to the development of Hampton Roads follow in §3.0 and §4.0,
respectively. §5.0 provides a Contact List of Organizations Involved in Hampton Roads
Transportation and §6.0 provides a Summary and Conclusions.

7
1.0 Modern Supply Chains and Supply Chain Logistics
The study of supply chains and the associated logistics systems that provide orderly and
efficient flow of goods is a relatively recent science. For years practitioners have had available
the many tools necessary to build and organize supply chains, but it is only in the last three
decades that the tools have been used systematically to optimize supply chains. A firm
understanding of supply chains requires that we not only consider the tools used to manage
them—transportation information systems, inventory management, warehouse network planning,
etc.—but also the resources that are at their core — ports, warehouses, road and rail
infrastructure, business logistics resources, etc. In this section we review the essentials of the
supply chain and the attendant logistics systems and resources. We also discuss how supply
chains are evolving and the implications for areas surrounding ports, including the Hampton
Roads area.
1.1 Supply Chain Essentials
Let us begin with a simple model of a supply chain. This example is a far-flung supply
chain that begins with a demand for goods produced internationally, then shipped to a port in the
U.S. (for example, Portsmouth Marine Terminal or APM Terminals), moved through the port
gate by truck or rail, sent to a import distribution center, then to a regional distribution center,
and finally to a operations facility, which can be a manufacturing facility where the imported
goods are raw materials for production or a retail store where the goods are sold. Although this
example may have more links than many supply chains, it has the advantage of being the most
complete example; thus, its comprehensive nature will permit focus on all the complex issues

8
that arise from operating supply chains. Even more importantly, this is a global supply chain for
imported goods, which is the type of supply chain for which APM Terminals, Portsmouth
Marine Terminal and the future Craney Island Marine terminals play an instrumental role.
Exhibit 1 shows the general and comprehensive nature of supply chains. This international
supply chain is quite typical of the supply chains associated with the VPA port terminals
(including Portsmouth Marine Terminal) and the APM Terminals facility. Each element in the
supply chain performs a specific activity that contributes to the flow of goods: Exhibit 2 provides
a brief description of the elements. Although the flow of cargo in this supply chain as shown is
from international sources (imports) the flow can also reversed to reflect the flow to international
locations. Exports, of course, have become of great importance to our Virginia economy and
provide similar economic benefit to the ports and surrounding municipalities.
Exhibit 1—International Supply Chain Example
Ocean Port
TransportMode
Port Storage Capacity
Pier Gate
Landside
Inland Staging Center
Operations Facility
Consumer
Ro-Ro
Liquid Bulk
Containers
Solid Bulk
.
.
.etc.
= stock= flow rate
2
3
4
5
6 8
71
10
9
Capacity Capacity
Flow of Goods Through Supply Chain
11
Import DC Regional DC
13
12
Intermodal Transport

9
Some supply chains are spontaneously structured to accommodate sporadic or ad hoc
shipments that are infrequent or one-time occurrences, while other highly structured supply
chains for ongoing, continual flow of goods are planned well in advance and have a stable
structure both in terms of the links of the chain and which companies provide the resources at
each link. Let us consider supply chains for specific goods that are at the extreme ends of the
spectrum for supply chain demand flows. We begin with the end of the spectrum that suggests
the least sophisticated supply chain. For example, an outdoor furniture firm located in
Williamsburg, Virginia may be interested in the importation of several containers of Rotan lawn
furniture for a special summer sale. This sporadic need can be accommodated by Exhibit 1 by
moving the arriving cargo from the port directly to the operation, from 6 to 13, which in this case
is a retail store. On the other end of the spectrum, Wal-Mart has an import distribution center
(DC) in Williamsburg that is used systematically, and on a highly scheduled basis, to deliver
goods to Regional Wal-Mart DCs. In this case, the supply chain is likely to include all the
elements shown in Exhibit 1. The flow of many goods in this supply chain is often planned long
in advance of operational needs and requires securing the resources at each supply chain link
through long-term arrangements. This does not suggest a completely static and predictable flow,
but under ideal circumstances does approach very stable flow. Economic conditions will affect
the flow in both supply chain examples and recent conditions (for example, decreases in demand
and fluctuations in diesel prices) have proven how even the most structured supply chain flow of
a Wal-Mart or Target can be subject to economic displacement—these companies have
implemented changes in supply chain policies and structures in response to recent fluctuations in
fuel prices.

10
Exhibit 2—Explanatory Notes for International Supply Chain (Exhibit 1)
1 The variety of cargos that is available for movement via shippers using sea borne systems. Each requires particular methods and resources for conveyance—ships, ports, and land transportation.
2 The flow rate at which goods arrive at a port, as determined by cargo handling resources—handlers, cranes, and other off-loading equipment.
3 Ports generally have a capability of storing cargo for a short period of time on or near the grounds of the port. These are staging areas for the eventual efficient movement of cargo beyond the port facility.
4 The equipment required to stage and transition cargo for movement beyond the port has a capacity that is important to the movement of cargo—if too little, the flow will be disturbed and can be costly to the operation of supply chains.
5 The transport mode is usually rail or truck, but could include barge or other ships. The connection arrow indicates that some cargo may go directly off ship to this conveyance and avoid storage at the port.
6
Gate activities at ports are important in that they control the movement of cargo beyond the port. Factors affecting the rate of movement include traffic control at the port, congestion beyond the gate, and imposition of movement constraints by local governments and agencies—cities, Department of Transportation, etc.
7 Often cargo is moved to outside-gate staging facilities to execute and plan movement. These could include rail yards, container yards, cross-dock facilities, etc.
8 The rate of movement of cargo from these staging areas depends on the capacity of rail and truck conveyance (possibly barge also). These resources can be engaged in an ad hoc fashion or in some form of scheduled agreement.
9
Import Distribution Centers are facilities that are used by firms that use global sourcing for their operations (e.g. Wal-Mart, Target, Dollar General, etc.). These facilities generally service large networks of Regional Distribution Centers. Goods can be transported to these centers directly from ports, as shown in Exhibit 1.
10 Transport capacity that controls the flow out of Import DCs and is most often provided by trucking. Trucks permit a combination of flexible and cost effective delivery to Regional DCs.
11 Regional DCs are the closest supply chain link to operations centers—Wal-Mart, Target, etc. They provide the goods that eventually get in the hands of consumers. In some cases there can be several levels or echelons of Regional DCs.
12 Transport capacity that controls the flow out of Regional DCs and is most likely to be provided by trucking. Trucks permit a combination of flexible and cost effective delivery to operations.
13 The eventual end of the supply chain and the point where goods are delivered to customers.

11
1.2 Logistics
The backbone of a supply chain is the logistic resources that are used to provide flow of
goods. Defining the term logistics is a difficult task, but the Council of Supply Chain
Management Professionals (CSCMP) provides a reasonable definition that permits serious
discussion relating to supply chains— “… that part of Supply Chain Management that plans,
implements, and controls the efficient, effective forward and reverse flow and storage of goods,
services and related information between the point of origin and the point of consumption in
order to meet customers' requirements.”
So what activities are included in logistics? To answer this question it may be easier to
consider the functions of what are known as Third Party Logistics Firms (3PLs), which have
become prevalent as an outside agent, or third party, in managing the flow of products between
two firms that in the past may very well have been handled by one of the companies involved in
the transaction. In many cases, the two firms have decided to cede the responsibility of product
movement to firms that specialize in these activities; particularly, small or medium-sized firms
that are not interested in making the investments necessary to build a logistic and supply network
or who have no expertise in logistics have outsourced to 3PLs. 3PLs arrange for shipping and
receiving modes, warehousing and storage, customs, insurance, and many other functions, often
working with other specialty agents like freight forwarders and customs agents. The five most
frequently outsourced activities to 3PLs are activities related to: outbound transportation (80%),
warehousing (70%), inbound transportation (67%), customs clearance (56%) and customs
brokerage (53%).
Approximately 45-50% of every logistics dollar spent in the U.S. is spent on 3PL services
and accounts for approximately 8.5-10% of U.S. GDP. Thus, a community of logistics firms is

12
created to deal with the complex issues of logistics and supply chain management. There are
numerous professional organizations associated with logistics. Here is a partial list of
organizations and hyperlinks to their websites:
American Society of Transportation & Logistics
(AST&L)
International Air Transport Association (IATA)
Transportation and Logistics Council
APICS - The Association for Operations Management
Institute for Supply Management (ISM)
Truckload Carriers Association
Council of Supply Chain Management Professionals
(CSCMP)
National Industrial Transportation League (NITL)
Warehouse Education & Research Council (WERC)
Freight Transportation Consultants Association
National Small Shipments Traffic Conference
(NASSTRAC)
Hazardous Materials Advisory Council (HMAC)
SOLE - The International Society of Logistics
1.3 Transportation as a Cluster
Logistics has its practical beginnings in the military. The need to deploy and move supplies
and personnel in military theater efficiently gave rise to most of the modern methods of logistical
control we use today. During the 1990-1991 Desert Shield/Storm War the power and application
of modern logistics became apparent to the world. It was a milestone that solidified an important
link between military and business logistics. In the war effort, approximately 90% of the
supplies needed to successfully conduct the war were rapidly sea-lifted to theater. This was an
astounding feat by any standard.
Much of the logistics expertise that has been developed from the military logistics
applications has made its way into business. Complicated systems of providers have developed
around transportation clusters. These clusters are convenient structures for considering the

13
economic development of a geographic region; thus, providing an important structure for
understanding our own transportation cluster resulting from the activities of our ports. Certainly,
they are important to the economic development of our region and Portsmouth.
Just as the high-tech firms of Silicon Valley represent a culture of commercial activities
around electronics, computers, and high-tech industries, so too do the transportation resources
and assets associated with the VPA. According to Michael Porter, the originator of the concept,
a cluster is defined as: “Clusters are geographic concentrations of inter-connected companies and
institutions in a particular field. Clusters encompass an array of linked industries and other
entities important to competition. They include, for example, suppliers of specialized inputs such
as components, machinery, and services, and providers of specialized infrastructure.”
So how do we use the cluster concept to guide our understanding of the functions of a
modern regional cluster? The state-of-the-art for clusters has been aptly summarized in a 2006
Brookings Institution discussion paper, Making Sense of Clusters: Regional Competitiveness and
Economic Development, by Joseph Cortright. In it he provides a practical set of guidelines in the
form of lessons that are relevant to understanding our transportation cluster. See Exhibit 3
below. (A partial bibliography on issues directly related to cluster development and performance
is provided in Appendix A.)

14
Exhibit 3 —Clusters: Lessons for Economic Development Policymakers and Practitioners
1 Cluster analysis can help diagnose a region’s economic strengths and
challenges and identify realistic ways to shape the region’s economic future.
2 Different regions have different sets of economic development
opportunities. Not every place can or should become another Silicon Valley.
3 The foundation of a regional economy is a group of clusters, not a collection of unrelated firms.
4 Successful development strategies are usually those that extend,
refine, or recombine a region’s existing strengths, not those that indiscriminately chase companies or industries.
5 Identifying a cluster’s competitive strengths and needs requires an ongoing dialogue with the firms and other economic actors in the cluster.
6 It is more important and fruitful to work with groups of firms on
common problems (such as training or industrial modernization) than to work with individual firms.
7 Economic development subsidies and recruitment efforts aimed at
individual firms, if used at all, should be focused on firms that fit within existing clusters.
8
It is difficult for public policy to create new clusters deliberately. Instead, policymakers and practitioners should promote and maintain the economic conditions that enable new clusters to emerge. Such an environment, for example, might support knowledge creation, entrepreneurship, new firm formation, and the availability of capital.
9
Cluster policy and practice are not:
1. Just a public-sector activity
2. A program
3. A means of “picking winners”
4. A one-size-fits-all approach to economic development.

15
1.4 Supply Chains in Hampton Roads Marine Terminals (HRMT)
Global trade has increased substantially over the past several decades and the increase in the
flow of imports into the United States has been well documented. These increased imports have
provided impetus for the evolution of supply chains. In order to deal with the increased
proportion of commerce that is transacted overseas, more efficient supply chain structures have
been required. Specifically, when manufacturing operations are offshored to another country or
when companies select overseas suppliers the characteristics of shipments are different than
those of domestic sources of supply. First, shipments must be made with multiple modes
(intermodal transportation) when an ocean separates the origin and the destination: some form of
land transportation must augment the ocean transportation. Second, the delivery lead times
increase due to the time required to sail a ship from another continent to North America, which
can take weeks, and by the increased number of handoffs between the transportation modes.
Third, due to the economics of container shipping, lot sizes oftentimes increase. Moreover, those
containers often contain only a single item, representing a quantity of supply which is much
more than any one destination (e.g., retail store) needs for short term supply. Fourth, because
full containers are most economical to ship, some of the goods in a container might be
immediately needed in downstream links of the supply chain (e.g., in regional distribution
centers or retail outlets), but some may need to be stored in a distribution center until they are
needed. Fifth, since any one retail store or downstream distribution center does not need all the
goods in one container, many containers need to be unloaded and new containers, train cars, or,
more likely, 53-foot semi-trailers reloaded with an appropriate mix of product for each
destination.

16
The need for temporary holding of imported goods, the deconsolidation of containers, and
construction of assorted shipments to downstream supply chain links has created the need for a
new type of link in supply chains—the import distribution center. Those distribution centers can
be one of two types: one that provides temporary storage and a type that ships everything that it
receives on to the next destination with no storage of products (with unpacking and re-packing of
containers). We refer to the latter type as a crossdocking facility and the former as simply an
import distribution center (DC).
Many crossdocking facilities and import distribution centers have located in Hampton
Roads. NYK Logistics has a crossdocking facility as does Maersk Services (formerly HUDD).
Target and Wal-Mart also maintain import distribution centers in the Hampton Roads area. The
engineering service company, Moffatt & Nichol, found 80 distribution centers within the
Commonwealth of Virginia, 26 of which were located within 30 miles of a port facility where
imports can be processed economically.4 Moffatt & Nichol has also stated in that report that 20
to 60 million additional square feet of distribution center capacity is needed in Hampton Roads
to handle the increasing volume of imported goods.5
The logical location for import distribution centers to sort through imported goods, ship
what is immediately needed, and store the remainder until needed is close to the marine terminals
where the goods arrive into this country. Locating a distribution center farther inland only
One such facility currently being proposed
and fitting the description of an intermodal park is the Centerpoint development just west of
Suffolk on U.S. Route 58/Holland Road. (See §4.0.)
4 An Economic Opportunity for Hampton Roads: An Intermodal Park, prepared by Moffatt & Nichol for the
Virginia Port Authority, June 2005, pages, 6-7. 5 An Economic Opportunity for Hampton Roads: An Intermodal Park, prepared by Moffatt & Nichol for the
Virginia Port Authority, June 2005.
17
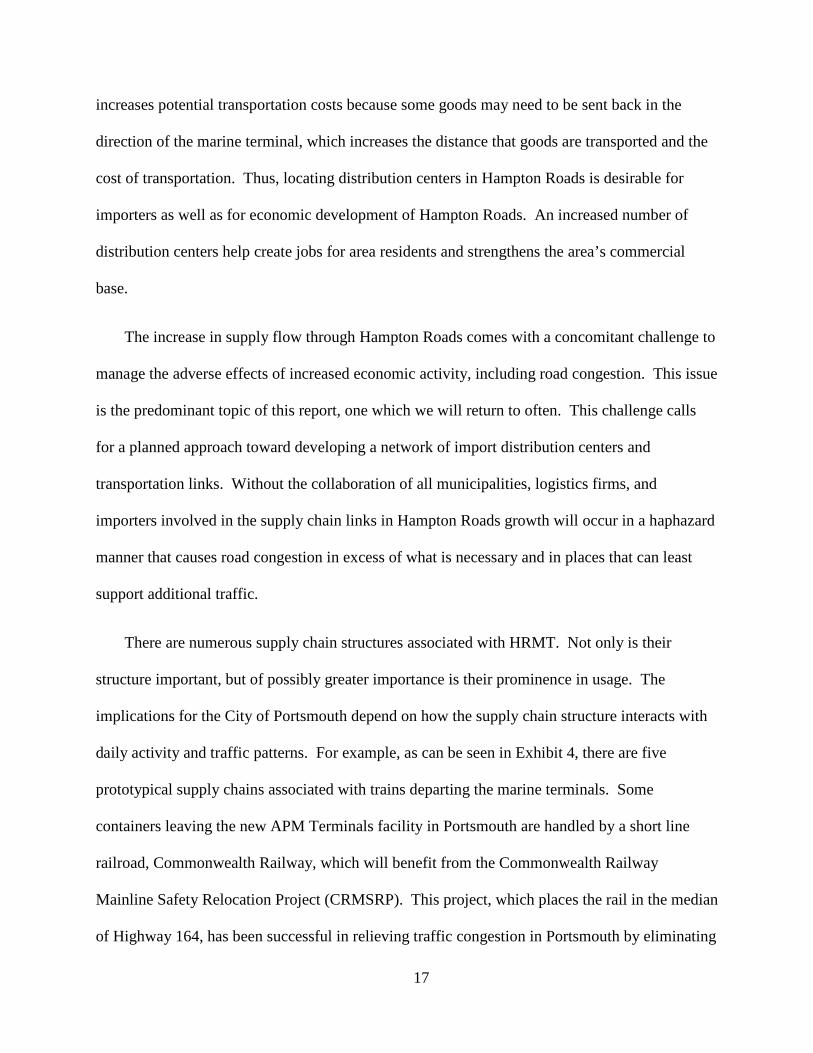
increases potential transportation costs because some goods may need to be sent back in the
direction of the marine terminal, which increases the distance that goods are transported and the
cost of transportation. Thus, locating distribution centers in Hampton Roads is desirable for
importers as well as for economic development of Hampton Roads. An increased number of
distribution centers help create jobs for area residents and strengthens the area’s commercial
base.
The increase in supply flow through Hampton Roads comes with a concomitant challenge to
manage the adverse effects of increased economic activity, including road congestion. This issue
is the predominant topic of this report, one which we will return to often. This challenge calls
for a planned approach toward developing a network of import distribution centers and
transportation links. Without the collaboration of all municipalities, logistics firms, and
importers involved in the supply chain links in Hampton Roads growth will occur in a haphazard
manner that causes road congestion in excess of what is necessary and in places that can least
support additional traffic.
There are numerous supply chain structures associated with HRMT. Not only is their
structure important, but of possibly greater importance is their prominence in usage. The
implications for the City of Portsmouth depend on how the supply chain structure interacts with
daily activity and traffic patterns. For example, as can be seen in Exhibit 4, there are five
prototypical supply chains associated with trains departing the marine terminals. Some
containers leaving the new APM Terminals facility in Portsmouth are handled by a short line
railroad, Commonwealth Railway, which will benefit from the Commonwealth Railway
Mainline Safety Relocation Project (CRMSRP). This project, which places the rail in the median
of Highway 164, has been successful in relieving traffic congestion in Portsmouth by eliminating

18
many at-grade crossings and reducing the number of cargo containers that travel across local
streets and highways. Yet, only 31% of all volume at VPA terminals departs by rail, thus truck
volume remains twice the size of rail volume. This will be discussed in far greater detail in this
white paper and compared with a similar situation in Los Angeles, CA where the equivalent of
short line railroad transportation is used.
The future of cargo movement out of our ports will depend on a number of factors. First,
the economics of transportation (rail, truck, barge, etc) is likely to remain volatile into the
foreseeable future; thus, it will difficult to know precisely the modes that will be economically
preferred. Second, the movement mode will depend greatly on the final destination of flow. The
longer distances that cargo must move, the more desirable rail becomes. And finally, the general
economy has proved to be as volatile as the fuel prices, suggesting that surges and slowdowns
are likely to be the new normal.
2.0 Product Flows Through Hampton Roads Marine Terminals
Transportation mode selection for imports/exports through Hampton Roads marine terminals
is keenly dependent on the distance of the destination/origin from Hampton Roads and how
urgently the goods are needed at the destination. The transport distance directly determines
which mode, truck or rail, is most cost efficient. How urgently a shipment is needed depends on
how soon it is needed to fulfill customer demands and how valuable the cargo is—the more
valuable the cargo the faster interest charges accumulate for the working capital required to
finance the goods. Thus, transportation mode selection is based essentially on cost and transport
time and which mode offers the most appropriate cost-time performance; rail is less costly but
slower than truck transportation as shown in Exhibit 5.

19
Exhibit 4 —Prototypical Supply Chain Structures for Imports from Hampton Roads Marine Terminals and where they appear in Exhibit 1.
Volume
(% of total) Mode Departing Marine Terminal 1st Link 2nd Link 3rd Link 4th Link
31%
Train Train onto Heartland Corridor
Train Cross-dock Train Import DC
Train NS Train to VIP Dray to Front Royal DC
Regional DC
Operations Facility
Train NS Train to VIP Regional DC Operations Facility
65%
Truck Cross-dock Import DC Regional DC
Operations Facility
Truck Cross-dock Long-haul truck
Regional DC
Operations Facility
Truck Cross-dock Long-haul truck
Operations Facility
Truck Import DC Regional DC Operations Facility
Truck Dray to local transfer point
Long-haul truck Import DC Regional
DC
Truck Dray to local transfer point
Long-haul truck
Regional DC
Truck Dray to distant transfer point
Long-haul truck Import DC Regional
DC
Truck Dray to distant transfer point
Long-haul truck
Regional DC
4% Barge Barge to
Richmond
Barge Other Barge Location
20
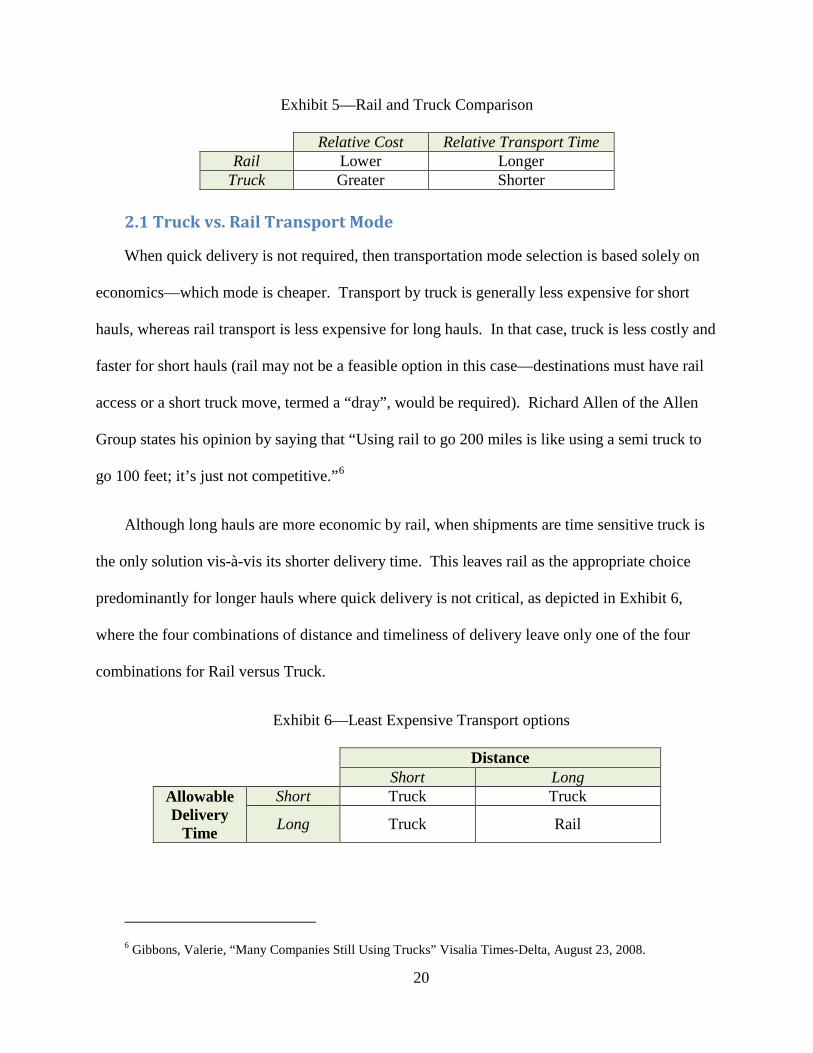
Exhibit 5—Rail and Truck Comparison
Relative Cost Relative Transport Time Rail Lower Longer
Truck Greater Shorter
2.1 Truck vs. Rail Transport Mode
When quick delivery is not required, then transportation mode selection is based solely on
economics—which mode is cheaper. Transport by truck is generally less expensive for short
hauls, whereas rail transport is less expensive for long hauls. In that case, truck is less costly and
faster for short hauls (rail may not be a feasible option in this case—destinations must have rail
access or a short truck move, termed a “dray”, would be required). Richard Allen of the Allen
Group states his opinion by saying that “Using rail to go 200 miles is like using a semi truck to
go 100 feet; it’s just not competitive.”6
Although long hauls are more economic by rail, when shipments are time sensitive truck is
the only solution vis-à-vis its shorter delivery time. This leaves rail as the appropriate choice
predominantly for longer hauls where quick delivery is not critical, as depicted in Exhibit 6,
where the four combinations of distance and timeliness of delivery leave only one of the four
combinations for Rail versus Truck.
Exhibit 6—Least Expensive Transport options
Distance Short Long
Allowable Delivery
Time
Short Truck Truck
Long Truck Rail
6 Gibbons, Valerie, “Many Companies Still Using Trucks” Visalia Times-Delta, August 23, 2008.

21
The cost advantage of rail over truck results from its lower line-haul rate—once a container
is on a train the per-mile transport cost is lower than for truck. However, unless the destination
has rail access, a truck dray move is required on the destination end and, perhaps, to get the
container to the railroad on the origin side of the move as well. In addition to charges for dray
services, there are also charges to transfer containers from truck to rail or vice versa. It is
commonly accepted that the cost of truck dray moves and other transfer charges to facilitate a
rail move pays off only if the destination is 400-500 miles from the origin—that distance is
required for the line-haul saving vis-à-vis rail to recoup the handling, transfer, and dray charges.
Data from Southern California bears this out—in 1997 the average distance of a truck haul was
288 miles in Southern California whereas the average rail move was 1,525 miles.7
Another way to contrast Rail versus Truck is to view rail as a bulk movement of many
different shippers’ goods whereas a trucks oftentimes transport goods for only one shipper and in
much smaller quantities. A long-haul train has economies of scale because it hauls many rail
cars over the very same route with highly efficient engines. In attaining these economies, what
sometimes suffers is timely deliver because rail cars may wait at a siding until the long-haul train
to the desired destination is scheduled and complete, much like people waiting in airports for
their plane to leave. Moreover, the journey of a rail car shipment is often a combination of many
long-haul legs with the potential for a delay at each hub.
That study
also found that 50-60% of all imported goods were either destined for Southern California or
made their first stop in Southern California, perhaps at an import DC. So at most 40-50% of all
imports could potentially be economically hauled by rail because their destination was distant.
7 Agarwal, G. Giuliano, C. Redfearn, “Alameda Corridor: A Blueprint for the Future?” University of Southern
California, June, 2004

22
Even if Rail suffers a competitive disadvantage with Truck in its timeliness on long hauls,
the bulk movement has its advantages: various sources have quoted rail’s capability to move a
ton of freight approximately 420 miles on one gallon of diesel fuel.8 The same figure for a long
haul truck hauling 80,000 pounds of freight and getting 5 miles per gallon is 200 ton-miles per
gallon. This corroborates with some sources that quote 120-200 ton miles per gallon9, although
other sources quote lower figures for trucks (e.g., 59 ton miles per gallon). The touted efficiency
advantage of locomotives has been a major selling point for rail projects such as the Alameda
Corridor, which in part was motivated by a reduction in air pollution due to a reduced number of
trucks traveling on highways and sometimes idling while in traffic jams.10
Figures from the VPA indicate that the profile of imports received at Hampton Roads
terminal may be very similar to the California data: approximately 29% of all imports in calendar
year 2007 were destined for the immediate Hampton Roads area including Norfolk, Virginia
Beach, Newport News, Hampton, Suffolk, Portsmouth, Chesapeake, Poquoson, and
Williamsburg. A recent economic impact study for fiscal year 2006 estimated that 39.5% of
imports are destined for Virginia in total, and 60.5% of imports are bound for other states.
11
8 See
Of
the 60.5% destined for other states, some shipments are destined for nearby states such as West
Virginia, North Carolina, Maryland, South Carolina, and will likely be shipped by truck. Thus,
less than 60% of imports are long-distance hauls that are economically viable to transport by rail.
http://www.factcheck.org/askfactcheck/can_a_freight_train_really_move_a.html, and also http://www.npr.org/templates/story/story.php?storyId=91853780
9 http://www.hubbertpeak.com/transport/ 10Weston Solutions, “Alameda Corridor Air Quality Benefits,” June 10, 2005,
http://www.acta.org/PDF/Alameda%20Corridor%20AQ%20Benefits%20Report_061005.pdf 11 “The Fiscal Year 2006 Virginia Economic and Fiscal Impacts of Virginia Port Authority Operations,” The
College of William and Mary Compete Center for the Virginia Port Authority, January 2007.

23
For comparison the VPA reports the following percentages of imports passing through Hampton
Roads marine terminals that are transported by various modes in 2007. (See Exhibit 7).
Exhibit 7—Imports Transportation Mode of Gate Exit
Truck 65%
Rail 31%
Barge 4%
We assume that shippers and their agents make the best logistical decision possible
(including both criteria: cost and delivery lead time) given the information available to them.
The data regarding cargo destinations and choice of transportation mode are plausibly
reconcilable if approximately 25.5% (65% shipped by truck – 39.5% of shipments to Virginia) of
shipments are outside of Virginia—either to a nearby states or shipments where quick delivery is
needed.
If one’s goal were to remove as many trucks from roads and highways as possible, then two
possible strategies would be to either (1) make rail quicker, or (2) make rail more economical for
short hauls. Rail has not historically competed on quick delivery, certainly not on long hauls,
and we are not likely to see a change in that competitive positioning. However, a general
strategy that has been used for making rail more economical for short deliveries, and perhaps
more timely as well, is to cluster demand within a small geographical area so that a high volume
of rail cars can be delivered to that single point. Truck dray moves are still necessary at the end
of the rail line if spurs are not available, but if distribution centers are located close to the end of
the rail line, then these dray costs can be reduced substantially.12
12 http://www.hiffman.net/Future%20of%20Transportation%20White%20Paper%2009.12.08.pdf

24
This is precisely the model used by the Virginia Inland Port (VIP), whereby cargo containers
are shipped by Norfolk Southern Railroad from Norfolk International Terminal 220 miles to the
inland port near Front Royal, VA. Many distribution centers have been built in the area, for one
reason, to reduce dray costs from the VIP to the DC. We discuss the VIP in depth next and, in
another section, discuss an alternate model, the Alameda Corridor in Southern California. Still
another strategy for concentrating demand at one geographical point is the concept of an
intermodal park like the Centerpoint development that had been proposed near Suffolk, VA,
which is discussed in §4.0.
2.2 Virginia Inland Terminal
One of the most innovative and successful developments by the VPA has been the creation
of an intermodal transfer facility in Front Royal, Virginia to handle the movement of
containers—Virginia Inland Port (VIP). The facility began operation in 1989 and was funded
without incurring any state debt. It is located 70 miles west of Washington DC on 161acres at
the intersection Rt. 522 and 340. (See Exhibit 8). The purpose of this facility is to provide an
extension of port facilities to inland locations and thereby bring the port closer to the ultimate
customer and to also reduce the traffic congestion associated with container movement out of the
port. It was particularly targeted at a customer base in the Ohio Valley, Western Maryland, West
Virginia, Washington, DC and Pennsylvania.

25
Exhibit 8—Virginia Inland Port location and Facility Layout
(Map from VPA website http://www.vaports.com/Facilities/ )
The connection between the Hampton Roads Ports and the VIP is a rail line operated by
Norfolk Southern Railroad that provides service in both directions (to and from the Hampton
Roads Ports) every day of the week. There are approximately 35,000 container moves per year
and much of this traffic is business that was captured from Ports of Baltimore or Philadelphia.
Some of the important customers at VIP are Home Depot, Family Dollar, and Sysco.
Additionally, it is designated a Foreign Trade Zone.
2.3 Barge Transport
Throughout this white paper we focus on two modes of transportation out of marine
terminals: truck and rail. Currently, these are, by far, the predominant modes used in and out of
the Port of Virginia with only 4% of traffic going out by barge in calendar year 2007.
Specifically, in 2007 this barge transport was for containers traveling to the Port of Baltimore via
barges operated by Columbia Coastal Transport rather than traveling inland into Virginia and the

26
rest of the U.S. These containers, therefore, factored very little in the economic impact on
Virginia because the Port of Virginia was but a brief stopping over point.
Recently, in December 2008, Norfolk Tug Company has started barge service from
Portsmouth Marine Terminal (PMT) and Norfolk International Terminal (NIT) to the Port of
Richmond. The goal of this service is to move as many containers as possible away from
Norfolk’s harbor and thereby avoiding adding to the congestion on Interstate 64—this essentially
pushes the footprint of the port 100 miles to the west and north in the same manner as does the
Virginia Inland Port.
Norfolk Tug Company is optimistic about future expansion of service to APM Terminals in
Portsmouth and, hopefully, an expansion of volume so that service can increase from one trip per
week to daily departures from marine terminals in and around Norfolk.
The effect on Portsmouth due to the barge service could be different depending on whether
one considers the short term or the long term. In the very near term, the location of distribution
centers will not change and the barge service in its infancy may not have sufficient capacity to
affect companies’ DC location decisions. Therefore, to the extent that containers in Portsmouth
marine terminals can be moved from Hampton roads via barge, road congestion will be reduced
in Portsmouth and in Hampton Roads more generally.
In the long term, if the barge service expands and is capable of moving a significant volume
of containers, then distribution centers may be motivated to locate in the vicinity of Richmond,
just as has happened around the Virginia Inland Port near Front Royal. In this case, road
congestion in Portsmouth and Hampton Roads will be reduced compared with what it would
have been otherwise, just as is the case in the short term, but there may also be economic impact

27
affects to consider as well. If distribution centers locate in Richmond rather than in Hampton
Roads there will fewer jobs and economic development in Hampton Roads than what would
have otherwise been the case. This presents a tradeoff for decision makers in Hampton Roads as
they decide if they want to promote barge traffic or not, and whether increased congestion in
Portsmouth is worth the economic benefit. The possibility can be viewed from a larger
perspective, however, from the viewpoint of Virginia, the competitiveness of the Port of
Virginia, and the environment.
First, ports compete with one another to get as much business as possible. Ships making
calls in Norfolk might just as easily have made calls in Savannah, GA, which has ready access to
Interstate 95 and points north along that route. And competition does not depend just on the fees
charged by the marine terminal operators, but also on access to major highways and the
marketplaces for which the goods in transit are ultimately destined. Thus, the easier it is to get a
larger volume of cargo out of the Port of Virginia, the quicker cargo can get to its destination,
and the more likely shippers are to want to use our port terminals. This means more economic
impact for the Commonwealth whether a DC that receives the goods might be in Hampton Roads
or elsewhere in Virginia. In any case, the established distribution centers in Hampton Roads are
not likely to go away any time soon so that barges may not pose a threat to the economic
development derived from those existing facilities.
Regarding the environment and costs of transportation that are borne by citizens and
governments rather than directly by the shippers whose actions give rise to the costs (often called
externalities by economists), barge operators would point out other advantages of using barges,
much the same as rail connections such as the Alameda Corridor tout. (The authors in listing

28
these benefits do not necessarily endorse these possible advantages because a thorough study is
outside the scope of this paper.)
• Reduced road congestion
• Shorter transportation times for traffic remaining on highways
• Less fuel consumed
• Less air pollution
• Less damage to highways—lower maintenance cost
• Greater flexibility in transportation options, thus making the port more desirable
• Extension of port footprint beyond the immediate area (Richmond)
One might do an analysis on whether barges can compete with trucking in terms of cost and
transportation time. However, barge service in this area is in its infancy and that analysis might
not be possible. Two key variables that will determine whether barge service does become
competitive are:
• Barge Growth Rate: Does barge service grow fast enough to garner economies of scale
and garner support from shippers and municipalities, so that more frequent service can be
offered, and so that barge service operators can better leverage their assets through
greater volume?
• Road Congestion: to the degree that road congestion increases this makes barge
transportation more competitive both in terms of cost and transportation time.

29
3.0 Case Study: Alameda Corridor
This section contains a case study of the Alameda Corridor13
Before proceeding, we note that our understanding is that Norfolk Southern currently
receives rail cars with container freight from Commonwealth Railway, but CSX does not. We
were not able to find out the specifics of why this is the case, but it suggests that the rail network
might not currently be used to its full advantage. This should be kept in mind during the
comparison and contrast to the Alameda Corridor initiative.
project in southern California,
which commenced operations in 2002, and a comparison of it with the Commonwealth Railway,
which connects the APM Terminals facility in Portsmouth with the Norfolk Southern and CSX
railroad lines in Suffolk. This comparison reveals a close similarity between the Alameda
Corridor and the Commonwealth Railway. By highlighting the concerns with the Alameda
Corridor our intent is not to disparage similar rail connections but, rather, to point out lessons,
which if heeded, can help positively influence other similar endeavors such as the
Commonwealth Railway connection. These types of initiatives are immensely complicated and
therefore require careful and thorough consideration.
3.1 Alameda Corridor Comparison with Commonwealth Railways
The first and most notable similarity between the Alameda Corridor (AC) and the
Commonwealth Railway (CR) is that both railways connect port terminals with railroad
companies that provide long-haul rail services. The Alameda Corridor shuttles full and empty
cargo containers between the Ports of Long Beach and Los Angeles and the Intercontinental Rail
Yard east of downtown Los Angeles where connections are made with the Union Pacific
13 http://www.acta.org/

30
Railroad (UP) and the Burlington Northern Santa Fe Railroad (BNSF).14
One difference that is important to note in the two connections is their governance structure.
The Alameda Corridor was built and is governed, according to their web site, “… by the
Alameda Corridor Transportation Authority (ACTA), a joint powers authority formed by the
cities and Ports of Long Beach and Los Angeles. ACTA’s seven-member Governing Board
includes two representatives from each port …”
UP and BNSF
railroads are Class I railroads that provide long-haul service throughout the entire United States.
The Commonwealth Railway (a Class III railway), similarly, connects the APM Terminals
facility in Portsmouth with two Class I, long-haul railroads in Suffolk: Norfolk Southern (NS)
and CSX. A connection between Craney Island Marine Terminal (CIMT) with NS and CSX is
also planned via Commonwealth Railways when CIMT comes on line in 2017. The goals of
both AC and CR are similar: both are intended to relieve highway and road congestion by
transporting container cargo via rail versus truck; both connections eliminate at-grade railroad
crossing, thus improving safety and lessening road congestion; and finally, both connections are
of similar length—the AC is 20 miles long while the CR maintains 16.5 miles of track. Exhibit 9
shows a comprehensive comparison of the two railway connections.
15 In contrast, the Commonwealth Railway
(Class III, short-line) is a division of Genesee & Wyoming, Inc.16, which is a holding company
owning 63 different rail companies.17
14 Testimony of Al Moro, Chief Harbor Engineer, Port of Long Beach, 925 Harbor Plaza Drive, Long Beach,
CA 90802, 562-590-4142. Before the House Committee on Transportation and Infrastructure Subcommittee on Railroads, Pipelines and Hazardous Materials. United States Congress. April 23, 2008. "Rail Capacity"
Thus, while the Alameda Corridor is a public entity, the
Genesee & Wyoming, Inc. is a publicly-traded corporation. There is a second difference
15 http://www.acta.org/about_governance.htm 16 http://www.gwrr.com/ 17 http://www.gwrr.com/

31
between the two railway connections. While the long-haul railroads, UP and BNSF, share the
Alameda Corridor rail connection, the Commonwealth Railways transports containers from
Portsmouth terminals to the long-haul railroads, NS and CSX. Thus, a third party owns and
manages the Portsmouth rail connection and services the terminals rather than the Class I
railroads themselves.
Analyzing the Alameda Corridor is particularly important given the strong criticism it has
drawn for failing to transport as many containers as originally projected and, thus, not relieving
road congestion in the metropolitan Los Angeles area as much as was anticipated. Given the
similarity between missions and structure of the AC and the CR, exploring the reasons why the
AC does not transport more containers than it currently does offers “lessons” from which
Hampton Roads might learn in either:
(1) forming reasonable expectations of CR and the degree to which it can relieve road
congestion due to tractor-trailer traffic and, possibly,
(2) help the City of Portsmouth and other governing bodies in the Hampton Roads
understand how the CR can carry a larger percentage of incoming containers out of
Portsmouth marine terminals, thus relieving road congestion to the greatest degree
possible.
Our analysis in this section is based on the premise, one that is firmly held by the authors,
that shippers and logistics firms will choose transportation modes and routes based on the
relative economic benefits of each alternative and their delivery times. For all alternatives
meeting transportation time requirements, the least expensive alternative will be chosen or, at
least, the alternative deemed least expensive based on the (possibly limited) information
available to decision-makers and subject to their analytical capabilities. Economic costs come in

32
two forms: (1) hard cash payment, and (2) intangible costs. Hard-cash payment has the most
significant effect upon logistics decisions and includes the cost paid to trucking firms and
railroads for transporting goods; intangible costs include those induced by in-transit delay due to
traffic congestion, which increases wages paid to drivers and fuel consumption, as well as costs
of late delivery, including possible loss of business and inventory stock-outs at the receiving
company. Only when a particular transportation mode dominates others in terms of a
combination of tangible and intangible costs, or when alternatives cannot satisfy delivery time
requirements, should we expect freight to be transported from a port terminal using that
particular mode, whether it is truck or rail.

33
Exhibit 9—Comparison of Alameda Corridor and the Commonwealth Railway
Characteristic Alameda Corridor Commonwealth Railway
Connection
Between Ports of Los Angeles and Long Beach and Intercontinental Rail Yard in east Los Angeles for Class I railroads Union Pacific and Burlington Northern Santa Fe
APM Terminals and CSX/NS lines in Suffolk, VA. The connection will be extended to Craney Island Marine Terminal when CIMT comes on line.
Miles of Track 20 miles 16.5 miles
Cars/Containers on Train 2719 350-400 TEUs10
Purpose
• Avoid/reduce highway congestion1,12
• Eliminate 200 at-grade crossing by locating railway in a trench13
• Reduced air pollution13
• More efficient rail movement13
• Foster local economic development in the Corridor Cities16
• Avoid/reduce highway congestion14
• Alleviate safety and mobility concerns of motorists and ensure capability of municipalities (Portsmouth) emergency vehicles to respond to emergencies in a timely manner14
• Median project to eliminate 14 at-grade crossings (through the CRMSRP project which relocates Commonwealth Railways tracks into the median of highway 164 in Portsmouth)14
• More efficient rail movement Inception of Service April 12, 20022,3 July, 200711
Trains in Inception Year 14,000 Not Available
Years in Service 6 years <1 year
Stated Capacity 100 trains/day1
150 trains/day13
Not Available
Current Trains per Day 44 trains/day2
16,105 trains in 20082
A minimum of 1 train/day Thursday through Monday5
TEU Moves > 12,506 TEUs per day8 Approx. 300 TEUS/day4

34
Exhibit 9—Comparison of Alameda Corridor and the Commonwealth Railway (Continued)
Target % of Port Cargo to Transport 50%1 50%6
Current % of Port Cargo Transported 37%1 31%7,15
Growing Number of Import DCs Near Port Yes Yes
Surface Grade Crossings Eliminated 2001 14
Hinterlands Cargo Flow
60% of the freight arriving in the San Pedro Bay port terminals is destined for markets outside of Southern California
According to the VPA, approximately 29% of incoming containers is destined for destination in the immediate Hampton Roads area, such as import distribution centers. Approximately 39.5% of imports are bound for Virginia in total.17
Fees
As of November 24, 2006, railroads pay ACTA a uniform fee of $40 per loaded 45’ container, $36 per loaded 40' container (FEU) and $18 per loaded $20’ container (TEU), with reduced fees for empty containers and non-waterborne domestic containers moving between the harbor and inland rail ramps. Railroads pass these charges on to shippers/carriers, including ocean carriers.3
Not Available
(These fees are privately negotiated between Commonwealth Railways and the Class I railroads)
Transit Time Over Corridor
Truck: two hours Train: 45 min. plus delays13 Not Available
Other fees
An additional Infrastructure Cargo Fee (ICF) of $15 per TEU has been implemented effective January, 2009 to fund infrastructure improvements in and around the harbor

35
Exhibit 9—Comparison of Alameda Corridor and the Commonwealth Railway (Continued)
Notes for Exhibit 9 1 The CalTrade Report 2 http://www.acta.org/PDF/CorridorTrainCounts.pdf 3 http://www.tsacarriers.org/fs_alameda.html 4 Rough estimate based on publicly stated APM Terminals capacity of 2.1 million TEUs annually, current
percentage of build-out, and typical percentage of containers leaving Hampton Roads area marine terminals as provided by the Virginia Port Authority
5 Based on interview with Andrew Chunko, VP Port Operations for Rail Link, which is the parent organization for Commonwealth Railways.
6 Based on design criteria for Craney Island Marine Terminal. See http://craneyisland.info/PDF/craneyislandconnectionseptember2007.pdf, The Craney Island Connection, Vol. 1, Issue 3, September 2007, published by Virginia Port Authority and the U.S. Army Corps of Engineers.
7 This figure is not from the APM Terminals facility which is the only marine terminal served by the Commonwealth Railway, which is not publicly available. Rather this is the percentage of containers that leave VPA-owned marine terminals per VPA contacts for calendar year 2007.
8 This figure was cited on the ACTA web site (http://www.acta.org/) on 12/18/2008 for September 2008. 9 This figure was computed from the ACTA web site (http://www.acta.org/) based on data gathered on
12/18/2008 for September 2008. That site quoted and average of 46.2 trains per day in Sept. 2008 and 12,506 TEUS moved per day on average. These two figures imply an average TEUs per train cited above.
10 These estimates were based on background interviews. 11 Planned starting date for APM Terminals, Portsmouth, VA per xxx insert cite xxx 12 The Alameda Corridor: A White Paper, by A. Agarwal, G. Giuliano, and C. Redfearn, School of Policy,
Planning and Development, University of Southern California, June 2004, pages 17-18. 13 The Alameda Corridor: A White Paper, by A. Agarwal, G. Giuliano, and C. Redfearn, School of Policy,
Planning and Development, University of Southern California, June 2004, pages 17-18. 14 Suffolk Rail Impact Study, Hampton Roads Planning District Commission, May 2007,
http://hrmpo.org/Documents/Reports/SuffolkRailReport.pdf 14 Suffolk Rail Impact Study, Hampton Roads Planning District Commission, May 2007, page 15:
approximately 30% cited as rail mode. 16 The Alameda Corridor: A White Paper, by A. Agarwal, G. Giuliano, and C. Redfearn, School of Policy,
Planning and Development, University of Southern California, June 2004, pages 17-18. 17 The Fiscal year 2006 Virginia Economic and Fiscal Impacts of Virginia Port Authority Operations, The
Compete Center of the College of William and Mary, January 2008.

36
3.2 The Alameda Corridor and Efficient Supply Chains
The Alameda Corridor has drawn criticism because it currently carries about 37% of the
container volume into and out of the Ports of Los Angeles and Long Beach (collectively known
as the San Pedro Bay ports) compared with the 50% that was projected. Those with the contrary
perspective argue that the Alameda Corridor is meeting expectations because it carries a number
of TEUs (Twenty-foot Equivalent Unit) consistent with forecasts even if the percentage of
containers transported is not.18
“ACTA claims that the Corridor has slowed the growth of port-bound truck trips on the
freeways and reduced idling of trains in corridor, which has improved the air quality in
the Southern California basin. However, in so far as we have been able to determine,
presently there is no empirical evidence to support ACTA claims or quantify any
benefits of the Alameda Corridor. Since its completion in 2002, no internal official
performance reviews of the Alameda Corridor have been performed nor are any
anticipated in the near future. However, official figures are available regarding average
train traffic through the Corridor, as well as volumes of cargo transported and revenues
earned.”
For example, the ACTA’s position was summarized in a paper
by Agarwal, Giuliano, and Redfearn:
19
The disparity between the two positions might be explained by the volume of traffic through the
San Pedro ports, which has increased in the early part of this decade much faster than projected.
18 The Alameda Corridor: A White Paper, by A. Agarwal, G. Giuliano, and C. Redfearn, School of Policy,
Planning and Development, University of Southern California, June 2004, page 19. 19 The Alameda Corridor: A White Paper, by A. Agarwal, G. Giuliano, and C. Redfearn, School of Policy,
Planning and Development, University of Southern California, June 2004, page 17-18.

37
Two passages from The CalTrade Report20
“The economics of the Southern California shipping industry have changed, making it
cheaper and easier to move containers by truck than by train.”
offer commentary on factors that might have
caused the shortfall in percentage terms. The first quote from that article is from James C.
Hankla, President of the Alameda Corridor Transportation Authority (ACTA):
21
Also from that edition of The CalTrade Report Bob Costello, Chief Economist for the American
Trucking Association, was quoted as saying:
“Back then, the rule of thumb was that all freight moving long distances was cheaper to
send by train […]. Trains could be loaded with hundreds of freight cars and powered
slowly across the country, dropping off containers in cities along the way with relatively
little cost.
“But now, because companies expect deliveries to be made quickly and with greater
precision than in the past, goods are trucked from the harbor to huge distribution centers
in Colton and San Bernardino, where they are consolidated and organized for easy
delivery.
“The goods are then put back on trucks and drayed to rail yards, where they are
finally put on trains for the trip east. The economics are tipped even more toward trucks
by a $15 user fee charged to carry each 20-foot container over the rail line by the
Alameda Corridor agency and passed on to shippers by the railroads.”
20 http://www.caltradereport.com/eWebPages/Front-Page.html 21 The CalTrade Report, July, 23, 2003,
http://transportation.northwestern.edu/docs/2003/2003.07.23.CalTrade.Report.pdf

38
Prominent in these two statements is acknowledgement of how supply chains are evolving;
it can make very good sense to make overseas purchases in large volumes, thus obtaining
quantity discount (all the goods in a shipping container might be the same product) and shipping
economies. Because the ocean shipping times are significant it also makes sense to delay the
decision concerning the ultimate destination for the contents of a container—demand can never
be precisely forecasted and with six weeks transit time it is better to use up-to-date inventory
data when the container arrives to see which customer wants or needs the goods. Thus, the
consolidation and organization referred to in the quotes above are precisely the roles fulfilled by
import DCs and crossdocking facilities mentioned earlier in this paper. These types of facilities
have developed in California, as well as in Virginia, and all over the United States in response to
the new realities (uncertainties) of international trade.
Also prominent in the quotes above is an increased need for quicker delivery which, by
implication, the rail link may not be satisfying. Another possible implication is that the
distribution centers in Colton and San Bernardino are not served directly by rail, thus
necessitating a truck move whether it be from the port to the DC or the Intercontinental Rail
Yard to the DC. If a container is shipped along the Alameda Corridor connection, and then
drayed by truck to a DC, it is possible that that route could take longer and, possibly, be more
expensive than just using a truck directly from the port terminal.
Thus, the development of distribution centers is a double-edged sword because one price of
economic development can be road congestion, particularly if infrastructure planning occurs in a
haphazard manner and a large number of containers are shipped to import distribution centers by
trucks over roads with insufficient capacity. This result can be due to either not having a viable
rail connection with the import DCs or having rail (or possibly barge) be uneconomical. To

39
avoid excess road congestion to the greatest degree possible, direct rail connections between
marine terminals and distribution centers are required so as to reduce truck transport over public
roads. Moreover, rail transit must be less expensive than a truck move and must satisfy
requirements for timely delivery. If rail is neither economically viable nor timely, then trucks
will be used. Note all shippers’ requirements for responsiveness are not the same, so we can say
the greater the speed the greater the percentage of customers’ needs for delivery speed that will
be met. The ACTA is considering a proposal to construct a rail link to distribution centers to
resolve the infeasibility of reaching some distribution centers by rail22
“The Authority, which is headed by Los Angeles City Councilwoman Janice Hahn, has
begun studying a proposal that would encourage shippers to use trains on the Alameda
Corridor instead of trucks.
:
“Under that plan, which Hankla said could cost hundreds of millions, the agency would
build terminals for shuttle trains that would do much the same job as trucks: hauling
port cargo short distances to inland repacking centers of their own.”
Even when economic incentives would seem to favor using a rail connection, it is interesting
to note that containers are still sometimes transported to a rail hub over the road. In the case of
the Alameda Corridor, any container originating at one of the San Pedro Bay ports and arriving
at the Intercontinental Rail Yard is charged the ACTA’s fee for using the Alameda Corridor
($38.62 for a 40-foot container at 2009 rates) whether the container was shipped by rail or truck
22 The CalTrade Report, July, 23, 2003,
http://transportation.northwestern.edu/docs/2003/2003.07.23.CalTrade.Report.pdf

40
to the rail yard.23 Despite the economic incentive ACTA’s surcharge, one quarter of the
containers arrived at the rail yard in Los Angeles by truck during the fiscal year 2002-200324
23 The Alameda Corridor: A White Paper, by A. Agarwal, G. Giuliano, and C. Redfearn, School of Policy,
Planning and Development, University of Southern California, June 2004, page 19.
,
which was the Alameda Corridor’s first year of operation. Up-to-date statistics are not available
to determine how this metric might have changed. (See Exhibit 10 for the 2008 and 2009 base
transportation rates for containers and trailers being transported along the Alameda Corridor.
Different rates apply to bulk cargo and additional surcharges are charged depending on the cargo
type and origin.) It is important to note that the ACTA’s per-container charge for the Alameda
Corridor is not the only charge involved in transporting a container to the rail yard over the
Alameda Corridor—this charge may indeed be a small proportion of total charges including the
UP’s or BNSF’s transportation charge plus port handling charges.
24 The Alameda Corridor: A White Paper, pages 19-20

41
Exhibit 10—Alameda Corridor Transportation Rates (from: http://www.bnsf.com/markets/intermodal/alameda_surcharge.html)
Loaded Waterborne Containers/Trailers
ACTA Fee per container /trailer
Equipment Size 2008 2009 22' or less $18.67 $19.31 Greater than 22' and equal to but not greater than 44' $37.34 $38.62 Greater than 44' but less than 48' $42.01 $43.45 Equal to 48' but less than or equal to 52' $44.81 $46.34 Greater than 52' $49.48 $51.17
Empty Waterborne Containers/Trailers
ACTA Fee per container /trailer
Equipment Size 2008 2009 22' or less $4.73 $4.89 Greater than 22' and equal to but not greater than 44' $9.46 $9.78 Greater than 44' but less than 48' $10.64 $11.00 Equal to 48' but less than or equal to 52' $11.35 $11.74 Greater than 52' $12.53 $12.96
Loaded and Empty Non-Waterborne Containers/Trailers
ACTA Fee per container /trailer
Equipment Size 2008 2009 22' or less $4.73 $4.89 Greater than 22' and equal to but not greater than 44' $9.46 $9.78 Greater than 44' but less than 48' $10.64 $11.00 Equal to 48' but less than or equal to 52' $11.35 $11.74 Greater than 52' $12.53 $12.96
A white paper from the University of Southern California’s School of Policy, Planning and
Development suggests that the reason why truck transportation was used rather than the Alameda
Corridor rail connection even though the obligatory transportation fee had been made may have
42
been because BNSF does not have an intermodal transfer facility at some port terminals so that
containers can be loaded onto trains.25
Competition, or lack of coordination, between UP and BNSF could also contribute to fewer
containers being transported over the Alameda Corridor. It is often the case that only one
railroad company serves each port terminal, in which case it is possible that the transportation
charges charged by a railroad serving a terminal to the receiving railroad at the Intercontinental
Rail Yard (transporting a container from the rail yard cross country) might be sufficiently high
that trucking is the least expensive transportation option.
Alternatively, the authors of that paper suggest that
possible causes are other logistics costs (rail transport charges and marine terminal handling
charges) that would make using the Alameda Corridor more costly despite having received no
benefit from paying the ACTA surcharge.
Transportation time an important performance characteristic of transportation that could play
a role in the choice of transportation mode also. However, if a container is bound for a cross-
country, long-haul rail journey, then saving on transportation time getting to the rail yard is most
likely of little or no value.
This discussion points out two things. First, because transporting a container involves
multiple transportation modes and multiple supply chain links, we must view transportation as a
network. Simply because a particular connection is built within the network, we cannot expect
cargo to be transported over that connection unless there is a feasible and economical way to
access the new connection. We must also be concerned with artificial (non-physical) barriers to
the transportation network, which could occur if multiple railroad companies serve a port with
25 The Alameda Corridor: A White Paper, page 20.

43
multiple terminals. If, for example, a container arrived at a marine terminal that was served only
by BNSF and the container needed to go cross country on UP, then a transfer from one railroad
to another is required. If BNSF charges an exorbitant rate (this example is hypothetical) to UP,
which might be consolidating the total shipping invoice, then we might reasonably expect the
container to be delivered to the Intercontinental Rail Yard by truck. Thus, the relationships
amongst the railroads must be sufficiently collaborative or the fallout might be that more
containers transported by truck and fewer over rails.
The example of how railroad fees and relationships between two railroads affect supply chain
flows can be extended to all entities who participate in the supply chain including the terminal
operators, freight forwarders/customs agents, shipping lines, the International Longshoremen’s
Union (on the east coast), dray trucking companies, long-haul trucking companies, railroads,
barge companies, and governmental bodies (municipality, state, federal) who impose fees, taxes,
regulations and restrictions. The nature of a supply chain network, unfortunately, is that a simple
change in one particular fee or regulation can have significant and unforeseen affects on the
flows in the network. In the (hypothetical) case of the two railroads above, the fee structure
between the railroads causes a significant amount of cargo to go over the road, thus imposing
externalities on municipalities and citizenry.
3.3 Incentives for Reducing Road Congestion
Incentives are a possible measure that might be implemented to motivate shippers to
transport more containers via rail versus truck or to control road congestion by influencing when
trucks pick up containers at port terminals. The incentives for the former goal can be constructed
to either make trucking more expensive or make rail less expensive. Before entertaining two

44
such examples, we must acknowledge the limited potential for influencing such a shift in
transportation mode selection.
3.3.1 Transportation Economics and Limitations of Incentives
As mentioned in an earlier section, the Alameda Corridor had a goal of transporting 50% of
the containers from the ports of San Pedro Bay—it currently transports about 37%. Some of the
reasons suggested for the shortfall by Agarwal, Giuliano, and Redfearn point to comparative
economics of transportation and the realities of supply chain networks:26
1. Trains are economical only for long-hauls. In the case of the ports of San Pedro Bay,
25% of the cargo is destined for Southern California and another 25-35% of cargo makes
its first stop in Southern California at distribution centers to be de-consolidated and/or
stored. Thus, it is uneconomical for 50%-60% of cargo to use the Alameda Corridor.
2. Regarding the 50%-60% of the cargo destined initially for Southern California, using the
Alameda Corridor increases transportation time from four to seven days to seven to 10
days. Thus, the Alameda Corridor can be both slower and more expensive.
3. The cost of trucking relative to rail may have declined over the past 18 years.
4. A rail bottleneck may exist east of the Intercontinental Rail Yard such that it may be
desirable for some shippers to truck a container past the Intercontinental Rail Yard and
the subsequent bottleneck in the interest of reducing delivery time.
5. Intermodal transportation involves, oftentimes, additional fees at the marine terminal for
handling or for drayage. Those fees are not recouped unless a container is hauled over a
long distance over rail.
26 The Alameda Corridor: A White Paper, by A. Agarwal, G. Giuliano, and C. Redfearn, School of Policy,
Planning and Development, University of Southern California, June 2004, page 20-23.

45
6. Supply chains are evolving so that more import distribution centers are being built on the
eastern edge of the Los Angeles metropolitan area to receive, de-consolidate, and store
imported goods. These locations are un-economical for a rail move with the current
infrastructure. Some of this cargo may end up on rail for a cross-country journey, but the
first transportation leg to the distribution center is most economical by truck.
(Note: Point 4 emphasizes the importance of viewing the supply chain as a transportation
network. To the degree that this assertion is accurate, considering the Alameda Corridor in
isolation is insufficient to understand traffic flow along it—downstream conditions, separate
from the Alameda Corridor can significantly affect the rail traffic along the Corridor.)
Thus, critical factors in determining what proportion of containers marine terminals in
Portsmouth will transport by train are (1) the percentage of containers with distant destinations
where rail is the least expensive mode of transportation (e.g., those containers bound for Norfolk
Southern’s Heartland Corridor or CSX’s National Gateway), (2) the percentage of cargo for
which quick delivery is not critical, and (3) whether local import DCs built for de-consolidation
and re-shipment will support incoming rail shipments. For the portion of port traffic that is short
haul, including shipments to local DCs without rail connections, and where timely delivery is
required, rail will be either infeasible or uneconomical. For example, the VPA has estimated that
29% of the containers arriving at its Hampton Roads area marine terminals are destined for
nearby locations: Norfolk, Virginia Beach, Newport News, Hampton, Suffolk, Portsmouth,
Chesapeake, Poquoson, and Williamsburg. Moreover, a recent economic impact study estimates
that 39.5% of imports are destined for Virginia in total.27
27 The Fiscal year 2006 Virginia Economic and Fiscal Impacts of Virginia Port Authority Operations, The
Compete Center of the College of William and Mary, January 2008.
For these containers, and an additional

46
percentage of containers bound for destinations within 400 miles to 500 miles of the port, it is
unlikely that any feasible or economic rail transport option currently exists. Thus, less than 60%,
possibly much less, of incoming containers can move out of a terminal by rail economically. An
incentive fee on trucks intended to motivate a decision towards rail rather than truck will sway
the decision only for those shipments at the margin, 400 to 500 miles from the port, where rail is
equal to or slightly more expensive than truck. Depending on the size of the fee/incentive, it
may therefore affect transportation mode decisions for only a small portion of port traffic. For
the majority of truck traffic, which would still be less expensive than rail even with the fee, or
where timely delivery is required, the fee instead of being an incentive to transport by rail will
make shipping through Portsmouth less competitive with other port terminals.
Craney Island Marine Terminal (CIMT) is being built with the expectation that 50% of the
containers will leave by train—the same as the original expectation for the Alameda Corridor.
Assuming that the percentage of containers arriving at CIMT destined for Virginia as their first
stop is the figure currently quoted by the VPA, then this implies that 83% of the containers
destined for distant destinations leave CIMT by train (50% divided by 60%). To the degree that
efficient rail connections were built to local large-scale intermodal parks in Hampton Roads, less
than 83% of long-distance containers would to be transported by rail. Given the trends toward
more timely delivery, this goal may be too ambitious. As previously mentioned, 31% of
containers leave Hampton Roads port terminals via rail.
Care must also be exercised in the execution of incentives because of the networked nature of
the transportation network. The complex interrelated web of multiple modes and parties can
make it difficult to anticipate all possible affects of an incentive. Finally, we must keep in mind
that the Port of Virginia is in competition with other ports, most notably the Port of New York,

47
The Port of Georgia, and the Port of Charleston. While an incentive may be intended to sway
traffic from one transportation mode to another, incentives in the form of fees, traffic regulations,
or restrictions can be so significant that the Port of Virginia may lose business to other ports.
Thus, the economic advantage that Virginia and, particularly, the Hampton Roads area derives
from the port would be diminished or even eliminated.
3.3.2 Incentive Examples
The first incentive example (as mentioned above) is the method by which ACTA administers
its transportation surcharge for the Alameda Corridor—the railroads must pay the transportation
surcharge for every container that flows from a San Pedro Bay port to the Intercontinental Rail
Yard regardless of whether the container arrives at the rail yard by truck or over the Alameda
Corridor rail. Providing that the required rail infrastructure exists at all port terminals, this may
be an effective incentive to promote rail transport out of terminals, although that has not always
been the case for containers arriving at Pedro Bay ports due to the reasons previously mentioned.
In considering the redistribution of truck traffic in and out of a port terminal, one such
alternative is PierPASS, which is a program enforced at the Ports of Los Angeles and Long
Beach. The PierPASS web site describes the PierPASS organization and its purpose as the
following:
“PierPASS is a not-for-profit organization created by marine terminal operators to
reduce congestion and improve air quality in and around the Ports of Los Angeles and
Long Beach.
“OffPeak is the off-peak hours program created by PierPASS. OffPeak provides an
incentive for cargo owners to move cargo at night and on weekends, in order to reduce

48
truck traffic and pollution during peak daytime traffic hours and to alleviate port
congestion.”28
PierPASS effectively increases the cost of moving a container from the port during peak
traffic hours. The charge is $50 for a 20-foot container and $100 for a 40-foot container.
29 The
fees are used to staff the off-hour gate operations according to the Ports of Los Angeles and
Long Beach.30 Although the PierPASS web site cites the Mayor of Los Angeles and Senator
Barbara Boxer as touting the benefits accruing to Los Angeles through the successful incentive
provided by PierPASS, caution is warranted—any time an additional fee is imposed one must
consider shippers options to switch business to another port; in this case the Port of Oakland is a
competing port. One survey at the inception of PierPASS indicated that 56% of shippers planned
to divert at least some cargo to other ports because of the PierPASS OffPeak program.31 Later
research by the same organization, after only two weeks of PierPASS operation, suggested that
PierPASS might be a success, having motivated 30% of traffic to migrate to off hours and
beating a target percentage of 15-20% in the first year of operation.32
28 http://www.pierpass.org/
While the short-term
experience may be termed an effect, the long-term effect may still lie in the balance because the
contracts between shipping lines and ports are typically long term so that shipping lines are not
able to switch ports of call in the short term.
29 PierPass Fee Defended, PacificShipper, May 26, 2008. http://www.pacificshipper.com/news/article.asp?ltype=west_coast&sid=32297
30 PierPass Fee Defended, PacificShipper, May 26, 2008. http://www.pacificshipper.com/news/article.asp?ltype=west_coast&sid=32297
31 http://www.highbeam.com/doc/1G1-134678222.html, July 1, 2005 32 http://www.highbeam.com/doc/1G1-135018885.html, August 11, 2005

49
A paper by Robert C. Leachman33
Other incentives may not be of a direct financial type. For example, building a large
concentrated intermodal park that is feasibly and economically served by rail may provide an
incentive to migrate transportation from truck to rail, while making a port more attractive to
shippers.
of the University of California at Berkeley assesses how
increased fees (such as that imposed by the PierPASS OffPeak program and road tolls) and the
costs of increased congestion motivates shippers to move their business to other ports. While
considering a fee to shape behavior of trucking companies, one must ask the question: how much
can fees be increased before a shipper will use another port?
3.4 Public-Private Partnerships
Creating a well-functioning port requires the participation and cooperation of many parties
who share in the benefits and costs of economic growth. Private enterprises and individuals
including trucking companies, shipping lines, port terminal operators, terminal workers,
distribution center workers, freight forwarders, railroads and their employees all share in the
benefits of increased trade through Hampton Roads. Municipalities also benefit, particularly
when companies locate within their boundaries and pay property and business taxes. Costs to
municipalities include increased road congestion and financial outlays to bolster and maintain
infrastructure.
The Alameda Corridor raises the issue of equity in how equitably the municipalities and
citizenry share in the costs and benefits of port activity. While the cities of Long Beach and Los
33 Robert C. Leachman, Port and Modal Allocation of Waterborne Containerized Imports from Asia to the
United States, Transportation Research Part E, Vol. 44, 2008, 313-331.

50
Angeles presumably benefitted from the Alameda Corridor with the capability it provided the
ports to handle more cargo, some of the cities along the Alameda Corridor did not feel as they
were sharing in any of the benefit, although they were shouldering much of the cost in terms of
disruption during the Corridor’s construction:
“The mid-corridor cities remained concerned about the local effects of construction
activity, increased rail traffic, and other negative impacts on residents and businesses
adjacent to the Corridor. They persisted with these concerns, arguing that while the
benefits of the project were widely dispersed regionally and even nationally, its external
costs and adverse impacts were highly concentrated in the areas through which the
corridor passed. The dissenting cities were focused primarily on the local economic
benefits of the project and felt that ACTA was not giving adequate attention to their
economic development needs.”34
Thus, one of the challenges of the Alameda Corridor was to bring all the municipalities,
railroads, and other parties together so that all stakeholders felt as though they shared equitably
in the benefits.
This challenge is also likely to arise in Hampton Roads as the trade through the port
increases. It is imperative that all municipalities come together with the other relevant parties
such as APM and VPA, to actively negotiate solutions and policies that ensure that the costs and
benefits are shared equally. Where one party acts unilaterally, unanticipated fallout is possible
for other municipalities. For example, consider the fairly recent decision by Norfolk to place
traffic restrictions on Hampton Boulevard for tractor-trailers. Our sources have stated that that
34 From The Alameda Corridor: A White Paper, by A. Agarwal, G. Giuliano, and C. Redfearn, School of
Policy, Planning and Development, University of Southern California, June 2004, page 15

51
this restriction has substantially affected traffic patterns not only in Norfolk, but in Portsmouth;
dray trucks get their runs at NIT early in the day before restrictions take effect and then shift over
to the Portsmouth APM terminal in the afternoon. The result is more pronounced spikes on both
sides of the water due to the unilateral action of a municipality. A danger here is that absent
communication and collaboration individual actors will take actions for their own benefit which
affect other players in unforeseen ways based on the economic pressures placed on those making
mode and route decisions. Even worse is the possibility that individual constituencies could in a
series of unilateral actions taken for their own benefit create a port environment in Hampton
Roads that is uncompetitive with ports in Georgia and South Carolina that are our competition.
One possibility for a public-private partnership to remove traffic from roads is the thoughtful
development of an intermodal park, such as the Centerpoint example that we discuss herein.
Characteristics of an effective intermodal park would require the collaboration of Hampton
Roads municipalities, private companies that develop the park, railroads, trucking companies,
Virginia transportation authorities, Virginia government, and federal government include:
• A large intermodal facility that would serve to concentrate shipments from port terminal
to make rail connections viable.
• Be situated along roadways that are capable, or made capable through enhancements, of
the truck traffic could not be feasibly handled by rail.
• Have routes from all Hampton Roads terminals to the intermodal park be feasible and
economic.
These criteria might require multiple intermodal parks on both sides on Norfolk Harbor, which is
currently a barrier to the efficient flow of traffic through Hampton Roads.

52
3.5 Conclusions
The transportation modes that create the best possible situation for a municipality must be
feasible for logistics companies and shippers as well as being economically viable. First, if, for
example, a municipality is best served by having the greatest possible percentage of traffic in and
out of a port be over rail, then the rail infrastructure must be present to make that possible.
Beyond feasibility, rail must be the most economical means if one hopes shippers to use it. This
may happen naturally due to market forces. However, in the more likely event where a desired
outcome is not natural, coordination via public-private partnerships and fees may be necessary to
create the proper economic incentives. Cooperation between all public and private port
stakeholders is paramount to creating a port that is competitive, where traffic patterns and
transportation modes create as little downside as possible, and where the costs and benefits are
shared equitably. Caution is warranted, however, in using fees as incentives to induce desired
outcomes—such fees or non-monetary restrictions should not be sufficiently onerous that the
flow of goods is diverted to other ports.
4.0 Case Study: Centerpoint Intermodal Park Development
We discussed in the introduction how increased global trade has increased the need for
import distribution centers located near marine terminals, including in the Hampton Roads area.
One such intermodal park has been proposed by Centerpoint to be located just west of downtown
Suffolk, VA along U.S. 58/Holland Road. We will use this proposed development to discuss
intermodal parks in general and how one might be deployed in Hampton Roads. The

53
specifications for that proposed development as summarized in Exhibit 11 have been quoted in
several articles in The Virginian-Pilot.35
Exhibit 11—Specifications of Centerpoint Intermodal Park
Characteristic Data Location West of downtown Suffolk, VA, off of U.S.
58/Holland Road Land Area of intermodal park 900 acres Distribution floor space 5.8 million square feet Number of buildings 13 Time to complete build-out 7 to 10 years Adjacent rail yard Yes Container yard on premises Capacity of 500 containers Projected additional traffic on Holland Road by 2017 (Craney Island completion)
10,500 additional daily trips
The main issues that are being debated amongst Centerpoint, the Suffolk City Council, and
concerned residents are: (1) Increased traffic congestion on roads, (2) what road improvements
are necessary for U.S. 58/Holland Road, (3) how much the improvements will cost, and (4)
where the funds will come from to fund the road enhancements.36
35 Suffolk in denial on CenterPoint project, Editorial, the Virginian-Pilot, December 21, 2008.
Thus, one point of negotiation
between Suffolk and Centerpoint is the share of the cost of road improvements that each will
bear in order to facilitate increased traffic in the area. This is an example of issues that public-
private partnerships must face.
36 For Rezoning, Developer would Pay to Widen Suffolk Road, by Dave Forster, the Virginian-Pilot, November 15, 2008.

54
There is an additionally issue that needs consideration—current and future capacity needs.
At the time of the writing of this analysis (first quarter of 2009), there has been a substantial
slowdown in Port activity that has led to excess capacity of existing resources related to
warehousing/distribution. Anecdotally, it is believed that there may be 10 million square feet of
warehouse space that is unused or substantially underused in Hampton Roads. The result is a
considerable economic difficulty for local warehousing/distribution businesses. Under these
circumstances, the promotion of alternatives that may add two to as many as six times more
capacity requires very careful analysis—is the capacity that is needed already available, is the
appropriate type of capacity by location and capability available, and will adding capacity further
exacerbate an already difficult problem for existing businesses?
4.1 Surface Traffic
To gauge the impact of the Centerpoint development on road congestion in Portsmouth, we
ideally would want to determine from trucking companies which route(s) they would expect their
drivers to take from either APM Terminals or Craney Island to Centerpoint. We do not yet have
that input, which we are currently seeking. In lieu of direct input from truckers, we observed the
route Mapquest.com suggested:
1. 164 West from APM Terminals
2. I664 South to Exit 13A
3. US 58 West to Holland Road/Manning Bridge Road intersection
Mapquest estimates this route at 26.5 miles and 30 minutes. The advantage of this route is that
all these roads are highways or commercial roads.

55
Only the Highway 164 leg is within Portsmouth City limits. That route was not one
identified by The Hampton Road Planning District Commission as having high truck traffic
volume in a 2001 report37
4.2 Rail Connections
, although conditions may have changed in the intervening 7 years.
Thus, the Centerpoint location is a desirable location in terms of the traffic impact on Portsmouth
because the traffic is likely to be confined to major arteries.
The location of the Centerpoint development would also seem to be fortuitous in terms of
how it is situated with respect to railroads: it is located between CSX and Norfolk Southern lines,
just west of the end of the Commonwealth Railways connection with APM Terminals and the
future Craney Island Marine Terminal. (See Exhibits 12 and 13.) An article from the Virginian-
Pilot reported that “A rail-yard component [in the Centerpoint development] would feature a
storage area big enough to hold 500 containers stacked four high.”38
More generally, any rail connection to large intermodal parks will lessen the load on the
road infrastructure, and the degree to which intermodal parks can be sufficiently large to
concentrate an inflow of containers, it will make such a rail connection more feasible. The
We were unable to
ascertain whether this rail yard was intended for incoming cargo, outgoing cargo, or both. To the
degree it might accommodate incoming cargo, this would lessen the load on the Highway 164
through Portsmouth.
37 “Intermodal Management System for Hampton Roads, Virginia 2001,” Hampton Roads Planning
Commission, December 2001. 38 Dave Forster, “For Rezoning, Developer Would Pay to Widen Suffolk Road,” November 15, 2008.

56
location of an intermodal park, thus, requires planning and sufficient coordination of all public
and private parties involved to create a critical mass amenable to rail transport.
4.3 Conclusions
The following is a summary of important conclusions from the Centerpoint proposal:
• For any given truck volume hauling containers out of APM Terminals and Craney Island,
the proposed Centerpoint location has a minimum impact on the streets through
Portsmouth—the impact is along a major artery that is best suited to commercial traffic.
We would, however, suggest that the City of Portsmouth contact the Hampton Roads
Planning District Commission to get an update on traffic congestion and truck traffic on
Highway 164.
• Given the forecast that Moffatt & Nichol has made suggesting that Hampton Roads needs
between 20 and 60 million square feet of distribution center capacity, we can expect other
intermodal parks and individual distribution centers to be built in Hampton Roads or
nearby, and other locations proposed for intermodal parks or DCs in the future may not
be so advantageous as the proposed location for the Centerpoint development. In total,
this amount of distribution capacity could have a large detrimental impact on traffic in
Portsmouth as well as all over Hampton Roads if intermodal parks are allowed to develop
in an uncontrolled manner. Thus, Portsmouth should participate, and influence to the
degree possible, the location of intermodal parks and distribution centers in other
municipalities that affect Portsmouth. A proactive, collaborative approach with other
municipalities is essential in identifying appropriate locations for these intermodal parks.
Also, it is likely under the current economic conditions that the need for this additional
capacity may be optimistic, or at a minimum, the capacity usage anticipated will be

57
delayed; by exactly how much is very difficult to predict. As we stated above, there is
anecdotal evidence of as much as 10 million square feet of unused warehouse/distribution
space currently in the Hampton Roads area.
• Given that all truck traffic out of Portsmouth terminals must travel on some street through
Portsmouth, if Portsmouth has a goal of reducing traffic, then that goal implies
influencing as much as possible the flow of containers out of Portsmouth marine
terminals via rail and barge. This influence, however, is limited to those shipments that
can be transported by rail or barge in a cost efficient manner, and in a manner that meets
shipper’s delivery time requirements. These points are discussed in greater depth
elsewhere in this report.

58
Exhibit 12: Location of Proposed Centerpoint Development Relative to Railroads

59
Exhibit 13: Proposed Centerpoint Development Location Relative to Suffolk and Surface Streets

60
5.0 Contact List of Organizations Involved in Hampton Roads
Transportation
The following is a partial list of the contacts either interviewed for this white paper or in
some fashion providing valuable information for the development of the white paper. These
contacts may be helpful in facilitating future collaborative efforts regarding the flow of traffic
and, in particular, freight movement throughout Hampton Roads.
Organization Contact Information
Centerpoint
David France Kimley-Horn 501 Independence Way Suite 300 Chesapeake, VA 23320 Phone: 548-7300 Cell: 761-0181
Commonwealth Railways
Andrew T. Chunko Rail Link—VP Port Operations Phone: 904-596-7794 Fax: 904-223-8710 [email protected]
DD Jones
Donnie Goldberg Phone: (757) 494-0257 Cell: (757) 407-2842 [email protected]
Hampton Roads Planning and Development
Commission (HRPDC)
Camelia Ravanbakht Deputy Executive Director The Regional Building 723 Woodlake Drive Chesapeake, VA 23320 757-420-8300 [email protected]

61
Moffat & Nichol
Michael T. Crist, P.E. Vice President Moffatt & Nichol 800 World Trade Center Norfolk, VA 23510 Phone: 757-628-8222 Fax: 757-628-8244 [email protected]
Nelson International Custom Brokers/Freight
Forwarders
Julie Becker 757-461-8111
Norfolk Tug Company
Ed Whitmore 757-406-6937
Virginia Port Authority (VPA)
Cary Hagen Director of Marketing Virginia Port Authority 600 World Trade Center Norfolk, VA 23510 Phone: 757-683-8000 Fax: 757-683-8500 [email protected]
6.0 Summary and Conclusions
The complexities of the supply chains of a major port, like the Ports of Virginia, are
undeniable. The various links and resources of the supply chain—transportation, warehousing,
and distribution—develop out of necessity, and they are rarely developed in a systematically
manner. This approach, although natural in our economic system, can lead to a serious omission
of the perspective and the opinions of a number of important stakeholders: local citizenry,
municipalities and regional planning agencies, and other geographically related stakeholders. In
this white paper, we have attempted to focus on the need for all stakeholders to think and plan
broadly in the development of our ports and related supply chains. The key to a form of
participation that contributes positively to this development is through an understanding of the

62
structure, operations, and special problems of supply chains. This participation is not easy, but
to not participate is an invitation to having undesirable or, even, disastrous conditions and
outcomes imposed on communities.
Therefore a prescription for effective participation should include:
1. A technical understanding of the supply chain system—e.g. what are the current modes
and methods of transport, warehousing, and distribution.
2. An understanding of potential alternatives to the various problems and issues—e.g. what
are the differences between rail and truck transport and when is one preferred to another.
3. An understanding of how supply chain structures in the Hampton Roads area might
evolve as global commerce evolves. Understanding what types of facilities will be
needed (i.e., intermodal parks) and how many is important information for planning.
4. An eye to evolving technologies that may seen distant, but that can offer new and
interesting solutions to old problems—e.g. barge, double-stacked rail, and new forms of
intermodal transport.
5. Consider incentive structures carefully, so that the whole of Hampton Roads is taken into
consideration and the chance of unintended consequences are minimized. An
understanding of rail, truck, and barge economics is essential to the construction of
effective incentives.
It is impossible to fathom the future of our port and supply chains, but it is clear that our
emerging international economic system will require them to support the safe, efficient, and
sustainable transport of goods for the foreseeable future. The economic success of Hampton
Roads will likely be closely linked to this form of trade, especially as we become less dependent
on manufacturing and military activity in Hampton Roads. But, a proactive and collaborative

63
approach among all concerned public and private parties is essential so that Hampton Roads can
benefit from the continued economic development of our ports.

64
APPENDIX A
Almeida, P. and B. Kogut. 1997. “The Exploration of Technological Diversity and the Geographic Localization of Innovation.” Small Business Economics 9: 21-31.
Arrow, K. J. 1962. “The Economic Implications of Learning by Doing.” Review of Economic Studies 29: 155-173.
Arthur, B. 1990. “Positive Feedbacks in the Economy.” Scientific American 262 (2): 92-99.
Audretsch, D. B., and M. P. Feldman. 1996. “Innovative Clusters and the Industry Life Cycle.”
Review of Industrial Organization 11: 253-273.
Austrian, Z. 2001. “Cluster Case Studies: The Marriage of Quantitative and Qualitative Information for Action.” Economic Development Quarterly 14: 97-110.
Bathelt, H., A. Malmberg, and P. Maskell. 2002. “Clusters and Knowledge: Local Buzz, Global Pipelines and the Process of Knowledge Creation.” Copenhagen: Danish Research Unit for Industrial Dynamics.
Benneworth, P., and N. Henry. 2004. “Where Is the Value Added in the Cluster Approach?
Hermeneutic Theorizing, Economic Geography, and Clusters as a Multiperspectival Approach.” Urban Studies 41 (5/6): 1011-1024.
Bresnahan, T., A. Gambardella, and A. Saxenian. 2001. “Old Economy Inputs for New Economy
Outcomes: Cluster Formation in the New Silicon Valleys.” Industrial and Corporate Change,10 (4): 835-860.
Brusco, Sebastiano. 1982. "The Emilian Model: Productive Decentralisation and Social Integration." Cambridge Journal of Economics 6 (2): 167-84.
Center on Wisconsin Strategy. 2005. “Effective Workforce Training on the Frontline: Observations from the Industry Partnerships Project.” Madison, WI.
Cheshire, P. C., and E. J. Malecki. 2004. “Growth, Development and Innovation: A Look Backward and Forward.” Papers in Regional Science 83: 249-267.
Cortright, J. 2002. “The Economic Importance of Being Different: Regional Variations in Tastes, Increasing Returns and the Dynamics of Development.” Economic Development Quarterly, 16 (1): 3-16.

65
Cortright, J., and J. Provo. 2000. “Metropolitan Portland's Nursery Industry Cluster.” Portland, OR: Institute for Portland Metropolitan Studies, Portland State University.
Dahl, M. S., and C. O. R. Pedersen. 2004. “Knowledge Flows through Informal Contacts in Industrial Clusters: Myth or Reality?” Research Policy 33 (10): 1673-86.
Daly, M. C., and R. G. Valletta. 2004. “Performance of Urban Information Technology Centers: The Boom, the Bust and the Future.” Federal Reserve Bank of San Francisco Economic Review, 2004: 1-18.
Desrochers, P., and F. Sautet. 2004. “Cluster-Based Economic Strategy, Facilitation Policy and the Market Process.” Review of Austrian Economics 17 (2-3): 233-245.
Drabenstott, M. 2005. “A Review of the Federal Role in Regional Economic Development.” Kansas City: Federal Reserve Bank of Kansas City.
Dumais, G., G. Ellison, and E. L. Glaeser. 2002. “Geographic Concentration as a Dynamic Process.” Review of Economics and Statistics 84 (2): 193-204.
Duranton, G., and D. Puga. 2001. Nursery Cities: Urban Diversity, Process Innovation, and the Life Cycle of Products. American Economic Review 91 (5), 1454-1477.
Ellison, G., and E. L. Glaeser. 1999. “The Geographic Concentration of Industry: Does Natural
Advantage Explain Agglomeration?” American Economic Review 89 (2): 311-316.
Feldman, M. 2004. “Truth for its Own Sake: Academic Culture and Technology Transfer at Johns Hopkins University.” Minerva 42: 105-126.
Feldman, M. P., J. Francis, and J. Bercovitz. 2005. “Creating a Cluster While Building a Firm:
Entrepreneurs and the Formation of Industrial Clusters.” Regional Studies 39 (1): 129-141.
Feser, E. 2004. “Industry Clusters and Economic Development: A Learning Resource, Community and Economic Development Toolbox.”
Feser, E. J., and E. M. Bergman. 2000. “National Industry Cluster Templates: A Framework for
Applied Research Analysis.” Regional Studies 34 (1): 1-19.
Feser, E. J., and M. I. Luger. 2002. “Cluster Analysis as a Mode of Inquiry: Its Use in Science and Technology Policymaking in North Carolina.” European Planning Studies 11 (1): 11-24.
Feser, E. J., and others. 2001. “Incorporating Spatial Analysis in Applied Industry Cluster Studies.” Working paper. Chapel Hill: University of North Carolina.
Frenken, K., F. G. van Oort, and T. Verburg. 2005. Variety and Regional Economic Growth in the Netherlands. Aalborg, Denmark: Regional Growth Agendas.

66
Fromhold-Eisebith, M., and G. Eisebith. 2004. How to Institutionalize Innovative Clusters?
Comparing Explicit Top-Down and Bottom-Up Approaches. Berlin: Regionalization of
Innovation Policy - Options and Experiences.
Fujita, M., P. R. Krugman, and A. Venables. 1999. The Spatial Economy: Cities, Regions and International Trade. MIT Press.
Garcia-Mila, T., and T. J. McGuire. 1998. “A Note on the Shift to a Service-Based Economy and the Consequences for Regional Growth.” Journal of Regional Science 38 (2): 353-363.
Gibbs, R. M., and G. A. Bernat. 1998. “Rural Industry Clusters Raise Local Earnings.” Rural Development Perspectives 12: 18-25.
Giloth, R. P. 2000. “Learning From the Field: Economic Growth and Workforce Development in the 1990s.” Economic Development Quarterly 14 (4): 340-359.
Gordon, I. R., and P. McCann. 2000. “Industrial Clusters: Complexes, Agglomeration and/or Social Networks?” Urban Studies 37 (3): 513-32.
Harrison, B., M. R. Kelley, and J. Gant. 1996. “Specialization Versus Diversity in Local Economies: The Implications for Innovative Private-Sector Behavior.” Cityscape: A Journal of Policy Development and Research 2 (2): 61-93.
Held, J. R. 2004. “Regional Variation and Economic Drivers: An Application of the Hill and Brennan Methodology.” Economic Development Quarterly 18 (4): 384-405.
Herzenberg, S. A., J.A. Alic, and H. Wial. 1998. New Rules for a New Economy. ILR Press of Cornell University Press.
Hill, E. W., and J. F. Brennan. 2000. “A Methodology for Identifying the Drivers of Industrial Clusters: The Foundation of Regional Competitive Advantage.” Economic Development Quarterly 14 (1): 65.
Holmes, T. J., and J. J. Stevens. 2004. “Spatial Distribution of Economic Activities in North America.” In J.V. Henderson and J.-F. Thisse, eds., Handbook of Regional and Urban Economics, vol. 4. Amsterdam: Elsevier North-Holland.
Ketels, C. 2003. “The Development of the Cluster Concept: Present Experiences and Further Developments.” Paper prepared for NRW Conference on Clusters, Duisberg, Germany.
Krugman, P. 1991. Geography and Trade. MIT Press.
Krugman, P. 1995. Development, Geography and Economic Theory. Cambridge: MIT Press.

67
Markusen, A. 1996. “Sticky Places in Slippery Space: A Typology of Industrial Districts.” Economic Geography 72 (3): 293-314.
Martin, R., and P. Sunley. 2003. “Deconstructing Clusters: Chaotic Concept or Policy Panacea?” Journal of Economic Geography 3: 5-35.
Maskell, P., and L. Kebir. 2005. “What Qualifies as a Cluster Theory?” Copenhagen: Danish Research Unit for Industrial Dynamics.
Munnich, L. W., G. Schrock, and K. Cook. 2002. “Rural Knowledge Clusters: The Challenge of Rural Economic Prosperity.” Working paper. Minneapolis: State and Local Policy Program, Humphrey Institute of Public Affairs, University of Minnesota.
Office of Management and Budget. 1998. North American Industry Classification System, 1997.
Ottaviano, G. 2003. “Regional Policy in the Global Economy: Insights from the New Economic Geography.” Regional Studies 37: 665-673.
Pastor, M., P. Dreier, and M. Lopez-Garcia. 2000. Regions That Work: How Cities and Suburbs Can Growth Together. University of Minnesota Press.
Piore, M., and C. Sabel. 1984. The Second Industrial Divide. Basic Books.
Porter, M. E. 1990. The Competitive Advantage of Nations. Free Press.
Porter, M. E. 1998. “Clusters and the New Economics of Competition.” Harvard Business Review: 77-90.
Porter, M. E. 2000. “Location, Competition, and Economic Development: Local Clusters in a Global Economy.” Economic Development Quarterly 14 (1): 15-34.
Porter, M. E. 2003. “The Economic Performance of Regions.” Regional Studies 37 (6/7): 549-578.
Porter, M. E. 2003. “San Diego: Clusters of Innovation Initiative.” Cambridge, MA: Monitor Group.
Power, D., and M. Lundmark. 2004. “Working Through Knowledge Pools: Labor Market Dynamics, the Transference of Knowledge and Ideas, and Industrial Clusters.” Urban Studies 41 (5-6): 1025-1044.
Robinson, D. 2002. “Cluster Theory as Constructive Confusion: With Applications to Sudbury.” Sudbury, Ontario: Sudbury Mining Supply and Services Cluster Project.
Rogers, E. M., and J. K. Larsen. 1984. Silicon Valley Fever: Growth of High Technology Culture. Basic Books.

68
Rosenfeld, S. 1997. “Bringing Business Clusters into the Mainstream of Economic Development.” European Planning Studies 5 (1): 3-23.
Rosenfeld, S. 2002. “A Governor's Guide to Cluster-based Economic Development.” Washington: National Governors Association.
Rosenfeld, S. 2002. “Just Clusters: Economic Development Strategies that Reach More People and Places.” Carrboro, NC: Regional Technology Strategies, Inc.
Rosenthal, S. S., and W. C. Strange. 2004. “Evidence on the Nature and Sources of Agglomeration Economies.” In J.V. Henderson and J.-F. Thisse, eds., Handbook of Regional and Urban Economics, vol. 4. Amsterdam: Elsevier North-Holland.
Rosenfeld, S., and others. 2000. “Clusters in Rural Areas: Auto Supply Chains and Houseboat Manufacturers in Kentucky.” Contractor/Working paper 00-11. Carrboro, NC: Regional Technology Strategies.
Simmie, J. 2004. “Innovation and Clustering in the Globalized International Economy.” Urban Studies 41 (5/6): 1095-1112.
Sturgeon, T. J. 2000. “How Silicon Valley Came to Be.” In M. Kenney, ed., Understanding Silicon Valley: The Anatomy of an Entrepreneurial Region. Stanford University Press.
van der Linde, C. 2002. “Findings from Cluster Meta-Study.” Boston: Institute for Strategy and Competitiveness, Harvard Business School.
Worgan, A., and S. Nunn. 2002. “Exploring a Complicated Labyrinth: Some Tips on Using Patent Data to Measure Urban and Regional Innovation.” Economic Development Quarterly 16 (3): 229-236.