handelsbanken investor presentation stockholm august … · 1 2 3 4 5 6 7 8 9 10 ... 8 10 12...
TRANSCRIPT
Handelsbanken
January – September 2016
19 October 2016

Stable business model gives stable profitability
Higher profitability than the average of peers for 44
consecutive years
2
High
profitability
Strong capital
generation
Satisfied
customers
15% annual average growth in equity per share
including reinvested dividends since 2007
Continuously more satisfied customers than the
average of peers in all home markets since the
SKI/EPSI surveys started

Summary Q3 2016 compared to Q2 2016
3
ROE increased to 14.7% (14.2)
Operating profit increased by 8% to SEK 5,691m (5,277). Adjusted for capital gains and received
dividends, operating profit decreased by 1%
EPS increased by 8% to SEK 2.36 (2.19)
NII increased by 3% to SEK 7,041m (6,808)
C/I-ratio fell to 41.2% (44.5%)
The loan loss ratio amounted to 0.10% (0.05)
CET1 ratio increased to 24.0% (23.0)
CET1 requirement of 21.1% according to the FSA’s annual capital assessment review

Income statement, Q3
4
SEK m
Q3
2016
Q2
2016 Change
Q3
2015 Change
Net interest income 7,041 6,808 3% 6,834 3%
Net fee and commission income 2,259 2,280 -1% 2,308 -2%
Net gains/losses on financial transactions 1,112 523 113% 226 392%
Risk result - insurance 25 35 -29% 40 -38%
Other income 36 276 -87% 53 -32%
Total income 10,473 9,922 6% 9,461 11%
Staff costs -2,941 -2,952 0% -2,953 0%
Other expenses -1,371 -1,465 -6% -1,323 4%
Total expenses -4,312 -4,417 -2% -4,276 1%
Profit before loan losses 6,161 5,505 12% 5,185 19%
Net loan losses -476 -229 108% -458 4%
Gains/losses on disposal of property,
equipment and intangible assets6 1 4 50%
Operating profit 5,691 5,277 8% 4,731 20%
Taxes -1,127 -1,091 3% -1,028 10%
Net profit from discontinued operations - 8 55
Profit for the period 4,564 4,194 9% 3,758 21%
SEK 769m realised gains
in Q3 compared with SEK
89m in Q2
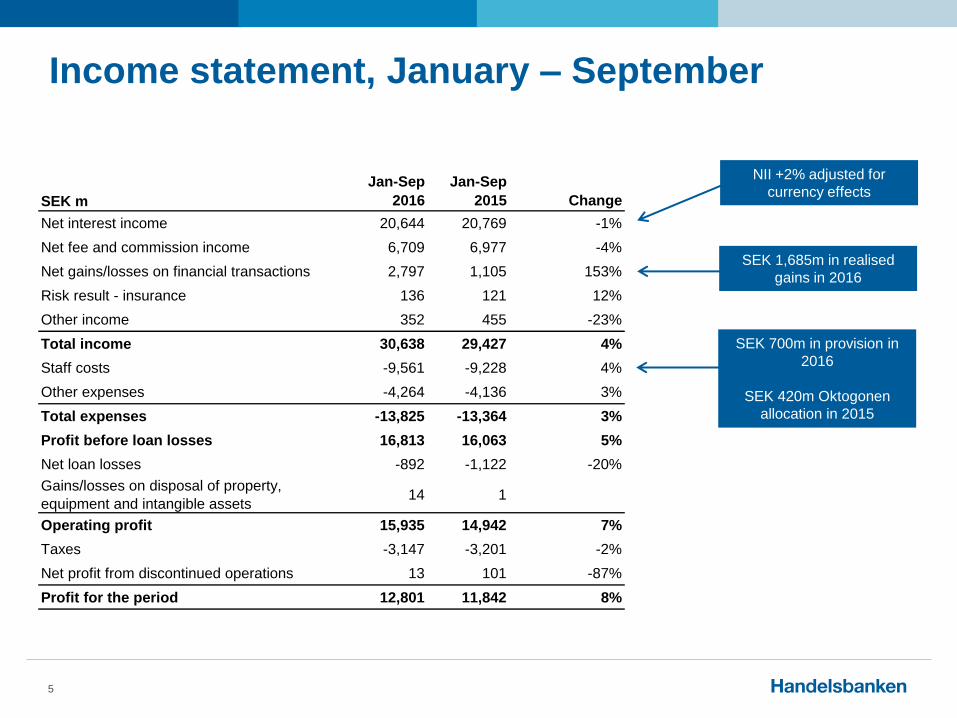
Income statement, January – September
5
SEK m
Jan-Sep
2016
Jan-Sep
2015 Change
Net interest income 20,644 20,769 -1%
Net fee and commission income 6,709 6,977 -4%
Net gains/losses on financial transactions 2,797 1,105 153%
Risk result - insurance 136 121 12%
Other income 352 455 -23%
Total income 30,638 29,427 4%
Staff costs -9,561 -9,228 4%
Other expenses -4,264 -4,136 3%
Total expenses -13,825 -13,364 3%
Profit before loan losses 16,813 16,063 5%
Net loan losses -892 -1,122 -20%
Gains/losses on disposal of property,
equipment and intangible assets14 1
Operating profit 15,935 14,942 7%
Taxes -3,147 -3,201 -2%
Net profit from discontinued operations 13 101 -87%
Profit for the period 12,801 11,842 8%
SEK 700m in provision in
2016
SEK 420m Oktogonen
allocation in 2015
SEK 1,685m in realised
gains in 2016
NII +2% adjusted for
currency effects

1,550
1,600
1,650
1,700
1,750
1,800
1,850
1,900
1,950
2,000
Q413 Q114 Q214 Q314 Q414 Q115 Q215 Q315 Q415 Q116 Q216 Q316
Good volume growth in the Group
6
Loans to the public
Increased lending volumes
in all home markets*
SEK bn
* In local currency

-1.50%
-1.00%
-0.50%
0.00%
0.50%
1.00%
1.50%
2.00%
2.50%
3.00%
-750
-500
-250
0
250
500
750
1,000
1,250
1,500
Q4 2011
Q22012
Q4 2012
Q2 2013
Q4 2013
Q2 2014
Q4 2014
Q2 2015
Q4 2015
Q2 2016
NII f rom allocated capital NII f rom deposits
3M Stibor, average per quarter (rhs)
NII from deposits and allocated capital Handelsbanken Sweden
7
SEK m
SEK 7.5bn less
annual NII due to
lower interest rates

Growth markets offset margin pressure in Sweden
8
0
1,000
2,000
3,000
4,000
5,000
6,000
7,000
8,000
Q1 1998
Q1 1999
Q1 2000
Q1 2001
Q1 2002
Q1 2003
Q1 2004
Q1 2005
Q1 2006
Q1 2007
Q1 2008
Q1 2009
Q1 2010
Q1 2011
Q1 2012
Q1 2013
Q1 2014
Q1 2015
Q1 2016
Handelsbanken home markets outside Sweden
Handelsbanken Sweden
Home market customers outside home markets and other
SEK m
Growth in other
home markets
offsets pressure
in Sweden
NII
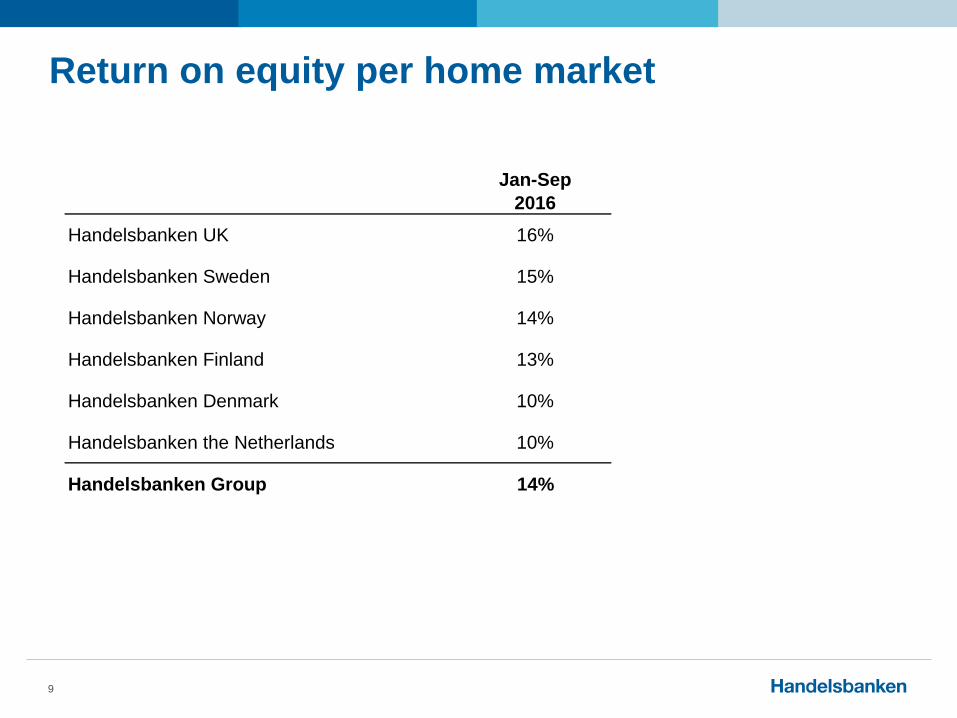
Return on equity per home market
9
Jan-Sep
2016
Handelsbanken UK 16%
Handelsbanken Sweden 15%
Handelsbanken Norway 14%
Handelsbanken Finland 13%
Handelsbanken Denmark 10%
Handelsbanken the Netherlands 10%
Handelsbanken Group 14%

69 7072
7678
82
61
67
57
70
77
73
50
55
60
65
70
75
80
85
Handelsbanken Sector average*
68
74 74
78
80
84
61
66
6972
7374
50
55
60
65
70
75
80
85
Handelsbanken Sector average*
More satisfied customers in all home markets
10
Customer satisfaction Private
Customer satisfaction Corporate
* Average of Nordea, SEB and Swedbank in Sweden
Source: SKI and EPSI 2016
Index Index

Handelsbanken is corporate bank of the year in Sweden again
11
1
2
3
4
5
Handelsbanken SEB Danske Bank Swedbank Nordea
Source: Finansbarometern (www.eastbrooklab.se/finansbarometern)
1
2
3
4
5
Handelsbanken SEB Danske Bank Swedbank Nordea
Corporate bank
of the year
Sweden’s small
enterprise bank
Rank Rank
Bank 1 Bank 2 Bank 3 Bank 4 Bank 1 Bank 2 Bank 3 Bank 4
127
96
9
22
31
-20
0
20
40
60
80
100
120
140
2010 2011 2012 2013 2014 2015 Jan-Sep 2016
Handelsbanken
Bank 1
Bank 2
Bank 3
Bank 4
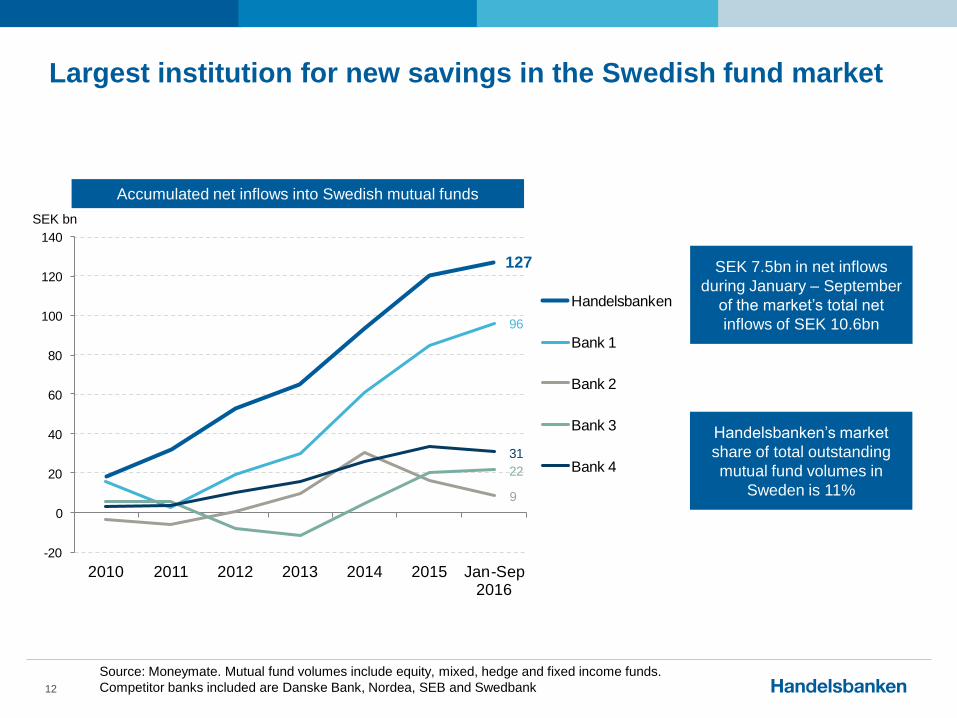
Largest institution for new savings in the Swedish fund market
12
Source: Moneymate. Mutual fund volumes include equity, mixed, hedge and fixed income funds.
Competitor banks included are Danske Bank, Nordea, SEB and Swedbank
Accumulated net inflows into Swedish mutual funds
SEK bn
SEK 7.5bn in net inflows
during January – September
of the market’s total net
inflows of SEK 10.6bn
Handelsbanken’s market
share of total outstanding
mutual fund volumes in
Sweden is 11%
UK
13
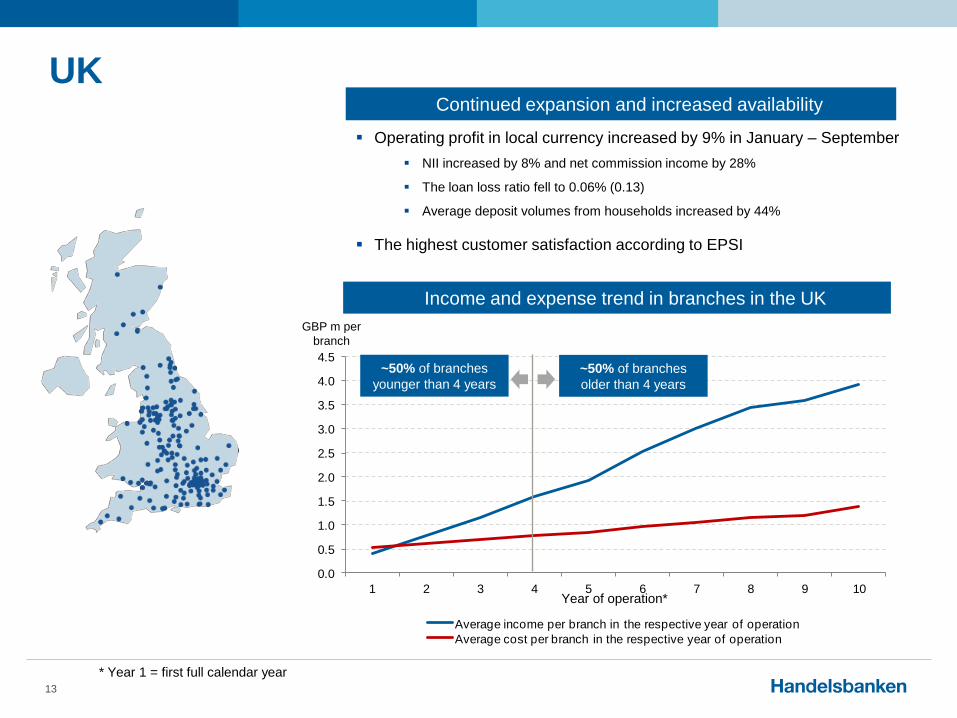
Operating profit in local currency increased by 9% in January – September
NII increased by 8% and net commission income by 28%
The loan loss ratio fell to 0.06% (0.13)
Average deposit volumes from households increased by 44%
The highest customer satisfaction according to EPSI
Continued expansion and increased availability
0.0
0.5
1.0
1.5
2.0
2.5
3.0
3.5
4.0
4.5
1 2 3 4 5 6 7 8 9 10
Average income per branch in the respective year of operation
Average cost per branch in the respective year of operation
Income and expense trend in branches in the UK
~50% of branches
younger than 4 years
~50% of branches
older than 4 years
Year of operation*
GBP m per
branch
* Year 1 = first full calendar year

0
20
40
60
80
100
120
Q311
Q411
Q112
Q212
Q312
Q412
Q113
Q213
Q313
Q413
Q114
Q214
Q314
Q414
Q115
Q215
Q315
Q415
Q116
Q216
Q316
Income: CAGR: 29%
Expenses: CAGR: 22%
UK
14
CAGR = Compounded Annual Growth Rate
Income and expense trend
GBP m
48
20
0
2
4
6
8
10
12
Jan-Sep 2015 Jan-Sep 2016
Handelsbanken the Netherlands
15
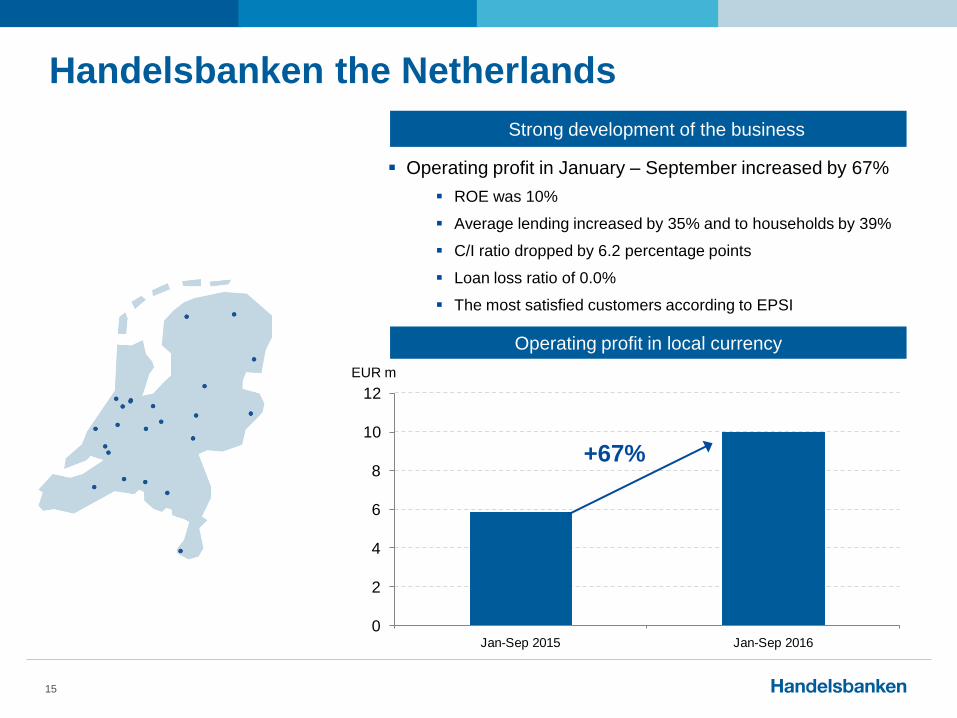
+67%
Operating profit in local currency
EUR m
Operating profit in January – September increased by 67%
ROE was 10%
Average lending increased by 35% and to households by 39%
C/I ratio dropped by 6.2 percentage points
Loan loss ratio of 0.0%
The most satisfied customers according to EPSI
Strong development of the business

Financial stability
16
Capital CRR/CRD IV, %
30 Sep
2016
31 Dec
2015 Change
Capital ratio, % 30.1 27.2 +2.9%-points
Tier 1 ratio, % 26.6 23.8 +2.8%-points
Common equity tier 1 ratio, % 24.0 21.2 +2.8%-points
Total own funds, SEK bn 139.6 128.5 +11.1
Common equity tier 1 capital, SEK bn 111.1 100.5 +10.6
Leverage ratio, % 4.2 4.4 -0.2%-points
Leverage ratio, excluding central bank
holdings, %4.9 4.9 0%-points
Liquidity
30 Sep
2016
LCR Total* 162%
LCR EUR* 178%
LCR USD* 164%
LCR according to the EU Commission's
delegated act181%
24.0
10
11
12
13
14
15
16
17
18
19
20
21
22
23
24
25
26
CET1
CET1
Q3 2016
%
Target range:
22.1-24.1
SREP 21.1
* According to the Swedish FSA’s definition
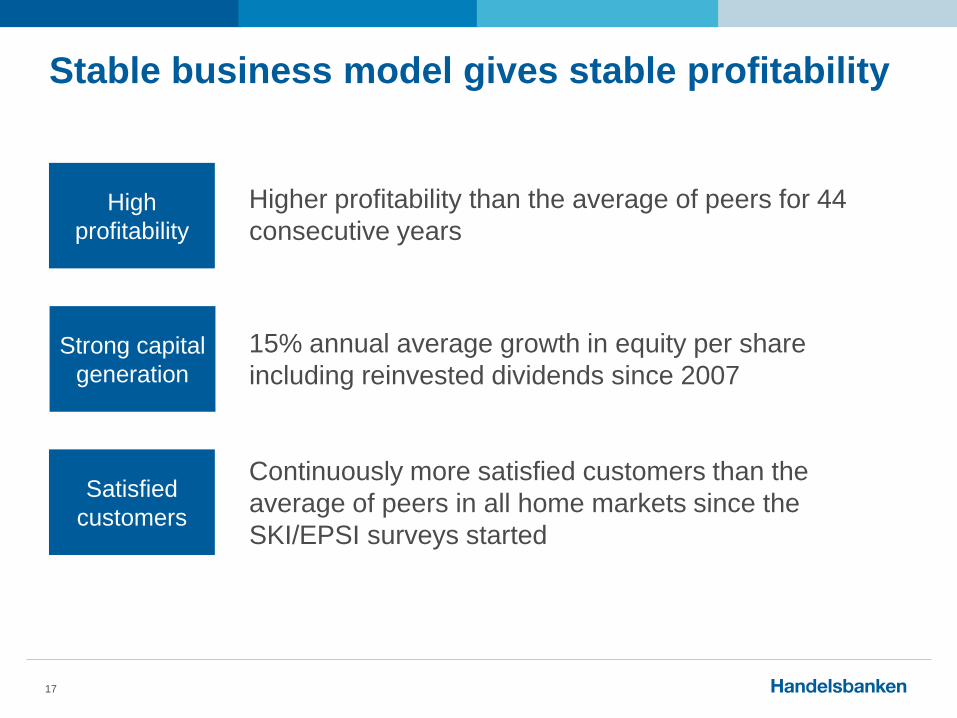
Stable business model gives stable profitability
Higher profitability than the average of peers for 44
consecutive years
17
High
profitability
Strong capital
generation
Satisfied
customers
15% annual average growth in equity per share
including reinvested dividends since 2007
Continuously more satisfied customers than the
average of peers in all home markets since the
SKI/EPSI surveys started

Appendix

0
2
4
6
8
10
12
14
16
18
2007 2008 2009 2010 2011 2012 2013 2014 2015 Jan-Sep 2016
Handelsbanken's ROE* Yield, 10-year Swedish government bond
Stable ROE relative to the “risk-free interest rate”
19
%
Stable return premium
over the business cycle
confirms the low risk
profile 9%-
points
13%-
points
14%-
points
12%-
points
Source: Handelsbanken and Factset
* Excluding capital gain from sale of SPP in 2007 and effects from recalculations of deferred taxes in 2012
-1
0
1
2
3
4
5
6
7
8
9
10
11
1990
1991
1992
1993
1994
1995
1996
Handelsbanken
Swedish peer banks*
-0.1
0.0
0.1
0.2
0.3
0.4
0.5
0.6
0.7
0.8
0.9
1.0
1.1
1997
1998
1999
2000
2001
2002
2003
2004
2005
2006
2007
2008
2009
2010
2011
2012
2013
2014
2015
Jan
-Sep
2016
Handelsbanken
Nordic peer banks**
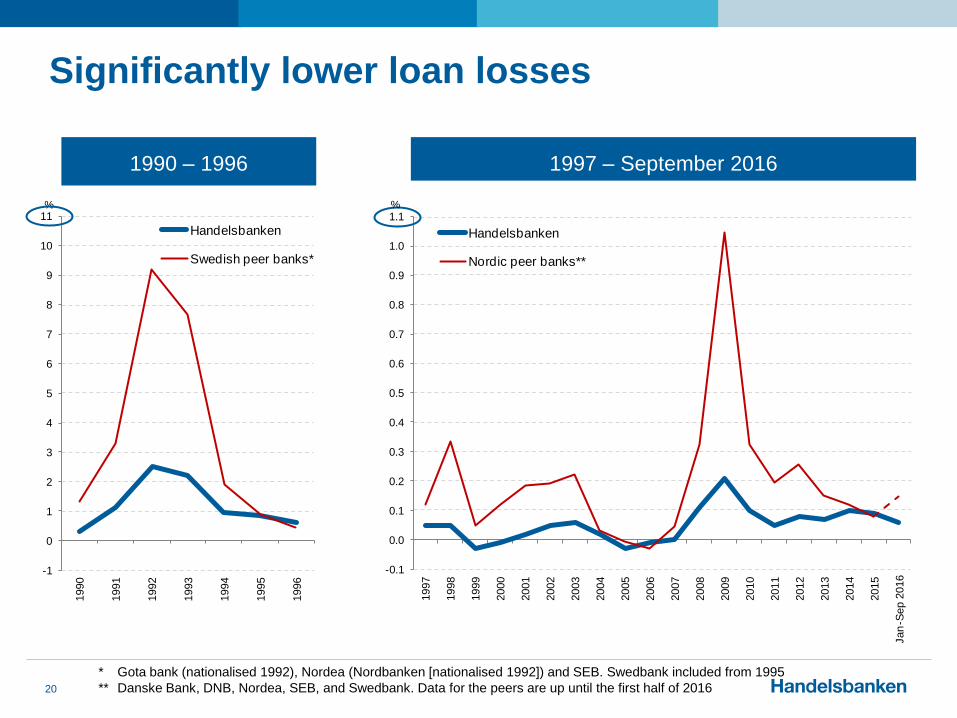
Significantly lower loan losses
20
% %
1990 – 1996 1997 – September 2016
* Gota bank (nationalised 1992), Nordea (Nordbanken [nationalised 1992]) and SEB. Swedbank included from 1995
** Danske Bank, DNB, Nordea, SEB, and Swedbank. Data for the peers are up until the first half of 2016

4.5
3.0
0.9
2.5
2.0
4.5
1.5
1.8
0.4
0
2
4
6
8
10
12
14
16
18
20
22
24
26
Pillar 1 Pillar 2
M-factor floor
Corporate risk weight add-on
Additional Pillar 2 req.
Mortgage risk weight floors
SIFI Pillar 2
Capital conservation buffer
Countercyclical buffer
SIFI Pillar 1
Minimum capital req.
24.0
0
2
4
6
8
10
12
14
16
18
20
22
24
26
CET1
CET1 ratio within the target range
21
Core capital requirement according to
FSA 2016 SREP
10.9
21.1
%
CET1
Q3 2016
%
MDA
Target range:
22.1-24.1
Kärnprimär-
kapitalrelation CET1 ratio

Income statement – five quarters
22
SEK m
Q3
2016
Q2
2016
Q1
2016
Q4
2015
Q3
2015
Net interest income 7,041 6,808 6,795 6,971 6,834
Net fee and commission income 2,259 2,280 2,170 2,343 2,308
Net gains/losses on financial transactions 1,112 523 1,162 1,503 226
Risk result - insurance 25 35 76 36 40
Other income 36 276 40 56 53
Total income 10,473 9,922 10,243 10,909 9,461
Staff costs -2,941 -2,952 -3,668 -3,353 -2,953
Other expenses -1,371 -1,465 -1,428 -1,554 -1,323
Total expenses -4,312 -4,417 -5,096 -4,907 -4,276
Profit before loan losses 6,161 5,505 5,147 6,002 5,185
Net loan losses -476 -229 -187 -475 -458
Gains/losses on disposal of property,
equipment and intangible assets6 1 7 6 4
Operating profit 5,691 5,277 4,967 5,533 4,731
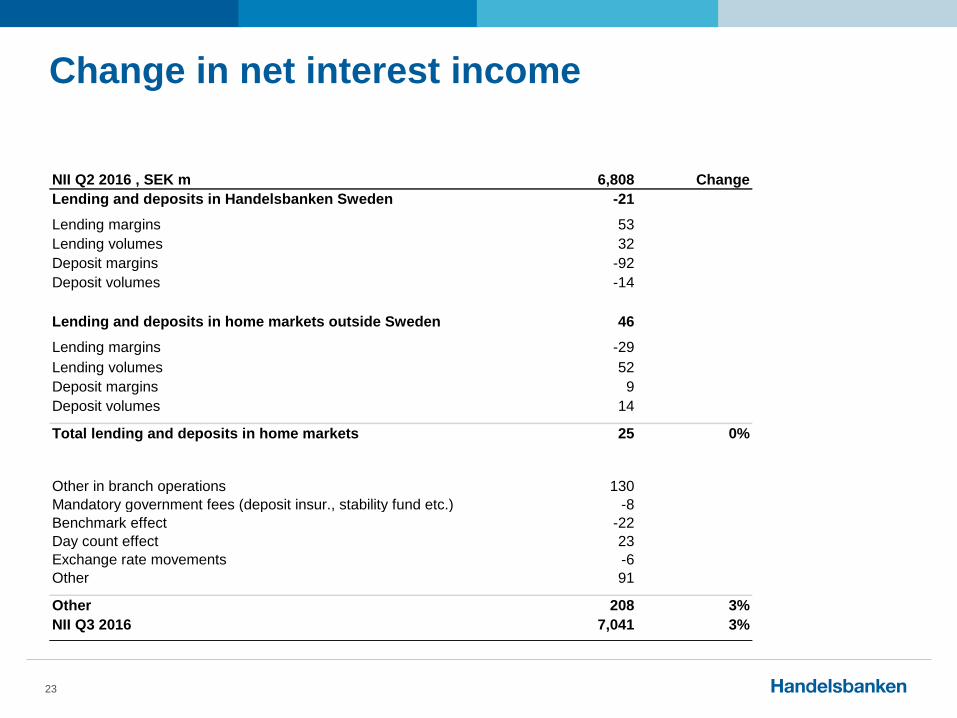
Change in net interest income
23
NII Q2 2016 , SEK m 6,808 Change
Lending and deposits in Handelsbanken Sweden -21
Lending margins 53
Lending volumes 32
Deposit margins -92
Deposit volumes -14
Lending and deposits in home markets outside Sweden 46
Lending margins -29
Lending volumes 52
Deposit margins 9
Deposit volumes 14
Total lending and deposits in home markets 25 0%
Other in branch operations 130
Mandatory government fees (deposit insur., stability fund etc.) -8
Benchmark effect -22
Day count effect 23
Exchange rate movements -6
Other 91
Other 208 3%
NII Q3 2016 7,041 3%
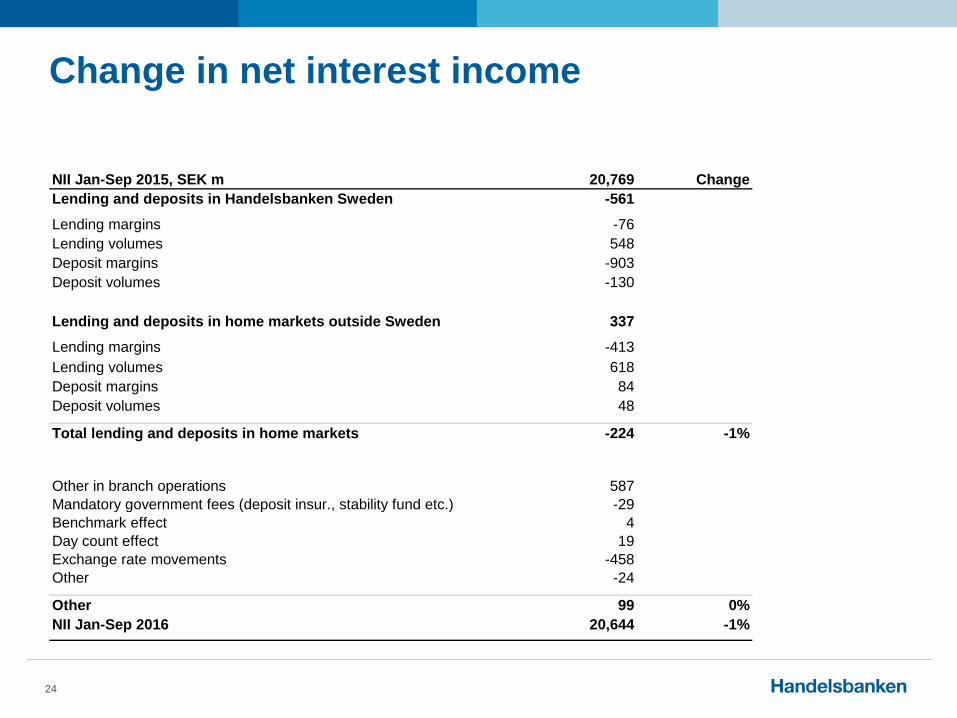
Change in net interest income
24
NII Jan-Sep 2015, SEK m 20,769 Change
Lending and deposits in Handelsbanken Sweden -561
Lending margins -76
Lending volumes 548
Deposit margins -903
Deposit volumes -130
Lending and deposits in home markets outside Sweden 337
Lending margins -413
Lending volumes 618
Deposit margins 84
Deposit volumes 48
Total lending and deposits in home markets -224 -1%
Other in branch operations 587
Mandatory government fees (deposit insur., stability fund etc.) -29
Benchmark effect 4
Day count effect 19
Exchange rate movements -458
Other -24
Other 99 0%
NII Jan-Sep 2016 20,644 -1%

Fees and commissions
25
SEK m
Jan-Sep
2016
Jan-Sep
2015 Change
Brokerage and other securities commissions 660 805 -18%
Mutual funds 2,188 2,244 -2%
Custody and other asset management fees 440 450 -2%
Advisory services 258 237 9%
Insurance 471 484 -3%
Payments 2,328 2,512 -7%
Loans and deposits 863 800 8%
Guarantees 315 313 1%
Other 362 349 4%
Total fee and commission income 7,885 8,194 -4%
Securities -186 -185 1%
Payments -934 -978 -4%
Other -56 -54 4%
Total fee and commission expense -1,176 -1,217 -3%
Net fee and commission income 6,709 6,977 -4%

Mandatory government fees
26
Q3 2016, SEK m Resolution fund Deposit guarantee Total
Sweden -102 -63 -165
UK -17 -5 -22
Denmark -7 -4 -11
Finland -11 -3 -14
Norway -20 -6 -26
Netherlands -2 0 -2
Capital Markets -18 0 -18
Other -68 - -68
Total -245 -81 -326
0
50
100
150
200
250
300
350
400
450
500
Q12009
Q32009
Q12010
Q32010
Q12011
Q32011
Q12012
Q32012
Q12013
Q32013
Q12014
Q32014
Q12015
Q32015
Q12016
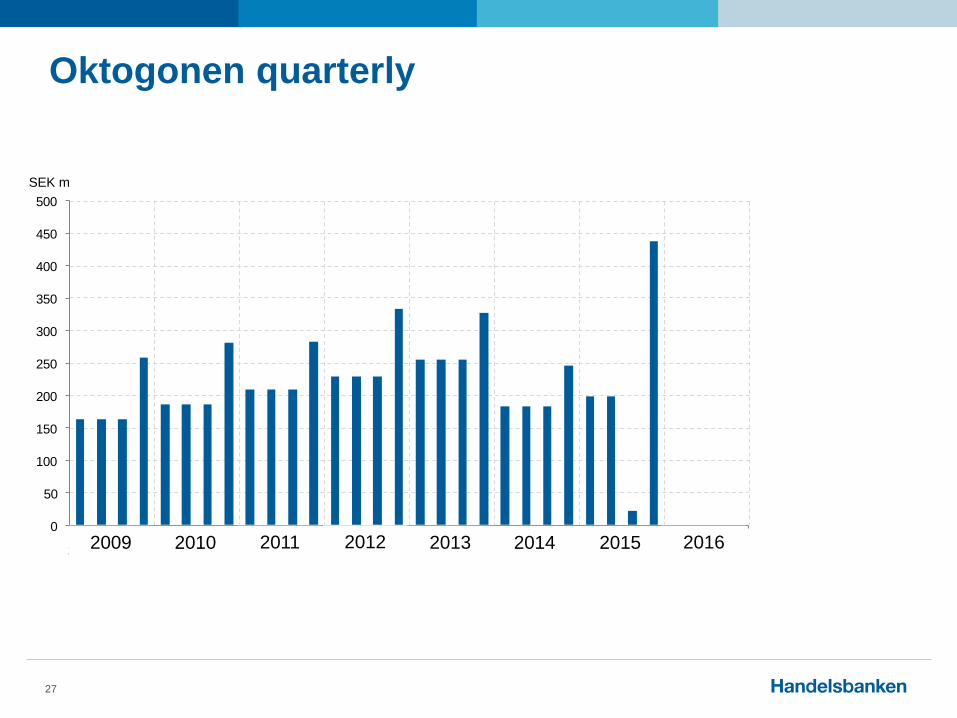
Q32016
Oktogonen quarterly
27
SEK m
2009 2010 2011 2012 2013 2014 2015 2016

Effective tax rate
28
Effective tax rate
Q3
2016
Q2
2016
Q1
2016
Q4
2015
Q3
2015
Q2
2015
Q1
2015
Q4
2014
Q3
2014
Per quarter 19.8% 20.7% 18.7% 19.4% 21.7% 21.1% 21.5% 21.7% 20.8%
Accumulated year to date 19.7% 19.7% 18.7% 20.9% 21.4% 21.3% 21.5% 21.2% 21.0%

Change in common equity tier 1 ratio CRR/CRD IV
29
* Earnings excluding capital gain from sale of AFS holdings
Common equity tier 1 ratio Q2 2016, % 23.0
Change, percentage points:
Common equity tier 1 capital 0.4
Earnings after estimated dividends* 0.3
Conversions of staff convertibles 0.1
Currency effects 0.2
IAS 19 0.0
AFS holdings 0.0
Other and rounding -0.2
Lending volume -0.1
Lending growth 0.1
Currency effects -0.2
Net effect different quality of inflows and outflows in loan portfolio 0.1
Credit risk migration in the lending portfolio -0.1
Sale of AFS holdings 0.6
Other effects, net 0.1
Change in common equity tier 1 ratio 1.0
Common equity tier 1 ratio Q3 2016, % 24.0
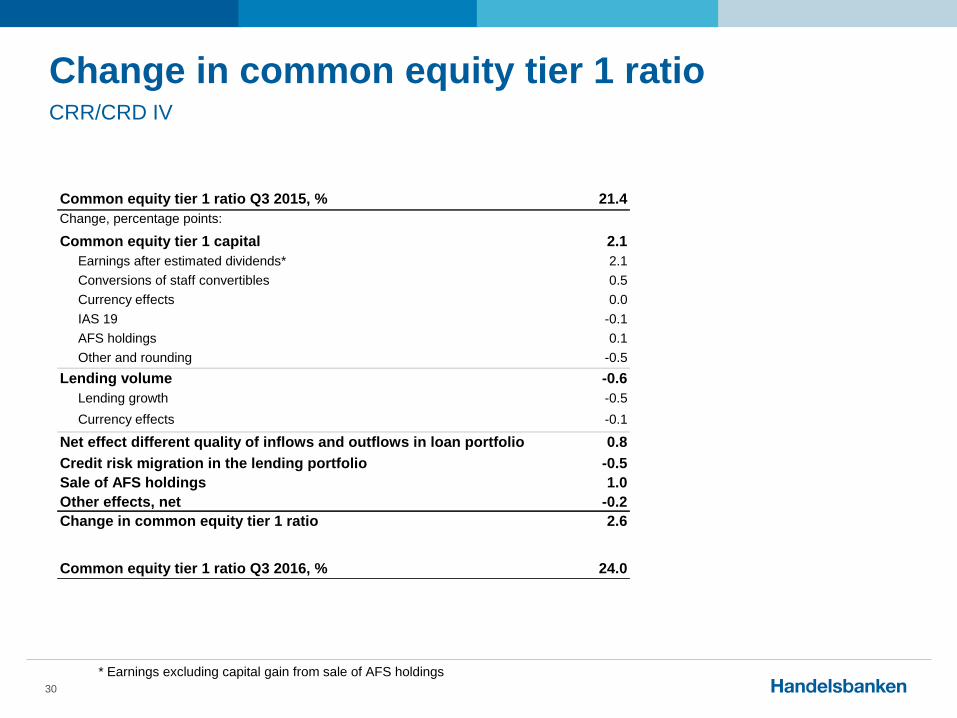
Change in common equity tier 1 ratio CRR/CRD IV
30
Common equity tier 1 ratio Q3 2015, % 21.4
Change, percentage points:
Common equity tier 1 capital 2.1
Earnings after estimated dividends* 2.1
Conversions of staff convertibles 0.5
Currency effects 0.0
IAS 19 -0.1
AFS holdings 0.1
Other and rounding -0.5
Lending volume -0.6
Lending growth -0.5
Currency effects -0.1
Net effect different quality of inflows and outflows in loan portfolio 0.8
Credit risk migration in the lending portfolio -0.5
Sale of AFS holdings 1.0
Other effects, net -0.2
Change in common equity tier 1 ratio 2.6
Common equity tier 1 ratio Q3 2016, % 24.0
* Earnings excluding capital gain from sale of AFS holdings

Balance sheet
31
SEK bn
Jan-Sep
2016
Jan-Sep
2015 Change
Cash and central banks 457 526 -13%
Loans to the public 1,966 1,855 6%
Loans to other credit institutions 41 63 -36%
Interest-bearing securities 173 165 5%
Other assets 272 335 -19%
Total assets 2,909 2,944 -1%
Deposits and borrowing from the public 1,009 1,049 -4%
Due to credit institutions 205 223 -8%
Issued securities 1,316 1,258 5%
Other liabilities 245 287 -15%
Total equity 134 127 6%
Total liabilities and equity 2,909 2,944 -1%

Non-encumbered assets, NEA 30 September 2016
32
SEK bn NEA
Accumulated coverage
ratio in % of unsecured
funding*
Cash with central banks and securities in the liquidity portfolio 619 67%
Mortgage loans 470 118%
Other household lending 180 137%
Property company lending lowest risk class (1-3) 260 165%
Other corporate lending lowest risk class (1-3) 153 182%
Loans to credit institutions lowest risk class (1-3) 36 186%
Other corporate lending 240 211%
Other assets 90 221%
Total non-encumbered assets (NEA) 2,048 221%
Encumbered assets without underlying liabilities** 59
Encumbered assets with underlying liabilities 802
Total assets, Group 2,909
* Issued short and long unsecured funding and due to credit institutions
** Over-collateralisation in cover pool (OC)

Long-term bond funding, January – September
33
Issues in Q3 include:
USD 1.0bn 5-year senior
USD 1.5bn 3-year senior
EUR 0.5bn 10-year covered bonds
Long term bond issuance, SEK bn
Jan-Sep
2016
Jan-Sep
2015 Change
Senior bonds 50 20 30
Covered bonds 129 89 40
Subordinated loans 0 10 -10
Total 179 119 60

Loans to the public*
34
SEK bn, end of period
Q3
2016
Q2
2016
Q1
2016
Q4
2015
Q3
2015
Households 754 745 728 714 701
Corporates 473 479 478 478 475
Handelsbanken Sweden 1,227 1,224 1,206 1,193 1,176
Households 93 87 83 81 82
Corporates 156 146 137 129 121
Handelsbanken Norway 249 233 220 210 203
Households 64 63 63 64 64
Corporates 126 125 126 130 131
Handelsbanken UK 190 188 189 194 195
Households 37 35 35 35 36
Corporates 84 83 80 80 80
Handelsbanken Finland 121 118 115 115 116
Households 55 52 49 48 47
Corporates 38 38 38 36 38
Handelsbanken Denmark 93 90 87 84 85
Households 15 14 12 11 10
Corporates 16 16 12 11 11
Handelsbanken the Netherlands 31 30 24 22 21
Other 52 52 58 46 56
Households 1,025 1,003 977 960 946
Corporates 938 932 922 903 905
Total lending to the public 1,963 1,935 1,899 1,863 1,851
* Excluding loans to the Swedish National Debt Office

Deposits from the public
35
SEK bn, end of period
Q3
2016
Q2
2016
Q1
2016
Q4
2015
Q3
2015
Households 308 305 288 280 275
Corporates 204 195 193 191 188
Handelsbanken Sweden 512 500 481 470 463
Households 31 30 25 26 24
Corporates 80 81 78 76 86
Handelsbanken UK 111 111 103 102 110
Households 21 20 18 18 17
Corporates 58 42 43 39 40
Handelsbanken Norway 79 62 61 57 57
Households 14 14 13 13 13
Corporates 19 15 17 17 18
Handelsbanken Finland 33 29 30 30 31
Households 16 15 14 14 14
Corporates 19 19 16 17 24
Handelsbanken Denmark 35 34 30 31 38
Households 1 1 1 1 1
Corporates 6 2 5 2 5
Handelsbanken the Netherlands 7 3 6 3 6
Other 233 396 332 61 344
Households 399 392 365 356 351
Corporates 611 743 677 398 698
Total deposits from the public 1,009 1,135 1,042 754 1,049

Lending in home markets outside Sweden Average volumes local currency
36
Private, local currency
Q3
2016
Q2
2016 Change
Denmark, DKK bn 41.3 40.1 3.0%
Finland, EUR m 3,998 3,952 1.2%
Norway, NOK bn 86.4 85.3 1.3%
UK, GBP m 5,609 5,456 2.8%
The Netherlands, EUR m 1,502 1,367 9.9%
Corporate, local currency
Denmark, DKK bn 28.7 28.8 -0.3%
Finland, EUR m 8,747 8,733 0.2%
Norway, NOK bn 144.3 142.7 1.1%
UK, GBP m 11,196 10,847 3.2%
The Netherlands, EUR m 1,741 1,397 24.6%

Lending in home markets outside Sweden Average volumes local currency
37
Private, local currency
Jan-Sep
2016
Jan-Sep
2015 Change
Denmark, DKK bn 40.2 36.3 10.7%
Finland, EUR m 3,968 3,942 0.7%
Norway, NOK bn 85.3 80.7 5.7%
UK, GBP m 5,451 4,714 15.6%
The Netherlands, EUR m 1,369 982 39.4%
Corporate, local currency
Denmark, DKK bn 28.7 29.2 -1.7%
Finland, EUR m 8,741 8,606 1.6%
Norway, NOK bn 142.1 118.3 20.1%
UK, GBP m 10,870 9,915 9.6%
The Netherlands, EUR m 1,470 1,122 31.0%
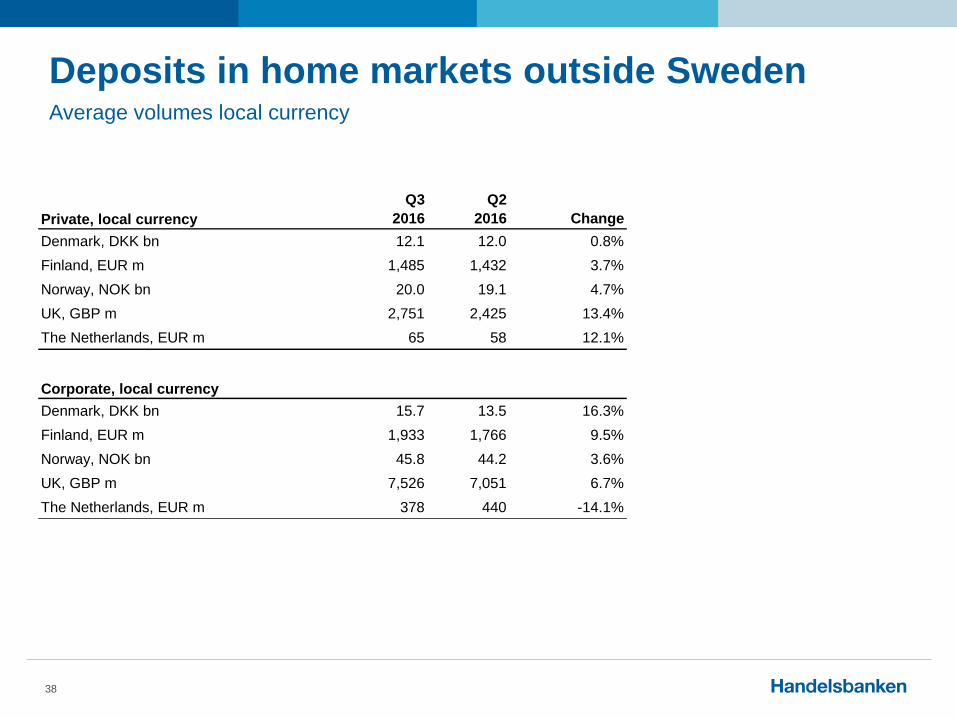
Deposits in home markets outside Sweden Average volumes local currency
38
Private, local currency
Q3
2016
Q2
2016 Change
Denmark, DKK bn 12.1 12.0 0.8%
Finland, EUR m 1,485 1,432 3.7%
Norway, NOK bn 20.0 19.1 4.7%
UK, GBP m 2,751 2,425 13.4%
The Netherlands, EUR m 65 58 12.1%
Corporate, local currency
Denmark, DKK bn 15.7 13.5 16.3%
Finland, EUR m 1,933 1,766 9.5%
Norway, NOK bn 45.8 44.2 3.6%
UK, GBP m 7,526 7,051 6.7%
The Netherlands, EUR m 378 440 -14.1%

Deposits in home markets outside Sweden Average volumes local currency
39
Private, local currency
Jan-Sep
2016
Jan-Sep
2015 Change
Denmark, DKK bn 11.8 11.0 7.3%
Finland, EUR m 1,432 1,368 4.7%
Norway, NOK bn 19.2 17.2 11.6%
UK, GBP m 2,412 1,680 43.6%
The Netherlands, EUR m 58 48 20.8%
Corporate, local currency
Denmark, DKK bn 15.5 16.9 -8.3%
Finland, EUR m 1,917 2,340 -18.1%
Norway, NOK bn 43.6 52.4 -16.8%
UK, GBP m 7,107 6,520 9.0%
The Netherlands, EUR m 409 737 -44.5%
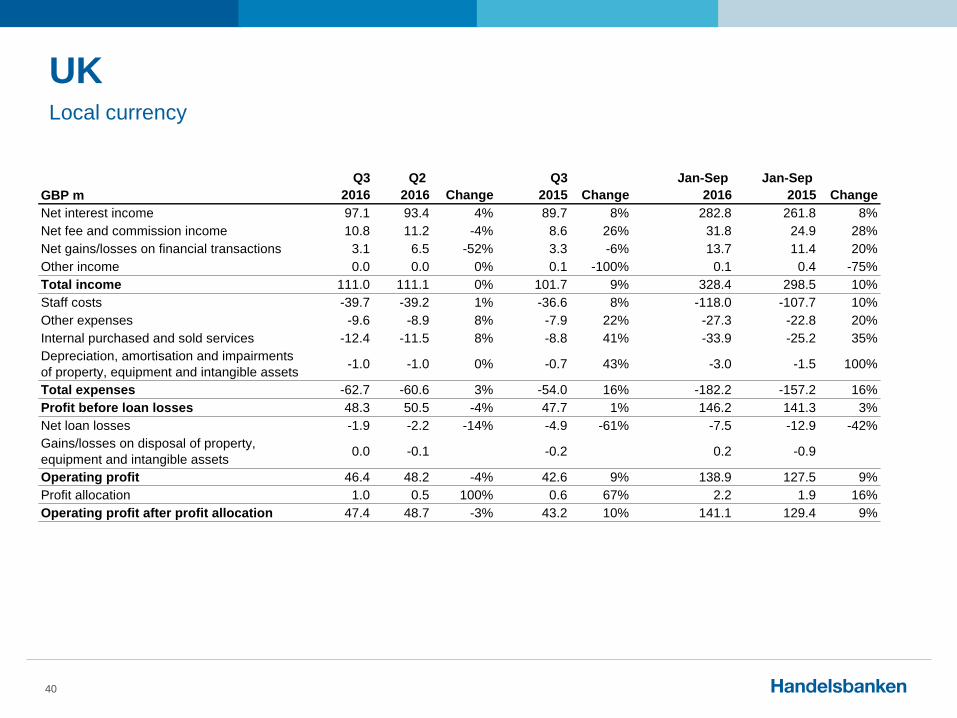
UK Local currency
40
GBP m
Q3
2016
Q2
2016 Change
Q3
2015 Change
Jan-Sep
2016
Jan-Sep
2015 Change
Net interest income 97.1 93.4 4% 89.7 8% 282.8 261.8 8%
Net fee and commission income 10.8 11.2 -4% 8.6 26% 31.8 24.9 28%
Net gains/losses on financial transactions 3.1 6.5 -52% 3.3 -6% 13.7 11.4 20%
Other income 0.0 0.0 0% 0.1 -100% 0.1 0.4 -75%
Total income 111.0 111.1 0% 101.7 9% 328.4 298.5 10%
Staff costs -39.7 -39.2 1% -36.6 8% -118.0 -107.7 10%
Other expenses -9.6 -8.9 8% -7.9 22% -27.3 -22.8 20%
Internal purchased and sold services -12.4 -11.5 8% -8.8 41% -33.9 -25.2 35%
Depreciation, amortisation and impairments
of property, equipment and intangible assets-1.0 -1.0 0% -0.7 43% -3.0 -1.5 100%
Total expenses -62.7 -60.6 3% -54.0 16% -182.2 -157.2 16%
Profit before loan losses 48.3 50.5 -4% 47.7 1% 146.2 141.3 3%
Net loan losses -1.9 -2.2 -14% -4.9 -61% -7.5 -12.9 -42%
Gains/losses on disposal of property,
equipment and intangible assets0.0 -0.1 -0.2 0.2 -0.9
Operating profit 46.4 48.2 -4% 42.6 9% 138.9 127.5 9%
Profit allocation 1.0 0.5 100% 0.6 67% 2.2 1.9 16%
Operating profit after profit allocation 47.4 48.7 -3% 43.2 10% 141.1 129.4 9%

Denmark Local currency
41
DKK m
Q3
2016
Q2
2016 Change
Q3
2015 Change
Jan-Sep
2016
Jan-Sep
2015 Change
Net interest income 333 325 2% 329 1% 985 1,002 -2%
Net fee and commission income 72 75 -4% 73 -1% 225 266 -15%
Net gains/losses on financial transactions 15 15 0% 15 0% 43 43 0%
Other income 2 4 -50% 3 -33% 9 11 -18%
Total income 422 419 1% 420 0% 1,262 1,322 -5%
Staff costs -127 -125 2% -128 -1% -379 -373 2%
Other expenses -34 -33 3% -33 3% -102 -105 -3%
Internal purchased and sold services -55 -56 -2% -51 8% -166 -166 0%
Depreciation, amortisation and impairments
of property, equipment and intangible assets-3 -2 50% -1 200% -8 -7 14%
Total expenses -219 -216 1% -213 3% -655 -651 1%
Profit before loan losses 203 203 0% 207 -2% 607 671 -10%
Net loan losses -154 -31 397% -152 1% -189 -188 1%
Gains/losses on disposal of property,
equipment and intangible assets3 1 200% 1 200% 4 2 100%
Operating profit 52 173 -70% 56 -7% 422 485 -13%
Profit allocation 20 15 33% 14 43% 50 42 19%
Operating profit after profit allocation 72 188 -62% 70 3% 472 527 -10%

Finland Local currency
42
EUR m
Q3
2016
Q2
2016 Change
Q3
2015 Change
Jan-Sep
2016
Jan-Sep
2015 Change
Net interest income 31.9 31.7 1% 35.3 -10% 97.7 108.4 -10%
Net fee and commission income 11.3 11.1 2% 10.2 11% 32.3 31.4 3%
Net gains/losses on financial transactions 0.8 4.9 -84% 1.2 -33% 7.1 5.2 37%
Other income 0.1 0.3 -67% 0.2 -50% 0.7 1.6 -56%
Total income 44.1 48.0 -8% 46.9 -6% 137.8 146.6 -6%
Staff costs -9.9 -10.2 -3% -9.7 2% -29.7 -29.7 0%
Other expenses -3.9 -5.4 -28% -3.7 5% -16.8 -12.3 37%
Internal purchased and sold services -6.1 -6.6 -8% -6.1 0% -18.9 -19.4 -3%
Depreciation, amortisation and impairments
of property, equipment and intangible assets-0.4 -0.4 0% -0.3 33% -1.1 -0.8 38%
Total expenses -20.3 -22.6 -10% -19.8 3% -66.5 -62.2 7%
Profit before loan losses 23.8 25.4 -6% 27.1 -12% 71.3 84.4 -16%
Net loan losses -1.7 -1.1 55% -0.5 240% -5.3 -7.4 -28%
Gains/losses on disposal of property,
equipment and intangible assets0.0 0.0 0% 0.0 -90% 0.0 0.0 -85%
Operating profit 22.1 24.3 -9% 26.6 -17% 66.0 77.0 -14%
Profit allocation 3.2 3.2 0% 2.8 14% 9.9 8.4 18%
Operating profit after profit allocation 25.3 27.5 -8% 29.4 -14% 75.9 85.4 -11%

Norway Local currency
43
NOK m
Q3
2016
Q2
2016 Change
Q3
2015 Change
Jan-Sep
2016
Jan-Sep
2015 Change
Net interest income 835 801 4% 763 9% 2,421 2,313 5%
Net fee and commission income 98 92 7% 100 -2% 275 288 -5%
Net gains/losses on financial transactions 24 30 -20% 27 -11% 93 67 39%
Other income 3 69 -96% 9 -67% 76 17 347%
Total income 960 992 -3% 899 7% 2,865 2,685 7%
Staff costs -171 -159 8% -172 -1% -496 -512 -3%
Other expenses -44 -51 -14% -47 -6% -144 -146 -1%
Internal purchased and sold services -95 -90 6% -84 13% -273 -261 5%
Depreciation, amortisation and impairments
of property, equipment and intangible assets-3 4 -3 0% -2 -9 -78%
Total expenses -313 -296 6% -306 2% -915 -928 -1%
Profit before loan losses 647 696 -7% 593 9% 1,950 1,757 11%
Net loan losses -71 -64 11% -51 39% -240 -180 33%
Gains/losses on disposal of property,
equipment and intangible assets0 0 0% 5 -100% 0 5 -100%
Operating profit 576 632 -9% 547 5% 1,710 1,582 8%
Profit allocation 21 17 24% 14 50% 61 35 74%
Operating profit after profit allocation 597 649 -8% 561 6% 1,771 1,617 10%

The Netherlands Local currency
44
EUR m
Q3
2016
Q2
2016 Change
Q3
2015 Change
Jan-Sep
2016
Jan-Sep
2015 Change
Net interest income 12.3 10.8 14% 8.9 38% 33.3 25.6 30%
Net fee and commission income 1.6 0.6 167% 0.6 167% 2.8 1.9 47%
Net gains/losses on financial transactions 0.2 0.0 0.3 -33% 0.3 0.4 -25%
Other income 0.0 - - 0.0 -
Total income 14.1 11.4 24% 9.8 44% 36.4 27.9 30%
Staff costs -5.8 -4.9 18% -4.3 35% -15.4 -12.2 26%
Other expenses -2.1 -1.7 24% -0.9 133% -4.7 -2.8 68%
Internal purchased and sold services -1.6 -2.0 -20% -2.0 -20% -5.8 -6.7 -13%
Depreciation, amortisation and impairments
of property, equipment and intangible assets-0.2 -0.2 0% -0.1 100% -0.5 -0.2 150%
Total expenses -9.7 -8.8 10% -7.3 33% -26.4 -21.9 21%
Profit before loan losses 4.4 2.6 69% 2.5 76% 10.0 6.0 67%
Net loan losses -0.1 0.1 0.1 0.0 -0.2
Gains/losses on disposal of property,
equipment and intangible assets- - - - -
Operating profit 4.3 2.7 59% 2.6 65% 10.0 5.8 72%
Profit allocation 0.0 0.2 -100% 0.0 -90% 0.2 0.0
Operating profit after profit allocation 4.3 2.9 48% 2.6 65% 10.2 5.8 76%

Disclaimer
45
Certain statements made in this presentation are forward looking statements. Such statements are based on current expectations and are subject to a number of risks and uncertainties that could cause actual results and performance to differ materially from any expected future results or performance, express or implied, by the forward looking statements. Factors that might cause forward looking statements to differ materially from actual results include, among other things, regulatory and economic factors. Handelsbanken Group assumes no responsibility to update any of the forward looking statements contained herein.
No representation or warranty, express or implied, is made or given by or on behalf of Handelsbanken Group or its directors, officers or employees or any other person as to the accuracy, completeness or fairness of the information or opinions contained in this presentation. None of Handelsbanken Group or any of its directors, officers or employees nor any other person accepts any liability whatsoever for any loss howsoever arising from any use of this presentation or its contents or otherwise arising in connection therewith.
This presentation does not constitute or form part of any offer or invitation to sell or issue, or any solicitation of any offer to purchase or subscribe for, any securities of Handelsbanken Group, nor shall it or any part of it nor the fact of its distribution form the basis of, or be relied on in connection with, any contract or investment decision.