hank childs, university of oregon may 15th, 2015 cis 330: _ _ _ _ ______ _ _____ / / / /___ (_) __...
TRANSCRIPT

Hank Childs, University of OregonMay 15th, 2015
CIS 330: _ _ _ _ ______ _ _____ / / / /___ (_) __ ____ _____ ____/ / / ____/ _/_/ ____/__ __ / / / / __ \/ / |/_/ / __ `/ __ \/ __ / / / _/_// / __/ /___/ /_ / /_/ / / / / /> < / /_/ / / / / /_/ / / /____/_/ / /__/_ __/_ __/ \____/_/ /_/_/_/|_| \__,_/_/ /_/\__,_/ \____/_/ \____//_/ /_/
Lecture 14:Debugging

Outline
• Review• Debugging Philosophy• Print Statements• Debuggers• Recently Observed Coding Pitfalls• Project 3E
Outline
• Review• Debugging Philosophy• Print Statements• Debuggers• Recently Observed Coding Pitfalls• Project 3E
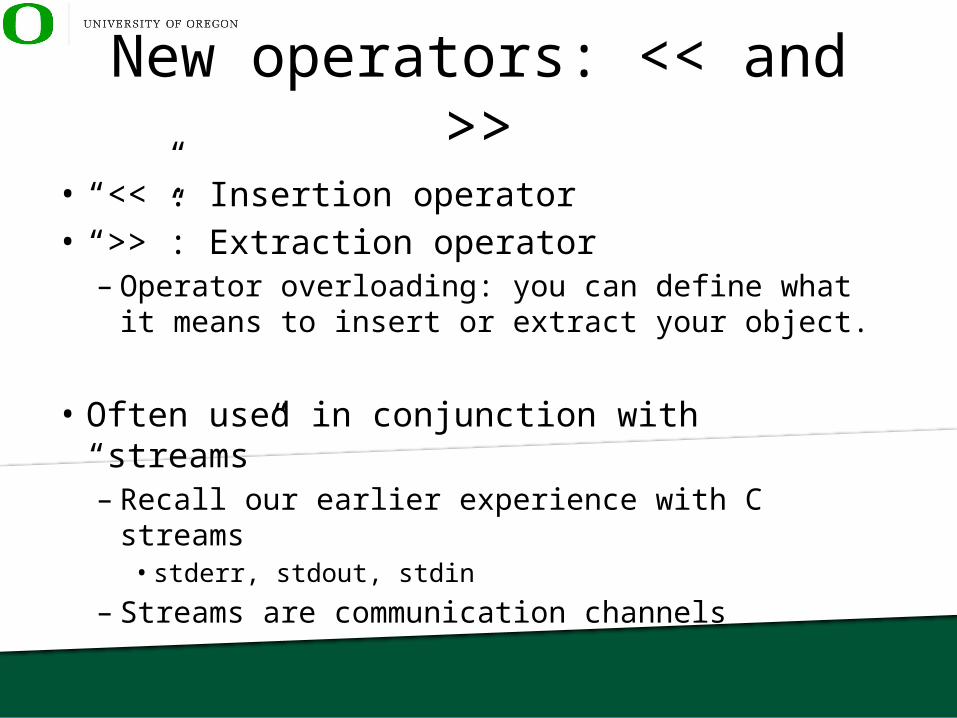
New operators: << and >>
• “<<”: Insertion operator• “>>”: Extraction operator– Operator overloading: you can define what it
means to insert or extract your object.
• Often used in conjunction with “streams”– Recall our earlier experience with C streams• stderr, stdout, stdin
– Streams are communication channels

C++ streams example
(cascading & endl)
Three pre-defined streams
• cout <= => fprintf(stdout, …• cerr <= => fprintf(stderr, …• cin <= => fscanf(stdin, …
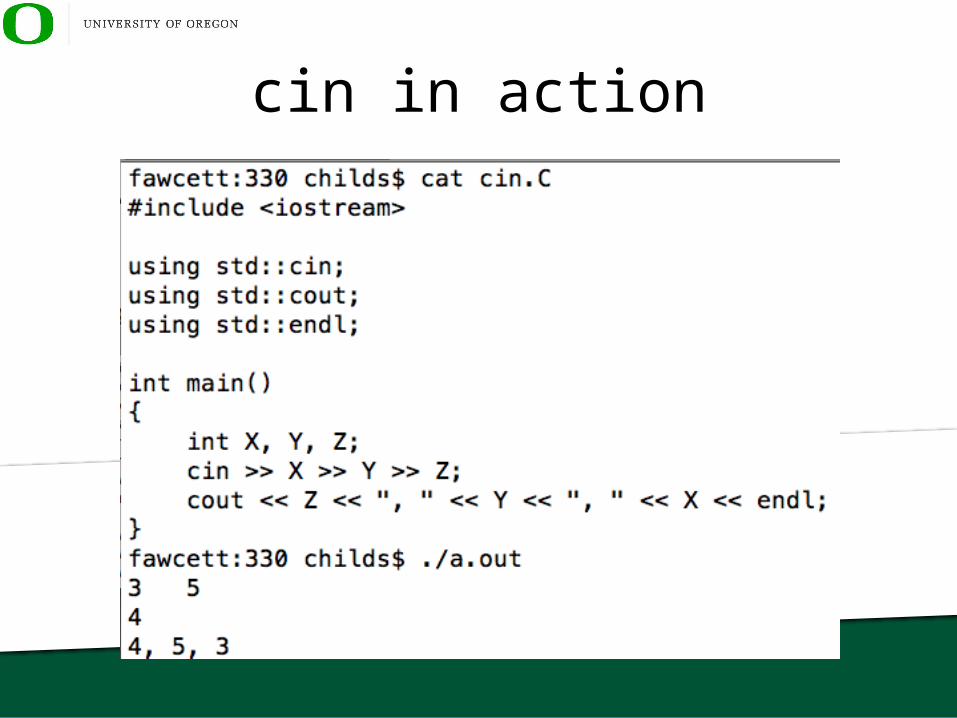
cin in action
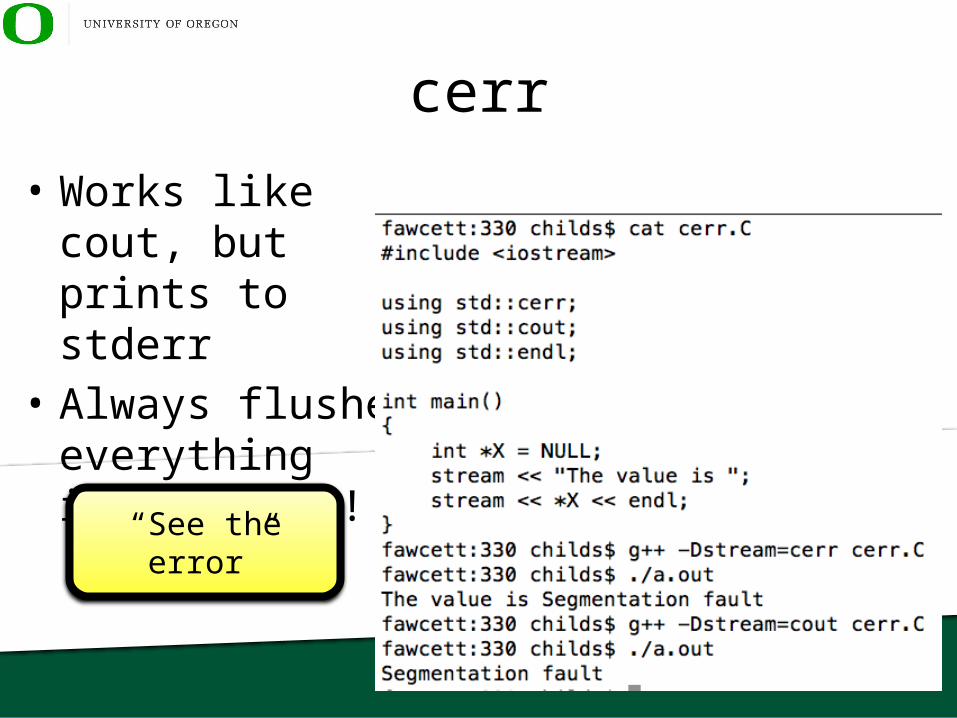
cerr
• Works like cout, but prints to stderr
• Always flushes everything immediately!
“See the error”
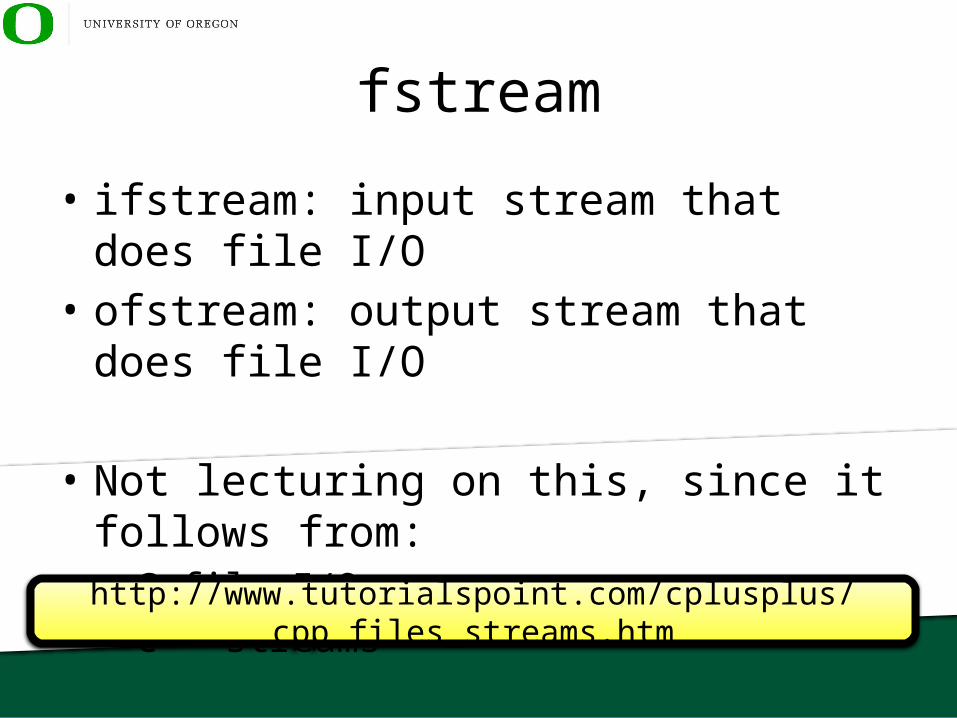
fstream
• ifstream: input stream that does file I/O• ofstream: output stream that does file I/O
• Not lecturing on this, since it follows from:– C file I/O– C++ streams
http://www.tutorialspoint.com/cplusplus/cpp_files_streams.htm
Outline
• Review• Debugging Philosophy• Print Statements• Debuggers• Recently Observed Coding Pitfalls• Project 3E

#1 complaint I hear from employers
• “students can’t debug”– If you can debug, you can progress on their
projects (even if slowly)– If not, they will have to hand hold you
• Think about your debugging approach.– How would you describe it during an interview?
This lecture describes how I would answer that question
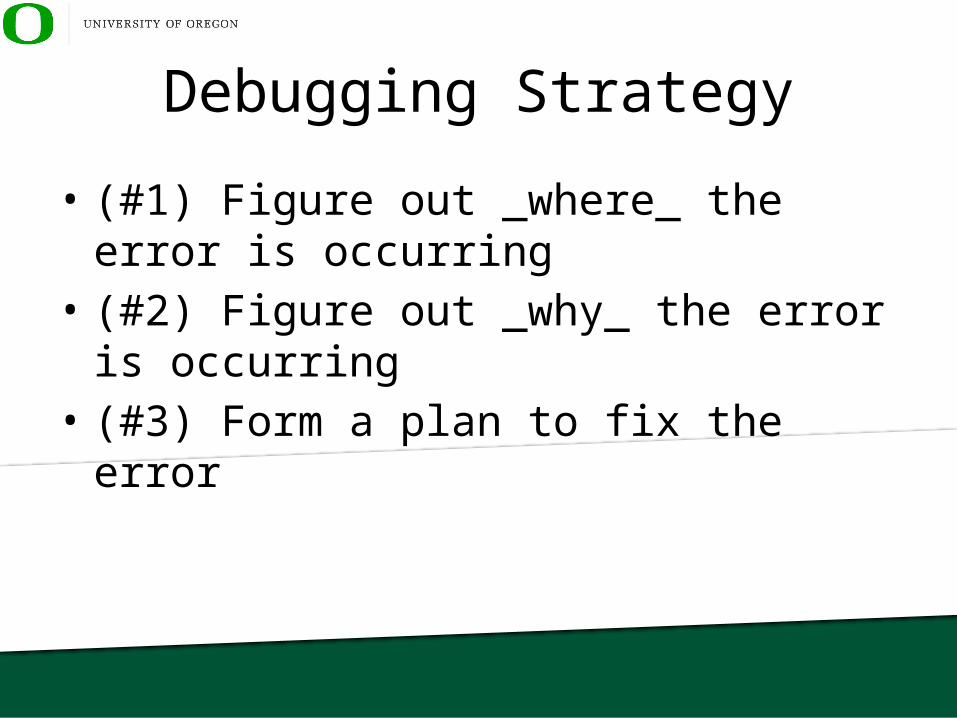
Debugging Strategy
• (#1) Figure out _where_ the error is occurring• (#2) Figure out _why_ the error is occurring• (#3) Form a plan to fix the error
Terrible debugging strategy
• fix it by repeatedly making random changes– typically, code is pretty close to working in the first
place– each random change creates a new problem that
then has to be debugged– code ends up as a complete mess
This is a “bugging” strategy.
Always make sure you feel confident about what the problem is before you start changing code
Debugging as the scientific method
• Debugging involves the scientific method:– You have a hypothesis• (“the bug is because of this”)
– You form an experiment • (“I will test my theory by examining the state of some
variables”)
– You confirm or deny the hypothesis • (“the state was OK, my hypothesis was wrong”)• (“the state was bad, my hypothesis was right”)

Backups
• The “scientific method” of debugging – which is good – can leave your code as a mess
• My recommendation:– when you have a bug, immediately make a copy of
your program– apply the scientific method-style of debugging
until you understand the problem and how to fix– then go back to your original program and make
the fix there
Debugging Overview
• To me, effective debugging is about two things:– Challenging your own assumptions– Divide-and-conquer to find the problem
Challenging Assumptions
• you thought the code would work and it doesn’t– so something you did is wrong, and you have to
figure out what• I find students are often turning under the wrong
stones, since there are some stones they don’t see
• the way to find these “hidden stones” is to start with the bad outcome and search backwards– why is this pointer NULL? why is this value bad?
Divide-and-Conquer
• There are lots of things that could be wrong with your program– This is a search problem!!
• Divide-and-Conquer: try to focus on hypotheses that will eliminate half the possibilities, no matter what the outcome is

Divide-and-Conquer
• “Halving” hypotheses:– The problem is in this module– The problem is in this function
• Non-halving hypotheses:– The problem is in this line of code– The problem is with this variable
As you divide the space smaller and smaller, you will eventually end up hypothesis that are small in scope
Good practice / Poor practice
• Good practice:– Write a few lines of code and test that it does
what you want• Poor practice:– Write a bunch of code and compile it all at the end
Why is it better to write smaller portions of code at a time?
Why is it better to write smaller portions of code at a time?
• If you have one bug– it is easier to figure out where that bug is• searching through tens of lines of code, not hundreds
• If you have many bugs– this is a disaster and you end up chasing your tail• and you are still searching through hundreds of lines of
code, not tens
The extra effort of modifying the main program to test your new code pays off ten-fold (WAG)
Final thought: always initialize your variables!!
• Many crashes in your HW assignments due to uninitialized pointers.– If you assign it to NULL, then at least you know
that is set to something not valid– Otherwise, you see an address and think it might
have valid memory• Initialize non-pointers too!• Classic point that employers look for.
This practice becomes increasingly essential when you work in teams on large projects.
Outline
• Review• Debugging Philosophy• Print Statements• Debuggers• Recently Observed Coding Pitfalls• Project 3E

Print statements
• Print statements (cerr, printf):– the world’s most used debugger– very successful SW professionals are able to debug
large SW projects using only print statements• Pitfalls:– output buffering– too many print statements
Pitfall #1: output buffering
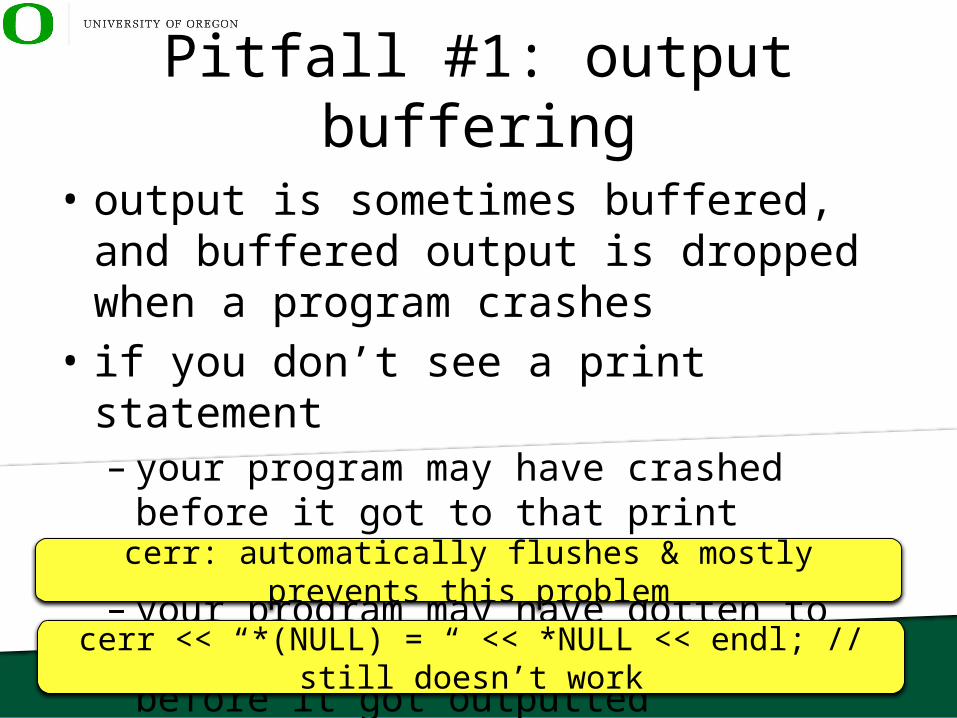
• output is sometimes buffered, and buffered output is dropped when a program crashes
• if you don’t see a print statement– your program may have crashed before it got to
that print statement– your program may have gotten to that print
statement, but crashed before it got outputted
cerr: automatically flushes & mostly prevents this problem
cerr << “*(NULL) = “ << *NULL << endl; // still doesn’t work
Output buffering and cerr
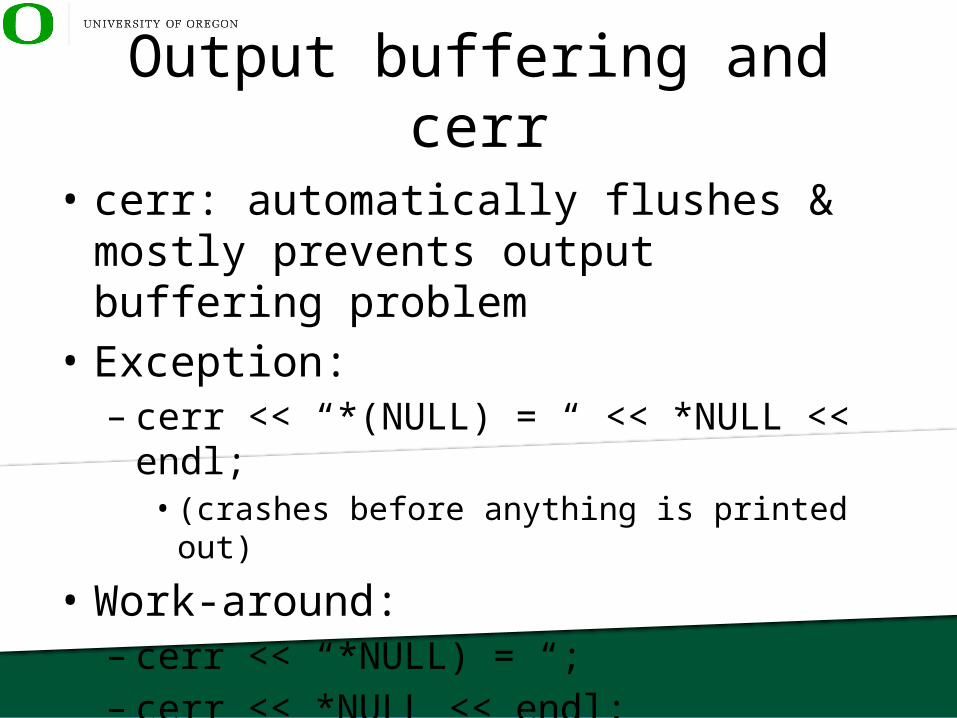
• cerr: automatically flushes & mostly prevents output buffering problem
• Exception:– cerr << “*(NULL) = “ << *NULL << endl; • (crashes before anything is printed out)
• Work-around:– cerr << “*NULL) = “;– cerr << *NULL << endl;
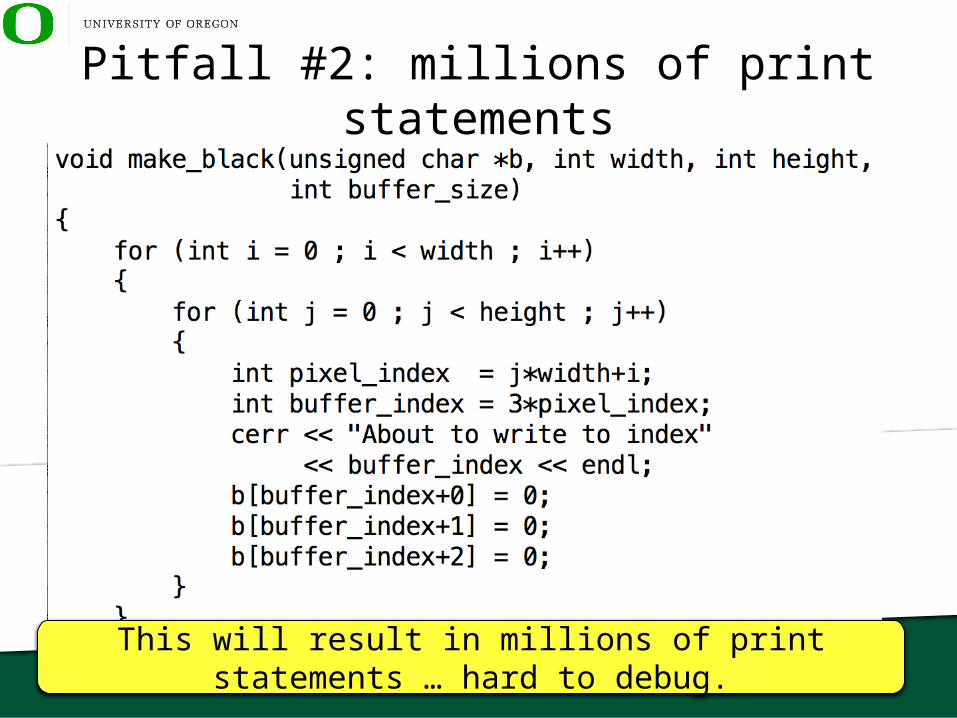
Pitfall #2: millions of print statements
This will result in millions of print statements … hard to debug.
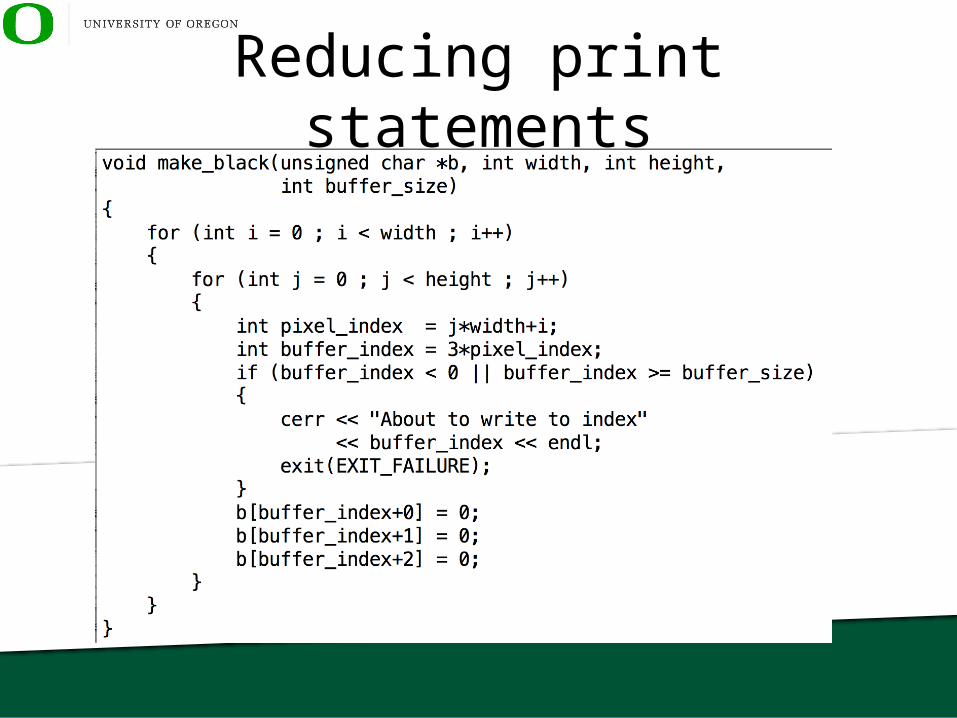
Reducing print statements

Make it easy on yourself…

Make it easy on yourself to run too…

Other ways to make life easier
• tab from shell: auto-completes• Ctrl-R: searches backwards in your shell
history
Outline
• Review• Debugging Philosophy• Print Statements• Debuggers• Recently Observed Coding Pitfalls• Project 3E

Debuggers
• Allow you to set breakpoints• Allow you to inspect variables• Show you where a program crashed
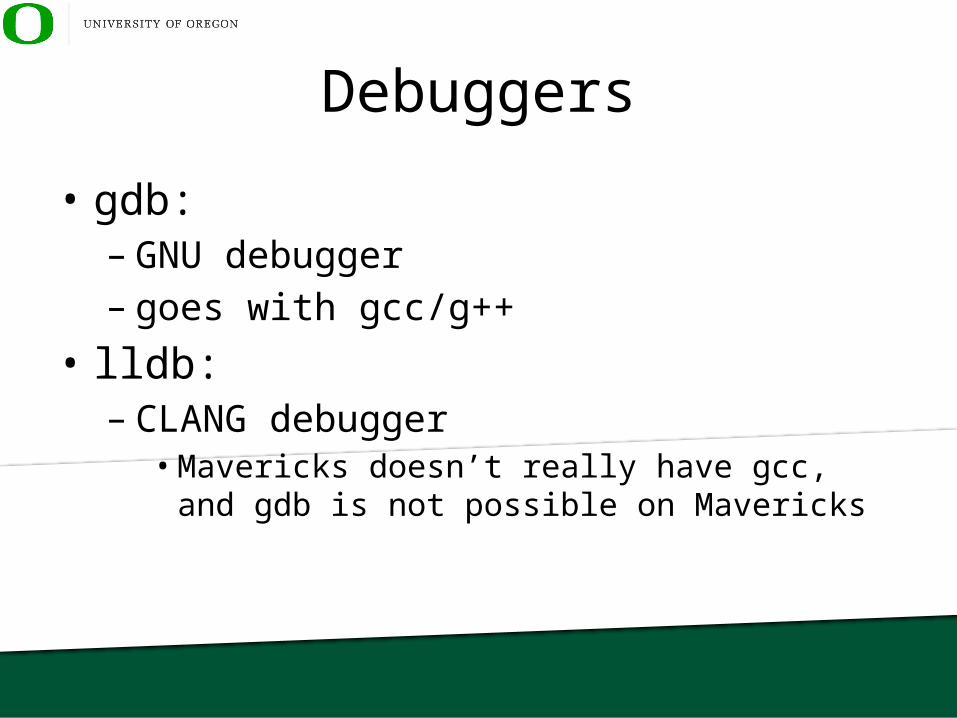
Debuggers
• gdb: – GNU debugger– goes with gcc/g++
• lldb: – CLANG debugger• Mavericks doesn’t really have gcc, and gdb is not
possible on Mavericks
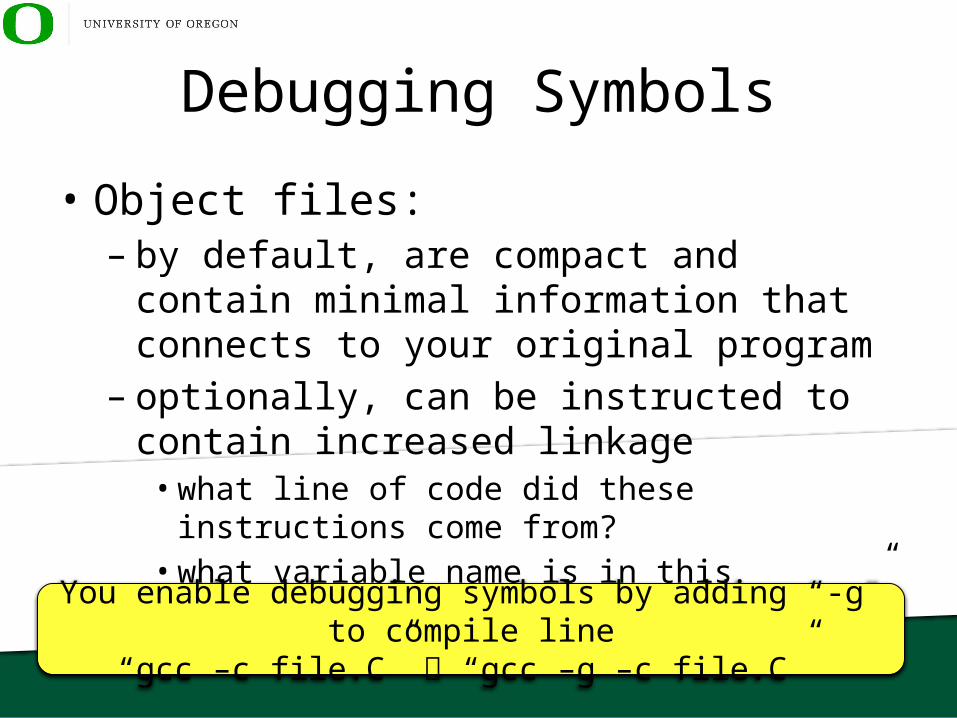
Debugging Symbols
• Object files:– by default, are compact and contain minimal
information that connects to your original program
– optionally, can be instructed to contain increased linkage• what line of code did these instructions come from?• what variable name is in this register?
You enable debugging symbols by adding “-g” to compile line“gcc –c file.C” “gcc –g –c file.C”
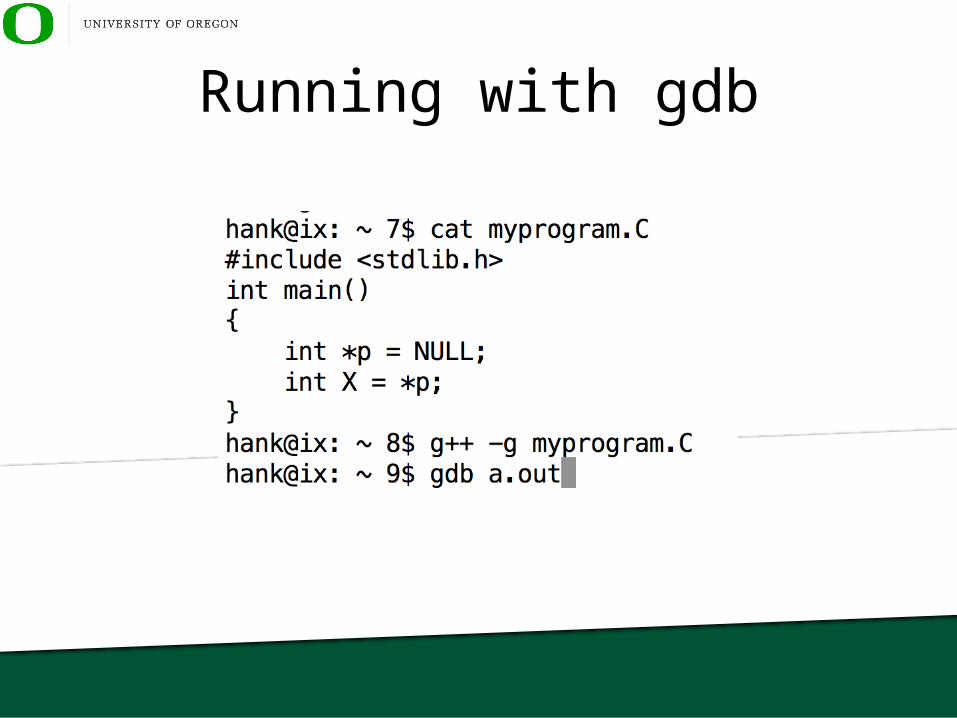
Running with gdb
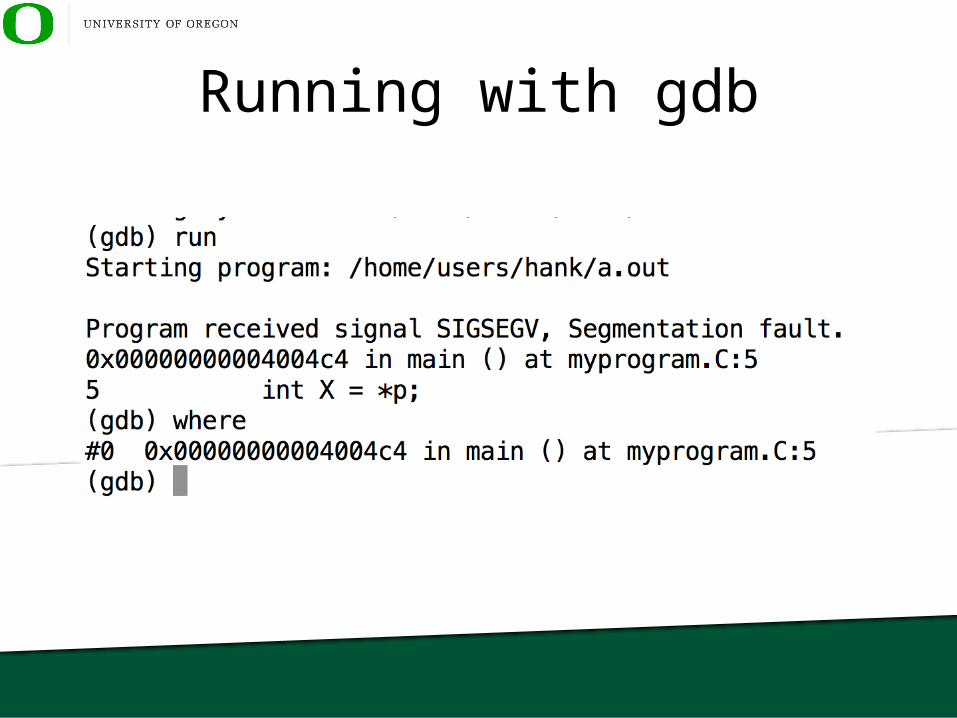
Running with gdb

Arguments
• You are running “./proj3A 3A_input.pnm 3A_output.pnm”
• In gdb, you would do:% gdb proj3A(gdb) run 3A_input.pnm 3A_output.pnm

“core” files
• When a program crashes, it can create a “core” file– This file contains the state of memory when it
crashes– It is very large, and can fill up filesystems• So system administrators often disable its generation
– “ulimit –c 0” “ulimit –c 10000000”
– You can run a debugger on a program using a core file (tells you where it crashed)• gdb a.out core
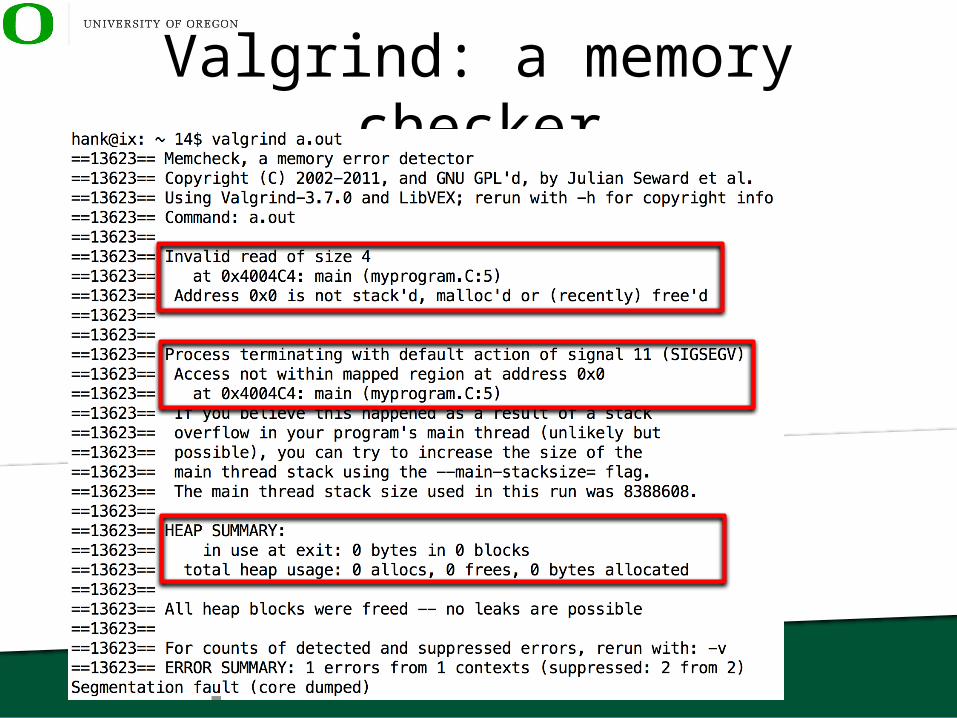
Valgrind: a memory checker
Valgrind and GDB
• Valgrind and gdb are available on ix– Older versions of Mac are possible, newer are not– Linux is easy
• You will have an assignment to have a memory error-free and memory leak-free program with valgrind.
Outline
• Review• Debugging Philosophy• Print Statements• Debuggers• Recently Observed Coding Pitfalls• Project 3E

Pitfall #1
This is using call-by-value, not call-by-reference.
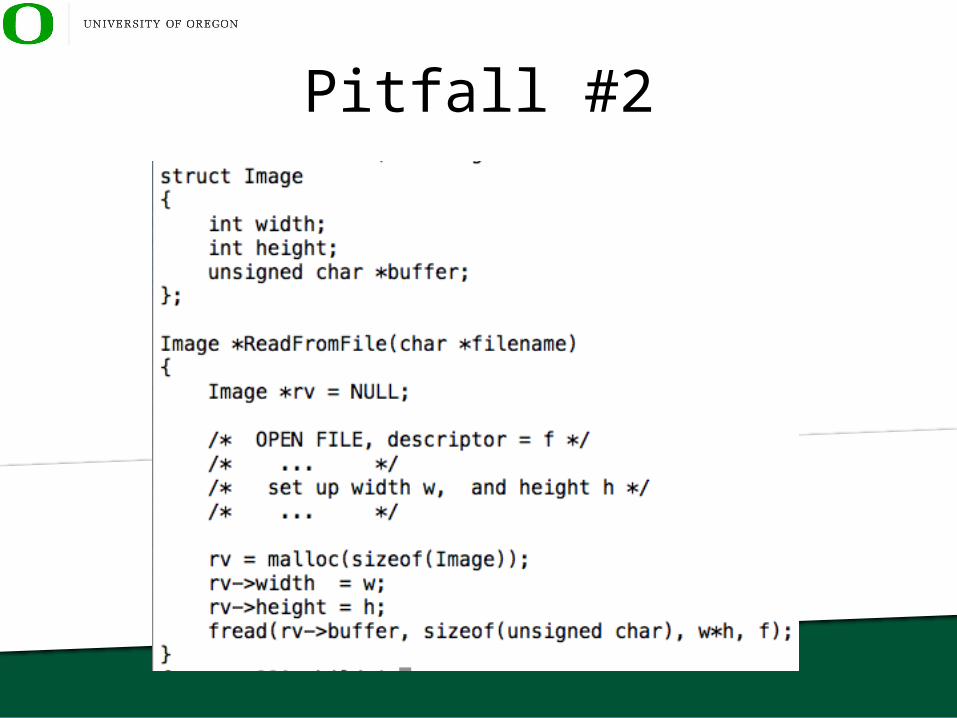
Pitfall #2

Pitfall #3
• int *s = new int[6*sizeof(int)];
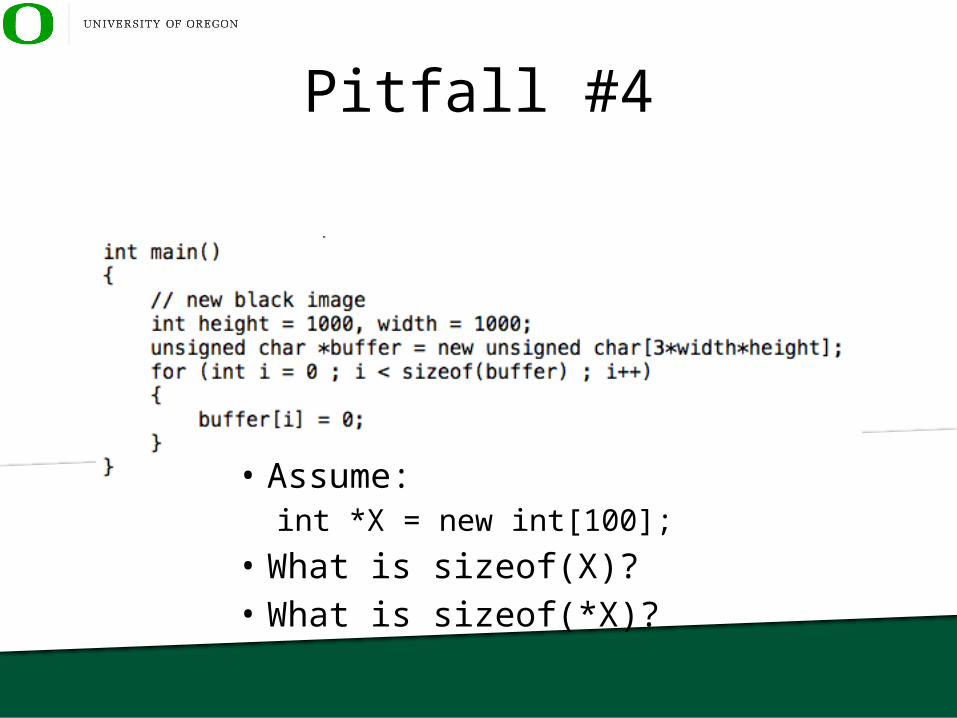
Pitfall #4
• Assume:int *X = new int[100];
• What is sizeof(X)?• What is sizeof(*X)?

Pitfall #5

(not-a-)Pitfall #6
Top requires memory allocation / deletion, and does extra copy.
Pitfall #7
• For objects on the stack, the destructors are called when a function goes out of scope– You may have a perfectly good function, but it seg-
faults on return• Especially tricky for main– program ran to completion, and crashed at the
very end
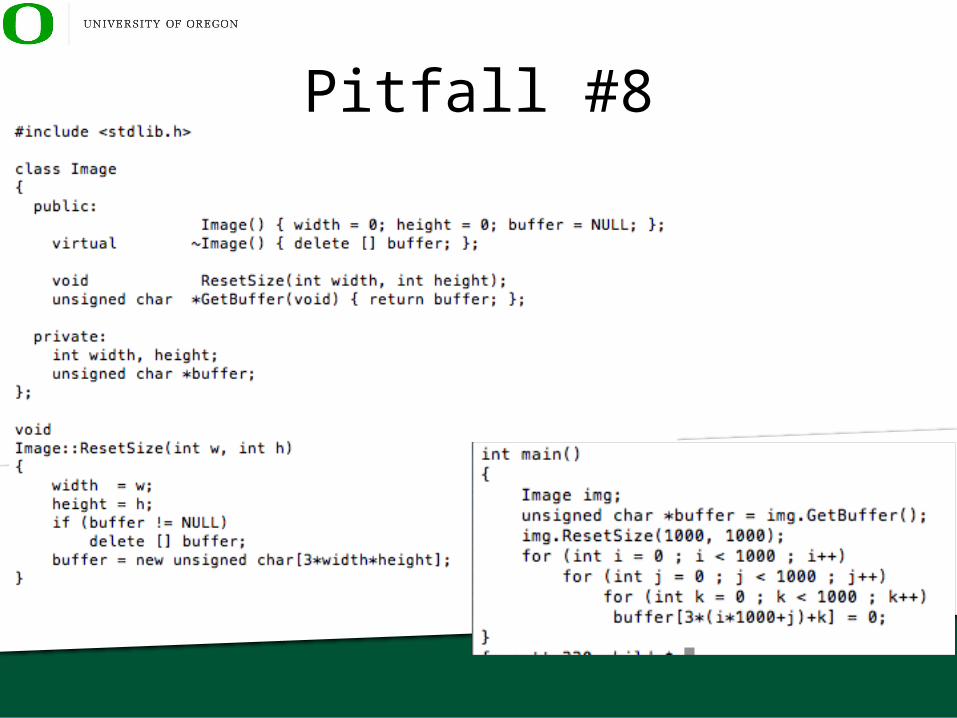
Pitfall #8
Outline
• Review• Debugging Philosophy• Print Statements• Debuggers• Recently Observed Coding Pitfalls• Project 3E

Project 3E
• You will need to think about how to accomplish the data flow execution pattern and think about how to extend your implementation to make it work.
• This prompt is vaguer than some previous ones– … not all of the details are there on how to do it

Project 3E
• Worth 5% of your grade• Assigned today, due May 22nd