hans jørgen larsen properties affecting reliability design
TRANSCRIPT

1
Hans Jørgen Larsen Properties affecting reliability design of timber structures An overview prepared for the COST E24 Seminar on Reliability of timber structures Coimbra, Portugal, 4 – 5 May 2001 Hans Jørgen Larsen BYG•DTU: Department of Structural Engineering – Technical University of Denmark INTRODUCTION The purpose of this paper is to draw attention to some of the peculiarities of timber necessary to take into account when setting up reliability based design methods for timber structures. It is aimed at readers who are not familiar with the properties of timber. The most important of these peculiarities are: • Structural timber is not a manufactured but a graded, natural material • The behaviour varies not only between members but also within members • The properties depend on the moisture history • The properties depend on the loading history • The material is orthotropic and failure may be influenced by brittle failure in tension perpendicular
to grain To take these facts into account it is important that the properties of timber are determined by standardised test and evaluation methods. The paper, therefore, also contains information about relevant standards. This paper relies very heavily on papers prepared for the Timber Engineering 2000 course at Lund University held in March-April 2001 and large section are with the kind permission by the authors cut directly from the following papers: [Isaksson] Tord Isaksson: Structural timber – Variability and statistical modelling [Johanssson] Carl-Johan Johansson: Grading of timber with respect to mechanical properties [Ranta-Maunus] Alpo Ranta-Maunus: Effects of climate and climate variations on strength [Hoffmeyer] Preben Hoffmeyer: Strength under long-term loading [Larsen] Hans Jørgen Larsen: Design of structures based on glulam, LVL and other solid timber
products Only solid structural timber is covered. But in principle other wood based materials – glued laminated timber, veneer products and other panel product – behave similarly. The following definitions apply: Characteristic strength: Characteristic strength values are defined as the population 5-percentile values obtained from the results of tests with a duration of 300 s using test pieces at an equilibrium moisture

2
content resulting from a temperature of 20 oC and a relative humidity of 65 %. For structural timber the bending/tension strength relate to a depth/width of 150 mm. Characteristic stiffness: Characteristic stiffness values are defined as either the population 5-percentile or the mean value obtained under the same conditions. Strength class: Timber is utilised optimally if strength and stiffness values are given for any species and grade. Since in most countries several species and grades are brought on the market, it has been found of advantage to introduce a system of strength classes. A strength class is described by the required minimum values for the basic strength and stiffness properties. The property profile of a grade and species is determined and it is then referred to the relevant strength class. The European strength class system is laid down in the European Standard [EN 338]. It covers 9 softwood classes with characteristic bending strength between 14 and 40 MPa, and 6 hardwood classes with bending strength between 30 and 70 MPa. An extract of the strength classes is given below. The most common softwood classes are C18, C24 and C30. EN 1912 Structural timber - Strength classes - Assignment of visual grades and species Table 1. Strength classes - Characteristic values
Poplar and softwood species C14 C16 C18 C20 C22 C24 C27 C30 C35 C40
Strength properties (in N/mm2) Bending Tension parallel Tension perpendicular Compression parallel Compression perpendicular Shear
ƒm,k ƒt,0,k ƒt,90,k ƒc,0,k ƒc,90,k ƒv,k
14 8 0,4 16 2,0 1,7
16 10 0,5 17 2,2 1,8
18 11 0,5 18 2,2 2,0
20 12 0,5 19 2,3 2,2
22 13 0,5 20 2,4 2,4
24 14 0,5 21 2,5 2,5
27 16 0,6 22 2,6 2,8
30 18 0,6 23 2,7 3,0
35 21 0,6 25 2,8 3,4
40 24 0,6 26 2,9 3,8
Stiffness properties (in kN/mm2) Mean modulus of elasticity parallel 5% modulus of elasticity parallel Mean modulus of elasticity perpendicular Mean shear modulus
E0,mean E0,05 E90,mean Gmean
7 4,7 0,23 0,44
8 5,4 0,27 0,5
9 6,0 0,30 0,56
9,5 6,4 0,32 0,59
10 6,7 0,33 0,63
11 7,4 0,37 0,69
11,5 7,7 0,38 0,72
12 8,0 0,40 0,75
13 8,7 0,43 0,81
14 9,4 0,47 0,88
Moisture content: Unless artificially dried, wood will contain moisture. The moisture content, is defined as: Moisture content (%) = 100 ⋅ mass of water/mass of dry wood

3
The moisture content can be determined by weighing, drying (103 oC) and drying again. The moisture content may also be determined by an electric moisture meter measuring the electric resistance. It is faster but not so accurate When drying timber from the natural condition (green condition) the free water in the cell cavity disappears first until the fibre saturation point is reached (moisture content just below 30 %) - then the water in the cell walls disappear. Moisture changes above the fibre saturation point have no effect. Moisture changes below the fibre saturation point influence the strength and stiffness and result in dimensional changes (shrinking/swelling), see the tables below. For wood in equilibrium with the surrounding climate the moisture content depends approximately on the relative humidity (RH) and temperature as shown in the figure given below.
Moi
stur
e co
nten
t, %
Air tem
perature oC
Relative air humidity, % Influence of moisture content for small clear specimens. For structural timber the influence is only about 50 % of the values Strength loss in percent for a
unit increase in the moisture percentage
Strength increase in percent when drying from fibre saturation to 12 %
Tension parallel to grain 3 50 Tension perpendicular to grain 2 35 Compression parallel and perpendicular to grain
5 65
Bending 4 60 Shear 3 50 Stiffness 1.5 25 Dimensional changes for a unit change of the moisture percentage In the fibre direction Along the year rings Across the year rings (tangential) (radial) Softwood 0.01 % 0.25 – 0.3 % 0.13 – 0.15 % Beech and birch 0.01 % 0.4 % 0.2 %
4
VARIABILITY
[Isaksson] Structural timber displays considerable strength variability between and within members.
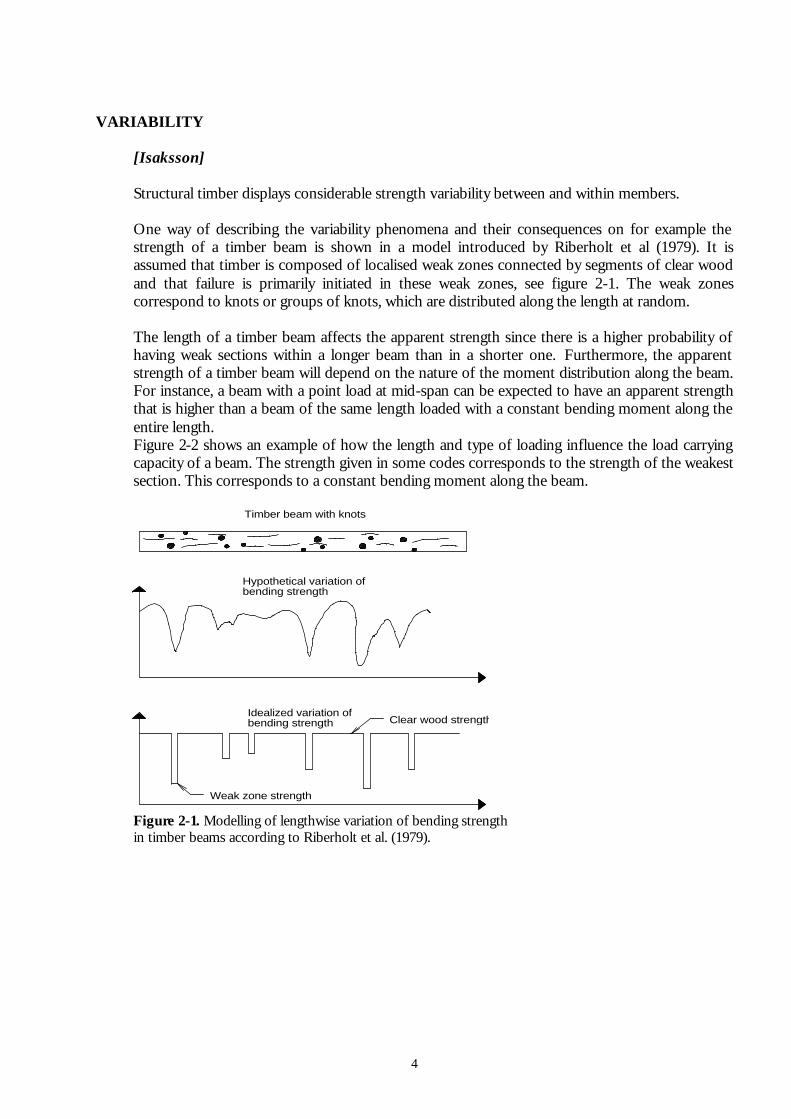
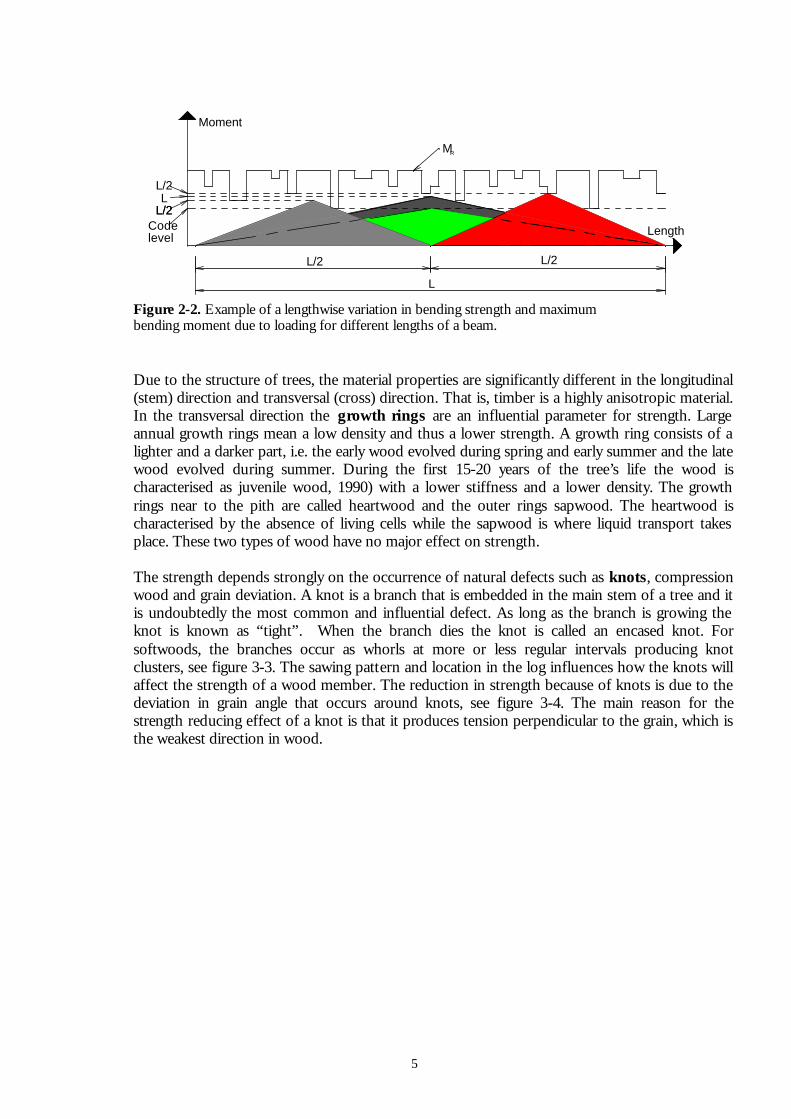
One way of describing the variability phenomena and their consequences on for example the strength of a timber beam is shown in a model introduced by Riberholt et al (1979). It is assumed that timber is composed of localised weak zones connected by segments of clear wood and that failure is primarily initiated in these weak zones, see figure 2-1. The weak zones correspond to knots or groups of knots, which are distributed along the length at random. The length of a timber beam affects the apparent strength since there is a higher probability of having weak sections within a longer beam than in a shorter one. Furthermore, the apparent strength of a timber beam will depend on the nature of the moment distribution along the beam. For instance, a beam with a point load at mid-span can be expected to have an apparent strength that is higher than a beam of the same length loaded with a constant bending moment along the entire length. Figure 2-2 shows an example of how the length and type of loading influence the load carrying capacity of a beam. The strength given in some codes corresponds to the strength of the weakest section. This corresponds to a constant bending moment along the beam.
Clear wood strength
Weak zone strength
Idealized variation ofbending strength
Timber beam with knots
Hypothetical variation of bending strength
Figure 2-1. Modelling of lengthwise variation of bending strength in timber beams according to Riberholt et al. (1979).
5
Codelevel
L/2
L
L/2
L/2L/2L
Moment
MR
Length
L/2
Figure 2-2. Example of a lengthwise variation in bending strength and maximum bending moment due to loading for different lengths of a beam. Due to the structure of trees, the material properties are significantly different in the longitudinal (stem) direction and transversal (cross) direction. That is, timber is a highly anisotropic material. In the transversal direction the growth rings are an influential parameter for strength. Large annual growth rings mean a low density and thus a lower strength. A growth ring consists of a lighter and a darker part, i.e. the early wood evolved during spring and early summer and the late wood evolved during summer. During the first 15-20 years of the tree’s life the wood is characterised as juvenile wood, 1990) with a lower stiffness and a lower density. The growth rings near to the pith are called heartwood and the outer rings sapwood. The heartwood is characterised by the absence of living cells while the sapwood is where liquid transport takes place. These two types of wood have no major effect on strength. The strength depends strongly on the occurrence of natural defects such as knots, compression wood and grain deviation. A knot is a branch that is embedded in the main stem of a tree and it is undoubtedly the most common and influential defect. As long as the branch is growing the knot is known as “tight”. When the branch dies the knot is called an encased knot. For softwoods, the branches occur as whorls at more or less regular intervals producing knot clusters, see figure 3-3. The sawing pattern and location in the log influences how the knots will affect the strength of a wood member. The reduction in strength because of knots is due to the deviation in grain angle that occurs around knots, see figure 3-4. The main reason for the strength reducing effect of a knot is that it produces tension perpendicular to the grain, which is the weakest direction in wood.

6
Figure 3-3 - Norway Spruce trees, aged about 80 years, ready for harvesting. Note the regularity at which the branches occur.
Figure3-4 - Slope of grain at a knot.
7
Cross section
Longitudinal direction
Pith side
Radial direction
Annual rings
External side
Tangential direction
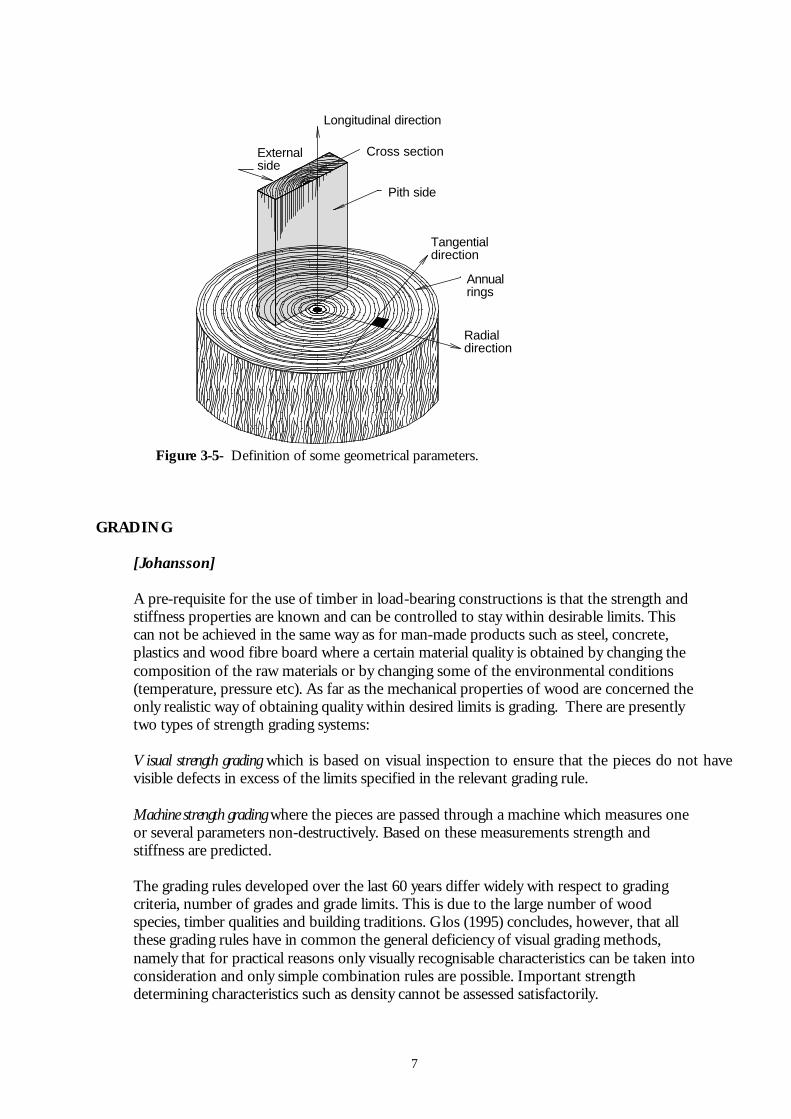
Figure 3-5- Definition of some geometrical parameters.
GRADING
[Johansson] A pre-requisite for the use of timber in load-bearing constructions is that the strength and stiffness properties are known and can be controlled to stay within desirable limits. This can not be achieved in the same way as for man-made products such as steel, concrete, plastics and wood fibre board where a certain material quality is obtained by changing the composition of the raw materials or by changing some of the environmental conditions (temperature, pressure etc). As far as the mechanical properties of wood are concerned the only realistic way of obtaining quality within desired limits is grading. There are presently two types of strength grading systems: Visual strength grading which is based on visual inspection to ensure that the pieces do not have visible defects in excess of the limits specified in the relevant grading rule. Machine strength grading where the pieces are passed through a machine which measures one or several parameters non-destructively. Based on these measurements strength and stiffness are predicted.
The grading rules developed over the last 60 years differ widely with respect to grading criteria, number of grades and grade limits. This is due to the large number of wood species, timber qualities and building traditions. Glos (1995) concludes, however, that all these grading rules have in common the general deficiency of visual grading methods, namely that for practical reasons only visually recognisable characteristics can be taken into consideration and only simple combination rules are possible. Important strength determining characteristics such as density cannot be assessed satisfactorily.
8
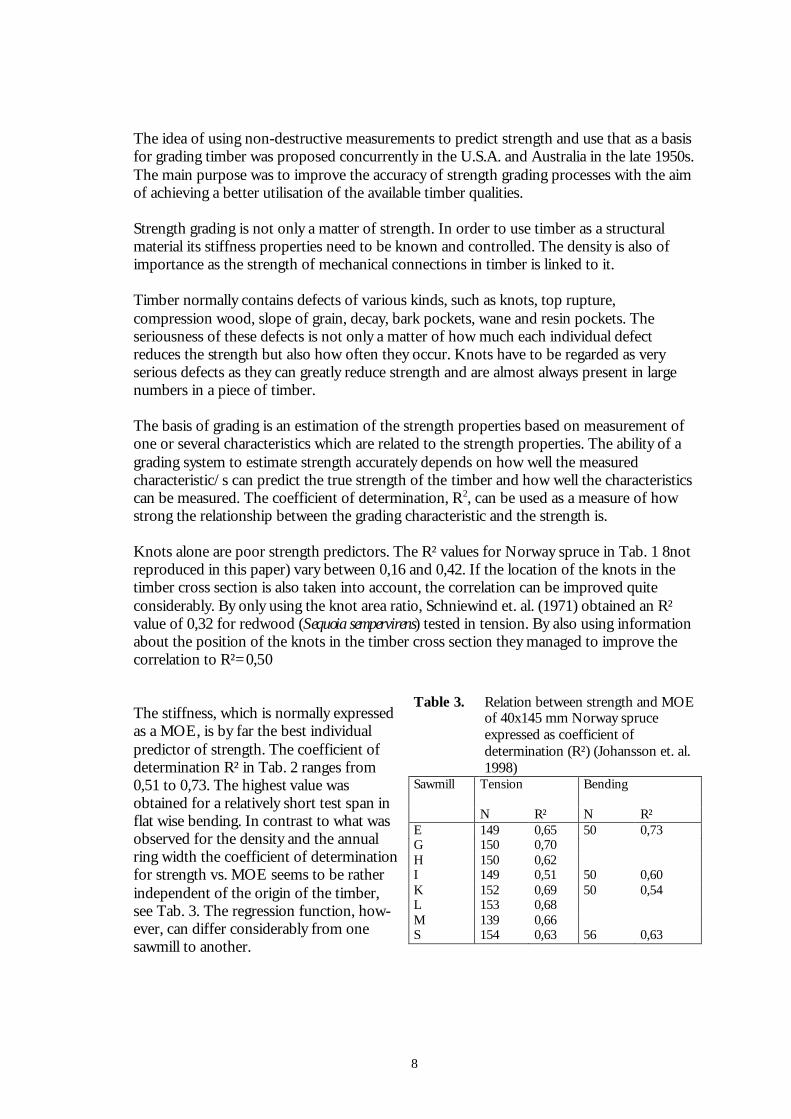
The idea of using non-destructive measurements to predict strength and use that as a basis for grading timber was proposed concurrently in the U.S.A. and Australia in the late 1950s. The main purpose was to improve the accuracy of strength grading processes with the aim of achieving a better utilisation of the available timber qualities. Strength grading is not only a matter of strength. In order to use timber as a structural material its stiffness properties need to be known and controlled. The density is also of importance as the strength of mechanical connections in timber is linked to it. Timber normally contains defects of various kinds, such as knots, top rupture, compression wood, slope of grain, decay, bark pockets, wane and resin pockets. The seriousness of these defects is not only a matter of how much each individual defect reduces the strength but also how often they occur. Knots have to be regarded as very serious defects as they can greatly reduce strength and are almost always present in large numbers in a piece of timber. The basis of grading is an estimation of the strength properties based on measurement of one or several characteristics which are related to the strength properties. The ability of a grading system to estimate strength accurately depends on how well the measured characteristic/s can predict the true strength of the timber and how well the characteristics can be measured. The coefficient of determination, R2, can be used as a measure of how strong the relationship between the grading characteristic and the strength is. Knots alone are poor strength predictors. The R² values for Norway spruce in Tab. 1 8not reproduced in this paper) vary between 0,16 and 0,42. If the location of the knots in the timber cross section is also taken into account, the correlation can be improved quite considerably. By only using the knot area ratio, Schniewind et. al. (1971) obtained an R² value of 0,32 for redwood (Sequoia sempervirens) tested in tension. By also using information about the position of the knots in the timber cross section they managed to improve the correlation to R²=0,50
The stiffness, which is normally expressed as a MOE, is by far the best individual predictor of strength. The coefficient of determination R² in Tab. 2 ranges from 0,51 to 0,73. The highest value was obtained for a relatively short test span in flat wise bending. In contrast to what was observed for the density and the annual ring width the coefficient of determination for strength vs. MOE seems to be rather independent of the origin of the timber, see Tab. 3. The regression function, how-ever, can differ considerably from one sawmill to another.
Table 3. Relation between strength and MOE of 40x145 mm Norway spruce expressed as coefficient of determination (R²) (Johansson et. al. 1998)
Sawmill Tension
Bending
N R² N R² E 149 0,65 50 0,73 G 150 0,70 H 150 0,62 I 149 0,51 50 0,60 K 152 0,69 50 0,54 L 153 0,68 M 139 0,66 S 154 0,63 56 0,63
9
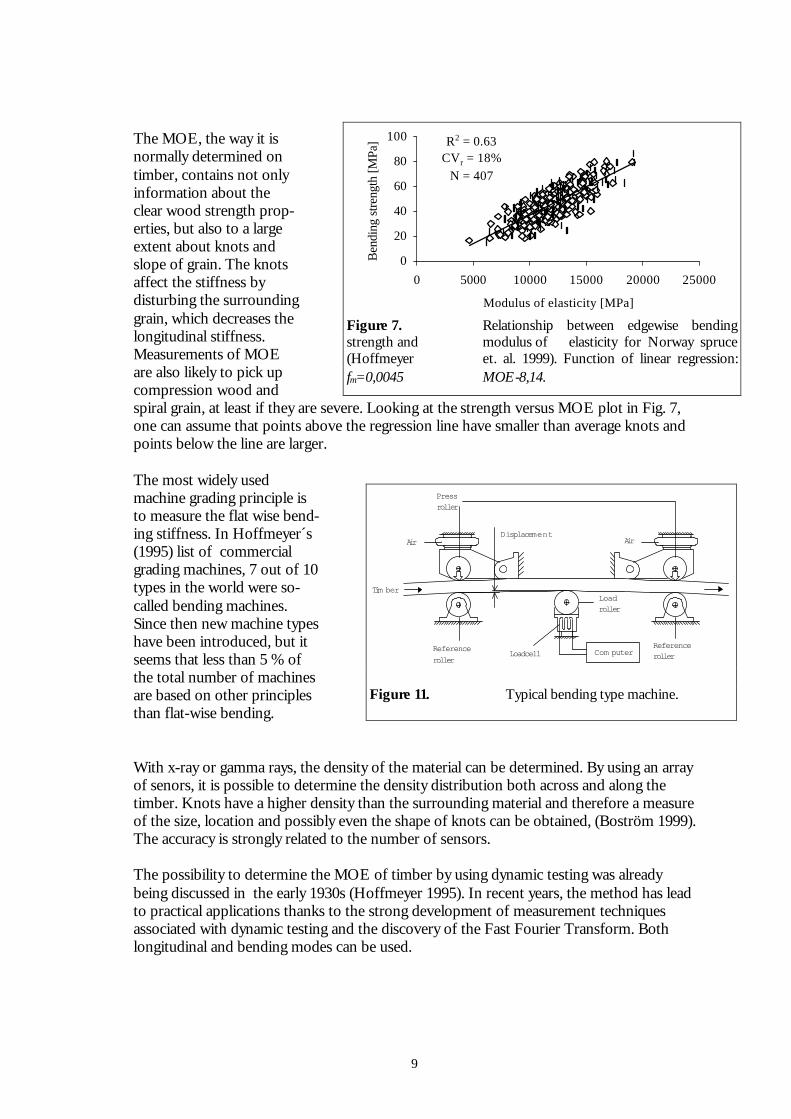
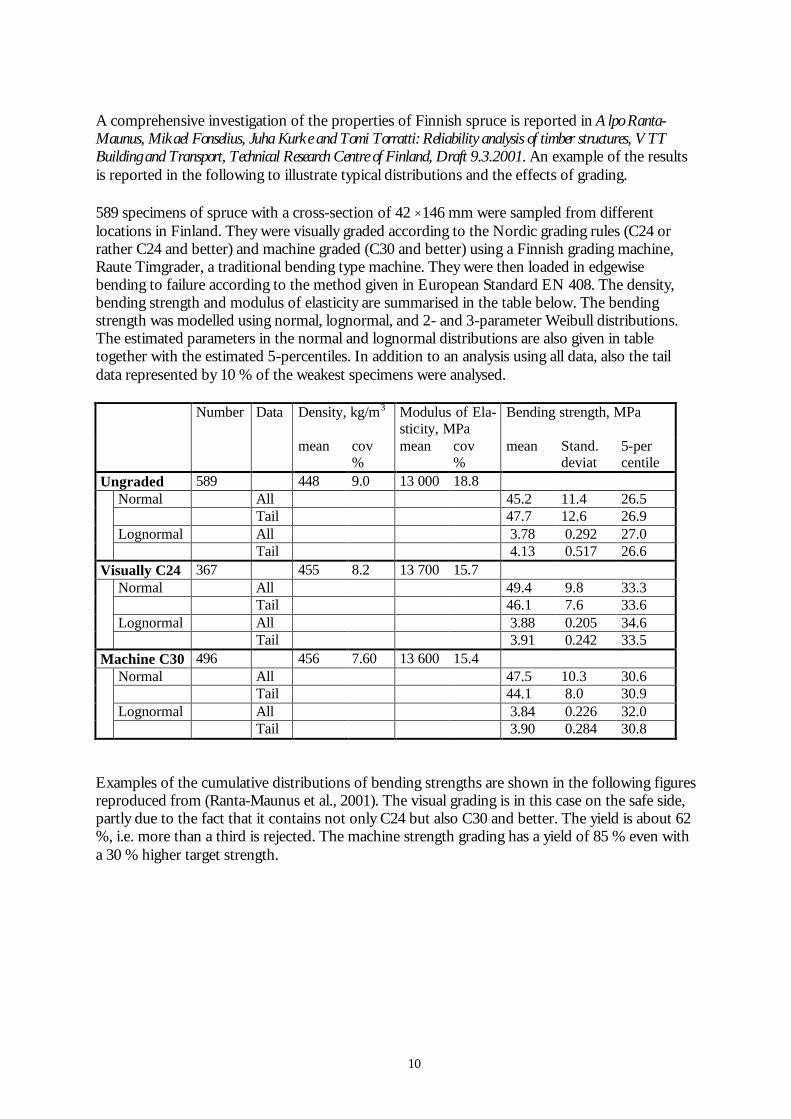
The MOE, the way it is normally determined on timber, contains not only information about the clear wood strength prop-erties, but also to a large extent about knots and slope of grain. The knots affect the stiffness by disturbing the surrounding grain, which decreases the longitudinal stiffness. Measurements of MOE are also likely to pick up compression wood and spiral grain, at least if they are severe. Looking at the strength versus MOE plot in Fig. 7, one can assume that points above the regression line have smaller than average knots and points below the line are larger. The most widely used machine grading principle is to measure the flat wise bend-ing stiffness. In Hoffmeyer´s (1995) list of commercial grading machines, 7 out of 10 types in the world were so-called bending machines. Since then new machine types have been introduced, but it seems that less than 5 % of the total number of machines are based on other principles than flat-wise bending. With x-ray or gamma rays, the density of the material can be determined. By using an array of senors, it is possible to determine the density distribution both across and along the timber. Knots have a higher density than the surrounding material and therefore a measure of the size, location and possibly even the shape of knots can be obtained, (Boström 1999). The accuracy is strongly related to the number of sensors. The possibility to determine the MOE of timber by using dynamic testing was already being discussed in the early 1930s (Hoffmeyer 1995). In recent years, the method has lead to practical applications thanks to the strong development of measurement techniques associated with dynamic testing and the discovery of the Fast Fourier Transform. Both longitudinal and bending modes can be used.
R2 = 0.63CVr = 18%
N = 407
0
20
40
60
80
100
0 5000 10000 15000 20000 25000
Modulus of elasticity [MPa]
Ben
ding
stre
ngth
[MPa
]
Figure 7. Relationship between edgewise bending strength and modulus of elasticity for Norway spruce (Hoffmeyer et. al. 1999). Function of linear regression: fm=0,0045 MOE-8,14.
Pressroller
Air AirDisplacement
LoadcellReferenceroller
ReferencerollerCom puter
Loadroller
Tim ber
Figure 11. Typical bending type machine.
10
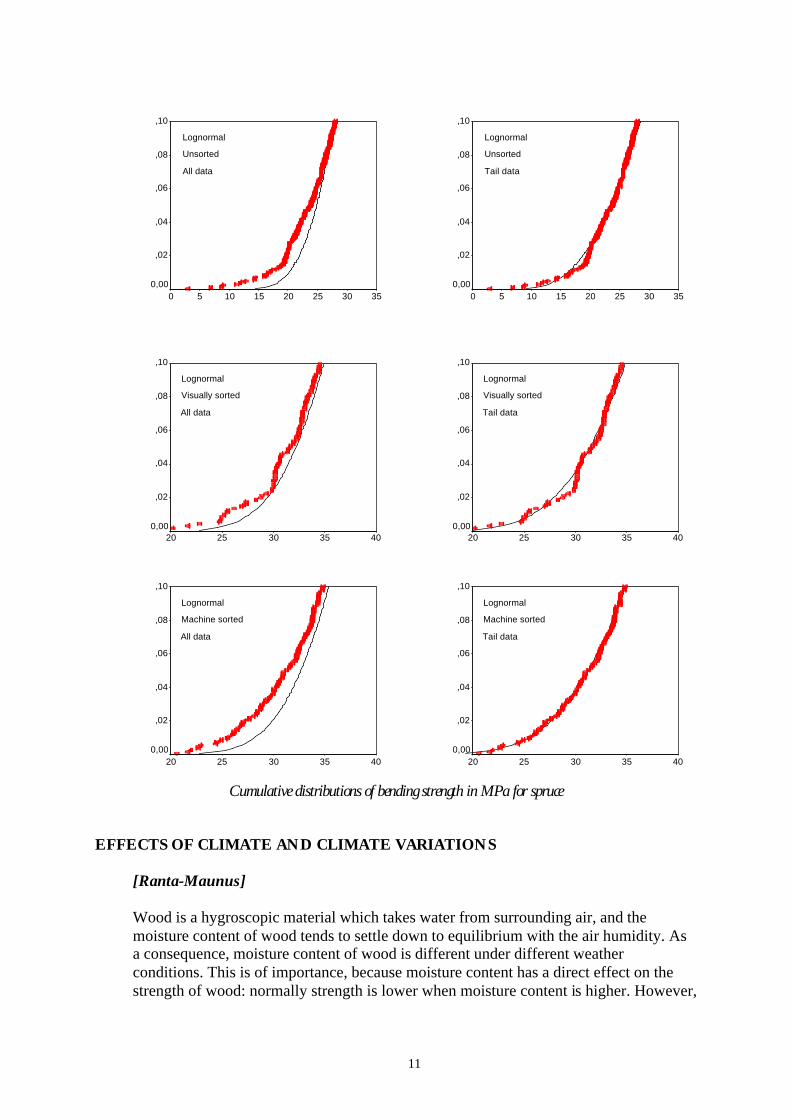
A comprehensive investigation of the properties of Finnish spruce is reported in Alpo Ranta-Maunus, Mikael Fonselius, Juha Kurke and Tomi Torratti: Reliability analysis of timber structures, VTT Building and Transport, Technical Research Centre of Finland, Draft 9.3.2001. An example of the results is reported in the following to illustrate typical distributions and the effects of grading. 589 specimens of spruce with a cross-section of 42 ×146 mm were sampled from different locations in Finland. They were visually graded according to the Nordic grading rules (C24 or rather C24 and better) and machine graded (C30 and better) using a Finnish grading machine, Raute Timgrader, a traditional bending type machine. They were then loaded in edgewise bending to failure according to the method given in European Standard EN 408. The density, bending strength and modulus of elasticity are summarised in the table below. The bending strength was modelled using normal, lognormal, and 2- and 3-parameter Weibull distributions. The estimated parameters in the normal and lognormal distributions are also given in table together with the estimated 5-percentiles. In addition to an analysis using all data, also the tail data represented by 10 % of the weakest specimens were analysed.
Number Data Density, kg/m3 Modulus of Ela-sticity, MPa
Bending strength, MPa
mean cov %
mean cov %
mean Stand. deviat
5-per centile
Ungraded 589 448 9.0 13 000 18.8 Normal All 45.2 11.4 26.5 Tail 47.7 12.6 26.9 Lognormal All 3.78 0.292 27.0 Tail 4.13 0.517 26.6 Visually C24 367 455 8.2 13 700 15.7 Normal All 49.4 9.8 33.3 Tail 46.1 7.6 33.6 Lognormal All 3.88 0.205 34.6 Tail 3.91 0.242 33.5 Machine C30 496 456 7.60 13 600 15.4 Normal All 47.5 10.3 30.6 Tail 44.1 8.0 30.9 Lognormal All 3.84 0.226 32.0 Tail 3.90 0.284 30.8
Examples of the cumulative distributions of bending strengths are shown in the following figures reproduced from (Ranta-Maunus et al., 2001). The visual grading is in this case on the safe side, partly due to the fact that it contains not only C24 but also C30 and better. The yield is about 62 %, i.e. more than a third is rejected. The machine strength grading has a yield of 85 % even with a 30 % higher target strength.
11
35302520151050
,10
,08
,06
,04
,02
0,00
Lognormal
Unsorted
All data
35302520151050
,10
,08
,06
,04
,02
0,00
Lognormal
Unsorted
Tail data
4035302520
,10
,08
,06
,04
,02
0,00
Lognormal
Visually sorted
All data
4035302520
,10
,08
,06
,04
,02
0,00
Lognormal
Visually sorted
Tail data
4035302520
,10
,08
,06
,04
,02
0,00
Lognormal
Machine sorted
All data
4035302520
,10
,08
,06
,04
,02
0,00
Lognormal
Machine sorted
Tail data
Cumulative distributions of bending strength in MPa for spruce EFFECTS OF CLIMATE AND CLIMATE VARIATIONS
[Ranta-Maunus] Wood is a hygroscopic material which takes water from surrounding air, and the moisture content of wood tends to settle down to equilibrium with the air humidity. As a consequence, moisture content of wood is different under different weather conditions. This is of importance, because moisture content has a direct effect on the strength of wood: normally strength is lower when moisture content is higher. However,
12
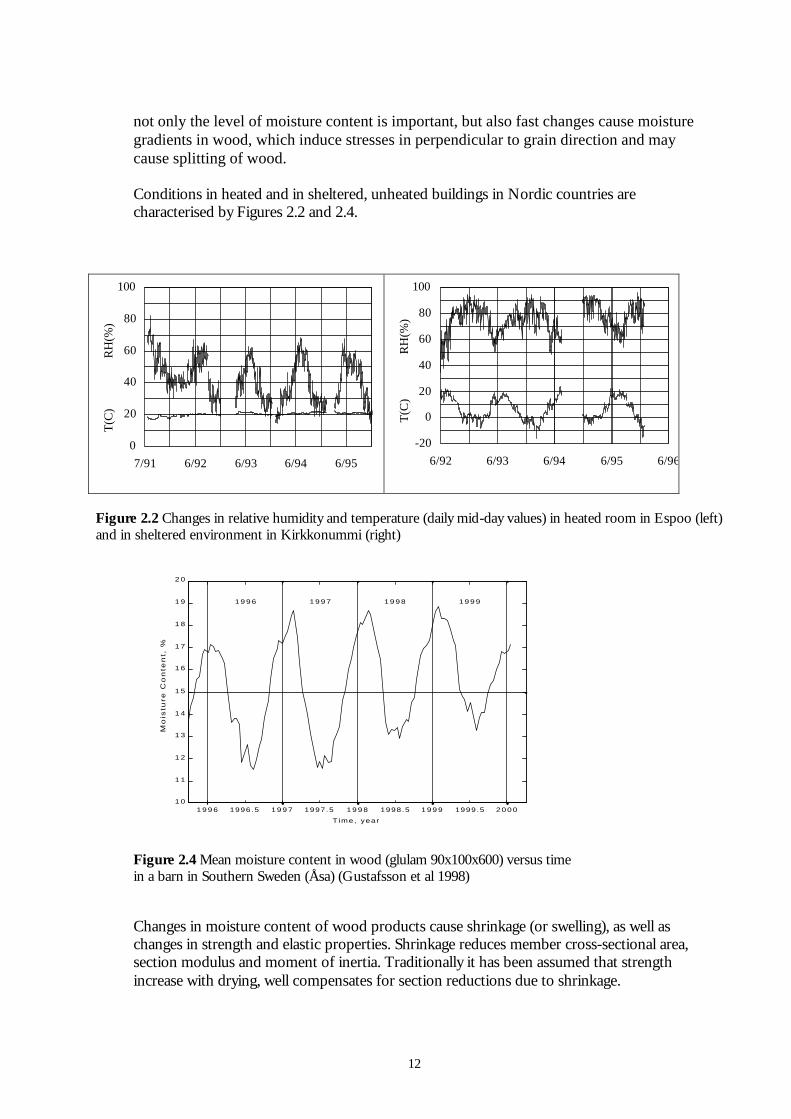
not only the level of moisture content is important, but also fast changes cause moisture gradients in wood, which induce stresses in perpendicular to grain direction and may cause splitting of wood. Conditions in heated and in sheltered, unheated buildings in Nordic countries are characterised by Figures 2.2 and 2.4.
0
20
40
60
80
100
7/91 6/92 6/93 6/94 6/95
T(C
)
RH
(%)
-20
0
20
40
60
80
100
6/92 6/93 6/94 6/95 6/96
T(C
)
R
H(%
)
Figure 2.2 Changes in relative humidity and temperature (daily mid-day values) in heated room in Espoo (left) and in sheltered environment in Kirkkonummi (right)
1 9 9 6 1996.5 1 9 9 7 1997.5 1 9 9 8 1998.5 1 9 9 9 1999.5 2 0 0 01 0
1 1
1 2
1 3
1 4
1 5
1 6
1 7
1 8
1 9
2 0
Time, year
Mo
istu
re C
on
ten
t, %
1 9 9 6 1 9 9 7 1 9 9 8 1 9 9 9
Figure 2.4 Mean moisture content in wood (glulam 90x100x600) versus time in a barn in Southern Sweden (Åsa) (Gustafsson et al 1998) Changes in moisture content of wood products cause shrinkage (or swelling), as well as changes in strength and elastic properties. Shrinkage reduces member cross-sectional area, section modulus and moment of inertia. Traditionally it has been assumed that strength increase with drying, well compensates for section reductions due to shrinkage.

13
The experimental results show that bending and compression strengths generally increase with decreasing moisture content below the fibre saturation point. For member capacities similar trend is observed in spite of the opposite effect of shrinking dimensions of cross-section. Tension strength depends weakly on moisture content, and this dependence is normally neglected. Mechanical properties are affected more by moisture in high quality material than in ow grade materials. In standard EN 384 no adjustment is used for bending and tension strengths. This reflects the fact that the lowest 5th percentile of the material is very little influenced by moisture. More detailed illustration of the effect of moisture on different fractiles of strength of European and American timber is shown in Figures 3.1 to 3.3. Even if dry wood has higher strength than wet wood, and the trend is obvious, there is a limit in moisture content below which wood is not getting stronger while drying more, on the contrary it may become weaker. This limit is not identical for all species and loading directions, but as a rule of thumb we could say that wood has its maximum strength around 10% moisture content. If the conditions are such that moisture content is considerably lower, say below 5%, the strength may be also lower. If low moisture content is a result from long term exposure to elevated temperatures, this may be an additional reason for reduced strength. When temperature is high, say around 60°C, a long exposure degrades wood, and strength is permanently reduced (Fig. 3.4 ). Also the strength of normal timber tested at elevated temperatures is reduced, depending on temperature and moisture content. Structures are, however, seldom at so high temperatures that the strength and stiffness reduction needs to be considered.
Figure 3.1 Compression (fc), tension (ft) andbending (fm) strength vs. percentile of matched samples of spruce (Picea abies) at moisture contents 12, 20 and over 28 according to Hoffmeyer (1995 )
14
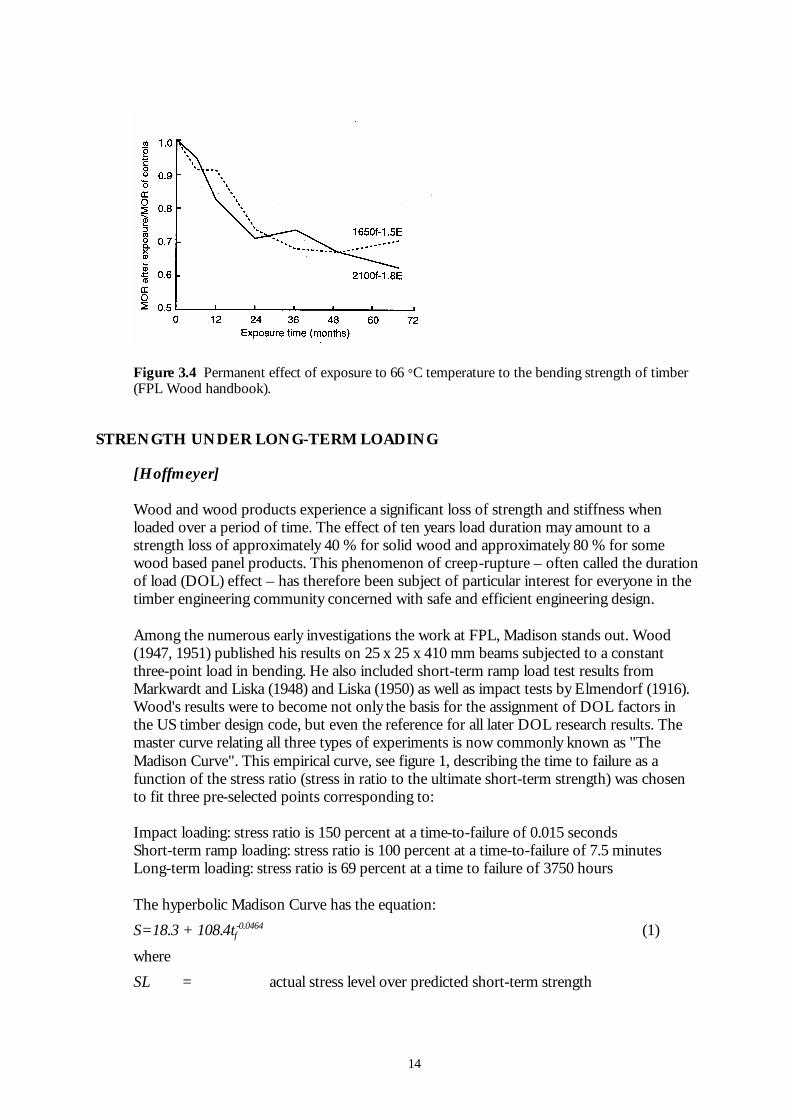
Figure 3.4 Permanent effect of exposure to 66 °C temperature to the bending strength of timber (FPL Wood handbook).
STRENGTH UNDER LONG-TERM LOADING
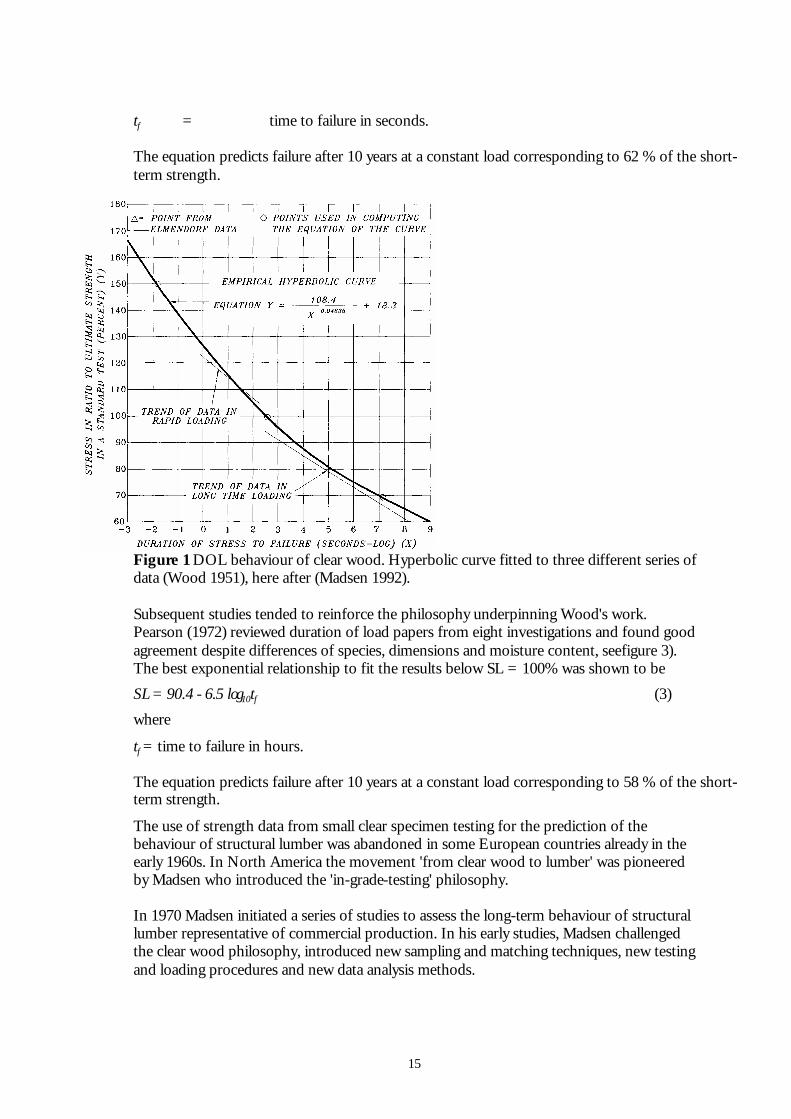
[Hoffmeyer] Wood and wood products experience a significant loss of strength and stiffness when loaded over a period of time. The effect of ten years load duration may amount to a strength loss of approximately 40 % for solid wood and approximately 80 % for some wood based panel products. This phenomenon of creep-rupture – often called the duration of load (DOL) effect – has therefore been subject of particular interest for everyone in the timber engineering community concerned with safe and efficient engineering design. Among the numerous early investigations the work at FPL, Madison stands out. Wood (1947, 1951) published his results on 25 x 25 x 410 mm beams subjected to a constant three-point load in bending. He also included short-term ramp load test results from Markwardt and Liska (1948) and Liska (1950) as well as impact tests by Elmendorf (1916). Wood's results were to become not only the basis for the assignment of DOL factors in the US timber design code, but even the reference for all later DOL research results. The master curve relating all three types of experiments is now commonly known as "The Madison Curve". This empirical curve, see figure 1, describing the time to failure as a function of the stress ratio (stress in ratio to the ultimate short-term strength) was chosen to fit three pre-selected points corresponding to: Impact loading: stress ratio is 150 percent at a time-to-failure of 0.015 seconds Short-term ramp loading: stress ratio is 100 percent at a time-to-failure of 7.5 minutes Long-term loading: stress ratio is 69 percent at a time to failure of 3750 hours The hyperbolic Madison Curve has the equation:
S=18.3 + 108.4tf-0.0464 (1)
where
SL = actual stress level over predicted short-term strength
15
tf = time to failure in seconds. The equation predicts failure after 10 years at a constant load corresponding to 62 % of the short-term strength.
Figure 1 DOL behaviour of clear wood. Hyperbolic curve fitted to three different series of data (Wood 1951), here after (Madsen 1992). Subsequent studies tended to reinforce the philosophy underpinning Wood's work. Pearson (1972) reviewed duration of load papers from eight investigations and found good agreement despite differences of species, dimensions and moisture content, seefigure 3). The best exponential relationship to fit the results below SL = 100% was shown to be
SL= 90.4 - 6.5 log10tf (3)
where
tf = time to failure in hours. The equation predicts failure after 10 years at a constant load corresponding to 58 % of the short-term strength.
The use of strength data from small clear specimen testing for the prediction of the behaviour of structural lumber was abandoned in some European countries already in the early 1960s. In North America the movement 'from clear wood to lumber' was pioneered by Madsen who introduced the 'in-grade-testing' philosophy. In 1970 Madsen initiated a series of studies to assess the long-term behaviour of structural lumber representative of commercial production. In his early studies, Madsen challenged the clear wood philosophy, introduced new sampling and matching techniques, new testing and loading procedures and new data analysis methods.

16
Figure 3 DOL behaviour of clear wood in bending. Eight different investigations (Pearson 1972). Based on this methodology, Madsen (1973) reported results from step-wise ramp loading of western hemlock lumber. These results suggested that the DOL effect varied with material quality. Low quality (i.e. low strength) material seemed to exhibit less DOL effect than high quality material of the same sample. For low quality material, the DOL effect was significantly smaller than predicted from the Madison Curve for both dry and wet material.

17
Figure 5 Wet and dry bending tests with #2 Grade material subjected to a stepwise ramp loading. The behaviour is very similar for the wet and dry tests except for the very strong material where dry specimens are stronger than wet specimens (from Madsen 1992).
The step-wise ramp loading results raised obvious question: Would constant load tests result in a different DOL response? Would species have an influence? Madsen and Barrett (1976) addressed some of these issues in a large study of Douglas-fir subjected to constant bending loads. Matched groups of specimens were subjected to constant loads at selected percentiles of the short-term strength. The results confirmed the findings from the step-wise ramp load tests suggesting that DOL effects in lumber are less severe than predicted from the Madison Curve for load durations up to almost one year, see figure 6. The results were supported from results of another early Canadian study of DOL effects in western hemlock (Foschi and Barrett 1982).
Figure 6 Relation between stress level and time-to-failure for Douglas-fir (Madsen 1992) DOL studies including loading modes other than bending are scarce. However, those available surprisingly suggest that in general there is no significant influence of loading mode for stresses parallel to grain. Tension perpendicular to grain strength seems, however, to be more sensitive to the duration of load than bending strength. For the interpretation of experimental results the development of a mathematical DOL model is required. Conclusions from constant load tests have to be linked to results from ramp load tests and stepwise ramp load tests. Results from high load experiments have to be extrapolated to the lower loads typical of design situations. The following two approaches have proven particularly successful in the development of time-to-failure modelling: Accumulation of damage Fracture mechanics of viscoelastic materials
18
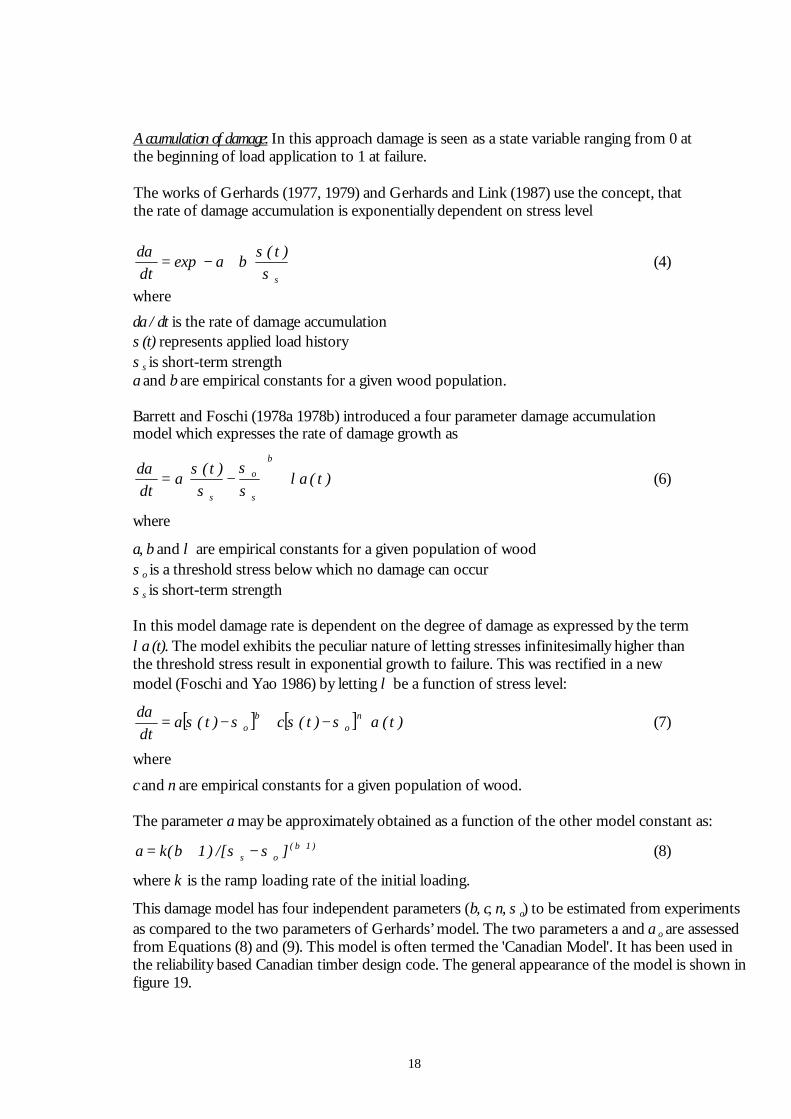
Accumulation of damage: In this approach damage is seen as a state variable ranging from 0 at the beginning of load application to 1 at failure. The works of Gerhards (1977, 1979) and Gerhards and Link (1987) use the concept, that the rate of damage accumulation is exponentially dependent on stress level
⋅+−=
s
)t(baexp
dtd
σσα
(4)
where
dα/dt is the rate of damage accumulation σ(t) represents applied load history σs is short-term strength a and b are empirical constants for a given wood population. Barrett and Foschi (1978a 1978b) introduced a four parameter damage accumulation model which expresses the rate of damage growth as
)t()t(
adtd
b
s
o
s
λασσ
σσα
+
−= (6)
where
a, b and λ are empirical constants for a given population of wood σo is a threshold stress below which no damage can occur σs is short-term strength In this model damage rate is dependent on the degree of damage as expressed by the term λα(t). The model exhibits the peculiar nature of letting stresses infinitesimally higher than the threshold stress result in exponential growth to failure. This was rectified in a new model (Foschi and Yao 1986) by letting λ be a function of stress level:
[ ] [ ] )t()t(c)t(adtd n
ob
o ασσσσα
⋅−+−= (7)
where
c and n are empirical constants for a given population of wood. The parameter a may be approximately obtained as a function of the other model constant as:
)1b(os ]/[)1b(ka +−+= σσ (8)
where k is the ramp loading rate of the initial loading.
This damage model has four independent parameters (b, c, n, σo) to be estimated from experiments as compared to the two parameters of Gerhards’ model. The two parameters a and αo are assessed from Equations (8) and (9). This model is often termed the 'Canadian Model'. It has been used in the reliability based Canadian timber design code. The general appearance of the model is shown in figure 19.

19
Figure 19 The Canadian DOL model (Foschi and Yao 1986), here after (Madsen 1992) Fracture Mechanics of Viscoelastic Materials: Damage accumulation models may be seen entirely as appropriate curve fitting tools. Such models do not necessarily reflect any physical/mechanical mechanisms leading to failure. A different approach is to try to model the mechanisms behind the fact that for most loading modes wood fails as a result of crack growth. Viscoelastic fracture mechanics was introduced to the area of wood by Nielsen (1979). A condensed treatment of his Damaged cracked Viscoelastic Material (DVM) theory is found in (Madsen 1992). Nielsen originally developed his DVM model for a linear viscoelastic material by introducing an elastic – viscoelastic analogy, i.e. introducing a time dependent modulus of elasticity in the Dugdale crack model. Over the years the model has been further developed and refined by Nielsen to even include modelling of the frequency dependent DOL behaviour under pulsating load (Nielsen 2000a 2000b). Nielsen's model for static load considers crack development with time in three phase, see figure 20. Phase 1: The crack length stays constant but due to creep the crack gradually opens to its critical displacement. Phase 2: From time ts the crack opening displacement still stays at its critical value while the crack now starts to grow longer. The short-term strength will diminish. Phase 3: Ultimate failure (catastrophic failure) occurs at time tcat when the crack has grown to the critical length corresponding to the applied long-term load. During phase 3 tertiary creep may occur. Figure 21 illustrates the quality of fit for Foschi's (Eq. 7) and Nielsen's (Eq. 13) models when used on experimental data. Both models are producing acceptable fits. For very short times, Foschi's model seems to better describe the first steep part of the DOL curve, while for medium times to failure Nielsen's model produces the best fit. For times longer than twenty months both models produce accurate fits.
All the models presented above work for variable load histories, but none of the models are able to include the frequency dependency of the load. However, the Nielsen model was recently developed to also accommodate the frequency dependency (Nielsen 2000a 2000b).

20
Figure 20 Illustration of how crack growth takes place by going through three phases
Figure 21 DOL results from modelled by Foschi's and Nielsen's models
VOLUME EFFECT
[Larsen]
It is often claimed that the strength of timber depends on the size of the stressed volume: deep beams are weaker than shallow ones, wide and long tension members are weaker than narrow and short ones, etc. Whether this is really the case is much discussed; many maintain for instance that the effect for ordinary timber beams is due to cutting and
21
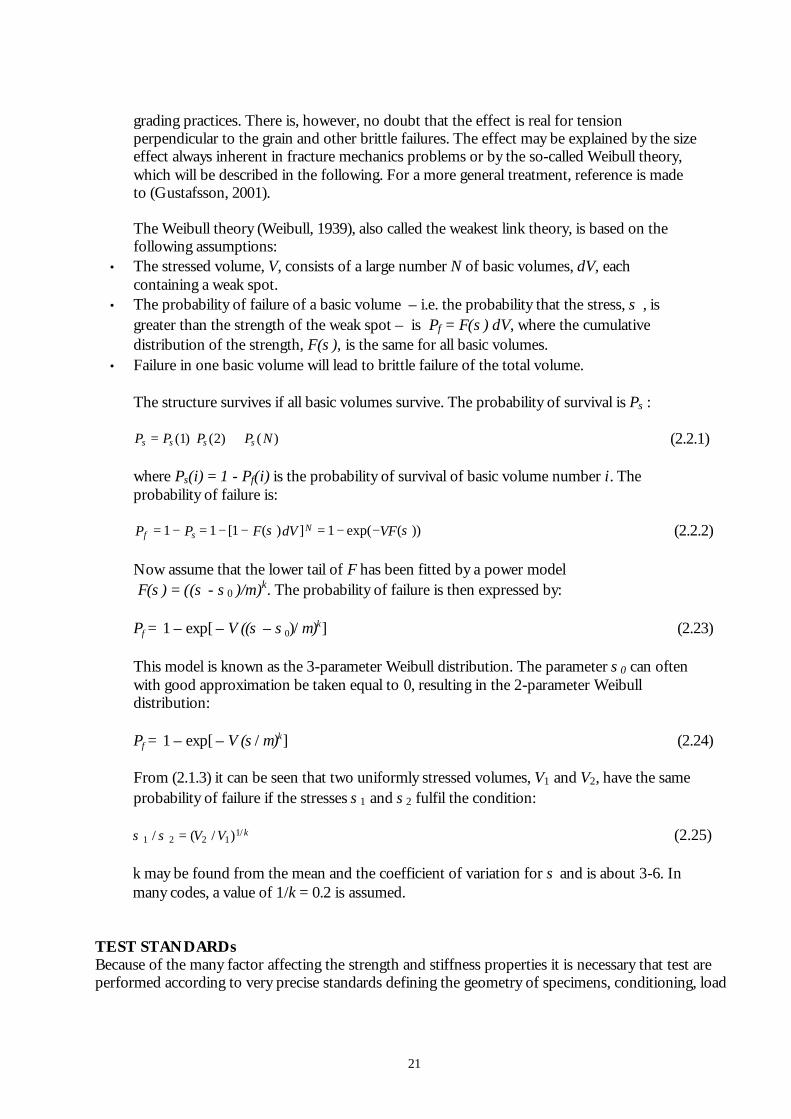
grading practices. There is, however, no doubt that the effect is real for tension perpendicular to the grain and other brittle failures. The effect may be explained by the size effect always inherent in fracture mechanics problems or by the so-called Weibull theory, which will be described in the following. For a more general treatment, reference is made to (Gustafsson, 2001). The Weibull theory (Weibull, 1939), also called the weakest link theory, is based on the following assumptions:
• The stressed volume, V, consists of a large number N of basic volumes, dV, each containing a weak spot.
• The probability of failure of a basic volume – i.e. the probability that the stress, σ , is greater than the strength of the weak spot – is Pf = F(σ) dV, where the cumulative distribution of the strength, F(σ), is the same for all basic volumes.
• Failure in one basic volume will lead to brittle failure of the total volume. The structure survives if all basic volumes survive. The probability of survival is Ps :
P P P P Ns s s s= ⋅ ⋅ ⋅⋅( ) ( ) ( )1 2 (2.2.1) where Ps(i) = 1 - Pf(i) is the probability of survival of basic volume number i. The probability of failure is: P P F dV VFf s
N= − = − − = − −1 1 1 1[ ( ) ] exp( ( ))σ σ (2.2.2)
Now assume that the lower tail of F has been fitted by a power model F(σ) = ((σ - σ0 )/m)k. The probability of failure is then expressed by: Pf = 1 – exp[ – V((σ – σ0)/m)k] (2.23)
This model is known as the 3-parameter Weibull distribution. The parameter σ0 can often with good approximation be taken equal to 0, resulting in the 2-parameter Weibull distribution:
Pf = 1 – exp[ – V(σ/m)k] (2.24)
From (2.1.3) it can be seen that two uniformly stressed volumes, V1 and V2, have the same probability of failure if the stresses σ1 and σ2 fulfil the condition:
σ σ1 2 2 1
1/ ( / ) /= V V k (2.25) k may be found from the mean and the coefficient of variation for σ and is about 3-6. In many codes, a value of 1/k = 0.2 is assumed.
TEST STANDARDs Because of the many factor affecting the strength and stiffness properties it is necessary that test are performed according to very precise standards defining the geometry of specimens, conditioning, load
22
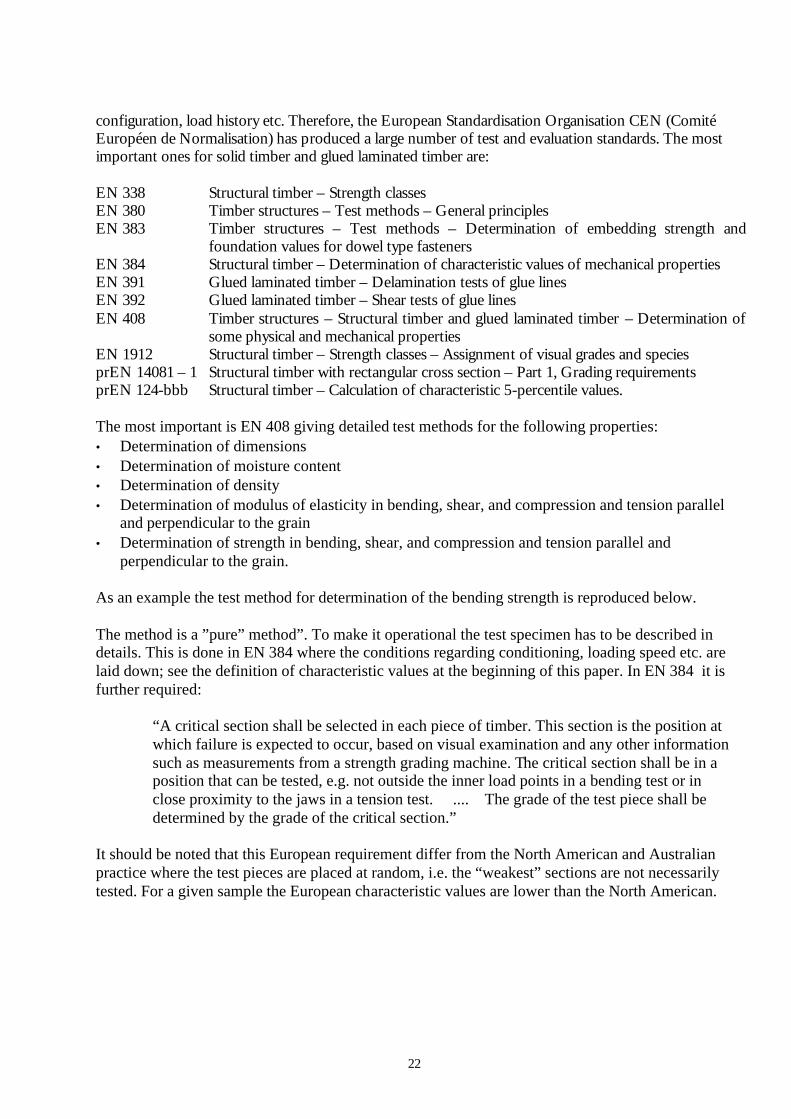
configuration, load history etc. Therefore, the European Standardisation Organisation CEN (Comité Européen de Normalisation) has produced a large number of test and evaluation standards. The most important ones for solid timber and glued laminated timber are: EN 338 Structural timber – Strength classes EN 380 Timber structures – Test methods – General principles EN 383 Timber structures – Test methods – Determination of embedding strength and
foundation values for dowel type fasteners EN 384 Structural timber – Determination of characteristic values of mechanical properties EN 391 Glued laminated timber – Delamination tests of glue lines EN 392 Glued laminated timber – Shear tests of glue lines EN 408 Timber structures – Structural timber and glued laminated timber – Determination of
some physical and mechanical properties EN 1912 Structural timber – Strength classes – Assignment of visual grades and species prEN 14081 – 1 Structural timber with rectangular cross section – Part 1, Grading requirements prEN 124-bbb Structural timber – Calculation of characteristic 5-percentile values. The most important is EN 408 giving detailed test methods for the following properties: • Determination of dimensions • Determination of moisture content • Determination of density • Determination of modulus of elasticity in bending, shear, and compression and tension parallel
and perpendicular to the grain • Determination of strength in bending, shear, and compression and tension parallel and
perpendicular to the grain. As an example the test method for determination of the bending strength is reproduced below. The method is a ”pure” method”. To make it operational the test specimen has to be described in details. This is done in EN 384 where the conditions regarding conditioning, loading speed etc. are laid down; see the definition of characteristic values at the beginning of this paper. In EN 384 it is further required:
“A critical section shall be selected in each piece of timber. This section is the position at which failure is expected to occur, based on visual examination and any other information such as measurements from a strength grading machine. The critical section shall be in a position that can be tested, e.g. not outside the inner load points in a bending test or in close proximity to the jaws in a tension test. .... The grade of the test piece shall be determined by the grade of the critical section.”
It should be noted that this European requirement differ from the North American and Australian practice where the test pieces are placed at random, i.e. the “weakest” sections are not necessarily tested. For a given sample the European characteristic values are lower than the North American.
23
EXTRACT OF EN 408
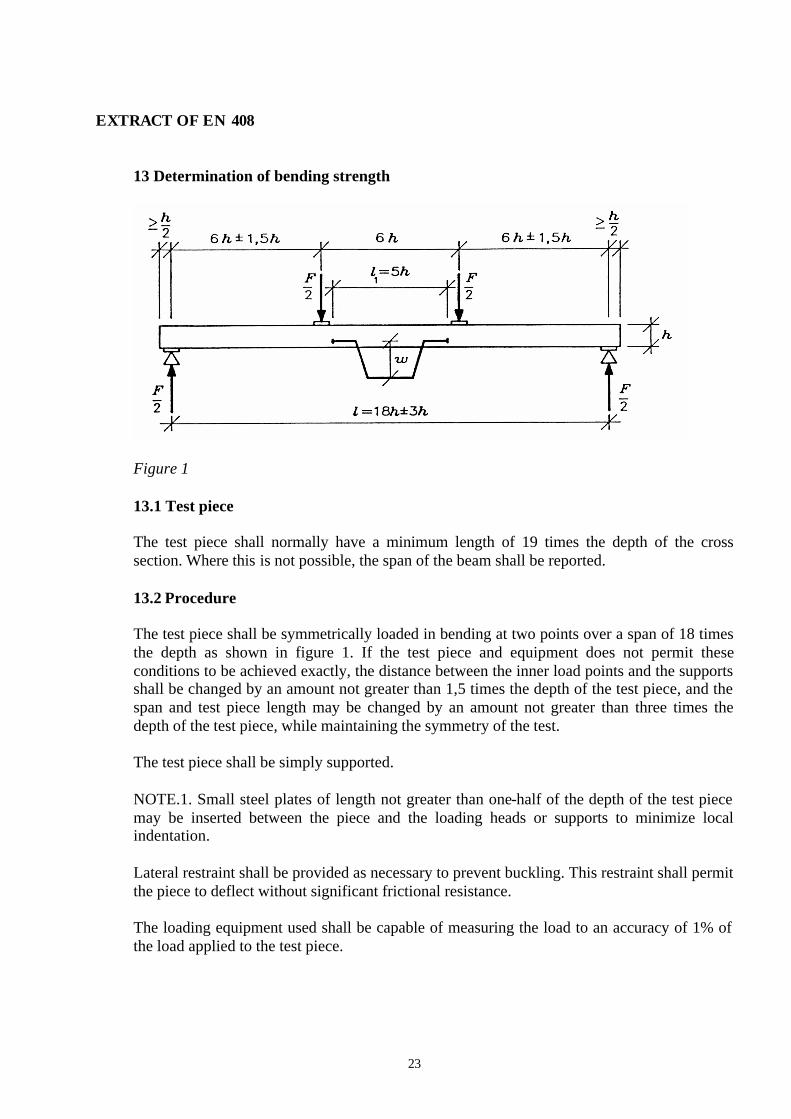
13 Determination of bending strength
Figure 1 13.1 Test piece The test piece shall normally have a minimum length of 19 times the depth of the cross section. Where this is not possible, the span of the beam shall be reported. 13.2 Procedure The test piece shall be symmetrically loaded in bending at two points over a span of 18 times the depth as shown in figure 1. If the test piece and equipment does not permit these conditions to be achieved exactly, the distance between the inner load points and the supports shall be changed by an amount not greater than 1,5 times the depth of the test piece, and the span and test piece length may be changed by an amount not greater than three times the depth of the test piece, while maintaining the symmetry of the test. The test piece shall be simply supported. NOTE.1. Small steel plates of length not greater than one-half of the depth of the test piece may be inserted between the piece and the loading heads or supports to minimize local indentation. Lateral restraint shall be provided as necessary to prevent buckling. This restraint shall permit the piece to deflect without significant frictional resistance. The loading equipment used shall be capable of measuring the load to an accuracy of 1% of the load applied to the test piece.
24
Load shall be applied at a constant loading-head movement so adjusted that maximum load is reached within (300 ± 120) s. NOTE 2. This rate should be determined from the results of preliminary tests. The objective is that the time to reach Fmax for each piece is 300s. The time to failure for each test piece shall be recorded and its average reported. Any single piece diverging more than 120s from the target of 300s shall be reported. 13.3 Expression of results The bending strength fm is given by the equation fm= a Fmax /(2W) Where Fmax is the maximum load and W is the section modulus. The bending strength shall be calculated to an accuracy of 1%. The mode of fracture and the growth characteristics at the fracture section of each test piece shall be recorded.

25
REFERENCES References related to [Isaksson, 2001] Riberholt H., Madsen P.H., 1979. Strength of timber structures, measured variation of the cross sectional
strength of structural lumber. Struct. Research Lab., Technical University of Denmark. Report R 114. References related to [Johansson] Boström, L. 1999. State-of-the art on machine strength grading. Proceedings of the 1st RILEM
Symposium on Timber Engineering. Stockholm, Sweden. Glos, P. 1995. Strength grading. STEP lecture A6. Centrum Hout, the Netherlands. Hoffmeyer, P. 1995. Styrkesortering ger mervärde. Del 2 - Tillgaenglig teknik. Danmarks Tekniske
Universitet. Laboratoriet for Bygningsmaterialer. Teknisk Rapport 335. Hoffmeyer, P., Bräuner, L, Boström, L., Solli, K. H. 1999. Tensile strength of glulam laminations of
Nordic spruce. Proceedings of the Pacific Timber Engineering Conference. Rotorua, New Zeeland.
Johansson, C.-J., Boström, L., Bräuner, L. Hoffmeyer, P., Holmquist C., Solli, K.H. 1998. Laminations for glued laminated timber - Establishment of strength classes for visual strength grades and machine settings for glulam laminations of Nordic origin. Swedish National Testing and Research Institute. SP REPORT 1998:38.
Schniewind, A. P., Lyon, P. E. 1971. Tensile strength of redwood dimension lumber - II. Prediction of strength values. Forest Products Journal Vol 21(8) pp 18-27.
References related to [Ranta-Maunus] Barrett, J.D., Lau, W. 1994. Canadian Lumber Properties. Canadian Wood Council.. 346 p. ISBN 0-921628-28-5 Forest Products Laboratory. 1999. Wood Handbook - Wood as an Engineering Material. Gen. Tech. Rep. FPL-
GTR-113. Madison, WI: US Department of Agriculture, Forest service, Forest products laboratory. 463 p.
Gustafsson, P.J., Hoffmeyer, P., Valentin, G. 1998. DOL behaviour of end-notched beams. Holz als Roh- und Werkstoff 56, 307-317.
Hoffmeyer, P. 1995. Wood as building material. STEP Lecture A4. Centrum Hout. Holland. References related to [Hoffmeyer[ Barrett, J.D.; Foschi, R.O. 1978a. Duration of Load and Probability of Failure in Wood. Part I. Modelling Creep
Rupture. Canadian J. of Civil Engineering 5(4):505-514
Barrett, J.D.; Foschi, R.O. 1978b. Duration of Load and Probability of Failure in Wood. Part II. Constant, Ramp and Cyclic Loadings. Canadian J. of Civil Engineering 5(4):515-532
Elmendorf, A. 1916: Stresses in Impact. J. Franklin Institute 182(6)
Foschi, R.O.; Barrett, J.D. 1982: Load Duration Effects in Western Hemlock Lumber. ASCE J. of Structural Engineering 108(7):1494-1510
Foschi, R.O.; Yao, Z.C. 1986: Another Look at Three Duration of Load Models. Proc. 19th CIB/W18 Meeting, Florence, Italy
Gerhards, C.C. 1977. Time-Related Effects of Loads on Strength of Wood. Proc. of Conference on Environmental Degradation of Engineering Materials. College of Engineering, Virginia Tech., Blacksburg, Va., USA
26
Gerhards, C.C. 1979. Time-Related Effects of Loading on Wood Strength. A Linear Cumulative Damage Theory. Wood Science 11(3):139-144
Gerhards, C.C; Link, C.L. 1987. A Cumulative Damage Model to Predict Load Duration Characteristics of Lumber. Wood and Fiber Science 19(2):147-164
Liska, J.A. 1950. Effect of Rapid Loading on the Compressive and Flexural Strength of Wood. U.S.Forest Products Laboratory. Report No. 1767
Madsen, B. 1972: Duration of Load Tests for Wood in Tension Perpendicular to Grain. Structural Research Series, Report No. 7, UBC, Vancouver, B.C.
Madsen, B. 1973: Duration of Load Tests for Dry Lumber in Bending. For. Prod. J. 23(2):21-28
Madsen, B.; Barrett, J.D. 1976: Time-Strength Relationship for Lumber. Struct. Res. Series, Report No. 13, University of British Columbia, Vancouver, Canada
Madsen, B. 1992: Structural Behaviour of Timber. ISBN 0-9696162-0-1. Timber Engineering Ltd., Vancouver, B.C.
Markwardt, L.J.; Liska, J.A. 1948. Speed of Testing of Wood. Factors in its Control and its Effect on Strength. Proc. ASTM 48:1139-1159
Nielsen, L.F. 1979: Crack failure of dead-. ramp- and combined loaded viscoelastic materials. Proc. First International Conference on Wood Fracture, Banff, Alberta, Canada
Nielsen, L.F. 2000a: Lifetime and Residual Strength of Wood Subjected to Static and Variable Load – Part I: Introduction and Analysis. Holz als Roh- und Werkstoff 58:81-90.
Nielsen, L.F. 2000b: Lifetime and Residual Strength of Wood Subjected to Static and Variable Load – Part II: Applications and Design. Holz als Roh- und Werkstoff 58:141-152.
Pearson, R.G. 1972: The Effect of Duration of Load on the Bending Strength of Wood. Holzforschung 26(4):153-158
Philpot, T.A.; Fridley, K.J.; Rosowsky, D.V. 1994: Energy-Based Failure Criterion for Wood. J. Materials in Civil Engineering, Vol.6(4):578-593
Wood, L.W. 1947: Behavior of Wood under Continued Loading. Eng. News-Record 139(24):108-111
Wood, L.W. 1951: Relation of Strength of Wood to Duration of Stress. U.S. Forest Products Laboratory. Report No. 1916
Papers related to [Larsen] Gustafsson, P.J., 2001. Timber Engineering 2000. Fracture perpendicular to grain – Structural Applications.
Division of Structural Mechanics, Lund University, Sweden. Weibull, W. 1939. The phenomenon of rupture in solids. Proceedings no. 153, Ingenjörvetenskapsaka-
demien, Sweden.