hanson cement padeswood works vertical roller mill · pdf filehanson cement padeswood works...
TRANSCRIPT

Hanson Cement Padeswood Works Vertical Roller Mill
Noise Impact Assessment
File reference number: GA001 June 2017
Northumbrian Water Environmental Services Head Office Howdon STW Newcastle-upon-Tyne Tyne and Wear NE28 0QD

Report Title Hanson Cement Padeswood VRM Noise Impact Assessment
Client Golder Associates
NWG Report No: GA001
Status & Version V4 Final
Date of Release 7 June 2017
Name Signature Position Date
Author Jeff Hood
Senior Consultant
7 June 2017
This report is not to be used for contractual or engineering purposes unless the front cover sheet is signed where indicated by the originator of the report and the report is designated ‘Final’ on the cover
sheet.

P a g e 3
Table of contents
1.0 Introduction ........................................................................................................ 4
2.0 Description ......................................................................................................... 5
3.0 Standards and guidance ................................................................................... 6
4.0 Noise Measurements ....................................................................................... 11
5.0 Noise Predictions ............................................................................................ 16
6.0 Vehicle Movements ......................................................................................... 18
7.0 Train Movements ............................................................................................. 18
8.0 Construction and Demolition Noise ............................................................... 18
9.0 Impact assessment .......................................................................................... 22
9.1 Construction noise ............................................................................................................. 22 9.2 BS 4142:2014 .................................................................................................................... 23 9.3 TAN 11 ............................................................................................................................... 25 9.4 External noise climate ....................................................................................................... 26 9.5 Uncertainty ......................................................................................................................... 26
10.0 Mitigation.......................................................................................................... 26
11.0 Summary .......................................................................................................... 27
Appendix 1 Acoustic terminology ............................................................................................ 30 Appendix 2 Equipment used .................................................................................................... 32 Appendix 3 Model input data ................................................................................................... 33 Appendix 4 CadnaA Predicted Noise Level Contour Plots ...................................................... 36
Tables
Table 1: TAN11 NEC categories ...................................................................................................................... 7 Table 2: Noise Monitoring Location Results February – March 2017 ............................................................. 12 Table 3: Measurements taken from Ketton rail activity .................................................................................. 14 Table 4: Measurements taken around Purfleet VRM ..................................................................................... 15 Table 5: Information on sound attenuation of available wall and roof panels ................................................. 17 Table 6: List of demolition plant ..................................................................................................................... 19 Table 7: List of construction plant .................................................................................................................. 19 Table 8: Construction Noise Threshold Levels Based on the ABC Method (BS5228) ................................... 20 Table 9: Construction Noise Receptor Locations and Derived Threshold Category ...................................... 20 Table 10: Daytime Construction Noise Significance Criteria (Residential) ..................................................... 20 Table 11: Predicted Demolition Noise Impacts .............................................................................................. 22 Table 12: Predicted Construction Noise Impacts ........................................................................................... 22 Table 13: Predicted levels with VRM in place when compared to the existing situation. ............................... 24 Table 14: TAN11 assessment ........................................................................................................................ 25 Table 15: Comparison of assessment model run output levels - worst case example of all available mills
running for each scenario .............................................................................................................. 28 Table 16: Comparison of model output levels between existing background with mills 1-4 running and VRM29 Figures
Figure 1 Development Site Plan ...................................................................................................................... 5 Figure 2: Noise Monitoring Locations ............................................................................................................. 11 Figure 3: LA90 data from 2009 daytime levels ................................................................................................. 13 Figure 4: LA90 data from 2009 night time levels .............................................................................................. 13

P a g e 4
Noise Impact Assessment
1.0 Introduction 1.1. An assessment has been carried out to determine the potential noise impact from
the installation of a vertical roller mill (VRM), known as “Mill 5” and the mothballing of cement mills 1, 2 and 4 at Padeswood Cement Works (the Cement Works). Cement mill 3 will remain operational for periods where the VRM is out of operation or there is an upturn in the production requirements. The Cement Works currently has four operational cement mills; mills 1-4. The noise assessment was undertaken in accordance with the scope set out in the Screening and Scoping Report prepared by Golder Associates in March 2017 (re: 1773079.500/A.0) and issued to Flintshire County Council.
1.2. The baseline noise levels from the works have been measured at 10 locations
(Figure 2) as part of historic PPC permit conditions between 2007 and 2013. Measurements were taken again at these locations during February and March 2017 to assess the existing background noise levels in the area with the works operational. Comparisons with the historic data and the 2017 data have been made.
1.3. An identical VRM, of similar construction, is in operation at Hanson’s Purfleet
Works; this was visited on 22nd February 2017 and noise levels were assessed inside and outside the building. This data has been used in the modelled predictions.
1.4. The noise impact from the reduction in traffic movements and the addition of train
movements have also be assessed. Measurements of typical train movements and loading were taken at Hanson Cement’s Ketton Cement Works on the 13th March 2017. The movements are of a similar nature and measurements were not influenced by the main works noise. The data collected was used in the Cadna model.
1.5. Predictions of noise levels have been made for the surrounding area and
specifically for nearby residential properties to show the existing situation and the proposed situation. The construction and demolition works have also been assessed. The assessment results have been compared to Technical Advice Note (Wales) 11: 1997 ‘Noise’ (TAN11), BS4142:2014, and World Health Organisation recommendations and criteria. Where appropriate, proposals for suggested mitigation measures, in order to minimise any potential negative impacts arising from the development have been provided with a prediction of any residual affects which may remain following implementation of the proposed mitigation measures.
1.6. A glossary of terms is provided in Appendix 1.
P a g e 5
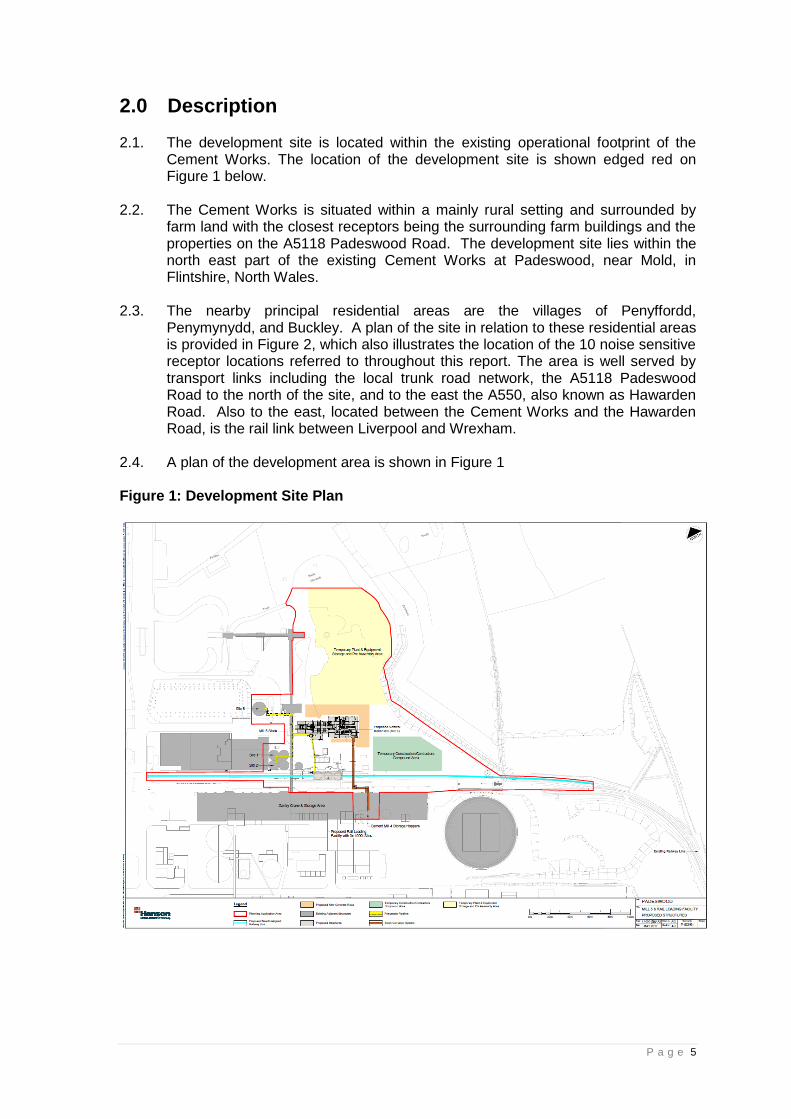
2.0 Description 2.1. The development site is located within the existing operational footprint of the
Cement Works. The location of the development site is shown edged red on Figure 1 below.
2.2. The Cement Works is situated within a mainly rural setting and surrounded by
farm land with the closest receptors being the surrounding farm buildings and the properties on the A5118 Padeswood Road. The development site lies within the north east part of the existing Cement Works at Padeswood, near Mold, in Flintshire, North Wales.
2.3. The nearby principal residential areas are the villages of Penyffordd,
Penymynydd, and Buckley. A plan of the site in relation to these residential areas is provided in Figure 2, which also illustrates the location of the 10 noise sensitive receptor locations referred to throughout this report. The area is well served by transport links including the local trunk road network, the A5118 Padeswood Road to the north of the site, and to the east the A550, also known as Hawarden Road. Also to the east, located between the Cement Works and the Hawarden Road, is the rail link between Liverpool and Wrexham.
2.4. A plan of the development area is shown in Figure 1 Figure 1: Development Site Plan

P a g e 6
3.0 Standards and guidance
The following relevant guidance documents were considered whilst undertaking this assessment.
2.1. Planning Policy Wales Edition 9 – November 2016, describes the planning
development policies of the Welsh Assembly Government. Chapter 13 of the policy “Minimising and Managing Environmental Risks and Pollution” sets out the policy objectives with regard to noise from new development; this is summarised in paragraph 13.15.1 of the document:
“Noise can be a material planning consideration, for example in proposals to use or develop land near an existing source of noise or where a proposed new development is likely to generate noise. Local planning authorities should make a careful assessment of likely noise levels and have regard to any relevant Noise Action Plan before determining such planning applications and in some circumstances it will be necessary for a technical noise assessment to be provided by the developer.”
2.2. The introduction of Technical Advice Note (Wales) 11: 1997 ‘Noise’ (TAN11) states:
“This note provides advice on how the planning system can be used to minimise the adverse impact of noise without placing unreasonable restrictions on development or adding unduly to the costs and administrative burdens of business.”
TAN11 provides the following information:
it indicates how noise issues should be handled in development plans and development control;
outlines ways of mitigating the adverse impact of noise;
provides specific guidance on noisy and noise-sensitive development;
introduces the use of noise exposure categories; and
guidance on the use of planning conditions relating to noise.
2.3. The TAN11 guidance introduces the concept of Noise Exposure Categories (NEC), which has been derived to assist local planning authorities in their consideration of planning applications for residential development near transport-related noise sources. The NEC procedure is only applicable for the introduction of a new residential development into an area with an existing noise source. Annex 1 of TAN11 provides guidance on various types of noise sources, which includes road traffic, aircraft and railways.
2.4. For reference, the recommended NEC for new dwellings near existing sources is provided in Table 1. Note that these noise categories are based upon measurements taken in an open site (i.e. without any proposed noise attenuating features in place).
2.5. The level at the boundary of NEC A and NEC B is based on guidance provided by the World Health Organisation (WHO) health criteria from 1999, which states that “general daytime outdoor noise levels of less than 55 dB(A) Leq are desirable to present any significant community annoyance”.
2.6. The night time noise level at the boundary of NEC A and NEC B is also based upon the WHO health criteria, stating “based on limited data available, a level of
P a g e 7
less than 35 dB(A) Leq is recommended to preserve the restorative process of sleep”. A level of 30 dB(A) is also recommended in BS8233 for bedrooms.
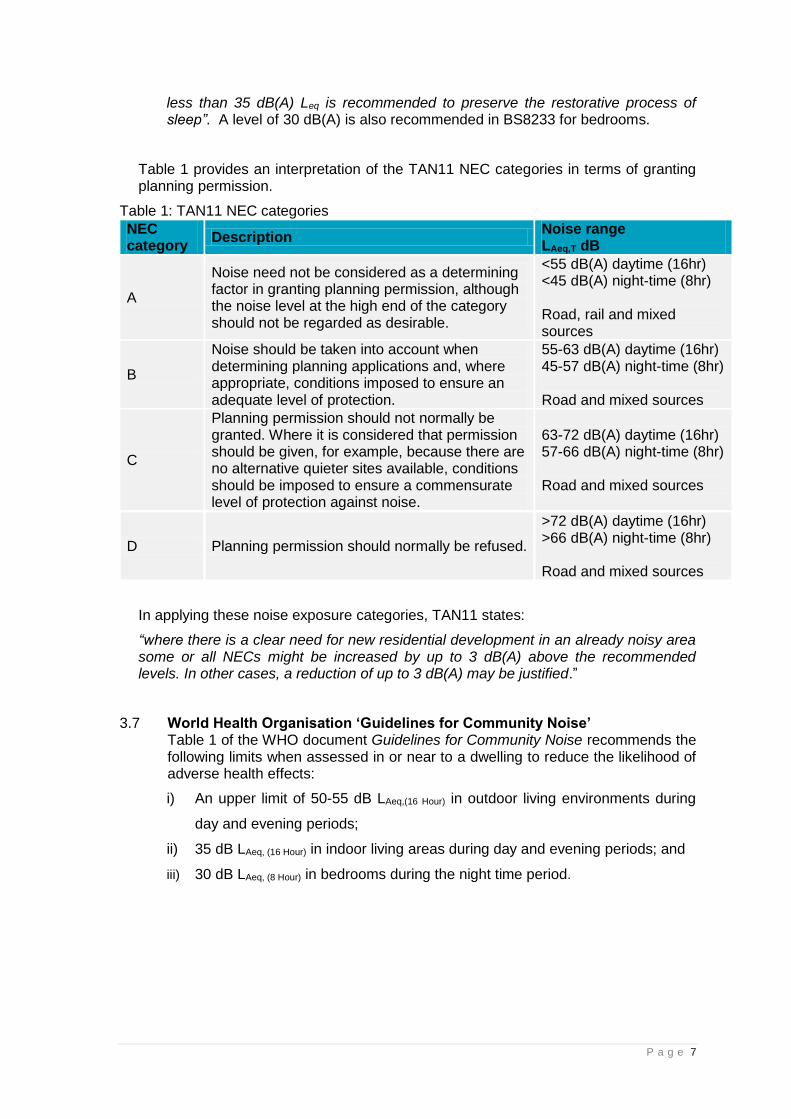
Table 1 provides an interpretation of the TAN11 NEC categories in terms of granting planning permission.
Table 1: TAN11 NEC categories
NEC category
Description Noise range LAeq,T dB
A
Noise need not be considered as a determining factor in granting planning permission, although the noise level at the high end of the category should not be regarded as desirable.
<55 dB(A) daytime (16hr) <45 dB(A) night-time (8hr) Road, rail and mixed sources
B
Noise should be taken into account when determining planning applications and, where appropriate, conditions imposed to ensure an adequate level of protection.
55-63 dB(A) daytime (16hr) 45-57 dB(A) night-time (8hr) Road and mixed sources
C
Planning permission should not normally be granted. Where it is considered that permission should be given, for example, because there are no alternative quieter sites available, conditions should be imposed to ensure a commensurate level of protection against noise.
63-72 dB(A) daytime (16hr) 57-66 dB(A) night-time (8hr) Road and mixed sources
D Planning permission should normally be refused.
>72 dB(A) daytime (16hr) >66 dB(A) night-time (8hr) Road and mixed sources
In applying these noise exposure categories, TAN11 states:
“where there is a clear need for new residential development in an already noisy area some or all NECs might be increased by up to 3 dB(A) above the recommended levels. In other cases, a reduction of up to 3 dB(A) may be justified.”
3.7 World Health Organisation ‘Guidelines for Community Noise’ Table 1 of the WHO document Guidelines for Community Noise recommends the following limits when assessed in or near to a dwelling to reduce the likelihood of adverse health effects:
i) An upper limit of 50-55 dB LAeq,(16 Hour) in outdoor living environments during
day and evening periods;
ii) 35 dB LAeq, (16 Hour) in indoor living areas during day and evening periods; and
iii) 30 dB LAeq, (8 Hour) in bedrooms during the night time period.

P a g e 8
3.8 British Standard 4142:2014 describes a method for rating and assessing sound levels of an industrial and/or commercial nature, and the effects the sound may have on people who might be inside or outside a dwelling or premises used for residential purposes upon which sound is incident.
3.9 The sound from the industrial/commercial source is rated by taking into account the sound level of the source, known as the specific sound level, and its characteristics, such as tonal, impulsive or intermittency of the source, and applying an appropriate correction or penalty to give the rating level of the sound source. To gain an initial estimate of the potential impacts of the sound source, its rating level is compared to the background sound level, and the level by which it exceeds the background sound level indicates the following potential impacts:
a) Typically, the greater this difference, the greater the magnitude of the
impact.
b) A difference of around +10 dB or more is likely to be an indication of a
significant adverse impact, depending on the context.
c) A difference of around +5 dB is likely to be an indication of an adverse
impact, depending on the context.
d) The lower the rating level is relative to the measured background sound
level; the less likely it is that the specific sound source will have an adverse
impact or a significant adverse impact. Where the rating level does not
exceed the background sound level, this is an indication of the specific
sound source having a low impact, depending on the context.
3.10. Adverse impacts include, but are not limited to, annoyance and sleep disturbance. Not all adverse impacts will lead to complaints and not every complaint is proof of an adverse impact.
In terms of establishing the rating level, corrections for the noise character has to be taken into consideration. These include the following factors:
3.11. Tonality
For sound ranging from “not tonal” to “prominently tonal” penalty levels of between 0 dB and +6 dB for tonality can be applied. Subjectively, this can be conceded to a penalty of 2 dB for a tone which is just perceptible at the noise receptor, 4 dB where it is clearly perceptible and 6 dB where it is highly perceptible.
3.12. Impulsivity
A correction of up to +9 dB can be applied for sound that is highly impulsive, considering both the rapidity of the change in sound level and the overall change in sound level. Subjectively, this can be conceded to a penalty of 3 dB for impulsivity which is just perceptible at the noise receptor, 6 dB where it is clearly perceptible and 9 dB where it is highly perceptible.
3.13. Other sound characteristics
Where the specific sound features characteristics that are neither tonal nor impulsive, though otherwise are readily distinctive against the residual acoustic environment, a penalty of 3 dB can be applied.
Where tonal and impulsive characteristics are present in the specific sound within the same reference period then these two corrections can both be taken into

P a g e 9
account. If one feature is dominant then it might be appropriate to apply a single correction. Where both features are likely to affect perception and response, the corrections ought normally to be added in a linear fashion.
3.14. Intermittency
When the specific sound has identifiable on/off conditions, the specific sound level ought to be representative of the time period of length equal to the reference time interval which contains the greatest total amount of on time. This can necessitate measuring the specific sound over a number of sampling periods that are in combination less than the reference time interval in total, and then calculating the specific sound level for the reference time interval allowing for time when the specific sound is not present. If the intermittency is readily distinctive against the residual acoustic environment, a penalty of 3 dB can be applied.
3.15 British Standard 8233:2014 Sound Insulation and Noise Reduction for Buildings states criteria for continuous noise of 30 dB to 35 dB LAeq,T for bedrooms and 30 dB to 40 dB LAeq,T for living rooms. In gardens and on balconies etc., it is desirable that the steady noise level does not exceed 50 dB LAeq,T and 55 dB LAeq,T should be regarded as the upper limit. Allowing for a 15dB reduction for open window as suggested by BS 8233 and the WHO guidelines, this indicates that external levels of no more than 45dB LAeq,T will ensure that the guideline values can be met in any receptor bedrooms and living areas surrounding the development site.
Construction Noise
3.16. British Standard 5228-1:2009+A1:2014 Code of practice for noise and vibration control on construction and open sites - Part 1: Noise. This document provides recommendations for basic methods of noise and vibration control relating to construction and open sites where work activities/operations generate significant noise and/or vibration levels. The legislative background to noise and vibration control is described and recommendations are given regarding procedures for the establishment of effective liaison between developers, site operators and local authorities. This British Standard provides guidance on methods of predicting and measuring noise and assessing its impact on those exposed to it.
3.17 Hanson Cement has provided an estimate on the expected plant in operation and
the expected timescales for the demolition and construction period. The noise levels have been assessed at the closest receptors against the recommendations given in BS5228:2009 +A1 2014, as follows:
Civils: 20 men peak for 1 month in 3 months (1 month ahead of mechanical) ( September 2017- Dec 2017);
Mechanical: 30 men peak, for 9 months reducing to completion (Jan 2018 – Sep 2018); and
Electrical: 20 men peak for 4 months, 2 months behind mechanical including help with pre-commissioning (July 2018- Nov 2018).
Maximum peak loading for personnel 70 men for 4 months decreasing towards the end of installation:

P a g e 10
Deliveries: 4 deliveries/day, 5 days/week, each month for 3 months;
Demolition Plant: 1 x 72 Tonne Giraffe, 3 x Excavators, 3 x Lorries for 2 weeks during civil construction; and
Installation Plant: 4 x Mobile Cranes, 4 x Cherry Pickers, 2 x Sky Jacks, 2 x 15 KVA Generators & Bunded Fuel Tanks c/ deliveries for 6 months.
The predicted noise levels at the closest receptors using demolition and construction phase equipment has been modelled using the above information.

P a g e 11
4.0 Noise Measurements
Padeswood Measurements
4.1 Measurements were repeated at the noise sensitive receptors previously
monitored between 2007 and 2013 for PPC and planning purposes. The aim was to re-assess the noise levels at these locations and compare the levels with previously collected data. If the data was similar to the historical data then it could be assumed that the noise levels from the cement works has not changed in terms of decibel levels measured at these locations. The sites were visited on 28th February 2017 for the night measurements and 10th March 2017 for the day measurements. All the locations could not be completed on both visits due to changes in weather conditions. Some measurement positions were reduced from 60 minutes to 30 minutes so data could be collected from more locations before weather prevented further measurements being taken. The 30 minute measurement was a representative measurement period to give an accurate LAeq and LA90 figure for the measurement point. Night measurements were 15 minute measurements.
4.2 During the measurements the weather conditions were dry and cool with very light variable winds at ground level. The general wind direction was from the west. Wind speed and direction data was collected. The measurements were made at the locations shown in Figure 2.
Figure 2: Noise Monitoring Locations

P a g e 12
Table 2: Noise Monitoring Location Results February – March 2017
Receptor ID
Location Description Day LAeq
Day LA90
Night LAeq
Night LA90
1 Spon Green 62 43 - -
2 Ty Gwyn 67 47 - -
3C Dyke Farm* 42 34 28 26
4 Toll Bar Cottage 58 41 46 31
5 Penyffordd Play Area 51 46 41 37
6 Hawarden Road Lay-by - - 48 37
7A Padeswood Sports
Ground - - 43 40
B Oak Tree Farm (West) 69 47 42 40
D Oak Tree Farm (East) 54 46 43 41
E Penyffordd Station Car
park 59 44 - -
*Measured at gate entrance
4.3 The main background noise was from local and distant road traffic with
occasional aircraft. The main intermittent noise was from occasional passing vehicles which temporarily increased the otherwise stable background level. The works was just audible at downwind measurement locations in lulls in traffic noise levels.
4.4 The 2017 measured LA90 levels in Table 2 were found to be similar to the historical measurements taken between 2007 and 2013. No significant change in the general background LA90 noise levels from the Cement Works has be seen between 2009 and 2017. As an example the data in Figures 3 and 4 show the noise levels at the receptor locations taken during the monthly monitoring during 2009. The fluctuation seen in noise levels between months is generally dependent on wind direction and the general level of background traffic noise in the area or local traffic and activities.
4.5 The Cement Works noise was modelled in 2009 to reflect the existing situation at receptor locations. Measurements were taken around the Cement Works and the major noise sources were used in the 2009 model. On the basis of the 2017 measurements this model was considered to represent the current situation and was used as the template for assessing any impact from the VRM and rail loading facility. Worst case scenarios have been compared.

P a g e 13
Figure 3: LA90 data from 2009 daytime levels
Figure 4: LA90 data from 2009 night time levels
0
10
20
30
40
50
60
70
1 2 3C 4 5 6 7A B D E
No
ise L
ev
el (d
B)
Monitoring Location
Daytime Boundary Noise Trend 2009 (LA90)
Jan Feb March April May June July Aug Sept Oct Nov Dec
0
10
20
30
40
50
60
1 2 3C 4 5 6 7A B D E
No
ise L
ev
el (d
B)
Monitoring Locations
Night Time Boundary Noise Trend 2009 (LA90)
Jan Feb Mar April May June July Aug Sept Oct Nov Dec

P a g e 14
Ketton Measurements
4.6 Hanson Cement’s Ketton Cement Works has a rail link into the site. The site was
visited on the 13th March 2017 and measurements of train movements and loading were monitored.
Table 3: Measurements taken from Ketton rail activity
Ketton measurement locations dB LAeq
Train stationary loading rear of loco@3m 76.5
Train moving position @3m 74
Train pass with load 88
Train pass empty 87
Train moving position in loading bay@30m 59
4.7 The noise levels from loading product were found to be low, the main source of
noise is from the locomotive engine in tick over during loading and when the train is moved to locate the carriage under the hopper.
Purfleet Measurements
4.8 Hanson Cement has an identical VRM in operation, of similar construction, at the
company’s Purfleet Works. This VRM is used to mill slag from the steel industry and is located in an industrial area close to the M25 Dartford Tunnel entrance. The Purfleet site was visited on 22nd February 2017. Noise levels were assessed inside building during operation. Measured internal noise levels around the mill building were found to be between 85 -95 dBA.

P a g e 15
Table 4: Measurements taken around Purfleet VRM
Purfleet measurements LAeq
loading silo 77.7
Roller shutter doors 1m outside 77
Air extraction 1m 90.1
Electrical air extraction @1m 81.8
Edge of road conveyor entrance side of building@ 10m 70.5
Outside small roller shutter door exit shoot @1m 78.6
Elevator side of building in compound 72.4
@ motor next to shutter door 91.7
Mill motor @1m 95
Ground floor hydraulics 91.4
Under roller mill@1m 94.3
Inside @ large roller shutters 89.2
Under roller of mill @1m 93.9
Ground level mill conveyor 89.1
Ground level mill conveyor 88.3
Gas burner 86.8
Middle levels stairs 86.8
Bag filter floor centre 82
Upper floor above mill 85.5
Upper floor conveyor 83.6
Conveyor in 84.6
Mill from conveyor in platform 86.8
1m from mill middle height 90.4
1m from louvers outside 78.4
Compressor room 81.8
Mill fan/motor room 81.6
Top of silos 73
Stack exit Platform @3m 70.7

P a g e 16
5.0 Noise Predictions 5.1 Predictions of the noise from the operation of the VRM have been carried out
using CadnaA noise modelling computer program based on ISO9613.
5.2 In order to provide an assessment of the worst case operational conditions, CadnaA model has been used to predict noise levels from the Cement Works with the VRM and mills 1, 2 and 3 being operational. All plant items have been assumed to operate 24 hours a day. It is understood that train movements will operate over an 8 hour period with four visits per week. The measured data from the Purfleet Works and Ketton Works has been utilised in the model.
5.3 The noise sources on the Cement Works were measured in 2009 and a CadnaA model was produced. The measured levels in 2017 confirmed that this model was still valid and represents the existing background noise level with the Cement Works operational at receptor locations. The output of this model has been used as the background noise level in this assessment. As the works operates continuously, so comparison with ‘site off L90 levels’, to assess the impact of the addition of the VRM are not thought appropriate. To provide a worst case comparison, the model outputs from the existing situation with cement mills 1, 2, 3 and 4 running were compared against the situation in which the VRM is operational together with mills 1, 2, and 3 running. An additional model with the works and VRM only was also modelled.
5.4 The modelled data and levels difference against operational background are provided in Table 15. Additional receptors have been added to the model to give facade levels at the rear of the properties on Padeswood Drive and are labelled as blocks 1–6. Padeswood Drive receptor points 1-6 represent the centre rear facade of each block of houses, location 1 being the closest to the entrance to the works and numbered sequentially.
5.5 The 2009 model used site measured levels to calculate sound power levels of sources at a known distance from the effective acoustic centre of a source. If uniform hemispherical spreading is assumed, then the sound power can be calculated. Difficulties arise in determining the location of the effective acoustic centre as measurements can be affected by background noise. These problems can be reduced by making measurements at several distances back from a source. This was done in this case. Sound power levels were determined by assuming hemispherical spreading and making assumptions about: background noise; effective extra distance to centre of source; and height of source. A prediction of the sound power was made for each measurement, and then the assumed values for background noise, effective extra distance to centre of source, and height of source were adjusted, within realistic limits, to minimise the variance between predictions.
5.6 All significant noise sources are represented in the CadnaA, data and was checked against measured data taken around the Cement Works where possible. For this type of plant, sources can be either point sources or area sources representing fans, stack exits, and walls/roofs of buildings containing plant. The local ground has been assumed to be non-absorbing, to represent a worst case. Topographic data has also been utilised in the model with the addition of the landfill mound. The latest site layout and building heights have been used within the model. Other buildings surrounding the site will potentially screen noise from the areas beyond and have also been added to the model. Their layout has been

P a g e 17
taken from up-to-date plans and plans provided by Hanson Cement. Their position and layout is indicated on the plots in Appendix 4.
5.7 ISO9613 recommends that directionality of vertical sources be taken into account. To represent a worst case, a 3dB directionality correction has been added to noise emissions from vertical area sources.
5.8 From the noise measurements taken at the Purfleet Works, a good estimate can be made of the likely internal reverberant noise levels in the new VRM buildings. The logarithmic sum of the noise levels measured from plant items within each building have been used to represent the worst case reverberant internal noise levels. Where external noise levels are known at 1m distances, virtual receptors have been used in the CadnaA model and the sound power of the facades adjusted to provide the appropriate external figure. An appropriate sound power figure has then been calculated with CadnaA that is necessary to generate this sound pressure level.
5.9 Estimates based on typical manufacturers’ attenuation data have been necessary for the external cladding to be used on the VRM buildings. The existing cladding on the VRM buildings is to be reused. The specification of the panel is 0.6mm PL40/250 but no Rw value for the panel was available. An estimation of the panel Rw value has been made. An example of a typical panel used in this type of construction is provided in Table 5.
5.10 The sound insulation of typical panels used to construct industrial buildings is available from the Kingspan guide. For the purposes of the model an Rw of 25dB has been assumed for the wall panels and roof panels on the mill buildings. It has been assumed that any doors, including roller shutter doors will have a sound reduction Rw of 20dB, and that the door will be kept closed when not in use. An area of 20m2 on the north facing facade of the VRM has been allocated as doorways.
5.11 Two elevated point sources have been used to represent extraction vents in the north and south facade, line sources have also been included for the conveyors. The silo tops also have had point sources added to represent any fans/motors.
Table 5: Information on sound attenuation of available wall and roof panels
Frequency Hz
Sound reduction index dB
KS1000 RW/80 + no lining
31.5 14
63 20
125 18
250 20
500 24
1000 20
2000 29
4000 39
8000 47
Rw 25

P a g e 18
6.0 Vehicle Movements 6.1 The traffic assessment for the development site indicates that overall there will be
a reduction in vehicle movements in 2018 on the access roads with the VRM in operation, 323 trips/day for the existing operations and 292 trips/day for the new development. This represents a 10% reduction. There will also be no significant change in the composition of the vehicles accessing the site which will continue to be mainly HGVs. The access routes and speed limits will continue to be the same. An increase or decrease of traffic flow by 25% equates to a 1dB(A) change in noise level. A 1dB(A) change is barely perceptible and as the expected change is well below 25% there will be no perceptible change in the noise level from the movement of HGV operations and no further assessment is required.
7.0 Train Movements 7.1 The information gathered at Hanson Cement’s Ketton Works during train loading
activities has been used in the model. The train has been entered as a slow moving line source over an eight hour loading period to represent the worst case loading visit.
8.0 Construction and Demolition Noise 8.1 The CadnaA noise model was used to assess the noise levels for the
construction and demolition activities. These were calculated using the methods and guidance in BS 5228-1:2009+A1:2014. This Standard provides methods for predicting receptor noise levels from construction works based on the number and type of construction plant and activities operating on site, with corrections to account for:
the ‘on-time’ of the plant, as a percentage of the assessment period;
distance from source to receptor;
acoustic screening by barriers, buildings or topography; and
ground type.
8.2 Source noise levels for each piece of plant equipment operating were used as the basis for the calculation and were derived from Annex C and D of BS 5228-1:2009+A1:2014.
The typical noise emissions, derived from BS 5228-1:2009+A1:2014 were used for the noise assessment and presented in Table 6 and Table 7. Plant percentage on-times have been assumed and presented as a worst case scenario in terms of the potential to generate noise.
The following assumptions were made:
general construction activities would take place between 08:00 and 19:00, Monday to Friday; and 08:00 to 13:00 Saturday
all ground was assumed to have an absorption factor of 0.6
a percentage ‘on-time’ for all plant was assumed
all noise sources were modelled as point sources

P a g e 19
8.3 The CadnaA propagation calculation methodologies take into account distance attenuation, barriers and ground absorption and the latter also takes into account air absorption, topographical screening effects from source to receptor. The model incorporated noise sources located in the proposed scheme area, and intervening ground cover and topographical information.
Table 6: List of demolition plant
Demolition Stage Plant / Activity BS5228
Reference Number
Noise
level
(dB
LAeq at
10m)
On-
time
(%)
General
Demolition
72t Giraffe C.4.39 1 77 70
Excavator C.2.2 3 77 70
Dump Truck C.2.26 3 79 50
Table 7: List of construction plant
Construction
Stage Plant / Activity
BS5228
Reference Number
Noise
level
(dB
LAeq at
10m)
On-
time
(%)
Excavation and
general
construction
Mobile Crane C.4.39 4 77 70
Cherry pickers C.4.54 4 79 50
Dump Truck visit C.2.26 1 79 10
Sky Jacks C.4.59 2 78 50
15 KvA
Generators C.4.28 2 65 100
8.4 The predicted construction noise levels were assessed against noise limits derived from advice within Annex E of BS 5228-1:2009+A1:2014. The Standard details the “ABC method”, which specifies a construction noise limit based on the existing ambient noise level.
Table 8, reproduced from BS 5228-1:2009+A1:2014, demonstrates the criteria for selection of a noise limit for a specific receptor location.

P a g e 20
Table 8: Construction Noise Threshold Levels Based on the ABC Method (BS5228)
Assessment category and threshold
value period (LAeq)
Threshold value, in decibels (dB)
Category
AA)
Category
BB)
Category
CC)
Evening and weekends D) 55 60 65
Daytime (07.00 – 19.00) and Saturdays
(07.00 - 13.00) 65 70 75
A) Category A: threshold values to use when ambient noise levels (when rounded to the
nearest 5 dB) are less than these values.
B) Category B: threshold values to use when ambient noise levels (when rounded to the
nearest 5 dB) are the same as category A values.
C) Category C: threshold values to use when ambient noise levels (when rounded to the
nearest 5 dB) are higher than category A values.
D) 19.00–23.00 weekdays, 13.00–23.00 Saturdays and 07.00–23.00 Sundays.
The closest residential receptors, or groups of residential receptors, to the proposed construction works were assessed. The results are shown below in Table 9.
Table 9: Construction Noise Receptor Locations and Derived Threshold Category
Receptor
Identifier Description
BS5228 Threshold Category
Daytime (dB Level)
7A Padeswood Drive A (65)
D Oak Tree Farm East A (65)
B Oak Tree Farm West A (65)
The criteria for assessing the significance of predicted noise impacts in relation to the above ABC construction noise thresholds, is detailed in Table 10.
Table 10: Daytime Construction Noise Significance Criteria (Residential)
Construction noise level (dB) Predicted
impact A 65dB threshold B 70dB
threshold
C 75dB
threshold
≤ 65 ≤70 ≤ 75 No Impact
66 – 68 71 – 73 76 – 78 Very low
69 – 71 74 – 76 79 – 81 Low
72 – 74 77 – 79 82 – 84 Medium
≥ 75 ≥ 80 ≥ 85 High

P a g e 21
8.5 The subsequent thresholds for varying degrees of impact are defined for each category; A, B or C. The thresholds for change between the significance levels were determined on the basis that the smallest perceptible change in environmental noise is typically 3dB, and that a change of 10dB typically relates to a subjective doubling or halving of the apparent loudness of a noise source.
8.6 The levels of construction-related HGV traffic are unlikely to be at levels where there will be a significant increase to noise levels. Over a 50 week construction period 6 HGV movements per day are expected. This will have little impact on noise levels from the works. Any potential noise generated by construction and HGV movements should be addressed and mitigated through the scheme Construction Environmental Management Plan (CEMP).
P a g e 22
9.0 Impact assessment
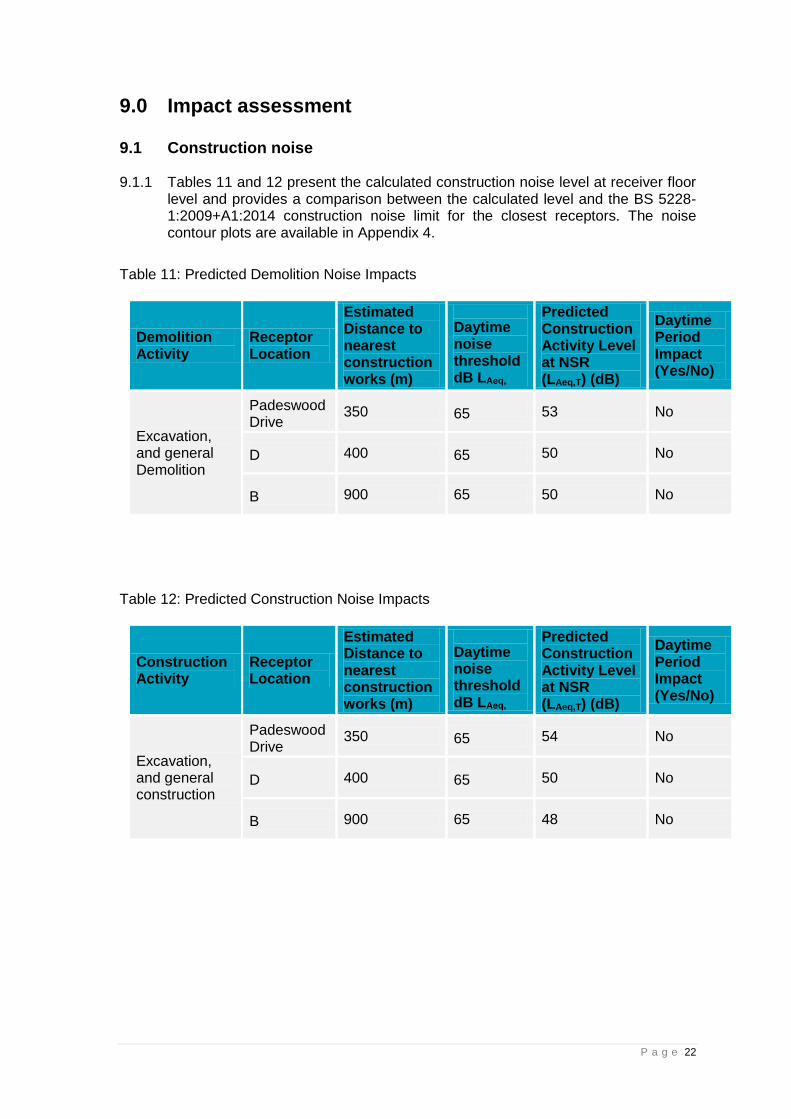
9.1 Construction noise 9.1.1 Tables 11 and 12 present the calculated construction noise level at receiver floor
level and provides a comparison between the calculated level and the BS 5228-1:2009+A1:2014 construction noise limit for the closest receptors. The noise contour plots are available in Appendix 4.
Table 11: Predicted Demolition Noise Impacts
Demolition Activity
Receptor Location
Estimated Distance to nearest construction works (m)
Daytime noise threshold dB LAeq,
Predicted Construction Activity Level at NSR (LAeq,T) (dB)
Daytime Period Impact (Yes/No)
Excavation, and general Demolition
Padeswood Drive
350 65 53 No
D 400 65 50 No
B 900 65 50 No
Table 12: Predicted Construction Noise Impacts
Construction Activity
Receptor Location
Estimated Distance to nearest construction works (m)
Daytime noise threshold dB LAeq,
Predicted Construction Activity Level at NSR (LAeq,T) (dB)
Daytime Period Impact (Yes/No)
Excavation, and general construction
Padeswood Drive
350 65 54 No
D 400 65 50 No
B 900 65 48 No

P a g e 23
9.2 BS 4142:2014
9.2.1 In relation to BS 4142:2014 the predicted noise from the VRM has been assessed against general production background noise levels. The proposed development site is considered and our opinion on noise character is provided below:
For the background noise level in this assessment, the existing noise level with the Cement Works operational has been used as the Cement Works operates continuously. The background level has been taken from a model that represents the worst case existing situation with the Cement Works in production and cement mills 1, 2, 3 and 4 operational. This allows the assessment to compare the existing situation and any increase in noise level from the addition of the VRM to the model at each receiver location.
In terms of tonality, the plant that is likely to contain this type of characteristic would be the large fans inside the VRM building. These sources are located inside the building so any external impact of any tones will be limited - it is also noted that no significant tones were observed during the measurements at the similar VRM at the Purfleet Works. Any ventilation fans for cooling electrical switch rooms or venting from the VRM buildings also have potential to be tonal in nature. As cement mills 1, 2 and 4 will be mothballed three potential sources with tonal characteristics will be removed so the impact from the general tonal output from the works will be reduced. Taking into account the location of the VRM and the impact from other operational areas on the Cement Works, the resultant noise contribution from tonal noise sources from the VRM and Cement works, relative to the background noise level, would be expected to be audible at the nearest receptor. A tonal penalty correction should be applied in this case.
The changes in to BS4142 in 2014 allow a variable tonal penalty to be used depending on the relative impact of the works to the receptor. Tonal penalty values of between +2dB and +6dB can be applied depending on the relative impact. In this case a +4dB tonal penalty correction has been applied to the closest receptors and +2dB penalty to distant receptors. The lower penalties reflect the reduction in tonal sources due to the relative distance from the Cement Works/mills.
In terms of impulsivity characteristics the VRM when operational has low level impulsivity and generally constant sound level. Any impulsivity would relate to occasional vehicle movements external to the building. Taking into consideration the operational noise contribution at the nearest receptors, measured site boundary LAmax levels and residual noise from road traffic during daytime and night periods we would expect this characteristic to be occasionally just perceptible and not discernible over road traffic in the area so no penalty has been applied.
In terms of intermittency the only likely intermittent activity on site is likely to be external offloading and loading, mobile plant and HGV movements. Taking into account the predicted noise contribution relative to the residual noise levels we would anticipate that the intermittency is unlikely to be distinctive at nearest sensitive receptors due to measured ambient noise levels compared with noise contribution so no additional penalty has been applied.

P a g e 24
9.2.2 In conclusion, a tonal penalty of +4dB has been added to the calculated operational VRM noise contribution for receptor locations 7A, D, B and Padeswood Drive. A tonal penalty of +2dB has been applied to all other receptor locations.
9.2.3 In Table 13 the noise levels from the existing situation and the predicted impact of the addition of the VRM are presented. The tonal penalty was added to the VRM predicted values and the difference between the calculated rating level and the existing situation gives the assessment level. The higher the difference between the two values the greater indication of adverse impact.
9.2.4 BS 4142:2014 describes methods for rating and assessing sound of an industrial and/or commercial nature in terms of adverse impact on a noise sensitive receptor. According to BS 4142:2014:
“A difference of around +10 dB or more is likely to be an indication of a significant adverse impact, depending on the context.”
“A difference of around +5 dB is likely to be an indication of an adverse impact, depending on the context.”
“The lower the rating level is relative to the measured background sound level, the less likely it is that the specific sound source will have an adverse impact. Where the rating level does not exceed the background sound level, this is an indication of the specific source having a low impact, depending on the context.
Table 13: Predicted levels with VRM in place when compared to the existing situation.
Receiver location
Existing Background (Works
in Production + cement mills1,2,3,4
operational)
(dBA)
VRM (Production + cement mill
1,2,3 and VRM
operational) (dBA)
Tonal penalty applied (dBA)
Calculated rating level (tonal penalty applied to VRM)
(dBA)
BS4142 assessment level
(Existing background - rating level)
(dBA)
1 36 36 2 38 +2
2 47 47 2 49 +2
3c 46 46 2 48 +2
4 41 41 2 43 +2
5 44 42 2 44 0
6 34 35 2 37 +3
7A 46 46 4 50 +4
B 45 46 4 50 +5
D 43 44 4 48 +5
E 39 37 2 39 0
Padeswood Drive 5 44 45 4 49 +5

P a g e 25
9.2.5 Padeswood Drive receptor points 1-6 represent the centre rear facade of each
block of houses, location 1 being the closest to the entrance to the works and numbered sequentially. Padeswood Drive location 5 was chosen as this point showed the highest level difference of 0.9dB. The level difference information can be found in Table 15.
9.2.6 Table 13 indicates that the calculated noise levels from the addition of the VRM
have little impact at the receptor locations. Noise levels have increased by <1dBA at receptor locations 6, B, D and Padeswood Drive. Some locations have reduced by 2dBA due to the removal of cement mill 4 as a noise source when the VRM is running. The assessment levels after the tonal penalty is applied are considered to be lower than the level of potential “adverse impact”, with guidance of BS 4142 and considering the context of the assessment no discernible difference in noise level will be observed with the VRM in place compared to the existing situation.
9.3 TAN 11
9.3.1 In relation to the VRM operational noise predictions, TAN11 requires the daytime and night time noise exposures to be evaluated (mixed sources category) to be below 55 dB LAeq16hr for day noise levels and 45dB LAeq 8hr night levels have to be considered for residential planning.
Table 14: TAN11 assessment
Position Predicted levels with VRM in
place LAeq(16 hour) (dB) TAN11 Category
1 36 A
2 47 B
3c 46 B
4 41 A
5 42 A
6 35 A
7A 46 B
B 46 B
D 44 A
E 37 A
Padeswood Drive 5 45 B
9.3.2 Table 14 demonstrates that the receptor locations will fall within TAN11 category
A and B during night periods. Category B meaning noise should be taken into account when determining residential planning applications and category A meaning noise may need not be considered as a determining factor in granting residential planning permission. No existing developments would be affected in the vicinity of the works.
P a g e 26
9.4 External noise climate
9.4.1 Outdoor recreation areas – private and communal garden areas: The propagated noise associated with the operational facility within the private and communal garden areas at all the receptor locations will achieve the lower limit of 50dBA LAeq as recommended by the WHO for external amenity spaces.
9.5 Uncertainty
9.5.1 Where possible, uncertainty in this assessment has been minimised. Uncertainty in the calculated impact has been reduced by the use of a calculation method in accordance with ISO 9613-2:1996.
10.0 Mitigation
10.1 No mitigation is required as the addition of the VRM has little impact on the noise levels at the measured receptor locations. Other, more dominant, noise sources on the Cement Works that affect the receptor locations, such as elevated noise sources and extraction fans on buildings that face receptor locations, should continue to be investigated, as part of the routine site noise monitoring and acoustic camera assessments, to identify opportunities for continuous improvement of the noise environment at the Cement Works.

P a g e 27
11.0 Summary 11.1 An assessment has been carried out of the potential noise impact from the
proposed new VRM (Mill 5) at Hanson Cement’s Padeswood Cement Works. 11.2 Measurements of the existing noise levels were measured at the historic planning
and PPC receptor locations and were carried out during February and March 2017. The levels were then compared with historic data. The levels measured were within the variance of the historic data from 2007 - 2013; noise levels from the works have not changed significantly at these receptor locations.
11.3 Predictions of noise emitted from the Cement Works was modelled in 2009. This
model remains representative of the existing noise levels from the works and gives similar output levels to the measured levels taken in 2017. The new VRM, additional buildings, conveyors and rail line have been added to this model and comparisons between the existing situation and the addition of the VRM have been made.
11.4 Typical sound insulation specifications for the VRM and buildings were used
within the model. Wall panels and roof panels with an Rw of 25dB were used and an Rw of 20dB for doorways on the north facade of the main mill building. Point sources were added on the VRM building facades and on the silo tops to represent fans and motors. Line sources were used to represent conveyors and rail lines.
11.5 The BS4142 assessment, based on the comparison between noise predictions,
with the existing situation and the addition of the VRM indicates that there will be little impact on nearby residential properties as the increase in noise level from the introduction of the new mill will be less than 1dB at all the receptor positions. Although the noise levels have not increased significantly or at all at some receptors, the Cement Works and VRM has the potential to have tonal sources which may be audible at receptor positions. The mothballing of mills 1, 2 and 4 will reduce the total number of tonal sources from the works, but as the VRM may have audible tonal sources a penalty should still apply. The predicted noise levels with the VRM in place have had a penalty applied, 4dB penalty for the closest receptors to the mill and 2dB for distant receptors. After the penalty has been applied the difference between the existing situation and the proposed VRM gives rating values of +5, +4 and +2dB. The threshold of +5dB is where it is likely to be an indication of an adverse impact. The output of this assessment represents little change to the existing situation. It is thought unlikely that the small increase in dB level at some receptors, and any tonal characteristics from the VRM will be discernible from the existing situation.
11.6 Table 15 provides a comparison of the worst case scenarios between the outputs
of the two models .This shows little impact on receptors in terms of dB noise level increase, some receptors have shown a decrease in noise level. The majority of the noise from the new VRM is contained within the boundary of the Cement Works. The highest predicted facade noise levels where an increase is seen with the VRM in place is 45.8dBA at the rear of Padeswood Drive 1. The existing situation with mills 1, 2, 3, and 4 running gives a similar noise level of 45.7dBA. Receptor location Padeswood Drive 5 showed the highest increase of 0.9dBA. The assessment model output levels at receptor locations can be found in Table 15 for comparison. Table 16 shows the receptor levels when only the VRM is operational for comparison.

P a g e 28
11.7 The propagated noise associated with the operational facility within the private
and communal garden areas at all the receptor locations will achieve the lower limit of 50dBA as recommended by the WHO for external amenity spaces. The recommended facade level of 45dBA to achieve the 30dBA in bedrooms assuming 15 dB reductions from an open window based on the guidance in BS8233 and WHO guidance, is not met at several locations by a small margin. This is not a consequence of the addition of the VRM as existing noise levels are above 45dB.
11.8 The 10% decrease in HGV traffic accessing the works is not significant in regards
to noise impact. The decrease would give rise to an imperceptible drop in the LAeq,16hr and LAeq,8hr levels when compared to the current site situation.
11.9 Construction and demolition phase noise levels were below the noise threshold
category A levels at the closest receptor locations. Table 15: Comparison of assessment model run output levels - worst case example of all available mills running for each scenario
Padeswood Drive receptor points 1-6 represent the centre rear facade of each block of houses, location 1 being the closest to the entrance to the works and numbered sequentially.
Receptor
IDLocation
Existing Background
(Production + cement
mills1,2,3,4 operational)
(dBA)
Existing Background+ VRM
(Production + cement mill
1,2,3 and VRM operational)
(dBA)
Level
difference
(dBA)
X
Coordinates
(m)
Y
Coordinates
(m)
1 Spon Green 35.8 36.0 0.2 328545 363299
2 Ty Gwyn 46.6 46.5 -0.1 328319 362372
3C Dyke Farm 46.1 46.0 -0.1 328489 361832
4 Toll Bar Cottage 40.9 40.5 -0.4 328563 361184
5 Penyffordd Play area 43.8 41.9 -1.9 329734 361442
6 Hawarden Road 34.4 34.8 0.4 330305 362434
7A Sports Ground 45.9 46.3 0.4 329216 362582
B Oak Tree Farm West 45.3 45.5 0.2 328629 362499
D Oak Tree Farm East 43.1 43.5 0.4 329675 362352
E Penyffordd Station 39.1 37.3 -1.8 329555 361097
Padeswood Drive garden 45.4 45.7 0.3 329199 362593
Padeswood Drive 1 45.7 45.8 0.1 329184 362638
Padewsood Drive 2 45.2 45.5 0.3 329216 362648
Padeswood Drive 3 44.0 44.4 0.4 329256 362661
Padeswood Drive 4 44.6 45.0 0.4 329286 362673
Padeswood Drive 5 43.6 44.5 0.9 329316 362681
Padeswood Drive 6 43.6 44.0 0.4 329346 362691
Oak Tree Farm East Facard 38.6 37.4 -1.2 329711 362293
Ash Tree Farm Facard 39.0 39.4 0.4 329781 362664

P a g e 29
Table 16: Comparison of model output levels between existing background with mills 1-4 running and VRM
11.10 The noise assessment has used the worst case situations with all available
cement mills operational to assess the noise impact at receptors. This scenario with all mills running simultaneously is unlikely during normal operations. The VRM is likely to be the only mill in operation for the majority of the time. The noise levels expected at receptor locations with the VRM only have been provided in Table 16.The noise levels are lower at all the receptors than the predicted worst case scenario and at some receptors a significant reduction in noise levels is seen due to the removal of the noise sources from cement mills 1 to 4.
Receptor
IDLocation
Existing Background
(Production + cement
mills1,2,3,4 operational)
(dBA)
Existing
background +
VRM only all other
mills off(dBA)
Level difference
(dBA)
X
Coordinates
(m)
Y
Coordinates
(m)
1 Spon Green 35.8 35.9 0.1 328545 363299
2 Ty Gwyn 46.6 40.2 -6.4 328319 362372
3C Dyke Farm 46.1 45.2 -0.9 328489 361832
4 Toll Bar Cottage 40.9 37.5 -3.4 328563 361184
5 Penyffordd Play area 43.8 38.9 -4.9 329734 361442
6 Hawarden Road 34.4 34.6 0.2 330305 362434
7A Sports Ground 45.9 46.2 0.3 329216 362582
B Oak Tree Farm West 45.3 44.7 -0.6 328629 362499
D Oak Tree Farm East 43.1 43.3 0.2 329675 362352
E Penyffordd Station 39.1 34.5 -4.6 329555 361097
Padeswood Drive garden 45.4 45.6 0.2 329199 362593
Padeswood Drive 1 45.7 45.7 0.0 329184 362638
Padewsood Drive 2 45.2 45.4 0.2 329216 362648
Padeswood Drive 3 44.0 44.3 0.3 329256 362661
Padeswood Drive 4 44.6 44.9 0.3 329286 362673
Padeswood Drive 5 43.6 44.4 0.8 329316 362681
Padeswood Drive 6 43.6 43.9 0.3 329346 362691
Oak Tree Farm East Facard 38.6 36.9 -1.7 329711 362293
Ash Tree Farm Facard 39.0 39.3 0.3 329781 362664

P a g e 30
Appendix 1 Acoustic terminology 1. Sound Pressure Level (Lp) The basic unit of sound measurement is the sound pressure level, based on
pressure measurement. As the pressures to which the human ear responds can range from 20 mPa to 200 Pa, a linear measurement of sound levels would involve very large numbers. To avoid this, the pressures are converted to a logarithmic scale and expressed in decibels (dB) as follows:
Lp = 20 log (p/p0) where Lp = sound pressure level in dB; p = rms sound pressure level; and p0 =
reference sound pressure (20 mPa). 2. Sound Level (LpA) Sound level is the value measured with a sound level meter which incorporates
frequency weighting networks. These attenuate the signal at some frequencies and amplify it at others. Sound levels measured with the A-weighting network are expressed in dB(A). The A-weighting network approximately corresponds to the frequency response of the human ear.
3. Sound Power Level (LW) The sound power level of a source is an absolute measure of the sound output,
but it cannot be measured directly. It is usually calculated from a sound pressure level and the distance from the source at which that sound pressure level is measured. For sound radiating uniformly and hemispherically from a point source on a flat reflecting surface, the equation is:
LW = Lp + 20 log r + 8
where LW = sound power level in dB re 10-12 W; and Lp = sound pressure level in
dB re 20 mPa at a distance r metres from the source. 4. Equivalent Continuous Sound Level (LAeq) Sound levels invariably fluctuate. A summation can be made of the sound energy
in the fluctuating sound and a steady level of the same total energy calculated. This steady level is termed the equivalent continuous sound level. LAeq can be determined over any time period, which is indicated as LAeq,T where T is the time period (e.g.LAeq,1 hour, LAeq,12 hour, etc.).
In mathematical terms, LAeq is given by:
LT
p t
pdtAeq
A
t
t T
101
0
2
0
log( )
where LAeq = equivalent continuous sound level in dB over a time period T; pA(t) =
instantaneous sound pressure in Pa varying with time t; and p0 = reference sound pressure (20 mPa).

P a g e 31
5. Background Noise (LA90,T) Background noise is the measured noise level exceeded for 90% of the time over
the specified period T. It is the basic noise level in a locality and does not include the effects of short duration noise.
6. Ambient Noise (LAeq,T) Ambient noise is a measure of the average noise level over the specified time
period T and include contributions of all noise sources. 7. Maximum Noise (LAmax) This is the highest A-weighted sound pressure level recorded by the sound level
meter during the measurement period. 8. Level Exceeded for 10% of the Time (LA10,T) This is a measure of the higher noise levels to which a locality is exposed during
time T. The noise produced from road traffic is generally expressed in terms of LA10,18 hour.
9. Sound Exposure Level (SEL or LAE) This is the energy produced by a discrete noise event averaged over one second
no matter how long the event actually took. This allows for comparisons to be made between different noise events which occur for different lengths of time.
In mathematical terms, LAE is given by:
LT
p t
pdtAE
A
t
t T
101
0 0
2
0
log( )
where LAE = sound exposure level in dB; PA(t) = instantaneous sound pressure in Pa varying with time t; T = time interval long enough to encompass all significant sound energy PO = reference sound pressure (20 µPa); TO = reference duration (1 second). The equivalent continuous A-weighted sound pressure level can be calculated for
a series of events over a given time period as follows: LAeq,T = LAE + 10 log N - 10 log T where N = number of events during time T; T = time period in second.

P a g e 32
Appendix 2 Equipment used Sound Level Meter: Bruel & Kjaer Hand Held Analyzer Type 2250 Conforms to: IEC 60651 (1979) Type 1 IEC 60804 (2000) Type 1 IEC 61260 (1995) Octave & ⅓ Octave Bands Serial no. 2590535 UKAS Calibration Date: Oct 2016 UKAS Calibration Due: Oct 2018 Calibrator: Bruel & Kjaer 4231 Conforms to: IEC 942 (1988) Class 1 Serial No.: 2518040 UKAS Calibration Date: Oct 2016 UKAS Calibration Due: Oct 2017

P a g e 33
Appendix 3 Model input data Traffic and Train data
Point sources Result. PWL Coordinates
X Y
(dBA) (m) (m)
Fan top pre heater tower 104.8 329048.22 362063.52
ID Fan 99.2 329036.25 362067.08
Bag Filter Plant top cement mill 3 91.5 329207.59 362180.16
Heat Exchanger Cooler Fan 2 104.2 329131.16 362053.09
Heat Exchanger Cooler Fan 3 104.2 329131.15 362053.06
heat exchanger cooler fan 1 104.2 329131.17 362053.11
clinker tower fan outlet 104.2 329250.48 362156.95
Kiln Seal Fan 105 329112.42 362048.45
Bag Filter Plant 95.5 329051.95 362038.8
Mill 3 stack 88 329214.03 362179.22
Raw Mill Silo ground level Fan 93.9 329000.14 362145.65
Raw Mill Silo Elevator drives 89.4 329027.63 362135.83
Heat Exchanger ground floor fan 90.4 329136.88 362073.6
Kiln Drive Gear 102.2 329077.78 362054.22
Vibration plate 103.1 329001.04 362144.81
Raw Mill Fan FN31 87.9 329022.05 362137.42
Bypass Blower screw drive 93 329053.5 362108.49
VRM 5 stack exit 73.8 329200.17 362295.19
VRM5 fan 91.8 329221.48 362308.08
VRM5 fan 91.8 329206.5 362290.69
VRM5 fan 91.8 329162.09 362287.61
VRM5 fan 91.8 329158.98 362279
VRM5 fan 91.8 329172.47 362284.42
VRM5 fan 91.8 329170.88 362274.64
VRM5 fan 91.8 329183.05 362267.1
mill 1stack 73.8 329193.04 362192.41
mill 2stack 73.8 329177.15 362198.57
mill 4stack 73.8 329239.03 362180.95
Annual Daily Annual Daily Annual Daily
Total raw material movements 45183 162 59268 213 59268 213
TotalProduct movements 21898 84 28892 111 20369 78
Train movements 175
Total movements 67081 246 88160 324 79812 291
2018 without mill 5 2018 with mill 52016 actual
Reduction in daily rd movements 33
Reduction in annual road movements 8523
Additional Annual Rail movenents 175

P a g e 34
Vertical area source Result. PWL
(dBA)
Cement Mill 1-3 bldg 113.6
Cement Mill 4 Bldg 111.6
Raw mill bldg outside 110.3
Coal Mill bldg outside 92.5
Limestone Intake 87.1
Raw Mill Fan cladding 97.3
Packing bay fan new 107.7
Mill 3 door 113.5
Acoustic louvres 102.8
Silo 6 filter fan 104
Mill4 104
Bag Filter Plant 113.4
VRM mill 5 building 92.6
VRM mill 5 building 93
VRM mill 5 building 92.6
VRM mill 5 building 81.9
VRM mill 5 building 84
VRM mill 5 building 77
VRM mill 5 building 78.1
VRM mill 5 building 77
VRM doorways 83
train loading silo building 70.3
train loading silo building 64.8
train loading silo building 64.7
train loading silo building 70.7
train loading silo building 68.3
train loading silo building 66.2
train loading silo building 62.2
bucket elevator silo 6 62.6
bucket elevator silo 6 62
bucket elevator silo 6 62.1
cm4 storage 61.3
bucket elevator silo 6 60.4
cm4 storage 64
cm4 storage 66.2

P a g e 35
Line source Result. PWL
(dBA)
Kiln 4 drive 110.6
VRM conveyor 81.6
VRM conveyor 83.6
VRM conveyor 84.5
VRM conveyor 82.6
train line 94.6
VRM conveyor 83.5
Area sources Result. PWL
(dBA)
mill 5 84.2
mill 5 81.3
mill 5 79.2
train loading silo 67.9
bucket elevator 50.8
cm4 storage 59.4

P a g e 36
Appendix 4 CadnaA Predicted Noise Level Contour Plots
Construction

P a g e 37
Demolition

P a g e 38
Existing situation with mills 1-4 running
P a g e 39
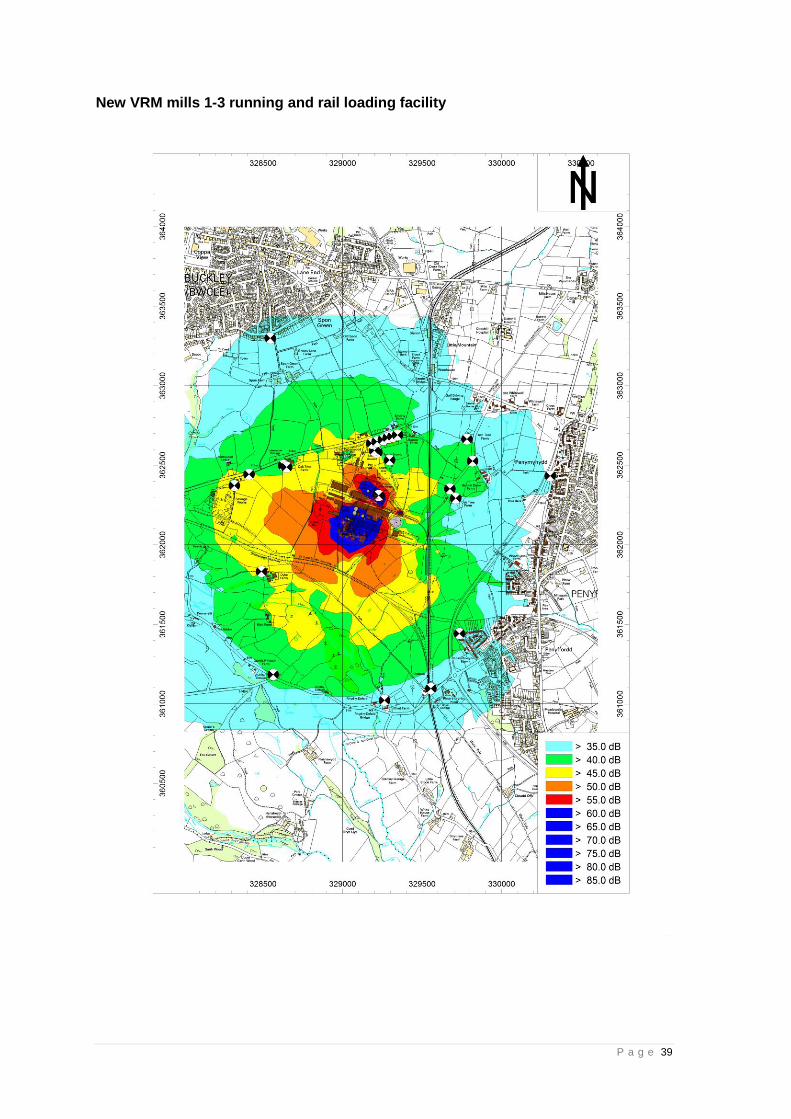
New VRM mills 1-3 running and rail loading facility

P a g e 40
New VRM only and rail loading facility