haozhe wang gis 2 final paper
TRANSCRIPT
1
Mapping the buildings in Manhattan Storm Surged Area and identify the
most impacted building in the Surged Area Haozhe Wang (William)
Center for Urban Science and Progress
New York University
Introduction
After Hurricane Sandy swiped the east coast of United States, many states suffered severe
financial lost. Estimated 60 million people were affected by the hurricane. Economists say as
high as 100 billion lost might be caused by the storm (NPR News, 2012). Yet, what matters more
is people’s life disturbed by the cyclone. According to NOAA (Blake, Eric, 2013), the highest
storm surge hit 11.4 ft. near Battery Bark in lower Manhattan. What does that mean to us? The
damage was caused through loss of lives, water damages, and power loss. Last semester, I
examined the impact of Hurricane Sandy on Manhattan residents. For this project, the buildings
in Manhattan will be examined, and the result will be
presented on maps and in 3-D views. Two tools,
ArcMap and ArcGlobe, were used to implement the
study. ArcMap allows information to be presented in
a 2-D fashion, and ArcGlobe is an adequate tool to
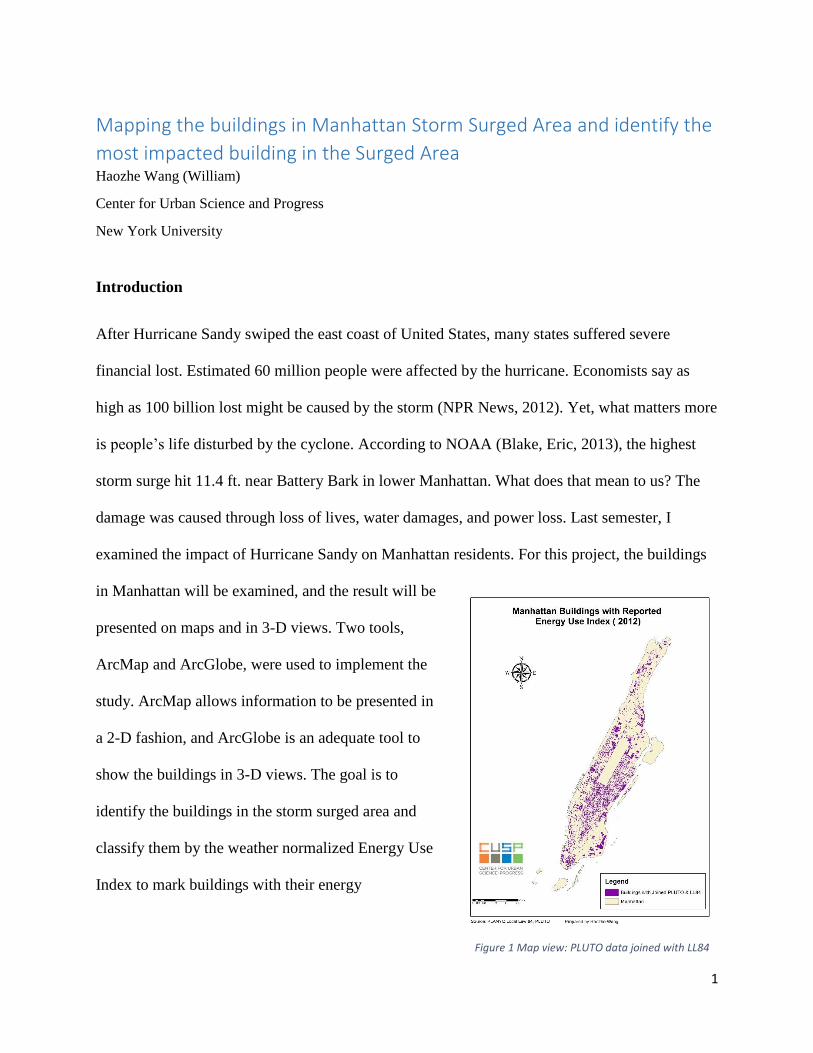
show the buildings in 3-D views. The goal is to
identify the buildings in the storm surged area and
classify them by the weather normalized Energy Use
Index to mark buildings with their energy
Figure 1 Map view: PLUTO data joined with LL84

2
consumption. In the final maps, buildings with high energy consumption will be in darker color,
which also indicate that they suffer more from power loss because their operations relied heavily
on electricity before Hurricane Sandy.
To conduct the idea of calculating the affected buildings in Manhattan, several files are
needed: the storm surge area shape file (due to the availability of reliable data, the relative sea
level rise and coast erosion are ignored here), PLUTO data, Manhattan borough shape file
(another name to look for is New York County, most government released documents take this
name as the officially recognized name), and Local Law 84 Disclosure (LL84) data. LL84 data
contains many attributes of building energy consumption information. PLUTO data included all
the buildings in each lot in five boroughs of New York City. By linking the two sets of data, we
can portray the city with building energy usage. Unfortunately, Local Law 84 only regulates
private buildings; therefore, we will not be able to have every New York City building’s energy
usage data for this study.
Methodology
The key of this study is to join the PLUTO
data and LL84 data by “BBL”. PLUTO data and
shapefile can be found on NYC Department of
City Planning website. Inner join based on LL84
data will allow us to keep all the matching records.
Be cautious that the headers of LL84 file need to
be modified according to ArcGIS’s requirement.
The original file has special formatting and
Figure 2 Joined data

3
special characters. All of them need to be
removed in order to perform the inner join.
Once, joined, ArcMap will generate new
names for each field using the file name
and column number. It is recommended to
change the alias in order to distinguish each
building characteristics in ArcMap attribute
table. In this study, the weather normalized
EUI was changed to “My_LL84_7” in the
exported joined file. The second ‘trick’ of
this study is about properly selecting the
buildings sitting in the storm surged area.
The principle is selecting all the buildings that intersect with the storm surged area. Using ‘Select
by Location’, the buildings impacted in Manhattan during Hurricane Sandy can be exported to a
separate file. A total 4,620 records matching records were exported from PLUTO and LL84 data.
The second part of the study is to present building energy use in three dimensions. The
work is done in ArcGlobe using the floor number from PLUTO data. The calculation of the
building height is as follow:
𝐻𝑒𝑖𝑔ℎ𝑡(𝑓𝑒𝑒𝑡) = (𝑁𝑢𝑚𝑏𝑒𝑟 𝑜𝑓 𝐹𝑙𝑜𝑜𝑟𝑠 − 1) ∗ 10𝑓𝑒𝑒𝑡 + 15𝑓𝑒𝑒𝑡
Results
Figure 3 LL84 buildings in Surged Area
4
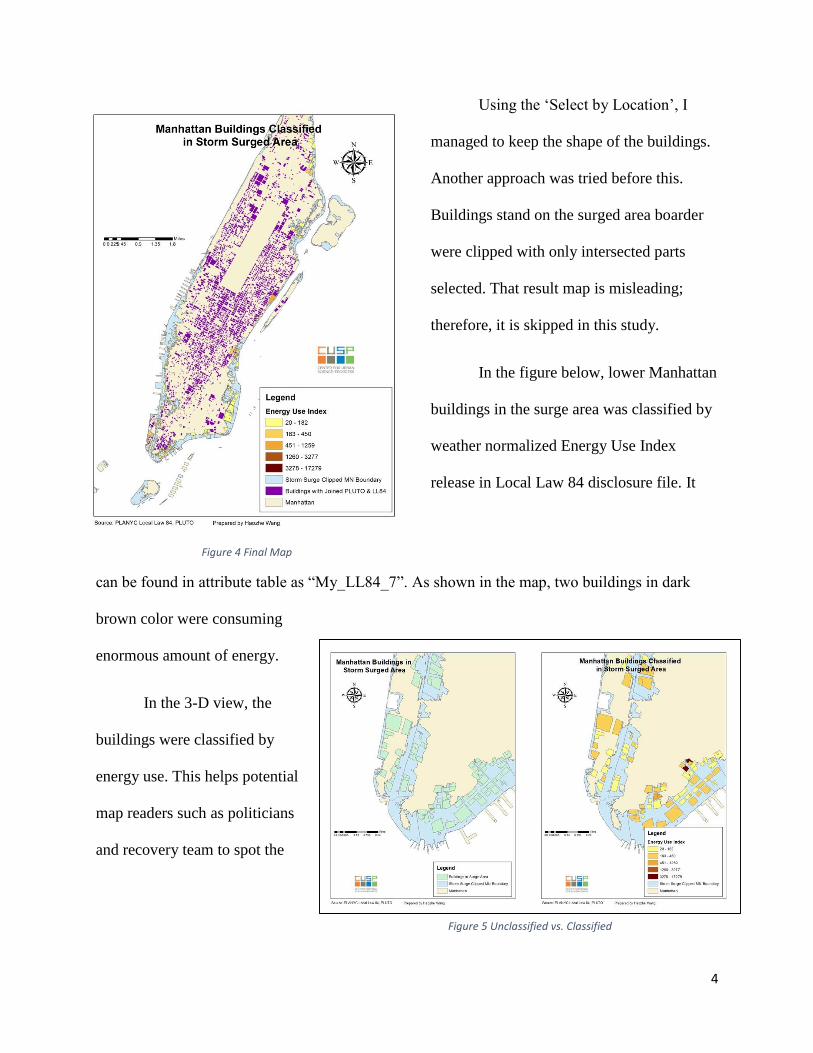
Using the ‘Select by Location’, I
managed to keep the shape of the buildings.
Another approach was tried before this.
Buildings stand on the surged area boarder
were clipped with only intersected parts
selected. That result map is misleading;
therefore, it is skipped in this study.
In the figure below, lower Manhattan
buildings in the surge area was classified by
weather normalized Energy Use Index
release in Local Law 84 disclosure file. It
can be found in attribute table as “My_LL84_7”. As shown in the map, two buildings in dark
brown color were consuming
enormous amount of energy.
In the 3-D view, the
buildings were classified by
energy use. This helps potential
map readers such as politicians
and recovery team to spot the
Figure 4 Final Map
Figure 5 Unclassified vs. Classified
5
heavy energy users in a region.
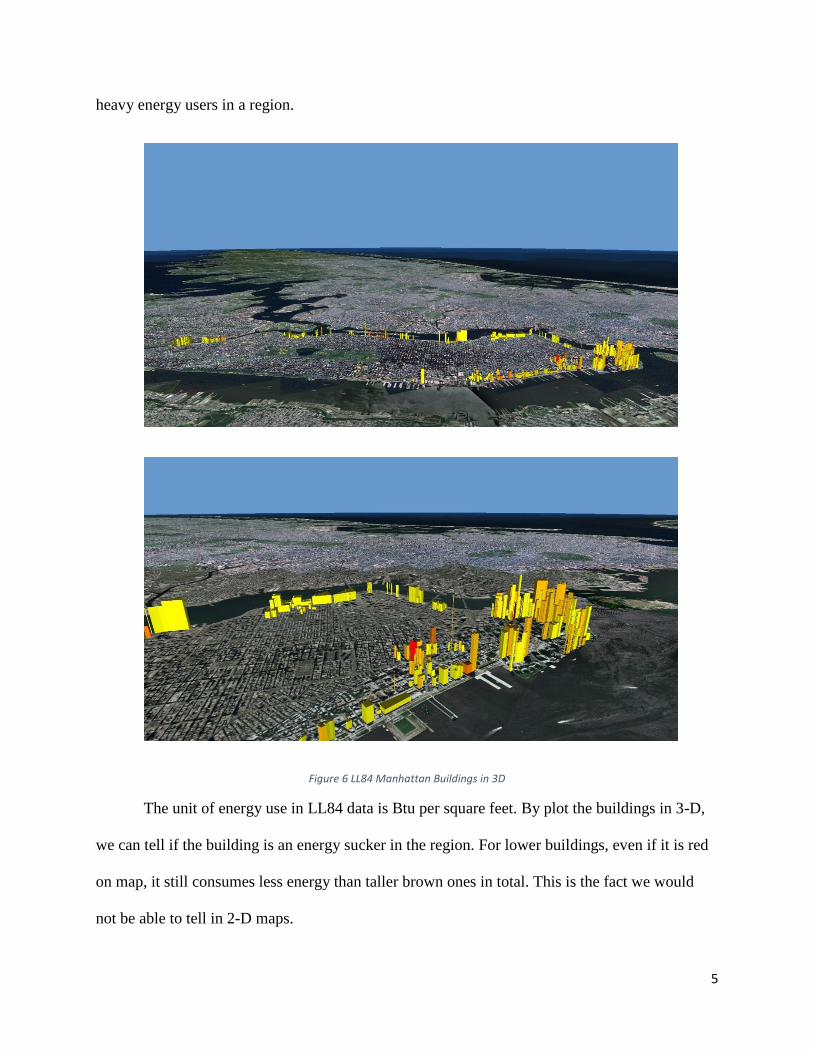
Figure 6 LL84 Manhattan Buildings in 3D
The unit of energy use in LL84 data is Btu per square feet. By plot the buildings in 3-D,
we can tell if the building is an energy sucker in the region. For lower buildings, even if it is red
on map, it still consumes less energy than taller brown ones in total. This is the fact we would
not be able to tell in 2-D maps.
6
Conclusion
There are 276 buildings lying in the surged area on this map. The true amount is
definitely higher with all the publically owned buildings included. Yet, with the current available
data, we still get a decent presentation of the Sandy impact on buildings in Manhattan. Near the
Battery Park, many buildings were impacted according to the map and 3-D generated from this
study. Battery Park City area was the only part of Manhattan that had large amount of buildings
suffering water damage. Other area do not show such concentrated buildings in the surged area.
We can use this information to help the relevant stakeholders to make data supported decisions.
Recommendation
For storm surge area building selection, optimization can be done by setting the selection
scales. By allowing only the buildings with more than 50% of body lying in the surge area, the
building list can be narrowed down to a more accurate level.
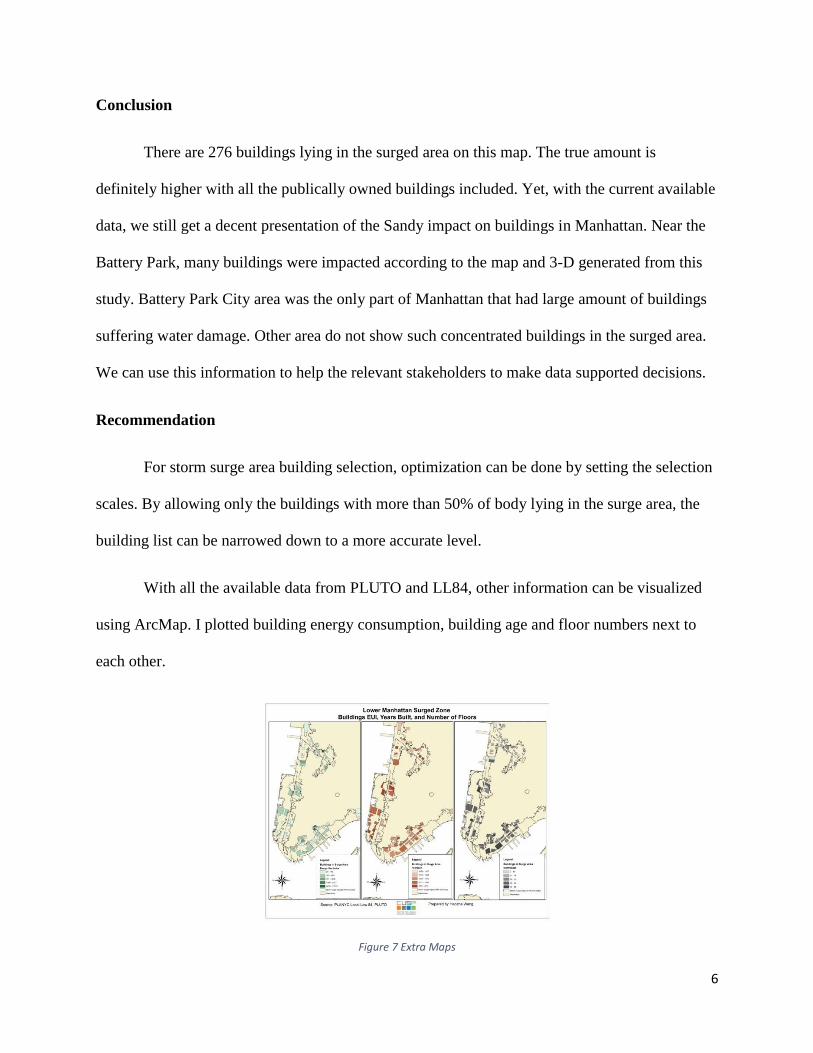
With all the available data from PLUTO and LL84, other information can be visualized
using ArcMap. I plotted building energy consumption, building age and floor numbers next to
each other.
Figure 7 Extra Maps
7
Reference
1. Blake, Eric, and Todd B. Kinberlain. "Tropical Cyclone Report: Hurricane
Sandy." Http://www.nhc.noaa.gov/data/tcr/AL182012_Sandy.pdf. N.p., 12 Feb. 2013.
Web. 28 Oct. 2013. <http://www.nhc.noaa.gov/data/tcr/AL182012_Sandy.pdf>.
2. Couch, Stepehn, Ellen K. Hartig, and Vivien Gornitz. "Impacts of Sea Level Rise in the
New York City Metropolitan Area." ScienceDirect - Home. Elsevier, 2 May 2001. Web.
28 Oct. 2013.