hard shoulder abuse final report - trl shoulder abuse final report.pdf · at m6 j8-9 northbound the...
TRANSCRIPT
Managed Motorway Compliance Support Hard Shoulder Abuse Final Report
December 2012

Managed Motorways Compliance Support Hard Shoulder Abuse Final Report
Atkins Hard Shoulder Abuse Final Report | Version 1.0 | December 2012 P a g e | 2
Notice
This document and its contents have been prepared and are intended solely for the Highways Agency’s information and use in relation to Managed Motorways Compliance Support.
Atkins assumes no responsibility to any other party in respect of or arising out of or in connection with this document and/or its contents.
This document has 71 pages including the cover.
Document history
Job number: 5113534 Document ref: Hard Shoulder Abuse Final Report
Revision Purpose description Originated Checked Reviewed Authorised Date
Rev 1.0 Client J Castle JP Doherty P Whitfield P Whitfield 4/12/12
Client Details
Client Highways Agency (Paul Marshall)
Project Managed Motorway Compliance Support: Hard Shoulder Abuse
Framework Task 012
Document title Hard Shoulder Abuse Final Report
Job no. 5113534
Copy no. Issued electronically only
Document reference
Hard Shoulder Abuse Final Report

Managed Motorways Compliance Support Hard Shoulder Abuse Final Report
Atkins Hard Shoulder Abuse Final Report | Version 1.0 | December 2012 P a g e | 3
Table of contents
Chapter Pages
Executive summary 6
1. Background and Objectives 8 1.1. Change in scope 10
2. MIDAS Data 11 2.1. Previous Analysis 11 2.2. Method for Current Analysis 11 2.3. Limitations 14 2.4. M42 MM Results 14 M42 MM Northbound ‘A Carriageway’ Observations 17 M42 MM Northbound ‘B Carriageway’ Observations 20 2.5. M6 BBMM1 Results 21 M6 BBMM1 Northbound ‘A Carriageway’ Observations 23 M6 BBMM1 Southbound ‘B Carriageway’ Observations 26 2.6. M6 BBMM2 Results 27 M6 BBMM2 Northbound ‘A Carriageway’ Observations 29 M6 BBMM2 Southbound ‘B Carriageway’ Observations 33 2.7. MIDAS data conclusions 34 2.8. Selective Time Profiles 35 2.9. Conclusions from Time Profiles 37
3. CCTV review 38 3.1. Introduction 38 3.2. Sample Size 38 3.3. Platoons 40 3.4. MIDAS correlation 41 3.5. Details of recorded HSA 41 3.6. Graphical Representations of CCTV data 44
4. Conclusions 48
5. Recommendations 49
Appendices 51
Appendix A. Selection of standard motorway for comparison 52 A.1. Introduction 52 A.2. CCTV Camera Views 53 A.3. MTV Plots 56 A.4. Results & Conclusions 62 A.5. Further Refinement of Selected Site 62
Tables Table 1. Signal Aspects 8 Table 2. Dynamic Hard Shoulder Lengths 12 Table 3. M42 MM Loop Positions and Dates used for Analysis 13 Table 4. BBMM 1 Loop Positions and Dates used for Analysis 13 Table 5. BBMM 2 Loop Positions and Dates used for Analysis 14 Table 6. Broad Categorisation of potential HSA 34

Managed Motorways Compliance Support Hard Shoulder Abuse Final Report
Atkins Hard Shoulder Abuse Final Report | Version 1.0 | December 2012 P a g e | 4
Table 7. Links and Days Observed 38 Table 8. Data from Junctions 8-9 northbound on the 7th and 8th November 42 Table 9. Data from Junctions 10-9 southbound on the 7th and 8th November 43 Table 10. Data from Junctions 9-10 Northbound on the 28th September 44 Table A1. Suitability of potential locations 62 Table A2. Suitability of locations M60 J8-12 63
Figures M42 MM Northbound ‘A Carriageway’ Graphs 15 Figure 1 – Period 1 Weekday 15 Figure 2 – Period 2 Weekday 15 Figure 3 – Period 3 Weekday 16 Figure 4 – Period 1 Weekend 16 Figure 5 – Period 2 Weekend 17 Figure 6 – Period 3 Weekend 17 M42 MM Southbound ‘B Carriageway’ Graphs 18 Figure 7 – Period 1 Weekday 18 Figure 8 – Period 2 Weekday 18 Figure 9 – Period 3 Weekday 19 Figure 10 – Period 1 Weekend 19 Figure 11 – Period 2 Weekend 20 Figure 12 – Period 3 Weekend 20 M6 BBMM1 Northbound ‘A Carriageway’ Graphs 21 Figure 13 – Period 1 Weekday 21 Figure 14 – Period 2 Weekday 21 Figure 15 – Period 3 Weekday 22 Figure 16 – Period 1 Weekend 22 Figure 17 – Period 2 Weekend 23 Figure 18 – Period 3 Weekend 23 M6 BBMM1 Southbound ‘B Carriageway’ Graphs 24 Figure 19 – Period 1 Weekday 24 Figure 20 – Period 2 Weekday 24 Figure 21 – Period 3 Weekday 25 Figure 22 – Period 1 Weekend 25 Figure 23 – Period 2 Weekend 26 Figure 24 – Period 3 Weekend 26 M6 BBMM2 Northbound ‘A Carriageway’ Graphs 27 Figure 25 – Period 1 Weekday 27 Figure 26 – Period 2 Weekday 27 Figure 27 – Period 3 Weekday 28 Figure 28 – Period 1 Weekend 28 Figure 29 – Period 2 Weekend 29 Figure 30 – Period 3 Weekend 29 Figure 31. M6 J8- J9 Northbound signing issue 30 M6 BBMM2 Southbound ‘B Carriageway’ Graphs 31 Figure 32 – Period 1 Weekday 31 Figure 33 – Period 2 Weekday 31 Figure 34 – Period 3 Weekday 32 Figure 35 – Period 1 Weekend 32 Figure 36 – Period 2 Weekend 33

Managed Motorways Compliance Support Hard Shoulder Abuse Final Report
Atkins Hard Shoulder Abuse Final Report | Version 1.0 | December 2012 P a g e | 5
Figure 37 – Period 3 Weekend 33 Figure 38. “A” carriageway J6 to J7 “End” Location– Period 1 Friday 26/03/2010 35 Figure 39. “B” carriageway J7 to J6 “Start” Location – Period 2 Friday 25/03/2011 36 Figure 40. “B” carriageway J10a to J10 “Mid Location” – Period 3 Friday 13/06/2012 37 Figure 41. Cameras Locations on M6 39 Figure 42. HSA on CCTV review of Junctions 8-9 Northbound 7th November 45 Figure 43. HSA on CCTV review of Junctions 8-9 Northbound 8th November 45 Figure 44. HSA on CCTV review of Junctions 10-9 Southbound 7th November 46 Figure 45. HSA on CCTV review of Junctions 10-9 Southbound 8th November 46 Figure 46. HSA on CCTV review of Junctions 9-10 Northbound 28th September 47

Managed Motorways Compliance Support Hard Shoulder Abuse Final Report
Atkins Hard Shoulder Abuse Final Report | Version 1.0 | December 2012 P a g e | 6
Executive summary
This report provides details of Hard Shoulder Abuse on Managed Motorways (dynamic hard shoulder running) in the West Midlands. Data was gathered using existing carriageway loops (MIDAS) and was supplemented by a sample of CCTV data. The amount of CCTV data whilst limited compared to the amount of MIDAS data does provide valuable information.
M6 BBMM Phase 1 has lower amounts of HSA than M6 BBMM Phase 2 and M42 MM. The use of MIDAS data from hard shoulder loops gives a strong correlation with the amount of Hard Shoulder Abuse and is a valid method for any future monitoring work where loops exist in the hard shoulder.
From limited CCTV analysis and an approximation measure of platooning, it is apparent that platooning is likely to be a significant proportion of all cases of HSA.
Any HSA has the potential to be a causative factor in personal injury accidents, but the volume of HSA is not currently calibrated against HSA that may occur on traditional motorways.
Until such time as a comparison is available to compare measured HSA at Managed Motorways to any HSA at non-Managed Motorways (standard motorways and controlled motorways) it is not possible to conclude that HSA, as matter of course, is worse at Managed Motorway sites when compared to standard motorways. Nevertheless the levels of HSA observed at many of the Managed Motorway links indicate that the current regime of mitigation measures is justified and that work to consider the merit of additional mitigation measures should be programmed.
The levels of HSA vary from link to link. Managed Motorways have similar design standards and appearance and so it is not apparent what key issues would influence the amount of HSA, although there is evidence that shorter links (less than 700m long) have higher levels of HSA.
HSA occurs at the start, end and middle of links. Although not exclusively the case, HSA is normally higher at the end of links near the diverge junction. HSA at the start and middle of links is often of a similar order of magnitude.
The highest levels of HSA were found during the periods of high demand, inter-peak, when HSR was not in operation. An important and somewhat unexpected finding is the level of HSA that can potentially occur in the small hours of the morning.
At M6 J8-9 northbound the scheme layout schematic drawings show that the 2/3m Advance Direction Sign for J9 may encourage users (legally) into what is a permanently open LBS1 (acting as a merge auxiliary lane for J8). Therefore HSA may occur as users continue down LBS1 beyond the end of the merge auxiliary lane. It is however noted that J9-10 (also a short link) which does not have this anomaly has very similar levels of HSA. Short links would appear to “encourage” HSA.
It is recommended that the Regional Control Centre and Maintenance Contractor for three planned schemes are furnished with a copy of this report and a summary of the existing mitigation measures in place in the West Midlands. Similarly the Regional Control Centre and Maintenance Contractor for the West Midlands region should be sent a copy of this report. The purposes of this would be to:
Confirm that existing control measures in place to protect road workers are adequate, particularly for times of day outside the inter-peak period.
Confirm if the extent of use of Variable Message Signs is appropriate
Ensure that new schemes are aware of risks and also have information about how the West Midlands area is controlling risks

Managed Motorways Compliance Support Hard Shoulder Abuse Final Report
Atkins Hard Shoulder Abuse Final Report | Version 1.0 | December 2012 P a g e | 7
A key issue would seem to be the prevalence of HSA at the start of a link. Reducing HSA at that point will potentially contribute to a significant overall reduction in HSA. The identification of potential measures was outside the scope of this project and would need to be examined in detail, but may include the following:
Changes to road markings, signing and signal displays (including variable message signs) at the end of merge slip road connections to mainlines
Targeted education, possibly making use of ANPR cameras to identify offenders
Conversion of short DHSR links to permanent running lanes or use of DHSR for greater portions of the day for example where traffic volumes remain reasonably high inter-peak
In the case of the latter, this course of action would dramatically reduce HSA levels, but would need consideration via a scheme safety report. Changes to road markings, signing and signalling would also need programme level consideration to ensure consistency. Changes to physical infrastructure are normally not achieved in the short-term, but some changes to message displays could possibly be achieved in the shorter term.
It is important that any risks of HSA are weighed in the round together with the benefits of Managed Motorways. It would therefore be useful to investigate STATS19 collision data and provide evidence of the nature of personal injury accidents on one or more Managed Motorways that have been open for 12 months or more. If a post-opening (Stage 4) Road Safety Audit report has been produced in accordance with DMRB HD19 for one or more DHSR schemes, this documentation should be analysed to determine if any salient findings are included. Incidences of HSA within STATS19 accident reports would not be directly reported as such, and detailed work would be required to assess the causation factors including investigation of plain language accident descriptions, time of day and other data such as HALOGEN.
Additionally national data on hard shoulder related accidents exist and are reported annually in Highways Agency safety data reports. This may allow a comparison between the safety performance of traditional hard shoulders per mile compared to DHSR schemes per mile. Such a comparison would need in-depth study of DHSR schemes’ accident histories so it can be ascertained if any entry on STATS19 for “hard shoulder” accidents related to peak or off-peak times.
Further work to investigate HSA at standard motorways is desirable to allow an informed comparison. This would require CCTV analysis of either PTZ cameras or a separate dedicated CCTV system. It is noted that formal CCTV reviews are resource intensive and the necessary resources should be identified before the project commences. It is particularly noted that the levels of HSA reported at some DHSR links are at a level that are almost certainly higher than occur on a standard motorway. It could be beneficial to perform an informal check via the RCC PTZ cameras at sites set out in Appendix A before committing time and resources to a more lengthy formal review.

Managed Motorways Compliance Support Hard Shoulder Abuse Final Report
Atkins Hard Shoulder Abuse Final Report | Version 1.0 | December 2012 P a g e | 8
1. Background and Objectives
A hard shoulder is an area between the verge and the nearside lane of a motorway. Generally it is kept clear of all traffic but in the event of a breakdown or other emergency, a road user can pull into the hard shoulder to get out of the flow of traffic to stop at a place of relative safety. A hard shoulder also allows some extra flexibility should a motorist need to take evasive action, as it is a buffer area between the main carriageway and the edge of the road. Emergency vehicles, Traffic Officers and permitted maintenance vehicles can use the hard shoulder. Since the first introduction in 2006 on the M42 between J3a and J7 a number of links on the West Midlands Motorway network have permitted use of the hard shoulder during periods of high traffic demand, where signalling shows the hard shoulder is open for legal use. The hard shoulder is opened and closed through the use of gantry mounted signals positioned above each lane. When traffic levels reduce, the hard shoulder (also known as Lane Beneath Signal One, LBS1) reverts to emergency use only. On standard motorways (including controlled motorways) there are no lane signals over the hard shoulder. There are three signals used on a Managed Motorway which instruct road users that the hard shoulder is not to be used as a running lane. These are shown in Table 1.
Table 1. Signal Aspects
Signal Meaning Signal Aspect
Red-X (Lane Control) – This signal is displayed over the hard shoulder to notify road users that HSR is not operational when Variable Mandatory Speed Limits (VMSL) are in use and that the hard shoulder is for emergency use only text
Red-X (STOP) – This signal’s meaning is defined in the highway code as “Do not proceed further in this lane”. This signal may be used on any lane (i.e. it is not a hard
shoulder specific signal) and at any time.
BLANK – The signal aspect is switched off when the hard shoulder is not active and VMSL are not being used. During this time the hard shoulder is available for emergency use only.
The initial objective of this work was to assess whether unlawful use of hard shoulder, known as hard shoulder abuse (HSA), is a cause for concern. HSA has the potential to be a causative factor in accidents, such as:
Road worker or emergency service vehicle legally stopped on hard shoulder impacted by public vehicle during HSA
Road worker emergency service vehicle on foot carrying out work in verge or hard shoulder impacted by public vehicle during HSA
Legally stopped (during emergency) public vehicle hit by public vehicle during HSA
Unlawfully stopped public vehicle hit by public vehicle during HSA

Managed Motorways Compliance Support Hard Shoulder Abuse Final Report
Atkins Hard Shoulder Abuse Final Report | Version 1.0 | December 2012 P a g e | 9

Managed Motorways Compliance Support Hard Shoulder Abuse Final Report
Atkins Hard Shoulder Abuse Final Report | Version 1.0 | December 2012 P a g e | 10
Maintenance contractors have developed Risk Mitigation through working practices:
“Permit to Access” to control access to working areas
No working from hard shoulder without traffic management
Working time restrictions – e.g. during inter-peak periods only Emergency Refuge Areas are used for stopping/working
Setting of signals to advise road users of maintainers on the road Where the RCC is aware of HSA they have the power to display a message set “Hard shoulder for emergency use only” on overhead signals as a reminder to public road users. The project objective was to be achieved by studying traffic behaviour on hard shoulders on dynamic hard shoulder running Managed Motorway schemes but by also looking at behaviour elsewhere on the motorway network. The findings of this report will be used to contribute towards the National Managed Motorway Compliance Guidance workstreams. Devising solutions to HSA was outside the scope of this project.
1.1. Change in scope This project was to be carried out as a hybrid project with a defined share of responsibility between consultants and the Highways Agency.
It was established that CCTV reviews would be carried out by internal Highways Agency resources. An early estimate of resource needs was taken into account by the Highways Agency and a decision taken to focus the available resources on a review of CCTV data from a selection of DHSR links alone, making use of hard shoulder monitoring (HSM) fixed cameras. CCTV reviews of standard motorways and controlled motorways using Pan Tilt Zoom cameras were not feasible within the time and resource availability. However, Appendix A sets out suitable sites for standard motorways and the previous HCG/HRG reports set out candidate sites for controlled motorways.
Managed Motorways Compliance Support Hard Shoulder Abuse Final Report
Atkins Hard Shoulder Abuse Final Report | Version 1.0 | December 2012 P a g e | 11
2. MIDAS Data
2.1. Previous Analysis A previous report has been produced by HCG/HRG Ltd for the Highways Agency, ‘Hard Shoulder Abuse – M42 MM and M6 BBMM 1 Schemes – December 2010’. That report analysed data up to early 2010 for the M42 MM and M6 BBMM 1, which were the only motorways operating dynamic hard shoulders at the time.
The previous work analysed large amounts of data covering the full period from 2006 to 2010. It was also used to compare the level of HSA abuse during the change from HSR 50mph and HSR 60mph.
The precise methods of the previous data analysis are not documented, so a direct comparison across the period of the previous work and this work cannot be carried out.
2.2. Method for Current Analysis MIDAS data is collected and stored on a daily basis in a file which contains minutely averaged data for all loops in the Control Office (CO) area. The data collected is stored in a compressed format in binary files at http://www.midas-data.org.uk/ .
In order to carry out custom analysis on this data it was downloaded, decompressed and converted into a plain text format (comma-separated values (CSV)) that was readable by MS Excel.
Once converted into a useable format each row of data contained loop, date, time, speed, flow, occupancy and headway for each lane. The flow column for the lane which corresponds to the hard shoulder was then used.
A tool was developed using Excel Visual Basic for Applications (VBA) that:
1 - Decompressed (from coddmmyy.tcd.bz2 to coddmmyy.tcd) selected daily Traffic Count Data (TCD) files that have been manually downloaded from the MIDAS website;
2 - Converted the binary files (coddmmyy.tcd) into CSV format (coddmmyy.tcd.csv) that can be read by Excel;
3 - Filtered the CSV format traffic data so that only loop data from specified loops is included and, , adding additional fields to aid subsequent analysis of the loop data, e.g. including the link name for each row of data.
The selection of screening dates was based on:
Periods when HALOGEN was working (some extensive periods existed where HALOGEN was offline meaning hard shoulder opening and closing times were not recorded)
Obtaining three separate time periods to allow time trend assessment
Obtaining 7 day data for each period
Avoiding holiday periods where traffic volume and driver behaviour could be atypical
The current analysis reports the level of potential HSA abuse as an average flow per hour on any given link; this allows an understanding of the likelihood that a legitimate user of the hard shoulder, such as a road maintenance worker or stranded motorist, would encounter a vehicle using the hard shoulder unlawfully.
Three points in time since 2010 have been used in order to establish if the patterns of HSA observed previously still exist. The analysis also includes M6 BBMM 2 scheme which has been implemented since the previous work.

Managed Motorways Compliance Support Hard Shoulder Abuse Final Report
Atkins Hard Shoulder Abuse Final Report | Version 1.0 | December 2012 P a g e | 12
The approximate lengths of hard shoulder which can be dynamically opened to traffic on each link of each scheme are shown in Table 2.
Table 2. Dynamic Hard Shoulder Lengths
Link Description Carriageway Direction Length
(metres)
ATM - M42 North J3A-4 A Northbound 2,210
ATM - M42 North J4-5 A Northbound 2,370
ATM - M42 North J5-6 A Northbound 3,740
ATM - M42 North J6-7 A Northbound 1,780
ATM - M42 South J4-3A B Southbound 1,790
ATM - M42 South J5-4 B Southbound 1,990
ATM - M42 South J6-5 B Southbound 3,860
ATM - M42 South J7-6 B Southbound 1,550
M6 BBMM1 - M6 North J4-4A A Northbound 3,260
M6 BBMM1 - M6 North J4A-5 A Northbound 1,580
M6 BBMM1 - M6 South J5-4A B Southbound 1,460
M6 BBMM2 - M6 North J8-9 A Northbound 670
M6 BBMM2 - M6 North J9-10 A Northbound 680
M6 BBMM2 - M6 North J10-10A A Northbound 3,650
M6 BBMM2 - M6 South J9-8 B Southbound 690
M6 BBMM2 - M6 South J10-9 B Southbound 660
M6 BBMM2 - M6 South J10A-10 B Southbound 4,020
MIDAS traffic count data (TCD) files were downloaded for the control office covering the three schemes in order to be able to identify instances of hard shoulder use.
Three separate weeks of data have been scrutinised for each scheme, with neutral traffic weeks chosen as far as possible. It is noted that HALOGEN data has not been retained for period 06/09/2011 to 14/05/2012 which ruled out such periods from the analysis. Occasional periods of MIDAS data loss can occur and these have been avoided from the data selection.
The above data availability issues mean that the choice of weeks available was been more limited than expected and the same weeks were not always available for sampling all of the schemes. The dates used for each scheme can be seen in Table 3 to Table 5 below.
Three locations were chosen on each link in each scheme, these represent the start, middle and end of the marked hard shoulder on each link. On the M42 these have been chosen to match as closely as possible the previous analysis. On the BBMM sections, scheme schematic drawings were used to identify suitable carriageway loops in these locations.
When choosing “End” and “Start” loops care was taken to avoid loop arrays that were very close to junction merge and diverge points. In this way the chances of collecting data for minor transgressions was minimised.
Table 3 to Table 5 below identify the links in each MM scheme and the loops used for each position: start middle and end. It should be noted at in some instances there are not three loop arrays on a link and in this case only two positions have been used.

Managed Motorways Compliance Support Hard Shoulder Abuse Final Report
Atkins Hard Shoulder Abuse Final Report | Version 1.0 | December 2012 P a g e | 13
Table 3. M42 MM Loop Positions and Dates used for Analysis
Period 1 (from – to)
Period 2 (from – to)
Period 3 (from – to)
Link Position Geographic
Address Mon Sun Mon Sun Mon Sun
M42 North J3A-4
Start xxxx
22/03/10 28/03/10 21/03/11 27/03/11 11/06/12 17/06/12
Mid M42/6312A
End M42/6319A
M42 North J4-5
Start M42/6339A
Mid M42/6351A
End M42/6362A
M42 North J5-6
Start M42/6377A
Mid M42/6402A
End M42/6414A1
M42 North J6-7
Start M42/6434A
Mid M42/6441A
End M42/6451A
M42 South J4-3A
End xxxx
22/03/10 28/03/10 21/03/11 27/03/11 11/06/12 17/06/12
Mid M42/6312B
Start M42/6319B
M42 South J5-4
End M42/6339B
Mid M42/6351B
Start xxxx
M42 South J6-5
End M42/6377B
Mid M42/6402B
Start M42/6414B
M42 South J7-6
End M42/6434B
Mid M42/6441B
Start M42/6448B
*xxxx – No loop available for this position
Table 4. BBMM 1 Loop Positions and Dates used for Analysis
Period 1 (from – to) Period 2 (from – to) Period 3 (from – to)
Link Position Geographic
Address Mon Sun Mon Sun Mon Sun
M6 North J4-4A
Start M6/5722A
22/03/10 28/03/10 21/03/11 27/03/11 11/06/12 17/06/12
Mid M6/5737A
End M6/5749A
M6 North J4A-5
Start M6/5763A
Mid M6/5769A
End M6/5775A
M6 South J5-4A
End M6/5764B
22/03/10 28/03/10 21/03/11 27/03/11 11/06/12 17/06/12 Mid M6/5769B
Start M6/5774B

Managed Motorways Compliance Support Hard Shoulder Abuse Final Report
Atkins Hard Shoulder Abuse Final Report | Version 1.0 | December 2012 P a g e | 14
Table 5. BBMM 2 Loop Positions and Dates used for Analysis
Period 1 (from – to) Period 2 (from – to) Period 3 (from – to)
Link Position Geographic
Address Mon Sun Mon Sun Mon Sun
M6 North J8-9
Start M6/5945A
21/03/11 27/03/11 06/06/11 12/06/11 11/06/12 17/06/12
Mid M6/5947A
End M6/5950A
M6 North J9-10
Start M6/5967A
Mid M6/5969A
End xxxx
M6 North
J10-10A
Start M6/5993A
Mid M6/6009A
End M6/6025A
M6 South J9-8
End M6/5943B
21/03/11 27/03/11 06/06/11 12/06/11 11/06/12 17/06/12
Mid M6/5945B
Start M6/5947B
M6 South J10-9
End M6/5967B
Mid M6/5969B
Start xxxx
M6 South
J10A-10
End M6/5993B
Mid M6/6013B
Start M6/6029B
*xxxx – No loop available for this position
HALOGEN data has been downloaded and compared with the TCD data being processed. Detections in lane one of the loop positions shown above have been processed to remove any detections that occurred when HALOGEN has recorded the hard shoulder as open.
Once the data for logged times when the hard shoulder is open to traffic have been removed, there were a small number of anomalies where the hard shoulder traffic count was much higher than expected. These anomalies are removed manually where it was clear that the hard shoulder was actually open.
2.3. Limitations MIDAS loops are not universally installed on normal hard shoulders, but loops are available on Managed Motorways with HSR. A limitation of using MIDAS data for the purposes of this work is that it is not possible to ascertain if a road user made use of the hard shoulder legally or not. The HSA levels obtained from MIDAS are therefore likely to include some vehicles that used the hard shoulder legally, e.g. in the event of an emergency. The data is also likely to include emergency vehicles using the hard shoulder in response to an accident or vehicles permitted to use the hard shoulder for maintenance purposes. For the data analysis work involving MIDAS, all vehicles recorded on the hard shoulder are assumed to be cases of HSA. This means that in some cases actual HSA levels may be marginally different than those stated in this section of the report. Limited CCTV analysis carried out by HCG/HRG for a previous study indicated that the correct application of HALOGEN opening/closing times combined with MIDAS data was a very good representation of HSA, with a negligible number of uses of the hard shoulder deemed to be lawful when viewed on CCTV.
2.4. M42 MM Results The results of the analysis carried out for the M42 Northbound on weekdays can be seen in Figure 1 to Figure 3. Weekends are shown in Figure 4 to Figure 6.

Managed Motorways Compliance Support Hard Shoulder Abuse Final Report
Atkins Hard Shoulder Abuse Final Report | Version 1.0 | December 2012 P a g e | 15
The results of the analysis carried out for the M42 Southbound on weekdays can be seen in Figure 7 to Figure 9. Weekends are shown in Figure 10 to Figure 12.
The data takes account of the hard shoulder open/close times listed in HALOGEN, such that each figure shows the average hourly hard shoulder flow in a day at the location listed where the hard shoulder was not open for general public use.
M42 MM Northbound ‘A Carriageway’ Graphs
Figure 1 – Period 1 Weekday
*#N/A – No loop available for this position
Figure 2 – Period 2 Weekday
*#N/A – No loop available for this position
#N/A 1 3 0 0 7
2 1 2 0 2
21
0 10 20 30 40 50 60 70 80 90
100
Start Mid End Start Mid End Start Mid End Start Mid End
M42 North J3A-4 M42 North J4-5 M42 North J5-6 M42 North J6-7
Ve
hic
les
Pe
r H
ou
r (V
PH
)
Link & Location
Average Hourly Weekday Flow 22-26/03/2010
#N/A 1 2 0 1 5 3 1
6 6 1
31
0 10 20 30 40 50 60 70 80 90
100
Start Mid End Start Mid End Start Mid End Start Mid End
M42 North J3A-4 M42 North J4-5 M42 North J5-6 M42 North J6-7
Ve
hic
les
Pe
r H
ou
r (V
PH
)
Link & Location
Average Hourly Weekday Flow 21-25/03/2011
Managed Motorways Compliance Support Hard Shoulder Abuse Final Report
Atkins Hard Shoulder Abuse Final Report | Version 1.0 | December 2012 P a g e | 16
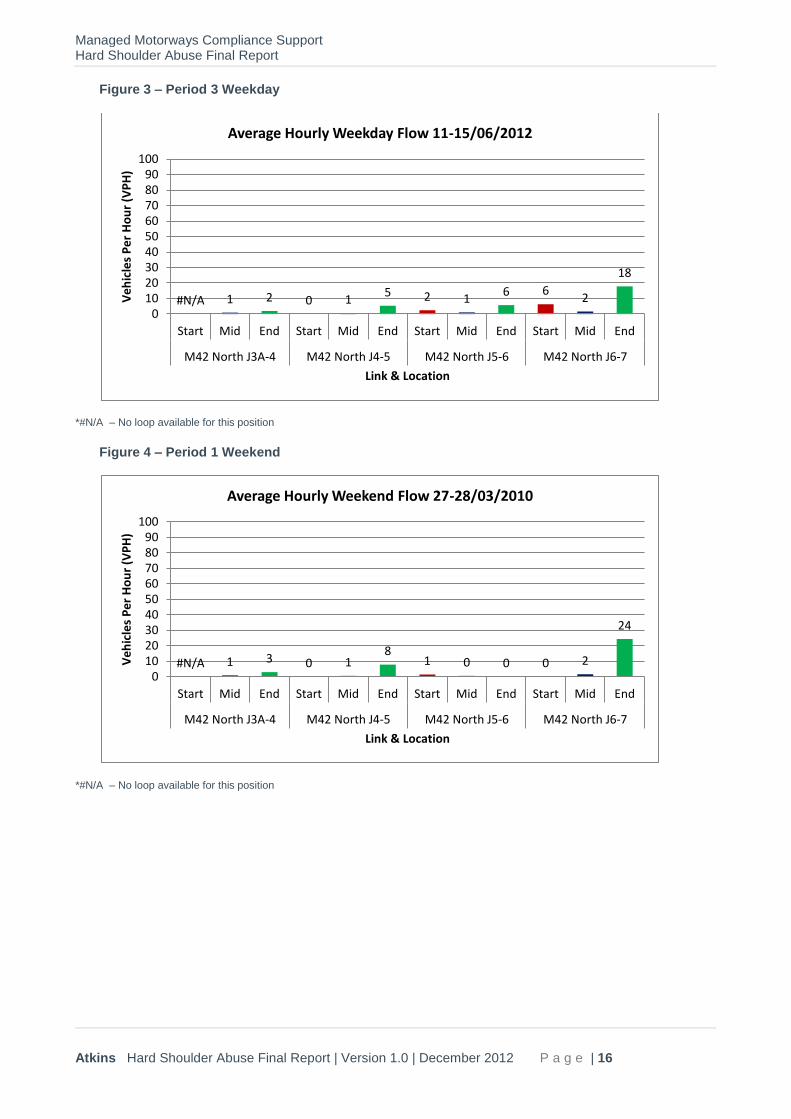
Figure 3 – Period 3 Weekday
*#N/A – No loop available for this position
Figure 4 – Period 1 Weekend
*#N/A – No loop available for this position
#N/A 1 2 0 1 5 2 1
6 6 2
18
0 10 20 30 40 50 60 70 80 90
100
Start Mid End Start Mid End Start Mid End Start Mid End
M42 North J3A-4 M42 North J4-5 M42 North J5-6 M42 North J6-7
Ve
hic
les
Pe
r H
ou
r (V
PH
)
Link & Location
Average Hourly Weekday Flow 11-15/06/2012
#N/A 1 3 0 1 8
1 0 0 0 2
24
0 10 20 30 40 50 60 70 80 90
100
Start Mid End Start Mid End Start Mid End Start Mid End
M42 North J3A-4 M42 North J4-5 M42 North J5-6 M42 North J6-7
Ve
hic
les
Pe
r H
ou
r (V
PH
)
Link & Location
Average Hourly Weekend Flow 27-28/03/2010

Managed Motorways Compliance Support Hard Shoulder Abuse Final Report
Atkins Hard Shoulder Abuse Final Report | Version 1.0 | December 2012 P a g e | 17
Figure 5 – Period 2 Weekend
*#N/A – No loop available for this position
Figure 6 – Period 3 Weekend
*#N/A – No loop available for this position
M42 MM Northbound ‘A Carriageway’ Observations There is no start loop location for J3a to J4, which is consistent with the analysis in the previous work
carried out for the HA.
All flows are within the ranges identified in the previous analysis.
Levels of potential HSA abuse are consistent across all periods analysed.
Levels of abuse tend to occur more at the start and end of the hard shoulder, which is to be expected.
The end of the hard shoulder on the approach to J7 has the highest level of abuse. The average is between 18 and 32 vehicles per hour. This is consistent from period to period. This higher level of
#N/A 1 2 0 1 6 2 1
7 4 1
32
0 10 20 30 40 50 60 70 80 90
100
Start Mid End Start Mid End Start Mid End Start Mid End
M42 North J3A-4 M42 North J4-5 M42 North J5-6 M42 North J6-7
Ve
hic
les
Pe
r H
ou
r (V
PH
)
Link & Location
Average Hourly Weekend Flow 26-27/03/2011
#N/A 1 2 0 1 6 3 1
5 7 2
22
0 10 20 30 40 50 60 70 80 90
100
Start Mid End Start Mid End Start Mid End Start Mid End
M42 North J3A-4 M42 North J4-5 M42 North J5-6 M42 North J6-7
Ve
hic
les
Pe
r H
ou
r (V
PH
)
Link & Location
Average Hourly Weekend Flow 16-17/06/2012

Managed Motorways Compliance Support Hard Shoulder Abuse Final Report
Atkins Hard Shoulder Abuse Final Report | Version 1.0 | December 2012 P a g e | 18
abuse is consistent with previous observations in the report completed for the HA and this could be associated with the combination of signing, signalling and lining (as set out in previous HCG/HRG report).
M42 MM Southbound ‘B Carriageway’ Graphs
Figure 7 – Period 1 Weekday
*#N/A – No loop available for this position
Figure 8 – Period 2 Weekday
*#N/A – No loop available for this position
#N/A 2 2 3 0 #N/A 1 1 10
15 15 25
0 10 20 30 40 50 60 70 80 90
100
End Mid Start End Mid Start End Mid Start End Mid Start
M42 South J4-3A M42 South J5-4 M42 South J6-5 M42 South J7-6
Ve
hic
les
Pe
r H
ou
r (V
PH
)
Link & Location
Average Hourly Weekday Flow 22-26/03/2010
#N/A 3 3 3 1 #N/A 2 1 9 8 8 8
0 10 20 30 40 50 60 70 80 90
100
End Mid Start End Mid Start End Mid Start End Mid Start
M42 South J4-3A M42 South J5-4 M42 South J6-5 M42 South J7-6
Ve
hic
les
Pe
r H
ou
r (V
PH
)
Link & Location
Average Hourly Weekday Flow 21-25/03/2011

Managed Motorways Compliance Support Hard Shoulder Abuse Final Report
Atkins Hard Shoulder Abuse Final Report | Version 1.0 | December 2012 P a g e | 19
Figure 9 – Period 3 Weekday
*#N/A – No loop available for this position
Figure 10 – Period 1 Weekend
*#N/A – No loop available for this position
#N/A 0 2 2 1 #N/A 2 1 7 9 8 7
0 10 20 30 40 50 60 70 80 90
100
End Mid Start End Mid Start End Mid Start End Mid Start
M42 South J4-3A M42 South J5-4 M42 South J6-5 M42 South J7-6
Ve
hic
les
Pe
r H
ou
r (V
PH
)
Link & Location
Average Hourly Weekday Flow 11-15/06/2012
#N/A 2 2 4 0 #N/A 1 0 8
14 16
48
0 10 20 30 40 50 60 70 80 90
100
End Mid Start End Mid Start End Mid Start End Mid Start
M42 South J4-3A M42 South J5-4 M42 South J6-5 M42 South J7-6
Ve
hic
les
Pe
r H
ou
r (V
PH
)
Link & Location
Average Hourly Weekend Flow 27-28/03/2010

Managed Motorways Compliance Support Hard Shoulder Abuse Final Report
Atkins Hard Shoulder Abuse Final Report | Version 1.0 | December 2012 P a g e | 20
Figure 11 – Period 2 Weekend
*#N/A – No loop available for this position
Figure 12 – Period 3 Weekend
*#N/A – No loop available for this position
M42 MM Northbound ‘B Carriageway’ Observations There is no end loop location for J4 to J3a, or for the start of J5 to J4, which is consistent with the
analysis in the previous work carried out for the HA.
All other flows are generally within the ranges identified in the previous analysis.
Levels of potential HSA abuse are consistent across all periods analysed.
Levels of abuse tend to occur more at the start and end of the hard shoulder, this is a factor noted in the previous HSA report.
#N/A 1 1 2 0 #N/A 2 1 10 10 9
14
0 10 20 30 40 50 60 70 80 90
100
End Mid Start End Mid Start End Mid Start End Mid Start
M42 South J4-3A M42 South J5-4 M42 South J6-5 M42 South J7-6
Ve
hic
les
Pe
r H
ou
r (V
PH
)
Link & Location
Average Hourly Weekend Flow 26-27/03/2011
#N/A 0 2 3 1 #N/A 2 1 9
14 8
13
0 10 20 30 40 50 60 70 80 90
100
End Mid Start End Mid Start End Mid Start End Mid Start
M42 South J4-3A M42 South J5-4 M42 South J6-5 M42 South J7-6
Ve
hic
les
Pe
r H
ou
r (V
PH
)
Link & Location
Average Hourly Weekend Flow 16-17/06/2012
Managed Motorways Compliance Support Hard Shoulder Abuse Final Report
Atkins Hard Shoulder Abuse Final Report | Version 1.0 | December 2012 P a g e | 21
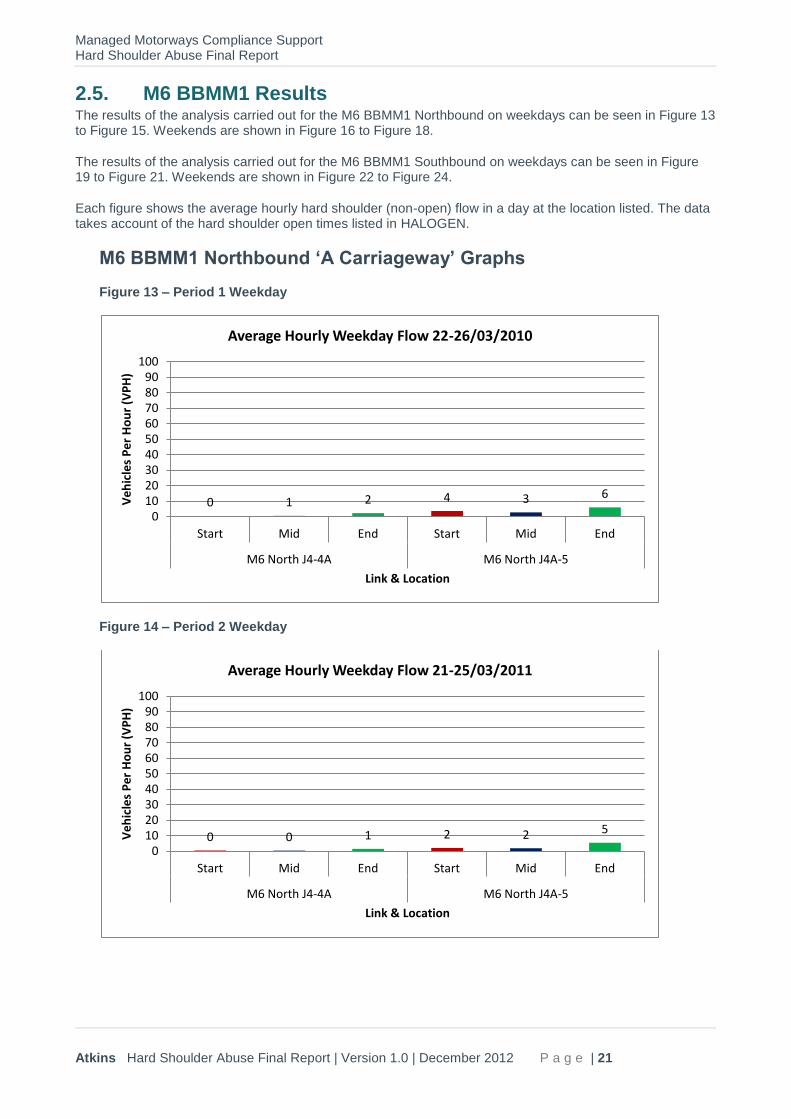
2.5. M6 BBMM1 Results The results of the analysis carried out for the M6 BBMM1 Northbound on weekdays can be seen in Figure 13 to Figure 15. Weekends are shown in Figure 16 to Figure 18.
The results of the analysis carried out for the M6 BBMM1 Southbound on weekdays can be seen in Figure 19 to Figure 21. Weekends are shown in Figure 22 to Figure 24.
Each figure shows the average hourly hard shoulder (non-open) flow in a day at the location listed. The data takes account of the hard shoulder open times listed in HALOGEN.
M6 BBMM1 Northbound ‘A Carriageway’ Graphs
Figure 13 – Period 1 Weekday
Figure 14 – Period 2 Weekday
0 1 2 4 3 6
0 10 20 30 40 50 60 70 80 90
100
Start Mid End Start Mid End
M6 North J4-4A M6 North J4A-5
Ve
hic
les
Pe
r H
ou
r (V
PH
)
Link & Location
Average Hourly Weekday Flow 22-26/03/2010
0 0 1 2 2 5
0 10 20 30 40 50 60 70 80 90
100
Start Mid End Start Mid End
M6 North J4-4A M6 North J4A-5
Ve
hic
les
Pe
r H
ou
r (V
PH
)
Link & Location
Average Hourly Weekday Flow 21-25/03/2011

Managed Motorways Compliance Support Hard Shoulder Abuse Final Report
Atkins Hard Shoulder Abuse Final Report | Version 1.0 | December 2012 P a g e | 22
Figure 15 – Period 3 Weekday
Figure 16 – Period 1 Weekend
1 0 2 3 3 6
0 10 20 30 40 50 60 70 80 90
100
Start Mid End Start Mid End
M6 North J4-4A M6 North J4A-5
Ve
hic
les
Pe
r H
ou
r (V
PH
)
Link & Location
Average Hourly Weekday Flow 11-15/06/2012
0 0 1 5 3 7
0 10 20 30 40 50 60 70 80 90
100
Start Mid End Start Mid End
M6 North J4-4A M6 North J4A-5
Ve
hic
les
Pe
r H
ou
r (V
PH
)
Link & Location
Average Hourly Weekend Flow 27-28/03/2010

Managed Motorways Compliance Support Hard Shoulder Abuse Final Report
Atkins Hard Shoulder Abuse Final Report | Version 1.0 | December 2012 P a g e | 23
Figure 17 – Period 2 Weekend
Figure 18 – Period 3 Weekend
M6 BBMM1 Northbound ‘A Carriageway’ Observations
There are only two dynamic hard shoulder links in this scheme in this direction.
Hard shoulder flows are consistent in each location across each period.
The end location on the J4a to J5 link has the highest hard shoulder flows. The average hourly flow across the day ranges from six to nine across the different periods.
0 0 1 3 3 7
0 10 20 30 40 50 60 70 80 90
100
Start Mid End Start Mid End
M6 North J4-4A M6 North J4A-5
Ve
hic
les
Pe
r H
ou
r (V
PH
)
Link & Location
Average Hourly Weekend Flow 26-27/03/2011
1 0 2 4 3 9
0 10 20 30 40 50 60 70 80 90
100
Start Mid End Start Mid End
M6 North J4-4A M6 North J4A-5
Ve
hic
les
Pe
r H
ou
r (V
PH
)
Link & Location
Average Hourly Weekend Flow 16-17/06/2012

Managed Motorways Compliance Support Hard Shoulder Abuse Final Report
Atkins Hard Shoulder Abuse Final Report | Version 1.0 | December 2012 P a g e | 24
M6 BBMM1 Southbound ‘B Carriageway’ Graphs
Figure 19 – Period 1 Weekday
Figure 20 – Period 2 Weekday
12 4 4
0 10 20 30 40 50 60 70 80 90
100
End Mid Start
M6 South J5-4A
Ve
hic
les
Pe
r H
ou
r (V
PH
)
Link & Location
Average Hourly Weekday Flow 22-26/03/2010
5 2 3
0 10 20 30 40 50 60 70 80 90
100
End Mid Start
M6 South J5-4A
Ve
hic
les
Pe
r H
ou
r (V
PH
)
Link & Location
Average Hourly Weekday Flow 21-25/03/2011

Managed Motorways Compliance Support Hard Shoulder Abuse Final Report
Atkins Hard Shoulder Abuse Final Report | Version 1.0 | December 2012 P a g e | 25
Figure 21 – Period 3 Weekday
Figure 22 – Period 1 Weekend
6 3 3
0 10 20 30 40 50 60 70 80 90
100
End Mid Start
M6 South J5-4A
Ve
hic
les
Pe
r H
ou
r (V
PH
)
Link & Location
Average Hourly Weekday Flow 11-15/06/2012
11 3 3
0 10 20 30 40 50 60 70 80 90
100
End Mid Start
M6 South J5-4A
Ve
hic
les
Pe
r H
ou
r (V
PH
)
Link & Location
Average Hourly Weekend Flow 27-28/03/2010

Managed Motorways Compliance Support Hard Shoulder Abuse Final Report
Atkins Hard Shoulder Abuse Final Report | Version 1.0 | December 2012 P a g e | 26
Figure 23 – Period 2 Weekend
Figure 24 – Period 3 Weekend
M6 BBMM1 Southbound ‘B Carriageway’ Observations
There is only one dynamic hard shoulder link in this scheme in this direction.
Hard shoulder flows are consistent in each location across each period.
The end location on the J5 to J4a link has the highest hard shoulder flows. The average hourly flow across the day ranges are similar and range from five to 12 across the different periods.
10 2 2
0 10 20 30 40 50 60 70 80 90
100
End Mid Start
M6 South J5-4A
Ve
hic
les
Pe
r H
ou
r (V
PH
)
Link & Location
Average Hourly Weekend Flow 26-27/03/2011
10 3 2
0 10 20 30 40 50 60 70 80 90
100
End Mid Start
M6 South J5-4A
Ve
hic
les
Pe
r H
ou
r (V
PH
)
Link & Location
Average Hourly Weekend Flow 16-17/06/2012

Managed Motorways Compliance Support Hard Shoulder Abuse Final Report
Atkins Hard Shoulder Abuse Final Report | Version 1.0 | December 2012 P a g e | 27
2.6. M6 BBMM2 Results The results of the analysis carried out for the M6 BBMM2 Northbound on weekdays can be seen in Figure 25 to Figure 27. Weekends are shown in Figure 28 to Figure 30.
The results of the analysis carried out for the M6 BBMM2 Southbound on weekdays can be seen in Figure 32 to Figure 34. Weekends are shown in Figure 35 to Figure 37.
The data takes account of the hard shoulder open/close times listed in HALOGEN, such that each figure shows the average hourly hard shoulder flow in a day at the location listed where the hard shoulder was not open for general public use.
M6 BBMM2 Northbound ‘A Carriageway’ Graphs
Figure 25 – Period 1 Weekday
*#N/A – No loop available for this position
Figure 26 – Period 2 Weekday
3 3 4 3 6 #N/A
5 3 11
0 10 20 30 40 50 60 70 80 90
100
Start Mid End Start Mid End Start Mid End
M6 North J8-9 M6 North J9-10 M6 North J10-10A
Ve
hic
les
Pe
r H
ou
r (V
PH
)
Link & Location
Average Hourly Weekday Flow 21-25/03/2011
10 10 13 10 17
#N/A 8 4
16
0 10 20 30 40 50 60 70 80 90
100
Start Mid End Start Mid End Start Mid End
M6 North J8-9 M6 North J9-10 M6 North J10-10A
Ve
hic
les
Pe
r H
ou
r (V
PH
)
Link & Location
Average Hourly Weekday Flow 06-10/06/2011

Managed Motorways Compliance Support Hard Shoulder Abuse Final Report
Atkins Hard Shoulder Abuse Final Report | Version 1.0 | December 2012 P a g e | 28
*#N/A – No loop available for this position
Figure 27 – Period 3 Weekday
*#N/A – No loop available for this position
Figure 28 – Period 1 Weekend
*#N/A – No loop available for this position
13 10 13 12 21
#N/A 0 4
17
0 10 20 30 40 50 60 70 80 90
100
Start Mid End Start Mid End Start Mid End
M6 North J8-9 M6 North J9-10 M6 North J10-10A
Ve
hic
les
Pe
r H
ou
r (V
PH
)
Link & Location
Average Hourly Weekday Flow 11-15/06/2012
11 12 15 10
19
#N/A 5 2
11
0 10 20 30 40 50 60 70 80 90
100
Start Mid End Start Mid End Start Mid End
M6 North J8-9 M6 North J9-10 M6 North J10-10A
Ve
hic
les
Pe
r H
ou
r (V
PH
)
Link & Location
Average Hourly Weekend Flow 26-27/03/2011

Managed Motorways Compliance Support Hard Shoulder Abuse Final Report
Atkins Hard Shoulder Abuse Final Report | Version 1.0 | December 2012 P a g e | 29
Figure 29 – Period 2 Weekend
*#N/A – No loop available for this position
Figure 30 – Period 3 Weekend
*#N/A – No loop available for this position
M6 BBMM2 Northbound ‘A Carriageway’ Observations
There is no end loop location for the J9 to J10 link.
The periods analysed for this scheme are in March 2011, June 2011 and June 2012.
The pattern of flows is consistent comparatively between locations between each period. However it should be noted that there is a general trend for the flows to increase fairly uniformly between the earlier and later periods.
Flows on the weekend are consistently slightly higher than during the week.
On the whole levels of potential HSA are higher in BBMM2 than in the other schemes.
19 19 21 16
27
#N/A 7 3
15
0 10 20 30 40 50 60 70 80 90
100
Start Mid End Start Mid End Start Mid End
M6 North J8-9 M6 North J9-10 M6 North J10-10A
Ve
hic
les
Pe
r H
ou
r (V
PH
)
Link & Location
Average Hourly Weekend Flow 11-12/06/2011
24 21 29
23
37
#N/A 0 5
18
0 10 20 30 40 50 60 70 80 90
100
Start Mid End Start Mid End Start Mid End
M6 North J8-9 M6 North J9-10 M6 North J10-10A
Ve
hic
les
Pe
r H
ou
r (V
PH
)
Link & Location
Average Hourly Weekend Flow 16-17/06/2012

Managed Motorways Compliance Support Hard Shoulder Abuse Final Report
Atkins Hard Shoulder Abuse Final Report | Version 1.0 | December 2012 P a g e | 30
At M6 J8-9 the schematics show that the 2/3m Advance Direction Sign for J9 may encourage users (legally) into what is a permanently open LBS1 (acting as a merge auxiliary lane for J8). Therefore HSA may occur as users continue down LBS1 beyond the end of the merge auxiliary lane. See Figure 31. That said the level of HSA is similar to that on J9-10 which does not have this signing anomaly.
Figure 31. M6 J8- J9 Northbound signing issue

Managed Motorways Compliance Support Hard Shoulder Abuse Final Report
Atkins Hard Shoulder Abuse Final Report | Version 1.0 | December 2012 P a g e | 31
M6 BBMM2 Southbound ‘B Carriageway’ Graphs
Figure 32 – Period 1 Weekday
*#N/A – No loop available for this position
Figure 33 – Period 2 Weekday
*#N/A – No loop available for this position
5 2 1 4 2 #N/A 3 2 3
0 10 20 30 40 50 60 70 80 90
100
End Mid Start End Mid Start End Mid Start
M6 South J9-8 M6 South J10-9 M6 South J10A-10
Ve
hic
les
Pe
r H
ou
r (V
PH
)
Link & Location
Average Hourly Weekday Flow 21-25/03/2011
13 8 7 7 5
#N/A 3 2 3
0 10 20 30 40 50 60 70 80 90
100
End Mid Start End Mid Start End Mid Start
M6 South J9-8 M6 South J10-9 M6 South J10A-10
Ve
hic
les
Pe
r H
ou
r (V
PH
)
Link & Location
Average Hourly Weekday Flow 06-10/06/2011
Managed Motorways Compliance Support Hard Shoulder Abuse Final Report
Atkins Hard Shoulder Abuse Final Report | Version 1.0 | December 2012 P a g e | 32
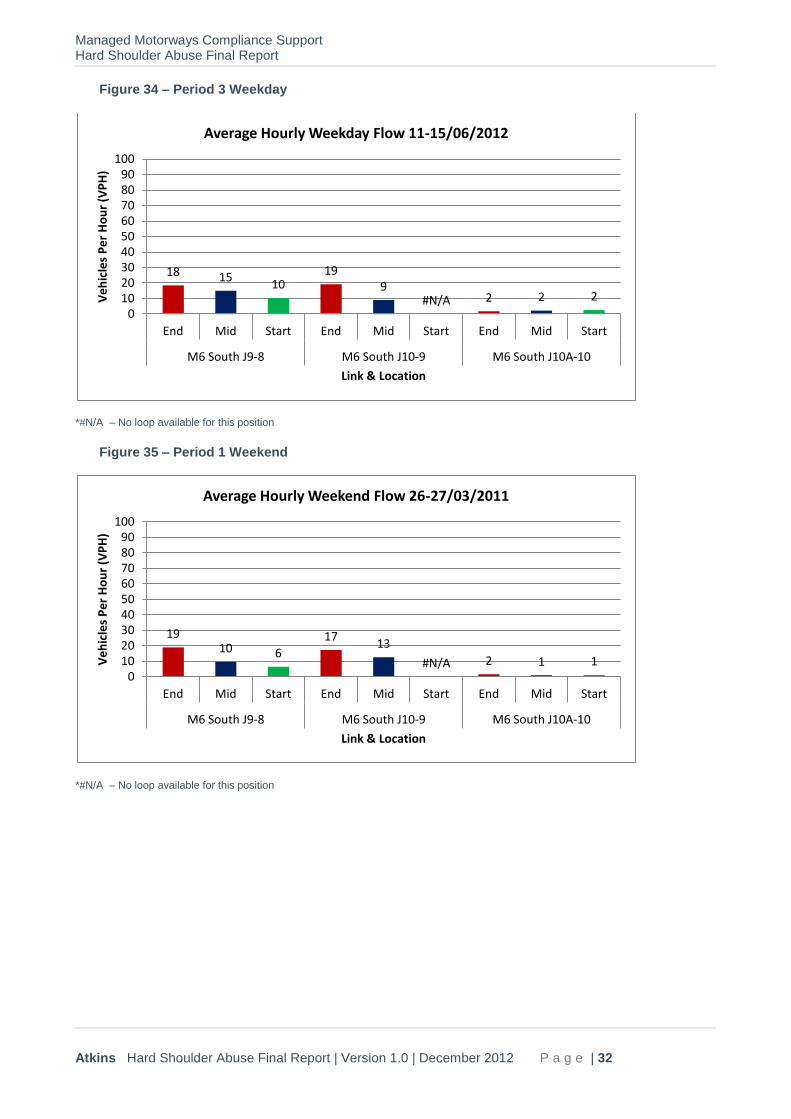
Figure 34 – Period 3 Weekday
*#N/A – No loop available for this position
Figure 35 – Period 1 Weekend
*#N/A – No loop available for this position
18 15 10
19 9
#N/A 2 2 2
0 10 20 30 40 50 60 70 80 90
100
End Mid Start End Mid Start End Mid Start
M6 South J9-8 M6 South J10-9 M6 South J10A-10
Ve
hic
les
Pe
r H
ou
r (V
PH
)
Link & Location
Average Hourly Weekday Flow 11-15/06/2012
19 10 6
17 13
#N/A 2 1 1 0
10 20 30 40 50 60 70 80 90
100
End Mid Start End Mid Start End Mid Start
M6 South J9-8 M6 South J10-9 M6 South J10A-10
Ve
hic
les
Pe
r H
ou
r (V
PH
)
Link & Location
Average Hourly Weekend Flow 26-27/03/2011

Managed Motorways Compliance Support Hard Shoulder Abuse Final Report
Atkins Hard Shoulder Abuse Final Report | Version 1.0 | December 2012 P a g e | 33
Figure 36 – Period 2 Weekend
*#N/A – No loop available for this position
Figure 37 – Period 3 Weekend
*#N/A – No loop available for this position
M6 BBMM2 Southbound ‘B Carriageway’ Observations
There is no start loop location for the J9 to J10 link.
The periods analysed for this scheme are different to M42 and BBMM1 and are in March 2011, June 2011 and June 2012.
The pattern of flows is consistent comparatively between locations between each period. However it should be noted that there seems to be a general trend for the flows to increase fairly uniformly between the earlier and later periods.
Hard shoulder flows on the weekend are consistently higher than during the week.
On the whole, levels of potential HSA are higher in BBMM2 than in the other schemes.
29
18 12
20 11
#N/A 2 1 2 0
10 20 30 40 50 60 70 80 90
100
End Mid Start End Mid Start End Mid Start
M6 South J9-8 M6 South J10-9 M6 South J10A-10
Ve
hic
les
Pe
r H
ou
r (V
PH
)
Link & Location
Average Hourly Weekend Flow 11-12/06/2011
19 26
19
40
22
#N/A 4 3 3
0 10 20 30 40 50 60 70 80 90
100
End Mid Start End Mid Start End Mid Start
M6 South J9-8 M6 South J10-9 M6 South J10A-10
Ve
hic
les
Pe
r H
ou
r (V
PH
)
Link & Location
Average Hourly Weekend Flow 16-17/06/2012

Managed Motorways Compliance Support Hard Shoulder Abuse Final Report
Atkins Hard Shoulder Abuse Final Report | Version 1.0 | December 2012 P a g e | 34
2.7. MIDAS data conclusions It is emphasised that a small number of the detections of vehicles using the hard shoulder will be legitimate users.
Table 6 shows lower and higher categorisations for each link. The boundary between higher and lower categorisations is based on the level of MIDAS-observed use across the range of periods studied, with a higher category being assumed to be associated with more than 10 uses per hour during more than one study period.
No inference should be made that links with “lower” HSA are not a concern for the Highways Agency or its maintenance contractors. Any HSA has the potential to be a causative factor in personal injury accidents, but the volume of HSA is not currently calibrated against HSA that may occur on traditional motorways.
This analysis supports the levels and patterns of potential HSA observed in the previous work carried out for the HA. The current work has supplemented and supported the previous work with more periods of analysis covering the last three years and the addition of analysis from BBMM2.
Table 6. Broad Categorisation of potential HSA
Link Description Carriageway Length (metres) Level of MIDAS observed potential HSA
ATM - M42 North J3A-4 A 2,210 Lower
ATM - M42 North J4-5 A 2,370 Lower
ATM - M42 North J5-6 A 3,740 Lower
ATM - M42 North J6-7 A 1,780 Higher
ATM - M42 South J4-3A B 1,790 Lower
ATM - M42 South J5-4 B 1,990 Lower
ATM - M42 South J6-5 B 3,860 Lower
ATM - M42 South J7-6 B 1,550 Higher
M6 BBMM1 - M6 North J4-4A A 3,260 Lower
M6 BBMM1 - M6 North J4A-5 A 1,580 Lower
M6 BBMM1 - M6 South J5-4A B 1,460 Higher
M6 BBMM2 - M6 North J8-9 A 670 Higher
M6 BBMM2 - M6 North J9-10 A 680 Higher
M6 BBMM2 - M6 North J10-10A A 3,650 Higher
M6 BBMM2 - M6 South J9-8 B 690 Higher
M6 BBMM2 - M6 South J10-9 B 660 Higher
M6 BBMM2 - M6 South J10A-10 B 4,020 Lower
Of particular interest, in the BBMM2 scheme, HSA flows are consistent comparatively between locations across each period but it should be noted that there is a general trend for the flows to increase between the earlier and later periods, flows on the weekend are consistently slightly higher than during the week and the levels of potential HSA appear to be higher in BBMM2 than in other schemes.
It is noted that length of link does not seem to directly affect the results as some longer links have low use and some have higher use. However the shortest links (690m long or less available hard shoulder) appear to have high levels of use.

Managed Motorways Compliance Support Hard Shoulder Abuse Final Report
Atkins Hard Shoulder Abuse Final Report | Version 1.0 | December 2012 P a g e | 35
2.8. Selective Time Profiles A sample of “higher priority” links was further analysed to understand how time of day affected the profile of potential HSA. Graphs are shown at Figures 38 to 40. Each figure is in two parts with the upper half showing uses per hour and the lower half showing percentage values.
2.8.1. M42 J6-J7 Time Profile
Figure 38. “A” carriageway J6 to J7 “End” Location– Period 1 Friday 26/03/2010

Managed Motorways Compliance Support Hard Shoulder Abuse Final Report
Atkins Hard Shoulder Abuse Final Report | Version 1.0 | December 2012 P a g e | 36
Figure 39. “B” carriageway J7 to J6 “Start” Location – Period 2 Friday 25/03/2011

Managed Motorways Compliance Support Hard Shoulder Abuse Final Report
Atkins Hard Shoulder Abuse Final Report | Version 1.0 | December 2012 P a g e | 37
2.8.2. M6 BBMM 2 Time Profile
Figure 40. “B” carriageway J10a to J10 “Mid Location” – Period 3 Friday 13/06/2012
2.9. Conclusions from Time Profiles
The potential HSA measured in the lunchtime periods inter-peak is not unexpected as this is where traffic volumes would remain reasonably high. Maintainers take specific precautions in these periods.
An important and somewhat unexpected finding is the level of HSA that can potentially occur in the small hours of the morning and also in the hours after the early evening peak.

Managed Motorways Compliance Support Hard Shoulder Abuse Final Report
Atkins Hard Shoulder Abuse Final Report | Version 1.0 | December 2012 P a g e | 38
3. CCTV review
3.1. Introduction An off-duty traffic officer was made available to carry out focussed reviews of recorded CCTV video images.
Atkins supplied a proforma to allow consistent recording of observations. Atkins also supplied MIDAS data for a number of days to as ensure that the reviewer had “flags” to fast forward to relevant time periods. The Highways Agency project sponsor tagged the CCTV images so that the images would be preserved for 30 days rather than the default 7 days retention period.
3.2. Sample Size The sample size is all uses of the hard shoulder recorded between specified periods on selective links of M6 MMBB2 as shown in Table 7. A single hard shoulder monitoring camera on each link was used – locations are shown at Figure 41. The periods in which HSR was in operation were obtained from the HALOGEN database (Table 7). In total 1138 uses of the hard shoulder were recorded across the survey period with only 40 of these being classed as legitimate use.
Table 7. Links and Days Observed
Link Date Day AM PM
HS Open
HS Close
HS Open
HS Close
M6 North J9-10 28/09/2012 Friday (24 hours)
07:16 09:39 11:58 19:28
M6 North J8-9 07/11/2012 Wednesday (selective times)
- - 07:05 19:35
08/11/2012 Thursday (selective times)
07:27 10:34 11:18 19:24
M6 South J10-9 07/11/2012 Wednesday (selective times)
- - 07:07 19:34
08/11/2012 Thursday (selective times)
07:31 10:32 11:33 17:47
Observations for the 28th September were conducted over a 24 hour period, enabling this analysis to present
whether HSA varied across a full day and night.
The data for the 7th and 8
th of November were collected in the hours before and after HSR was in operation,
and did not cover the overnight period.

Managed Motorways Compliance Support Hard Shoulder Abuse Final Report
Atkins Hard Shoulder Abuse Final Report | Version 1.0 | December 2012 P a g e | 39
Figure 41. Cameras Locations on M6

Managed Motorways Compliance Support Hard Shoulder Abuse Final Report
Atkins Hard Shoulder Abuse Final Report | Version 1.0 | December 2012 P a g e | 40
3.3. Platoons It was thought useful to estimate whether vehicles were likely to be travelling in a platoon so understand if behaviour of ‘follow the leader’ is prevalent or not.
The time that a vehicle was observed was generally rounded to the nearest minute. It is not possible to make robust conclusions from times recorded by rounding, but an estimate is possible by assessing vehicles that were observed within the same minute as being potentially part of a platoon. The use of a single camera does not allow tracking of a full vehicle path through a link and is another limitation.
From the sample size of 1138 vehicles using the hard shoulder, when considering vehicles travelling in platoons, the actual number of individual cases of HSA is approximately 660. This can only be considered as
Managed Motorways Compliance Support Hard Shoulder Abuse Final Report
Atkins Hard Shoulder Abuse Final Report | Version 1.0 | December 2012 P a g e | 41
a very broad estimation of platooning effects, but is sufficient to show that if driver behaviour can be modified for lead vehicles then HSA would likely reduce significantly.
3.4. MIDAS correlation For the 28
th September on junction 9-10 Northbound link, MIDAS recorded 367 uses of the hard shoulder
during the 24 hour period. Manual CCTV observations recorded 385 uses across the same time period with 384 cases of HSA.
This represents a high correlation between the two methods. CCTV would tend to pick up slightly more HSA than MIDAS, for example short lived drifting or travelling in LBS1 that “missed” a loop.
3.5. Details of recorded HSA Tables 8 to 10 provide analysis of CCTV data. The extreme right columns display how the data links
together. For example the total Hard Shoulder Abuse is made up of the totals of single vehicles, those
following a platoon and those heading a platoon. Hard shoulder abuse is equal to “total observed” minus the
legitimate use. Individual HSA cases are the sum of number of vehicles heading a platoon and single
vehicles.

Managed Motorways Compliance Support Hard Shoulder Abuse Final Report
Atkins Hard Shoulder Abuse Final Report | Version 1.0 | December 2012 P a g e | 42
Table 8. Data from Junctions 8-9 northbound on the 7th and 8th November
Total Observed 342 Vehicle Class Cars HGVs LGVs Others Total 7th November 134 9 8 0 151 8th November 122 35 32 2 191
Total Observed 256 44 40 2 342
Legitimate Use Cars HGVs LGVs Others Total
7th November 9 1 2 0 12
8th November 4 5 1 0 10
Total Observed 13 6 3 0 22
Hard Shoulder Abuse Cars HGVs LGVs Others Total
7th November 125 8 6 0 139
8th November 118 30 31 2 181
Total Observed 243 38 37 2 320
Heading a Platoon Cars HGVs LGVs Others Total
7th November 34 1 0 0 35
8th November 24 4 7 0 35
Total Observed 58 5 7 0 70
Following a Platoon Cars HGVs LGVs Others Total
7th November 65 1 0 0 66
8th November 74 25 19 0 118
Total Observed 139 26 19 0 184
Single Vehicles Cars HGVs LGVs Others Total
7th November 24 5 5 0 34
8th November 22 2 6 2 32
Total Observed 46 7 11 2 66
Individual Cases of HSA Cars HGVs LGVs Others Total
7th November 58 6 5 0 69
8th November 46 6 13 2 67
Total Observed 104 12 18 2 136

Managed Motorways Compliance Support Hard Shoulder Abuse Final Report
Atkins Hard Shoulder Abuse Final Report | Version 1.0 | December 2012 P a g e | 43
Table 9. Data from Junctions 10-9 southbound on the 7th and 8th November
Total Observed 413 Vehicle Class Cars HGVs LGVs Others Total 7th November 246 26 67 0 339 8th November 67 5 2 0 74
Total Observed 313 31 69 0 413
Legitimate Use Cars HGVs LGVs Others Total
7th November 15 1 4 0 20
8th November 3 1 0 0 4
Total Observed 18 2 4 0 24
Hard Shoulder Abuse
7th November 231 25 63 0 319
8th November 64 4 2 0 70
Total Observed 295 29 65 0 389
Heading a Platoon
7th November 18 5 9 0 32
8th November 13 1 0 0 14
Total Observed 31 6 9 0 46
Following a Platoon
7th November 186 14 48 0 248
8th November 24 1 0 0 25
Total Observed 210 15 48 0 273
Single Vehicles
7th November 27 6 6 0 39
8th November 27 2 2 0 31
Total Observed 54 8 8 0 70
Individual Cases of HSA
7th November 45 11 15 0 71
8th November 40 3 2 0 45
Total Observed 85 14 17 0 116

Managed Motorways Compliance Support Hard Shoulder Abuse Final Report
Atkins Hard Shoulder Abuse Final Report | Version 1.0 | December 2012 P a g e | 44
Table 10. Data from Junctions 9-10 Northbound on the 28th September
Total Observed 385
Vehicle Class Cars HGVs LGVs Others Total
28th September 221 87 75 2 385
Legitimate Use
28th September 0 0 1 0 1
Hard Shoulder Abuse
28th September 221 87 74 2 384
Heading a Platoon
28th September 51 10 16 0 77
Following a Platoon
28th September 91 12 27 0 130
Single Vehicles
28th September 83 61 33 0 177
Individual Cases of HSA
28th September 134 71 49 0 254
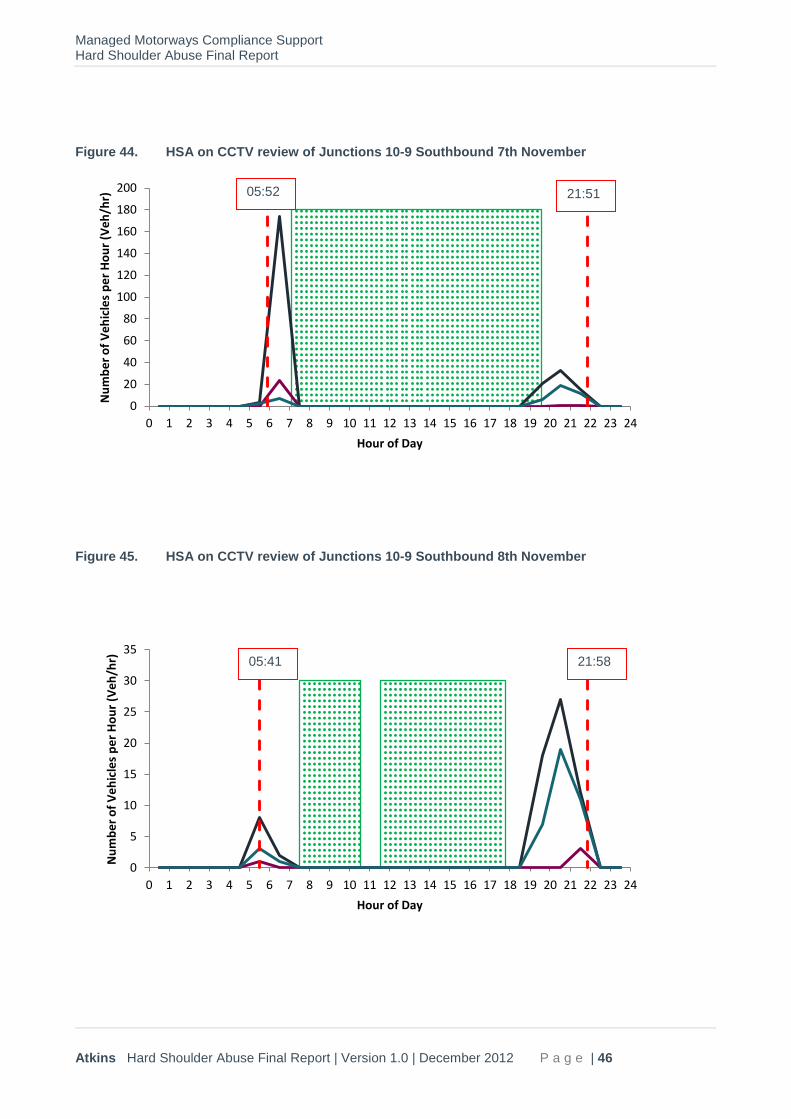
3.6. Graphical Representations of CCTV data The tabulated data (Tables 8-10) shows total recorded incidences across the days in the analysis. These incidences were further broken down into incidences per hour and compared against the time periods in which HSR was in operation. Numbers of cars committing HSA are compared to individual cases that take out the effect of platoons for each day observed. These values omit the vehicles using the hard shoulder for legitimate reasons; the tabulated data shows this would only account for 40 out of 1138 cases observed. HGVs have been included as a comparison, where their lower volume means that they are less likely to form platoons. Total individual cases involving Cars, LGVs and HGVs were found to follow a similar pattern to the numbers of cars committing HSA, and so the total has been omitted from the graphs, as a similar pattern of results is already apparent. Figures 42 to 46 use the following key:
HSR Open Times Review times
Cars Committing HSA HGVs Committing HSA
Cars minus Platoons

Managed Motorways Compliance Support Hard Shoulder Abuse Final Report
Atkins Hard Shoulder Abuse Final Report | Version 1.0 | December 2012 P a g e | 45
Figure 42. HSA on CCTV review of Junctions 8-9 Northbound 7th November
Figure 43. HSA on CCTV review of Junctions 8-9 Northbound 8th November
0
10
20
30
40
50
60
0 1 2 3 4 5 6 7 8 9 10 11 12 13 14 15 16 17 18 19 20 21 22 23 24
Nu
mb
er
of
Ve
hic
les
pe
r H
ou
r (V
eh
/hr)
Hour of Day
0
10
20
30
40
50
60
0 1 2 3 4 5 6 7 8 9 10 11 12 13 14 15 16 17 18 19 20 21 22 23 24
Nu
mb
er
of
Ve
hic
les
pe
r H
ou
r (V
eh
/hr)
Hour of Day
19:37 05:33
05:30 22:00
Managed Motorways Compliance Support Hard Shoulder Abuse Final Report
Atkins Hard Shoulder Abuse Final Report | Version 1.0 | December 2012 P a g e | 46
Figure 44. HSA on CCTV review of Junctions 10-9 Southbound 7th November
Figure 45. HSA on CCTV review of Junctions 10-9 Southbound 8th November
0
20
40
60
80
100
120
140
160
180
200
0 1 2 3 4 5 6 7 8 9 10 11 12 13 14 15 16 17 18 19 20 21 22 23 24
Nu
mb
er
of
Ve
hic
les
pe
r H
ou
r (V
eh
/hr)
Hour of Day
0
5
10
15
20
25
30
35
0 1 2 3 4 5 6 7 8 9 10 11 12 13 14 15 16 17 18 19 20 21 22 23 24
Nu
mb
er
of
Ve
hic
les
pe
r H
ou
r (V
eh
/hr)
Hour of Day
21:51 05:52
05:41 21:58

Managed Motorways Compliance Support Hard Shoulder Abuse Final Report
Atkins Hard Shoulder Abuse Final Report | Version 1.0 | December 2012 P a g e | 47
Figure 46. HSA on CCTV review of Junctions 9-10 Northbound 28th September
0
10
20
30
40
50
60
0 1 2 3 4 5 6 7 8 9 10 11 12 13 14 15 16 17 18 19 20 21 22 23 24
Nu
mb
er
of
Ve
hic
les
pe
r H
ou
r (V
eh
/hr)
Hour of Day

Managed Motorways Compliance Support Hard Shoulder Abuse Final Report
Atkins Hard Shoulder Abuse Final Report | Version 1.0 | December 2012 P a g e | 48
4. Conclusions
This project has reviewed HSA levels on the M42 MM and M6 BBMM Phase 1 and Phase 2 schemes during periods when the hard shoulder is for emergency use only. M6 BBMM Phase 1 has lower amounts of HSA than M6 BBMM Phase 2 and M42 MM. The use of MIDAS data from hard shoulder loops gives a strong correlation with the amount of Hard Shoulder Abuse and is a valid method for any future monitoring work where loops exist in the hard shoulder.
From limited CCTV analysis and an approximation measure of platooning, it is apparent that platooning is likely to be a significant proportion of all cases of HSA.
Any HSA has the potential to be a causative factor in personal injury accidents, but the volume of HSA is not currently calibrated against HSA that may occur on traditional motorways.
Until such time as a comparison is available to compare measured HSA at Managed Motorways to any HSA at non-Managed Motorways (standard motorways and controlled motorways) it is not possible to conclude that HSA, as matter of course, is worse at Managed Motorway sites when compared to standard motorways. Nevertheless the levels of HSA observed at many of the Managed Motorway links indicate that the current regime of mitigation measures is justified and that work to consider the merit of additional mitigation measures should be programmed.
The levels of HSA vary from link to link. Managed Motorways have similar design standards and appearance and so it is not apparent what key issues would influence the amount of HSA, although there is evidence that shorter links (less than 700m long) have higher levels of HSA.
HSA occurs at the start, end and middle of links. Although not exclusively the case, HSA is normally higher at the end of links near the diverge junction. HSA at the start and middle of links is often of a similar order of magnitude.
The highest levels of HSA were found during the periods of high demand, inter-peak, when HSR was not in operation. An important and somewhat unexpected finding is the level of HSA that can potentially occur in the small hours of the morning.
At M6 J8-9 northbound the scheme layout schematic drawings show that the 2/3m Advance Direction Sign for J9 may encourage users (legally) into what is a permanently open LBS1 (acting as a merge auxiliary lane for J8). Therefore HSA may occur as users continue down LBS1 beyond the end of the merge auxiliary lane. It is however noted that J9-10 (also a short link) which does not have this anomaly has very similar levels of HSA. Short links would appear to “encourage” HSA.
Managed Motorways Compliance Support Hard Shoulder Abuse Final Report
Atkins Hard Shoulder Abuse Final Report | Version 1.0 | December 2012 P a g e | 49
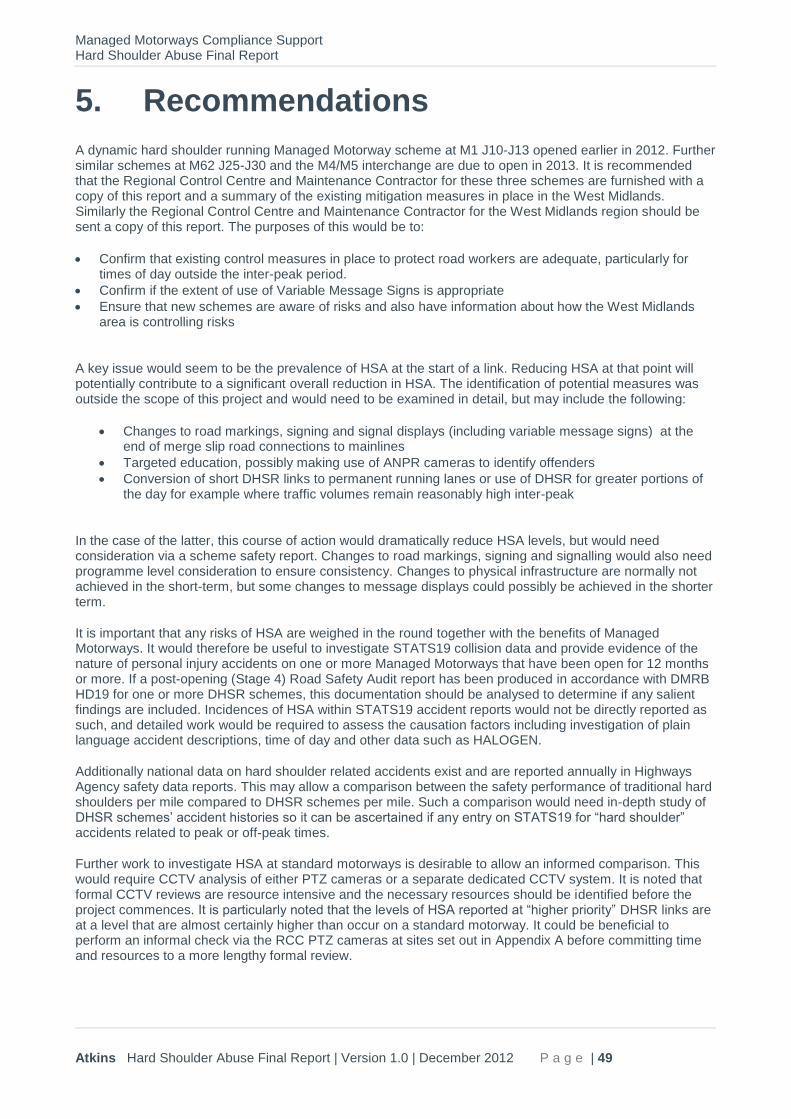
5. Recommendations
A dynamic hard shoulder running Managed Motorway scheme at M1 J10-J13 opened earlier in 2012. Further similar schemes at M62 J25-J30 and the M4/M5 interchange are due to open in 2013. It is recommended that the Regional Control Centre and Maintenance Contractor for these three schemes are furnished with a copy of this report and a summary of the existing mitigation measures in place in the West Midlands. Similarly the Regional Control Centre and Maintenance Contractor for the West Midlands region should be sent a copy of this report. The purposes of this would be to:
Confirm that existing control measures in place to protect road workers are adequate, particularly for times of day outside the inter-peak period.
Confirm if the extent of use of Variable Message Signs is appropriate
Ensure that new schemes are aware of risks and also have information about how the West Midlands area is controlling risks
A key issue would seem to be the prevalence of HSA at the start of a link. Reducing HSA at that point will potentially contribute to a significant overall reduction in HSA. The identification of potential measures was outside the scope of this project and would need to be examined in detail, but may include the following:
Changes to road markings, signing and signal displays (including variable message signs) at the end of merge slip road connections to mainlines
Targeted education, possibly making use of ANPR cameras to identify offenders
Conversion of short DHSR links to permanent running lanes or use of DHSR for greater portions of the day for example where traffic volumes remain reasonably high inter-peak
In the case of the latter, this course of action would dramatically reduce HSA levels, but would need consideration via a scheme safety report. Changes to road markings, signing and signalling would also need programme level consideration to ensure consistency. Changes to physical infrastructure are normally not achieved in the short-term, but some changes to message displays could possibly be achieved in the shorter term.
It is important that any risks of HSA are weighed in the round together with the benefits of Managed Motorways. It would therefore be useful to investigate STATS19 collision data and provide evidence of the nature of personal injury accidents on one or more Managed Motorways that have been open for 12 months or more. If a post-opening (Stage 4) Road Safety Audit report has been produced in accordance with DMRB HD19 for one or more DHSR schemes, this documentation should be analysed to determine if any salient findings are included. Incidences of HSA within STATS19 accident reports would not be directly reported as such, and detailed work would be required to assess the causation factors including investigation of plain language accident descriptions, time of day and other data such as HALOGEN.
Additionally national data on hard shoulder related accidents exist and are reported annually in Highways Agency safety data reports. This may allow a comparison between the safety performance of traditional hard shoulders per mile compared to DHSR schemes per mile. Such a comparison would need in-depth study of DHSR schemes’ accident histories so it can be ascertained if any entry on STATS19 for “hard shoulder” accidents related to peak or off-peak times.
Further work to investigate HSA at standard motorways is desirable to allow an informed comparison. This would require CCTV analysis of either PTZ cameras or a separate dedicated CCTV system. It is noted that formal CCTV reviews are resource intensive and the necessary resources should be identified before the project commences. It is particularly noted that the levels of HSA reported at “higher priority” DHSR links are at a level that are almost certainly higher than occur on a standard motorway. It could be beneficial to perform an informal check via the RCC PTZ cameras at sites set out in Appendix A before committing time and resources to a more lengthy formal review.

Managed Motorways Compliance Support Hard Shoulder Abuse Final Report
Atkins Hard Shoulder Abuse Final Report | Version 1.0 | December 2012 P a g e | 50

Appendices
Managed Motorways Compliance Support Hard Shoulder Abuse Final Report
Atkins Hard Shoulder Abuse Final Report | Version 1.0 | December 2012 P a g e | 52
Appendix A. Selection of standard motorway for comparison
A.1. Introduction This Appendix outlines the reasoning and the recommended locations where analysis of hard shoulder abuse (HSA) should be carried out on motorways which do not feature hard shoulder running (HSR).
The analysis of HSA on a ‘standard’ motorway (one without HSR) is required to compare the findings of the HSA study on managed motorways with HSR.
The purpose of the previous analysis of motorways featuring HSR was to determine the number of vehicles using the hard shoulder on MM schemes where signals do not permit such use i.e. outside congested periods.
In order to compare like with like, it is necessary to identify ‘standard’ motorways which suffer similar levels of congestion to motorways which have had HSR schemes installed.
The Department for Transport’s document entitled “Investment in Highways Transport Schemes”, published in 2010, outlines a number of proposed managed motorways featuring HSR. These are all major schemes and have been selected to address known regular and significant congestion.
There are a number of schemes featuring HSR proposals which are not due to be constructed until after 2013. These are the locations which will offer the opportunity to identify levels of HSA in traffic conditions which are comparable to existing managed motorways with HSR. They are as follows:
M25 J5 to J6/J7 Managed Motorway with hard shoulder running
M25 J23 to J27 Managed Motorway with hard shoulder running - (This scheme was identified for acceleration in the Chancellor's statement of November 2011. Funding has been made available to bring forward the start of works.)
M1 J28 to J31 Managed Motorway with hard shoulder running
M60 J8 to J12 Managed Motorway with hard shoulder running
M62 J18 to J20 Managed Motorway with hard shoulder running
M1 J39 to J42 Managed Motorway with hard shoulder running
The presence of CCTV cameras is required in order to observe any HSA that takes place, street lighting is also required to ensure that HSA events can be observed during darkness. Presence of CCTV cameras and street lighting has been reviewed and typical views from a camera in each scheme have been included in section A.2.
In order to confirm the existence of congestion in these locations, MTV plots have been reviewed and can be seen in section A.3.
Managed Motorways Compliance Support Hard Shoulder Abuse Final Report
Atkins Hard Shoulder Abuse Final Report | Version 1.0 | December 2012 P a g e | 53
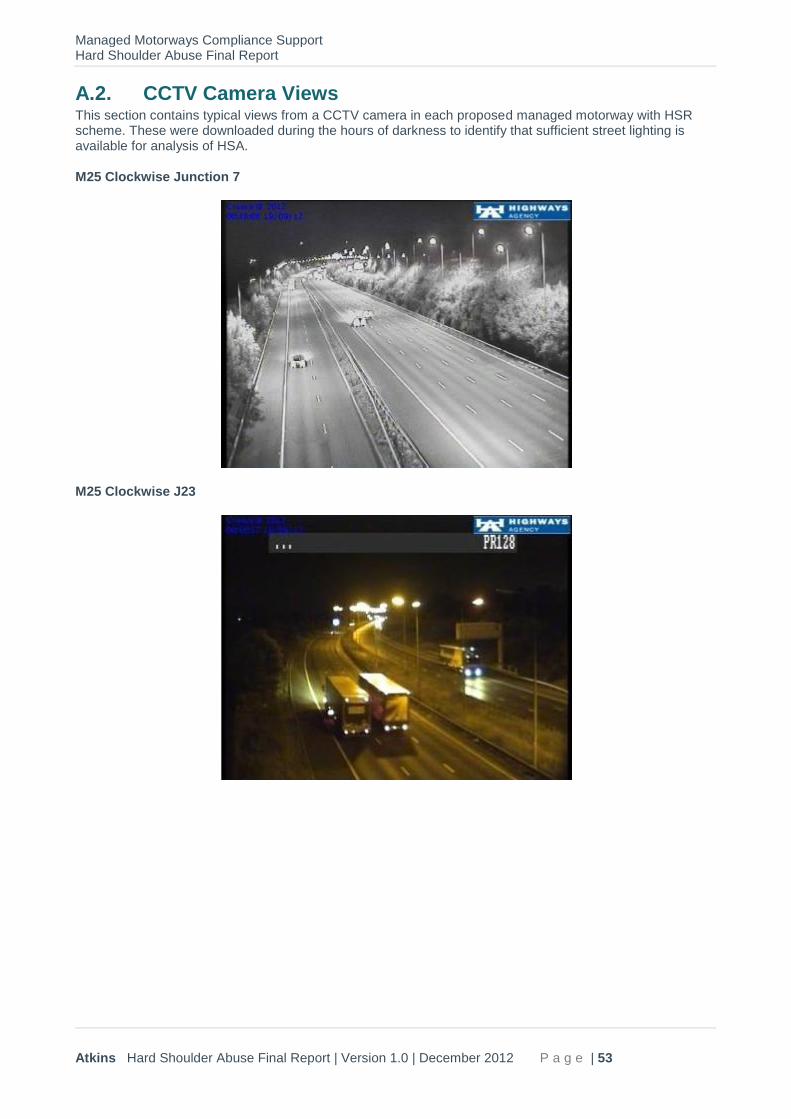
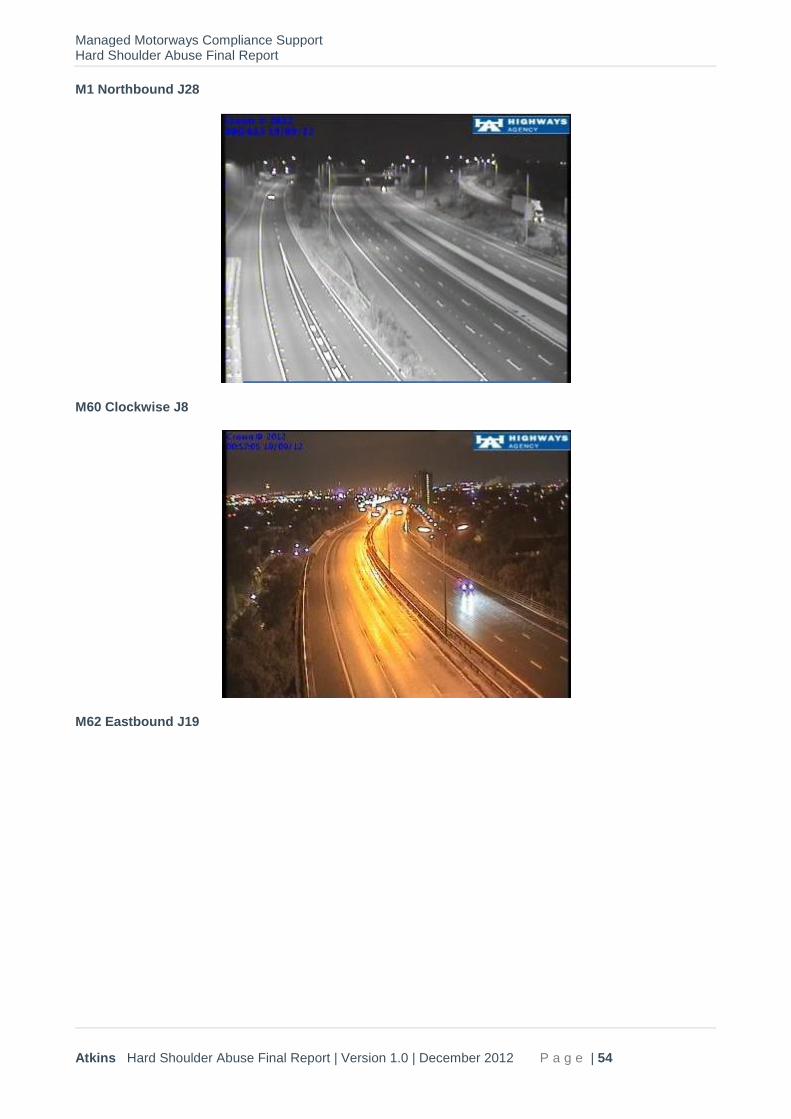
A.2. CCTV Camera Views This section contains typical views from a CCTV camera in each proposed managed motorway with HSR scheme. These were downloaded during the hours of darkness to identify that sufficient street lighting is available for analysis of HSA.
M25 Clockwise Junction 7
M25 Clockwise J23
Managed Motorways Compliance Support Hard Shoulder Abuse Final Report
Atkins Hard Shoulder Abuse Final Report | Version 1.0 | December 2012 P a g e | 54
M1 Northbound J28
M60 Clockwise J8
M62 Eastbound J19

Managed Motorways Compliance Support Hard Shoulder Abuse Final Report
Atkins Hard Shoulder Abuse Final Report | Version 1.0 | December 2012 P a g e | 55
M1 Northbound J40

Managed Motorways Compliance Support Hard Shoulder Abuse Final Report
Atkins Hard Shoulder Abuse Final Report | Version 1.0 | December 2012 P a g e | 56
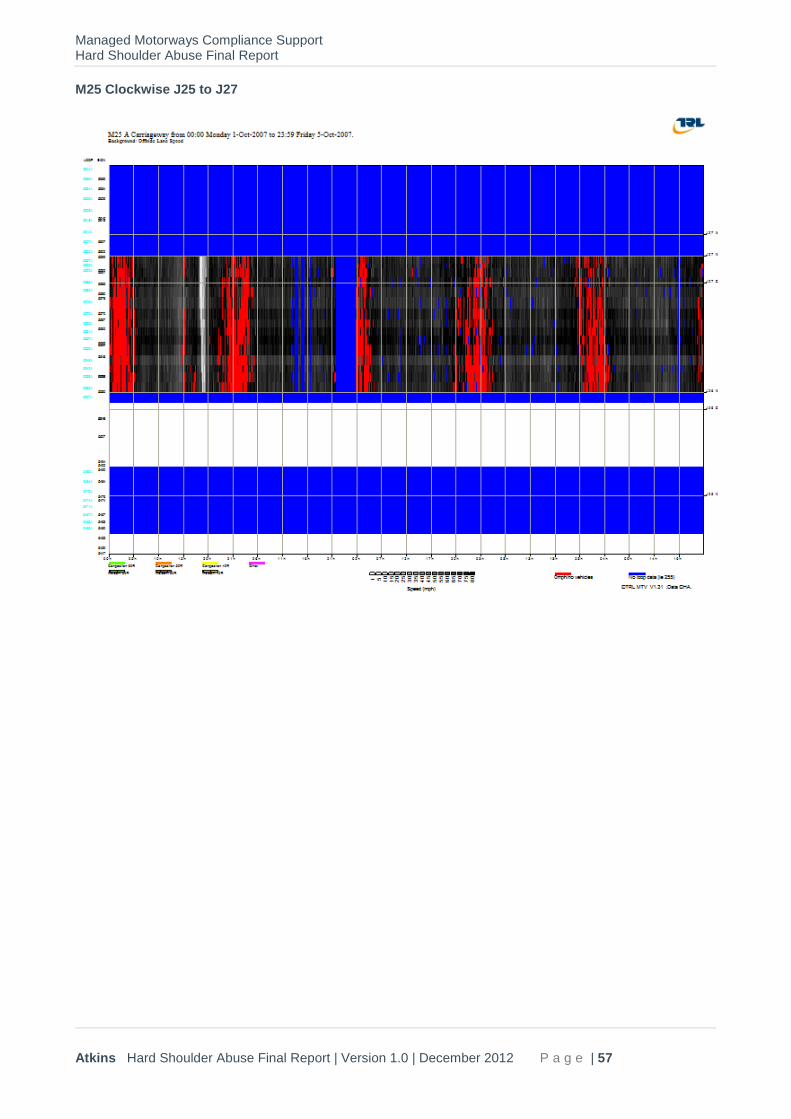
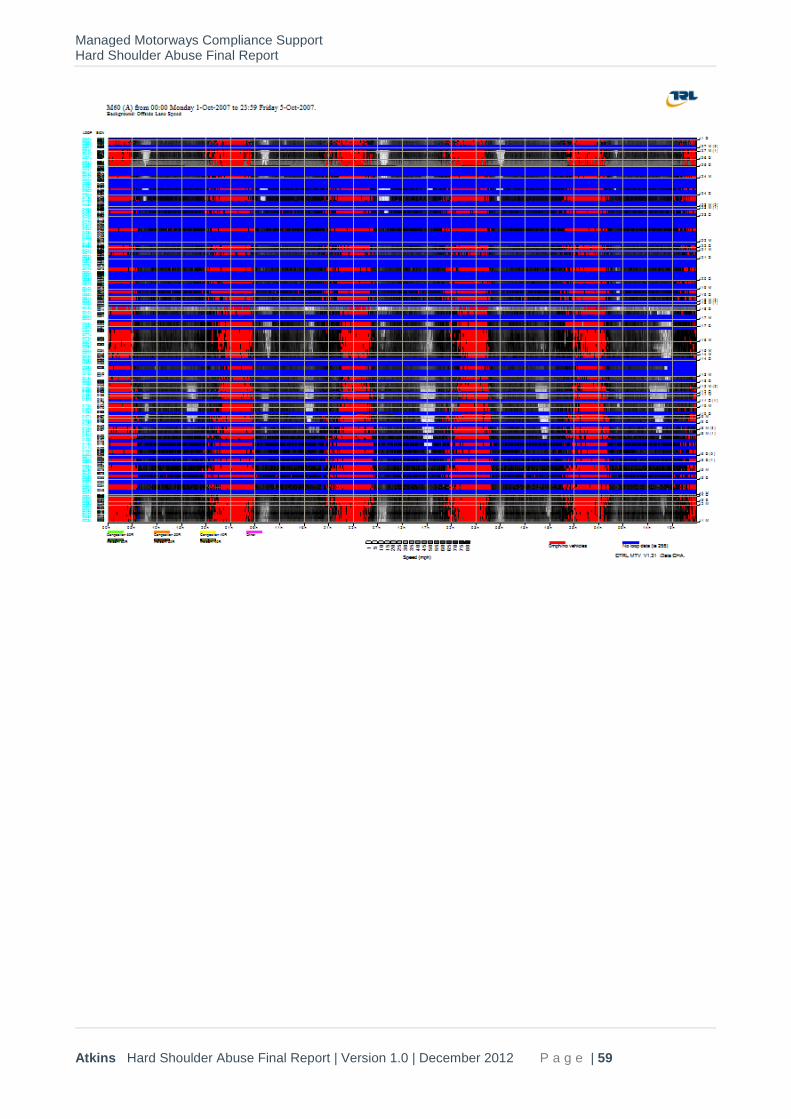
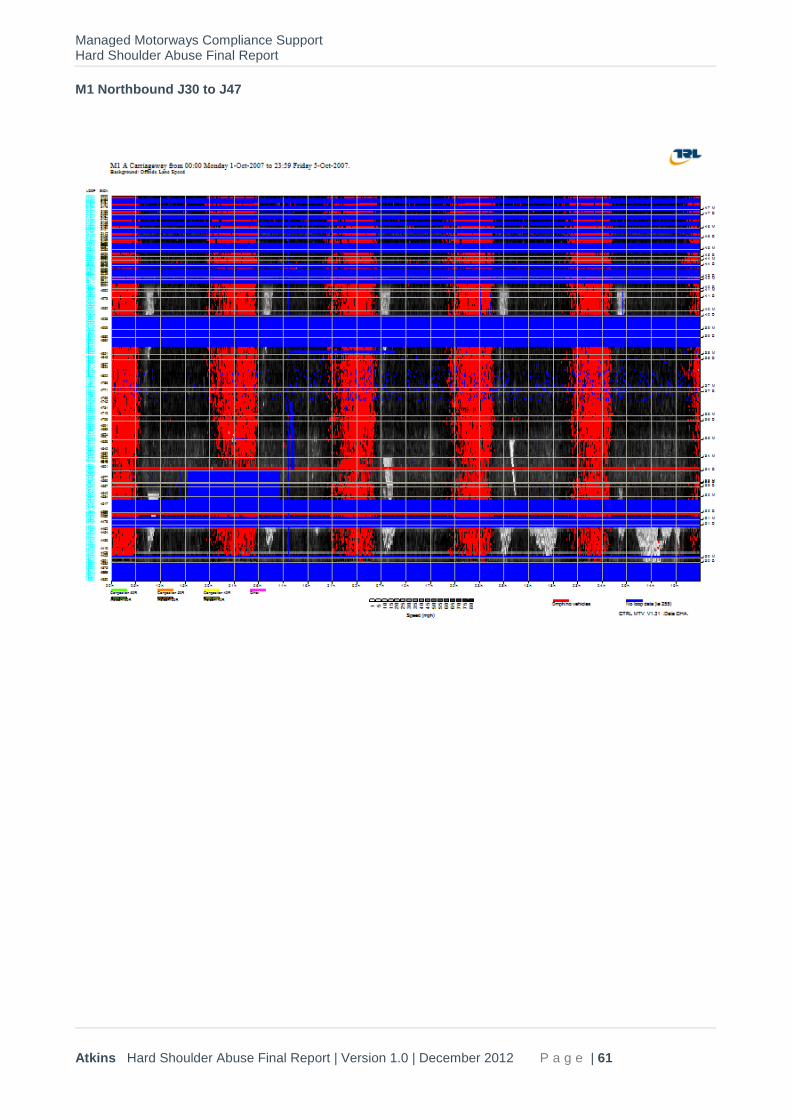
A.3. MTV Plots Traffic data from the schemes has been reviewed to identify if the congestion occurs regularly in that location. The data comes from MIDAS and is presented graphically in the form of MTV plots. It is necessary to ensure that congestion occurs on a regular basis so that staff analysing the CCTV footage can be used most effectively; this is on the basis that the motivation for HSA is likely to be congestion.
M25 Clockwise J6 to J14
Managed Motorways Compliance Support Hard Shoulder Abuse Final Report
Atkins Hard Shoulder Abuse Final Report | Version 1.0 | December 2012 P a g e | 57
M25 Clockwise J25 to J27

Managed Motorways Compliance Support Hard Shoulder Abuse Final Report
Atkins Hard Shoulder Abuse Final Report | Version 1.0 | December 2012 P a g e | 58
M1 Northbound J28 to J31
Managed Motorways Compliance Support Hard Shoulder Abuse Final Report
Atkins Hard Shoulder Abuse Final Report | Version 1.0 | December 2012 P a g e | 59

Managed Motorways Compliance Support Hard Shoulder Abuse Final Report
Atkins Hard Shoulder Abuse Final Report | Version 1.0 | December 2012 P a g e | 60
M62 Eastbound J15 to J22
Managed Motorways Compliance Support Hard Shoulder Abuse Final Report
Atkins Hard Shoulder Abuse Final Report | Version 1.0 | December 2012 P a g e | 61
M1 Northbound J30 to J47

Managed Motorways Compliance Support Hard Shoulder Abuse Final Report
Atkins Hard Shoulder Abuse Final Report | Version 1.0 | December 2012 P a g e | 62
A.4. Results & Conclusions
The results of the analysis have been tabulated below, showing whether regular, significant congestion has been observed and the availability of CCTV coverage in the area.
Table A1. Suitability of potential locations
Location HA area Congestion confirmed CCTV coverage with street lighting
M25 J5 to J6/J7 Area 5 Congestion not regular. Partial street lighting
M25 J23 to J27 Area 5 Congestion not regular. Yes
M1 J28 to J31 Area 12 Congestion not regular Partial street lighting
M60 J8 to J12 Area 10 Regular and significant congestion
Yes
M62 J18 to J20 Area 10 Congestion not regular Yes
M1 J39 to J42 Area 12 Regular and significant congestion
No street lighting
From the selected sample, there is only one location that has been identified that has good CCTV availability, street lighting and predictable congestion.
It is therefore recommended that any CCTV analysis of HSA on ‘standard’ motorways is conducted on a portion of the M60 Clockwise from J8 to J12. The extent of review is subject to resource availability and funding.
Further in this location’s favour, this section of road has the most CCTV cameras available from all of the areas reviewed which also have street lighting and the best MIDAS coverage.
It is further noted that the full range of non-HSR CCTV surveys of HSA would ideally additionally cover a sample of:
Controlled motorways (i.e. those with overhead red ring variable speed limit aspects)
Links on approaches to operational HSR schemes
A.5. Further Refinement of Selected Site
A review of the cameras available on the M60 J8 to J12 has taken place. All of the links on the M60 clockwise between J8 and J12 are busy and suffer regular severe congestion. Anti clockwise is not so congested or predictable so as useful for research purposes.

Managed Motorways Compliance Support Hard Shoulder Abuse Final Report
Atkins Hard Shoulder Abuse Final Report | Version 1.0 | December 2012 P a g e | 63
Table A2. Suitability of locations M60 J8-12
Link Approx Length
Number of Cameras
Coverage of Start of Link?
Coverage of End of Link?
Comments Suitable for Analysis?
M60 J8 to J9 1.4 km 1 No Yes J8 Not Quite Visible
Yes
M60 J9 to J10 0.8 km 2 Yes Yes Not quite complete coverage because of street furniture.
Yes
M60 J10 to J11 1.3 km 2 Yes No Very narrow hatched out HS over Barton Bridge.
Maybe
M60 J11 to J12 0.6 km 1 Yes No Short link with reasonable coverage, but street furniture obscures much of the view. Queuing traffic will obscure the view of the HS.
Maybe
Useful Cameras:
M60 J11 facing anticlockwise at 18/4A: Preset: ‘South’
M60 J11 facing clockwise at 18/4A: Preset: ‘North’
M60 J10 facing clockwise at 17/2A: Preset: ‘North’
M60 J10 facing anticlockwise at 17/2A: Preset: ‘South’
M60 J10 facing anticlockwise at 16/5B: Preset: ‘South’
M60 J10 facing clockwise at 16/5B: Preset: ‘North’
M60 J9 facing clockwise at 15/3B: Preset: ‘North’
M60 J9 facing anticlockwise at 15/3B: Preset: ‘South’
M60 J9 facing anticlockwise at 15/0B: Preset: ‘South’
M60 J9 facing clockwise at 15/0B: Preset: ‘North’
M60 J8 to J9 facing anticlockwise at 14/2A: Preset: ‘South’
M60 J8 to J9 facing clockwise: Preset at 14/2A: Preset ‘Home’ (North)

Managed Motorways Compliance Support Hard Shoulder Abuse Final Report
Atkins Hard Shoulder Abuse Final Report | Version 1.0 | December 2012 P a g e | 64
M60 J8 to J12 Location of CCTV Cameras.
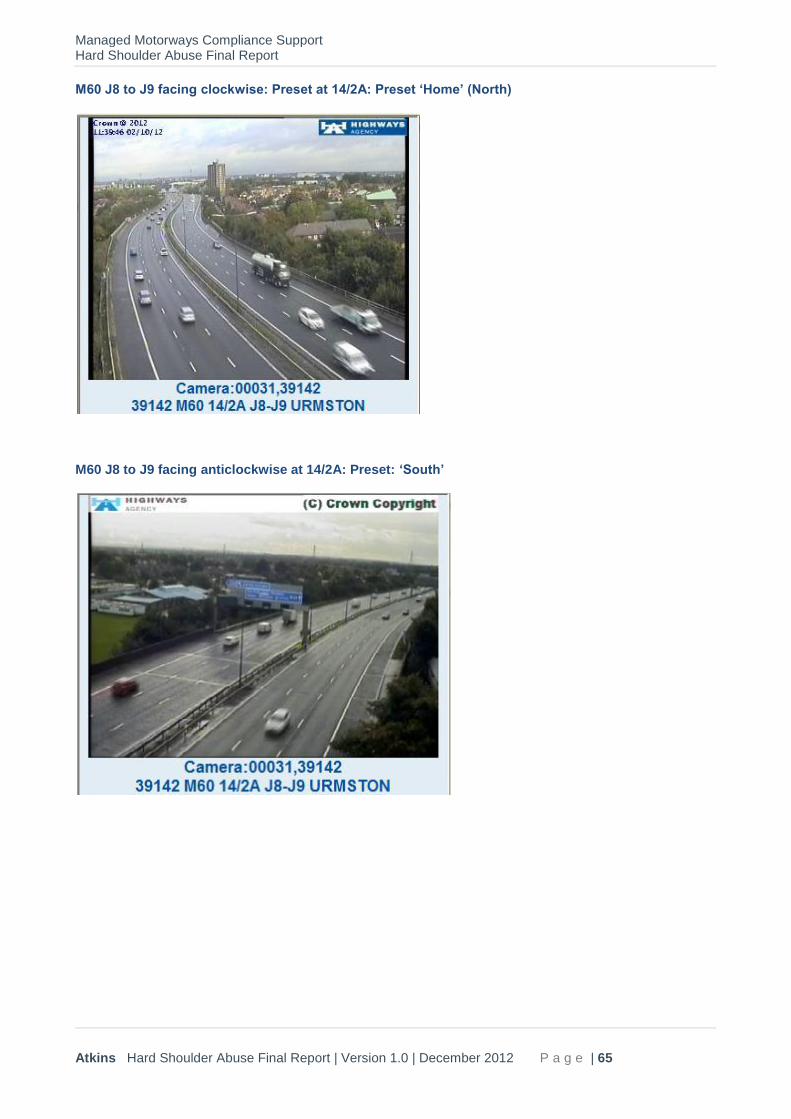
Managed Motorways Compliance Support Hard Shoulder Abuse Final Report
Atkins Hard Shoulder Abuse Final Report | Version 1.0 | December 2012 P a g e | 65
M60 J8 to J9 facing clockwise: Preset at 14/2A: Preset ‘Home’ (North)
M60 J8 to J9 facing anticlockwise at 14/2A: Preset: ‘South’

Managed Motorways Compliance Support Hard Shoulder Abuse Final Report
Atkins Hard Shoulder Abuse Final Report | Version 1.0 | December 2012 P a g e | 66
M60 J9 facing clockwise at 15/0B: Preset: ‘North’
M60 J9 facing anticlockwise at 15/0B: Preset: ‘South’

Managed Motorways Compliance Support Hard Shoulder Abuse Final Report
Atkins Hard Shoulder Abuse Final Report | Version 1.0 | December 2012 P a g e | 67
M60 J9 facing anticlockwise at 15/3B: Preset: ‘South’
M60 J9 facing clockwise at 15/3B: Preset: ‘North’

Managed Motorways Compliance Support Hard Shoulder Abuse Final Report
Atkins Hard Shoulder Abuse Final Report | Version 1.0 | December 2012 P a g e | 68
M60 J10 facing clockwise at 16/5B: Preset: ‘North’
M60 J10 facing anticlockwise at 16/5B: Preset: ‘South’

Managed Motorways Compliance Support Hard Shoulder Abuse Final Report
Atkins Hard Shoulder Abuse Final Report | Version 1.0 | December 2012 P a g e | 69
M60 J10 facing anticlockwise at 17/2A: Preset: ‘South’
M60 J10 facing clockwise at 17/2A: Preset: ‘North’

Managed Motorways Compliance Support Hard Shoulder Abuse Final Report
Atkins Hard Shoulder Abuse Final Report | Version 1.0 | December 2012 P a g e | 70
M60 J11 facing clockwise at 18/4A: Preset: ‘North’
M60 J11 facing anticlockwise at 18/4A: Preset: ‘South’

© Atkins Ltd except where stated otherwise. The Atkins logo, ‘Carbon Critical Design’ and the strapline ‘Plan Design Enable’ are trademarks of Atkins Ltd.