hardness and the properties of pm materials measured … · hardness and the properties of pm...
TRANSCRIPT
Powder Metallurgy Progress, Vol.15 (2015), No 2 234
HARDNESS AND THE PROPERTIES OF PM MATERIALS MEASURED IN TENSION
J. R. Moon
Abstract A review is presented of the fundamental physics underlying the practice and interpretation of hardness testing of metals in general and of PM materials in particular. The making of a hardness indent expends energy and brings about plastic deformation of a volume immediately below the indenter which is constrained within elastic surroundings. Plastic deformation requires shear forces and takes place at constant volume. Consequent displacements of material are accommodated either by extrusion to the surface or by volume changes of the constraining elastic material. Detailed analyses of both possibilities, based on well established principles, all draw attention to the fundamental relationship of hardness with yield strength rather than fracture strength. Keywords: Hardness, accommodation of material displaced from indent, importance of yield stress
INTRODUCTION In 1934 Hugh O’Neill [1] stated that “hardness only represents, of course, a single
point on the hardness-strain curve”. After many years of experimental and analytical study of hardness [2] David
Tabor reviewed the field and remarked: “My impression remains that hardness measurements which involve very complex elastic and plastic stresses and strains, as well as possible surface interactions, are bound to be complex. It is not clear that theoretical analyses can yet fully cover all aspects of the process. Maybe, because indentation experiments are so simple and convenient, we are misled into believing that their unsophisticated interpretation will provide precise information concerning the elastic and plastic properties of the specimen” [3].
A re-analysis of hardness of PM steels and its relationships with yield and fracture strength is now presented, noting that physically and analytically it is the yield strength that should be associated with hardness.
The hardness of a material can be assessed in a variety of ways; scratch tests, rebound tests, indentation of crossed cylinders or wedges.
Here the focus is only on those tests that involve the ability of the material to resist penetration by a ‘non deformable’ indenter, as in the Brinell, Vickers and Rockwell methods. A permanent indent implies plastic deformation of a volume beneath the indenter that is constrained by elastic deformation of the remainder of the material. As the load is removed, elastic relaxation brings about a shallowing of the indent; the diameter of the dimple left in the surface by a ball indenter reduces to 0.97 of that when still under load and the area of the newly formed surface to 0.94 of the contact area under load [4].
The Brinell and Vickers methods measure the load applied to the indenter and the size of the indent formed. Often the outcome is expressed as a simple number, found by the John Robert Moon, 20 Crosshill, Codnor, Derbyshire, DE5 9SR, UK
Powder Metallurgy Progress, Vol.15 (2015), No 2 235 use of suitable tables. Sight has often been lost of the definitions of hardness common to both methods; H = F/AS, where F is the applied force and AS is the surface area of the indent remaining after the load is removed. Thus, hardness has units of a stress, most often, for historical reasons, as kg.mm-2 although there is an increasing tendency to use MPa.
Clearly, the making of an indent in a surface deforms the underlying material, elastically and plastically. Temptation arises therefore to seek relationships between the measured hardness and other properties relevant to the deformation of the material. Such temptations can be traced back to Brinell himself [5], who found that for steels with a wide range of carbon contents;
RM = 0.346 HB or HB BB = 2.89RM (1A) This expression assumes that RM and HB are measured in the same units. If, as is
commonplace, RB
M is in MPa and HBB in kg.mm-2, the expression becomes; RM/MPa = 3.39 HB/kg.mm or HB
-2BB/kg.mm-2 = 0.29RM/MPa (1B)
The value of the constraint factor is now recognised as varying from material to material and by the extent to which the material is able to deform plastically under the action of the indenter, ranging from 0.34 to 0.36 [2]. It was very quickly taken to represent something to do with the different loading configurations and consequential stress systems set up by the different tests, but deeper understanding remained elusive.
Nevertheless, the relationship has obvious value and has been used extensively for estimating strength from a hardness measurement. The temptations still exist to over interpret the relationship. It is these temptations that this article seeks to address. In doing so, it is appropriate to rehearse a few well established principles.
INDENTATION HARDNESS
Rockwell The Rockwell method differs from the Brinell and Vickers methods. It measures the
differential movement of an indenter as the applied load is cycled from a small pre-load to a larger, defined, load and then returned to the original pre-load. It is defined arbitrarily as HR = 130 – Δh/0.002, Δh = h(unloading) - h(loading) in mm [6]. Neither the arbitrary nature of the test nor the scales used to express results for different loading cycles and types of indenter lend themselves immediately to analysis and will not be considered further in this article.
Brinell & Vickers The Brinell and Vickers methods measure the load applied to the indenter and the
size of the indent remaining after the load is removed. As an indenter moves into the surface of the test material it does a small amount of
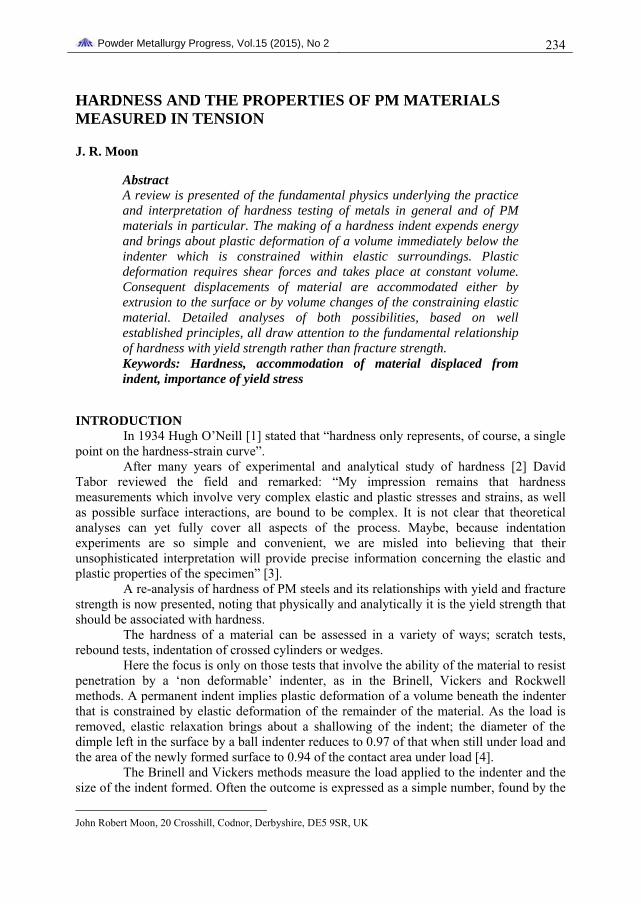
work, which is absorbed by deformation of the material. Typically for the Brinell method, 5 – 10 J is dissipated. Using typical data for the work done to deform a PM material plastically [7], a volume of about 20-50 mm3 is needed to absorb the work, or a volume containing of the order of 105 powder particles, Fig.1.
A feature of the Brinell method is that the shape of the indent changes as the spherical indenter penetrates further into the test piece. As a consequence, the measured hardness depends on the ratio of d/D, where d is the diameter of the indent at the original plane of the surface and D is the ball diameter. For example, for a typical 10 mm ball, a difference of indent diameter from 3.7 to 3.8 mm means a difference in hardness from 269 kg.mm-2 to 254 kg.mm-2. It follows that comparisons of hardness measurememnts are valid only if the ratio d/D is constant, something that is often impractical to do because it would mean lengthy procedures involving adjusting the load.
Powder Metallurgy Progress, Vol.15 (2015), No 2 236
Fig.1. Work done and volume affected by a typical hardness test.
Similar indentations, characterised by identical d/D ratios, bring about similar strain distributions in the test material. Tabor introduced the idea of a ‘representative strain’ which was proportional d/D. Furthermore, a plot of F against d/D reproduces the true stress-strain curve if F is taken to be related to the uniaxial flow stress with a constraint factor of C = 2.8 and the ‘representative strain’ as 0.2d/D, [8].
Pyramidal or conical indenters avoid that problem, as in the Rockwell or Vickers methods. Interestingly, the angle chosen for the apex between the faces of the Vickers indenter is that between the tangents to a Brinell indenter when d/D=3/8, a recommended aim of the Brinell method. The ‘representative strain’ for a pyramidal indenter of the Vickers proportions has been shown by experiment to be approximately 0.08, [8].
Hardness and plasticity As one might expect, the deeper is the penetration of the indenter, the more is the
work done on the material and the more it is plastically strained. The stresses and strains set up relate to the true flow curve for the material. For a work-hardenable material subject to a uniaxial stress, the expression used most often to describe the flow curve is,
σ = kεn (2) For a tension test, σ = F/A, where A is the minimum cross sectional area of the test piece at the instant F is measured, and dε = dl/l = -dA/A; integrating gives ε= ln(l/l0) = ln(A0/A).
Meyer An important contribution in this respect came from Eugene Meyer[9] who
deduced that for a spherical indenter, the indent diameter at the original plane of the surface, d, was related to the indenting force by
F = kdn* (3) where k=A/Dn*-2 and A is the area of the indent at the original plane of the surface. Putting this together gives the mean indentation pressure,
P = F/A = k*D2(d/D)n* (4) In these expressions, the index, n*, has values between 2 for a fully annealed metal and 2.5 for one unable to deform plastically to any great extent, as in one fully work-hardened, or a predominantly martensitic steel.
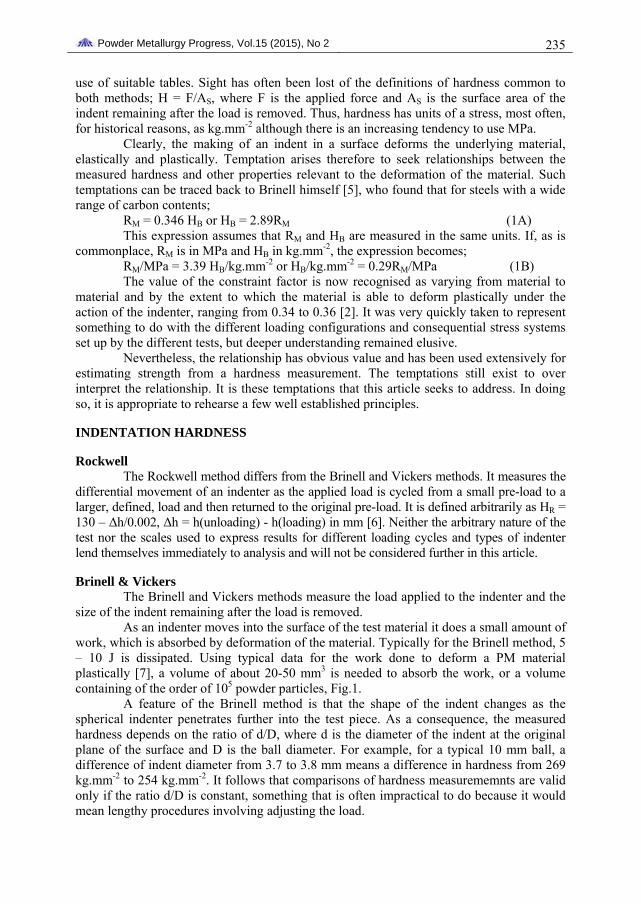
A plot of the indenting pressure against d/D replicates closely the strain hardening curve obtained from compression testing, Fig.2. It led to the concept of ‘representative
Powder Metallurgy Progress, Vol.15 (2015), No 2 237 strain’ and the deduction that the Meyer index, n* =2-n where n is the work hardening index of the flow curve, [8].
Fig.2. The Meyer hardness as a function of d/D. D is the diameter of a spherical indenter; d
is the diameter of the indent at the original surface. [8].
ANALYTICAL INTERPRETATIONS The analytical problem of hardness testing is basically that of contact stresses and
strains between elastic-plastic bodies. It recognises that the plastic region beneath the indenter deforms at constant volume but is contained within the material around it. The displacements in the plastic region must be accommodated somehow.
In practice, the dimensions across both Brinell and Vickers indents are large compared with their depth, typically 4 or 5 times larger. This is taken as justifying analysis in terms of blunt indenters and to give outcomes relevant to both ball and blunt pyramidal or conical indenters.
Slip line fields This approach deals with a hypothetical situation in which the surroundings of the
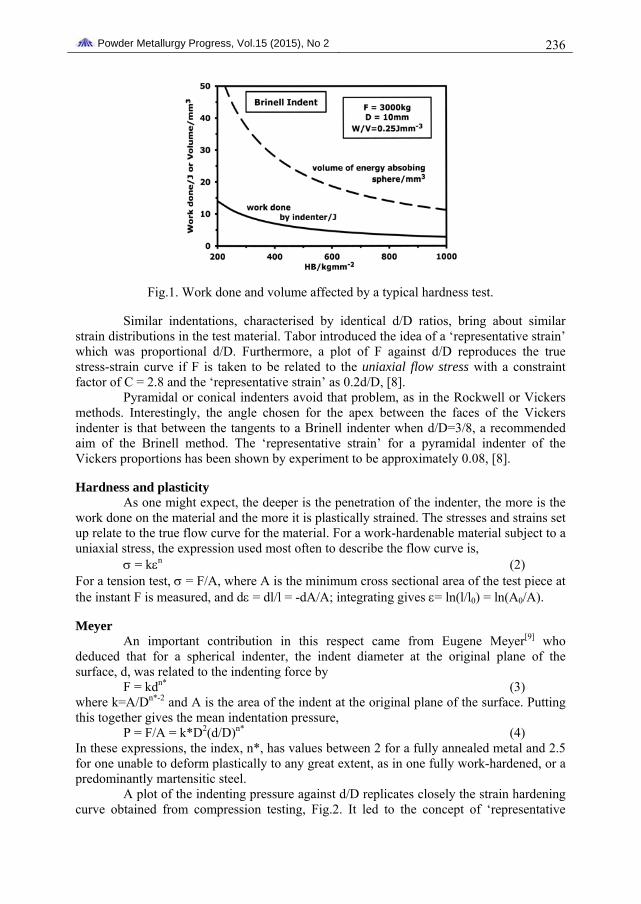
plastic region are infinitely rigid and cannot accommodate the shape change of the plastic region. The material displaced by the indenter has nowhere to go other than to be extruded to the surface surrounding it.
Fig.3. Postulated slip line field for material flow brought about by a blunt indenter;
surrounding material is taken as infinitely rigid. [10]
Powder Metallurgy Progress, Vol.15 (2015), No 2 238
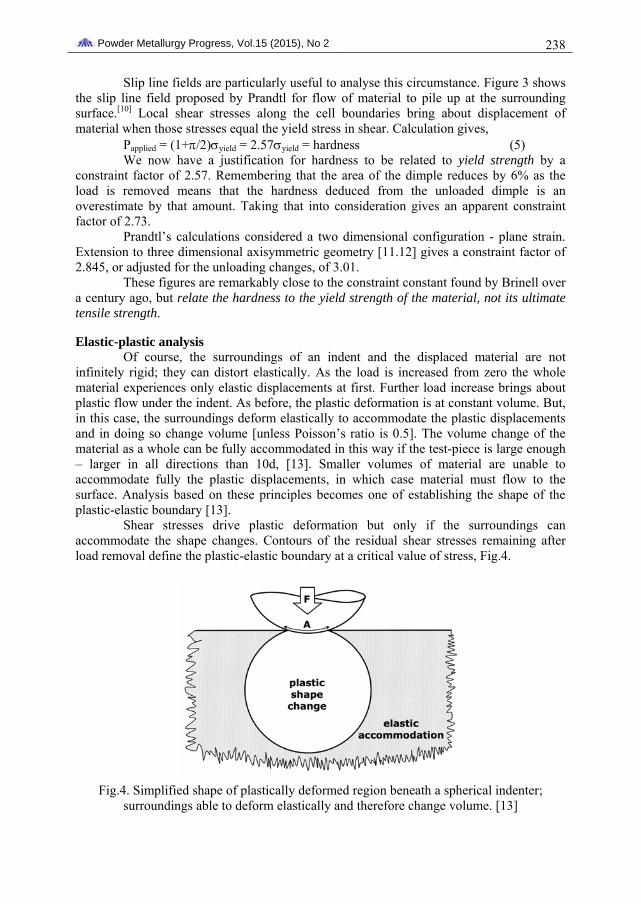
Slip line fields are particularly useful to analyse this circumstance. Figure 3 shows the slip line field proposed by Prandtl for flow of material to pile up at the surrounding surface.[10] Local shear stresses along the cell boundaries bring about displacement of material when those stresses equal the yield stress in shear. Calculation gives,
Papplied = (1+π/2)σyield = 2.57σyield = hardness (5) We now have a justification for hardness to be related to yield strength by a
constraint factor of 2.57. Remembering that the area of the dimple reduces by 6% as the load is removed means that the hardness deduced from the unloaded dimple is an overestimate by that amount. Taking that into consideration gives an apparent constraint factor of 2.73.
Prandtl’s calculations considered a two dimensional configuration - plane strain. Extension to three dimensional axisymmetric geometry [11.12] gives a constraint factor of 2.845, or adjusted for the unloading changes, of 3.01.
These figures are remarkably close to the constraint constant found by Brinell over a century ago, but relate the hardness to the yield strength of the material, not its ultimate tensile strength.
Elastic-plastic analysis Of course, the surroundings of an indent and the displaced material are not
infinitely rigid; they can distort elastically. As the load is increased from zero the whole material experiences only elastic displacements at first. Further load increase brings about plastic flow under the indent. As before, the plastic deformation is at constant volume. But, in this case, the surroundings deform elastically to accommodate the plastic displacements and in doing so change volume [unless Poisson’s ratio is 0.5]. The volume change of the material as a whole can be fully accommodated in this way if the test-piece is large enough – larger in all directions than 10d, [13]. Smaller volumes of material are unable to accommodate fully the plastic displacements, in which case material must flow to the surface. Analysis based on these principles becomes one of establishing the shape of the plastic-elastic boundary [13].
Shear stresses drive plastic deformation but only if the surroundings can accommodate the shape changes. Contours of the residual shear stresses remaining after load removal define the plastic-elastic boundary at a critical value of stress, Fig.4.
Fig.4. Simplified shape of plastically deformed region beneath a spherical indenter;
surroundings able to deform elastically and therefore change volume. [13]

Powder Metallurgy Progress, Vol.15 (2015), No 2 239
It comes as no surprise that the shape that emerged from the analysis is almost identical with that established in the 19th century by the Hertzian analysis of the shear stresses developed beneath a blunt indenter, [14], Fig.5. The diameter of the plastic zone depends on Young's modulus of elasticity, Poisson's ratio, material hardness, and the depth of the impression relative to the diameter of the indenting sphere. For steel, it is about 2.6d, which is compatible with the outcome of the energy balance referred to in the section to do with the Brinell and Vickers methods.
Fig.5. Contours of shear stress magnitudes in elastic body subject to a blunt spherical
indenter. Labels on the contours are τ/p where τ is the local maximum shear stress & p is the mean stress on the punch face. Maximum τ =0.468p occurs at a depth close to ¼
diameter of indenter. Modified from Hertz, [14].
A constraint factor of 2.82 emerges from the calculations for the configuration when under load. Removal of load allows elastic stresses in the surrounding to relax and bring about a reversal of plastic flow to reduce the diameter of the indent by about 3%. Remembering that hardness determinations involve the reciprocal of the surface area of the indent, the practical measurement is 6% higher than it would be under load. In other words, the apparent constraint factor should be increased by 6%, in this case from 2.82 to 3. Table 1 gives a summary.
Tab.1 Summary of calculated constraint coefficients for a ball indenter. Hardness = C Yield stress (uncorrected for relaxation on load removal). Hardness = C* Yield stress (corrected for relaxation on load removal)
SAME UNITS H [kg.mm-2] & RY [MPa] C C* 1/C 1/C* C C* 1/C 1/C* Slip line field analysis Prandtl [10] 2.57 2.73 0.39 0.37 0.26 0.28 3.82 3.59 Shield & Drucker [12] 2.845 3.03 0.35 0.33 0.29 0.31 3.45 3.24 Elastic-plastic analysis Shaw & DeSalvo [13] 2.82 3.00 0.35 0.33 0.29 0.31 3.48 3.27
Both experimental observations and analysis of pyramidal indenters point to the
crucial role of the angle at the apex of the indenter. As long as the apex angle is greater than
Powder Metallurgy Progress, Vol.15 (2015), No 2 240 about 150°, the constraint factor is 3. As the apex becomes sharper, the constraint decreases and mate
shape changes
S is variable; it changes from material to material and so each is valid only for a defined range
ther hand, the constraint factor in relation to yield remains the same irrespect
e yield stress of the mate
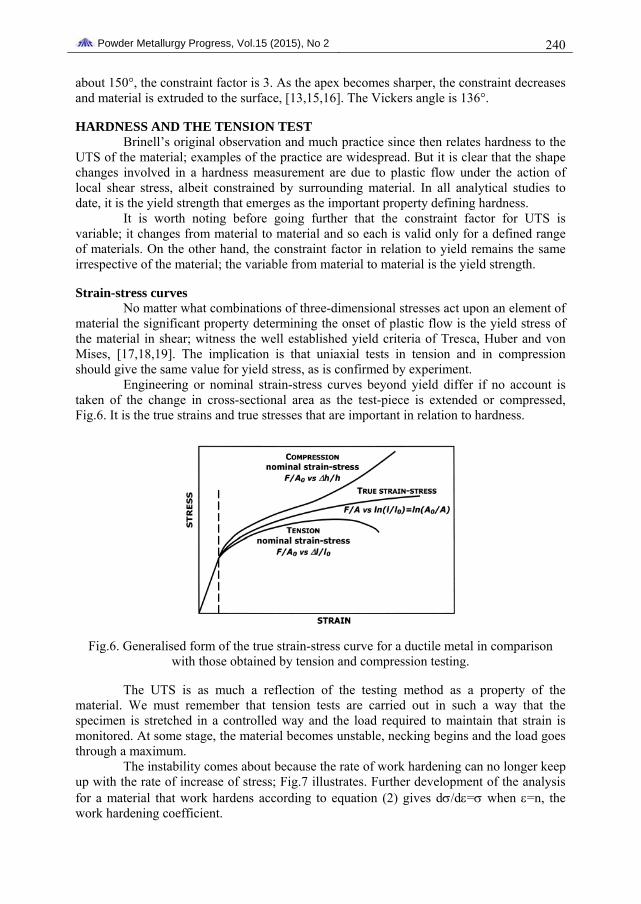
ngineering or nominal strain-stress curves beyond yield differ if no account is taken of the change in cross-sectional area as the test-piece is extended or compressed, Fig.6. It is the true strains and true stresses that are important in relation to hardness.
rial is extruded to the surface, [13,15,16]. The Vickers angle is 136°.
HARDNESS AND THE TENSION TEST Brinell’s original observation and much practice since then relates hardness to the
UTS of the material; examples of the practice are widespread. But it is clear that the involved in a hardness measurement are due to plastic flow under the action of
local shear stress, albeit constrained by surrounding material. In all analytical studies to date, it is the yield strength that emerges as the important property defining hardness.
It is worth noting before going further that the constraint factor for UT
of materials. On the oive of the material; the variable from material to material is the yield strength.
Strain-stress curves No matter what combinations of three-dimensional stresses act upon an element of
material the significant property determining the onset of plastic flow is thrial in shear; witness the well established yield criteria of Tresca, Huber and von
Mises, [17,18,19]. The implication is that uniaxial tests in tension and in compression should give the same value for yield stress, as is confirmed by experiment.
E
Fig.6.
member that tension tests are carried out in such a way that the specime
s about because the rate of work hardening can no longer keep up with the rate of increase of stress; Fig.7 illustrates. Further development of the analysis for a material that work hardens according to equation (2) gives dσ/dε=σ when ε=n, the work hardening coefficient.
Generalised form of the true strain-stress curve for a ductile metal in comparison with those obtained by tension and compression testing.
The UTS is as much a reflection of the testing method as a property of the material. We must re
n is stretched in a controlled way and the load required to maintain that strain is monitored. At some stage, the material becomes unstable, necking begins and the load goes through a maximum.
The instability come

Powder Metallurgy Progress, Vol.15 (2015), No 2 241
Fig.7. Schematic illustration of the true strain stress curve and the true work hardening rate:
plastic instability initiates when dσ/dε=σ
For low strength ductile materials, n is typically about 0.3. For high strength materials and most PM materials, fracture very often occurs before plastic instability sets in. The UTS is never reached; in such a circumstance, it would be better to refer to fracture stress or to maximum stress rather than UTS.
Typically, PM steels fail at strains as low as 0.03 (3%), well before macroscopic plasticity is well developed. Nevertheless, it has become an unfortunately common practice to refer to the fracture strength as UTS. Such pre-UTS fractures appear to be brought about, as the stress increases, by the nucleation, coalescence and growth of microcracks until they reach a size that propagates suddenly when a critical stress intensity factor is reached, [20].
Hardness and the yield strength or UTS or tensile fracture strength? It cannot be doubted that relationships between hardness and the tensile fracture or
maximum stress appear to work; there are multiple examples that say so, not only for wrought materials but for PM materials also.
So why is it that the practical relationship between hardness and fracture stress appears to work, especially for materials of low ductility that fracture before becoming plastically unstable?
Fig.8. Relationships between nominal yield or maximum stress [MPa] and Brinell hardness
[kg.mm-2] for some, representative, wrought steels. Data from multiple sources.
Powder Metallurgy Progress, Vol.15 (2015), No 2 242
This is not an easy question to answer, but the following observations may give us some clues.
Firstly, correlations of hardness with yield or with maximum stress both work for wrought materials with some displacement so that the trendlines do not go to the origin, Fig.8.
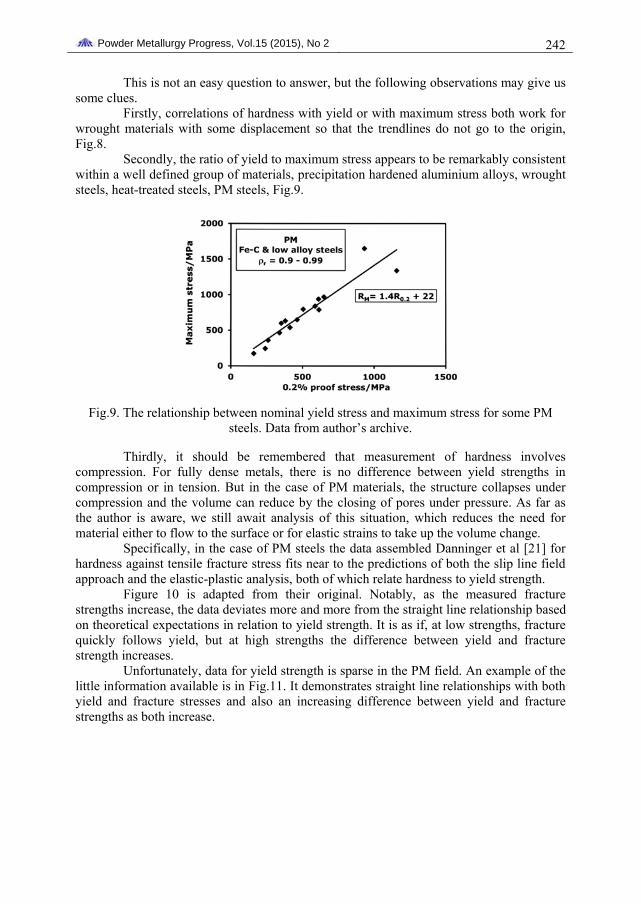
Secondly, the ratio of yield to maximum stress appears to be remarkably consistent within a well defined group of materials, precipitation hardened aluminium alloys, wrought steels, heat-treated steels, PM steels, Fig.9.
Fig.9. The relationship between nominal yield stress and maximum stress for some PM
steels. Data from author’s archive.
Thirdly, it should be remembered that measurement of hardness involves compression. For fully dense metals, there is no difference between yield strengths in compression or in tension. But in the case of PM materials, the structure collapses under compression and the volume can reduce by the closing of pores under pressure. As far as the author is aware, we still await analysis of this situation, which reduces the need for material either to flow to the surface or for elastic strains to take up the volume change.
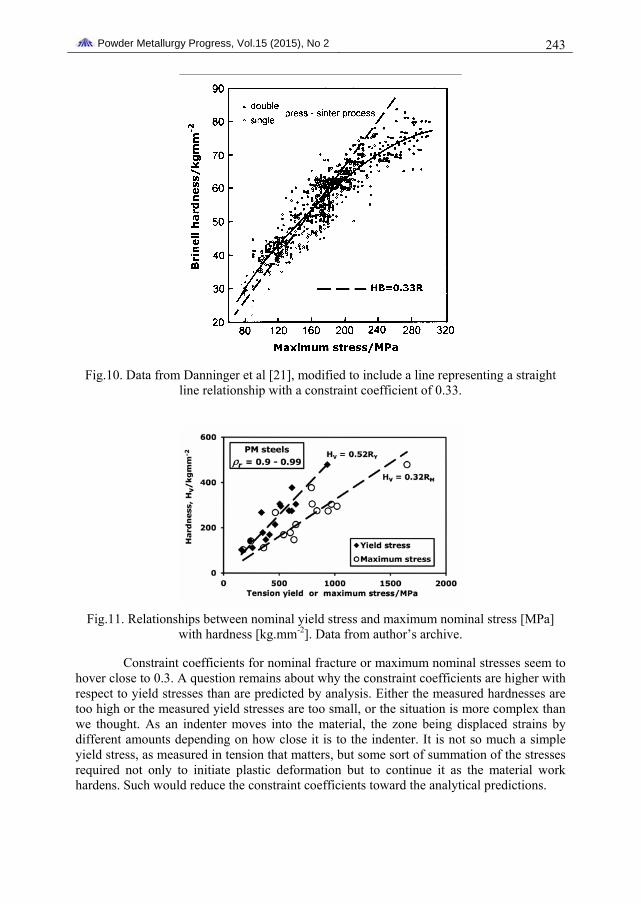
Specifically, in the case of PM steels the data assembled Danninger et al [21] for hardness against tensile fracture stress fits near to the predictions of both the slip line field approach and the elastic-plastic analysis, both of which relate hardness to yield strength.
Figure 10 is adapted from their original. Notably, as the measured fracture strengths increase, the data deviates more and more from the straight line relationship based on theoretical expectations in relation to yield strength. It is as if, at low strengths, fracture quickly follows yield, but at high strengths the difference between yield and fracture strength increases.
Unfortunately, data for yield strength is sparse in the PM field. An example of the little information available is in Fig.11. It demonstrates straight line relationships with both yield and fracture stresses and also an increasing difference between yield and fracture strengths as both increase.
Powder Metallurgy Progress, Vol.15 (2015), No 2 243
Fig.10. Data from Danninger et al [21], modified to include a line representing a straight
line relationship with a constraint coefficient of 0.33.
Fig.11. Relationships between nominal yield stress and maximum nominal stress [MPa]
with hardness [kg.mm-2]. Data from author’s archive.
Constraint coefficients for nominal fracture or maximum nominal stresses seem to hover close to 0.3. A question remains about why the constraint coefficients are higher with respect to yield stresses than are predicted by analysis. Either the measured hardnesses are too high or the measured yield stresses are too small, or the situation is more complex than we thought. As an indenter moves into the material, the zone being displaced strains by different amounts depending on how close it is to the indenter. It is not so much a simple yield stress, as measured in tension that matters, but some sort of summation of the stresses required not only to initiate plastic deformation but to continue it as the material work hardens. Such would reduce the constraint coefficients toward the analytical predictions.

Powder Metallurgy Progress, Vol.15 (2015), No 2 244
CONCLUSIONS Without doubt, hardness measurements, by whatever method, are useful indicators
of a materials ability to resist deformation. Empirical correlations of harness with both nominal yield stress and with fracture stress in tension seem to work, albeit with constraint coefficients that are inconsistent with the analyses.
All the theoretical analyses reach the conclusion that the important material property is the yield stress. In this context, the local yield stresses in the deforming zone are functions of the stresses required to initiate plastic flow and to continue it as the material work hardens.
Although there is a sound basis for interpreting hardness in relation to yield, there remains a question [probably a series of questions] about how to interpret hardness in relation to tensile fracture or maximum stress. Straight line correlations of hardness with maximum nominal stress might be accounted for by the remarkable consistency in the ratio of yield/maximum stress within a defined category of material, such as PM steels.
Care must be taken to avoid over interpreting the observations. Before the present author was born, Hugh O’Neill [1], one of the early thinkers about hardness, warned that “hardness . . . only represents, of course, a single point on the hardness strain curve. In tensile testing the whole stress-strain diagram is much more valuable than any one point on that diagram.” The same care is urged in the ground breaking book by David Tabor, which remains still the classic text on the subject of hardness of metals, [2].
Acknowledgements The seeds for this article were sown in conversation with my good friend Andrew
Wronski during the DFPM conference at Stara Lesna in 2014. I thank him wholeheartedly not only for encouraging its production, but also for his continued interest and his thoughtful and constructive comments on my first draft.
REFERENCES [1] O’Neill, H.: The Hardness of Metals and Its Measurement. London : Chapman & Hall,
1934 [2] Tabor, D.: The Hardness of Metals. Oxford, UK : Clarendon Press, 1951 (republished
2000) [3] Tabor, D. In: Solid-Solid Interactions. Eds. MJ. Adams, SK. Biswas, J. Briscoe.
London : Imperial College Press, 1996, p. 6 [4] Shaw, MC., DeSalvo, GJ.: Transactions of ASME, vol. 92, 1970, p. 1 [5] Brinell, JA.: Teknisk Tidskrift, vol. 5, 1900, p. 69 & Wahlberg, A.: J Iron and Steel
Institute, vol. 59, 1901, p. 243 [6] Low, SR.: Practice Guide; Rockwell Hardness Measurement of Metallic Materials.
Special Publication 960-5. Gaithersburg, MD : National Institute of Standards and Technology, 2001
[7] Moon, JR., Molinari, A.: Powder Metallurgy Progress, vol. 14, 2014, p. 3 [8] Tabor, D. : Proc. Royal Society, London A, vol. 192, 1948, p. 247 [9] Meyer, E.: Physikalische Zeitschrift , vol. 9, 1908, p. 66
[10] Prandtl, L.: Nachrichten der Akademie Wissenschaffen in Göttingen, Mathematisch-Physikalische Klasse, 1920, p. 74
[11] Ishlinsky, AI.: Prikladnaia Mathemalika i Mekhanika, vol. 8, 1944, p. 201 [12] Shield, RT., Drucker, DC.: JournaL of Applied Mechanics, vol. 20, 1953, p. 483 [13] Shaw, MC., DeSalvo, GJ.: Transactions of ASME, vol. 92, 1970, p. 1 [14] Hertz, HR. In: Gesammelte Werke (Collected Works), vol. 1, 1882, Leipzig

Powder Metallurgy Progress, Vol.15 (2015), No 2 245
[15] Dugdale, DS.: Journal mechanics and physics of solids, vol. 3, 1955, p. 197 (part 1), p. 206 (part 2)
[16] Atkins, AG., Tabor, D.: International journal mechanical science, vol. 7, 1965, p. 647 [17] Tresca, H.: Comptes Rendus de l’Académie des Sciences, Paris, vol. 59, 1864, p. 754 [18] Huber, MT.: Właściwa praca odkształcenia jako miara wytężenia materyału. Lwow :
Czasopismo Techniczne, Towarzystwo Politechniczne, 1904 [19] Mises, RE.von: Göttin. Nachr. Math. Phys., vol. 1, 1913, p. 582 [20] Kabatova, M., Dudrova, E., Wronski, AS.: Powder Metallurgy, vol. 49, 2006, p. 363 [21] Danninger, H., Gierl, C., Šalak, A.: Powder Metallurgy Progress, vol. 9, 2009, p. 1