hardrock project feasibility study teach-in session … · • aace class 3 estimate with a capital...
TRANSCRIPT

Teach-in Session November 16th , 2016
Hardrock Project Feasibility Study

Forward-looking Information
Information contained in this news release and the documents referred to herein which are not statements of historical facts, may be “forward-looking information” for the purposes of Canadian s ecurities laws . Such forward looking information involves risks , uncertainties and other factors that could cause actual results , performance, prospects and opportunities to differ materia lly from those expres sed or implied by such forward looking information. The words “expect”, “target”, “es timate”, “may”, “will”, and s imilar expres s ions identify forward-looking information. These forward-looking s ta tements rela te to, among other things , mineral reserve and resource es timates , grades and recoveries , the evaluation of programs to minimize the risk profile of the Project including the submis s ion of the final EA/ EIA to regulators in support of mining continued consulta tions with community and Firs t Nations s takeholders and advancing dis cus s ions relating to project financing; development plans , mining methods and metrics including s trip ra tio, recovery proces s and the expected performance of the HPGR, mining and production expectations including expected cash flows , capita l cos t es timates and expected LOM operating cos ts , the expected payback period, receipt of government approvals and licenses including the timing for submitting a response to the EA/ EIA, time frame for cons truction, financial forecas ts including net present value and internal ra te of return es timates , tax and royalty ra tes , expected cos ts rela ting to the relocation of certa in exis ting infras tructure, opportunities to improve the LOM average grade from proces s ing materia l from other Greens tone Gold Property, including Brookbank and the Hardrock underground; and the pos s ibility of any benefit of his torical tax pos itions held by Centerra or Premier. Forward-looking information is neces sarily based upon a number of es timates and as sumptions that, while cons idered reasonable by the Managing Partner, Centerra and Premier, are inherently subject to s ignificant politica l, bus ines s , economic and competitive uncertainties and contingencies . There may be factors that cause results , as sumptions , performance, achievements , prospects or opportunities in future periods not to be as anticipated, es timated or intended. These factors include the following risks rela ting to the Hardrock Project, Centerra and/ or Premier: (A) s tra tegic, legal, planning and other risks , including the risks for dis agreement between the partners on how to explore, develop, operate and finance the Project, politica l risk, risks rela ting to aborigina l cla ims and consulta tion is sues ; resource nationalis m including the management of external s takeholder expectations ; the impact of changes in, or to the more aggres s ive enforcement of laws , regulations and government practices ; the impact of changes to, the increased enforcement of, environmental laws and regulations ; potentia l defects of title to the property that are not known as of the date hereof; the inability of the Partnership and its partners to enforce their respective legal rights in certa in circums tances ; risks rela ted to anti-corruption legis la tion; potentia l risks rela ted to kidnapping or acts of terrorism; (B) risks rela ting to financial matters , including the ability of the partners to provide funding to the Partnership in accordance with the terms of the Partnership Agreement; s ens itivity of the bus ines s to the volatility of gold prices ; the imprecis ion of mineral reserves and resources es timates ; and the as sumptions they rely on; the accuracy of the production and cos t es timates ; the ability to obtain financing for the Partnership or by either partner; the impact of global financial conditions , the impact of currency fluctuations , the effect of market conditions on short-term inves tments , the ability of the partners including Centerra to make payments to the Partnership depends on the cash flow of its subs idiaries ; and (C) risks rela ted to operational matters and geotechnical is sues ; the succes s of the Partnership’s future exploration and development activities , including the financial and politica l risks inherent in carrying out exploration activities ; inherent risks as sociated with the use of sodium cyanide in the mining operations ; the adequacy of insurance to mitiga te operational risks ; mechanical breakdowns ; the occurrence of any labour unres t or dis turbance; the ability to accurately predict decommiss ioning and reclamation cos ts , including closure cos ts ; the ability to a ttract and retain qualified personnel; the ability to manage projects effectively and to mitiga te the potentia l lack of availability of contractors ; budget and timing overruns and project resources ; potentia l delays in the is suance of permits ; potentia l oppos ition to the Hardrock Project by local communities or civil groups rela ted; potentia l materia l increases in project development or operation cos ts due to increases in key consumables , infla tion, imposed demands for infras tructure development or regulatory changes ; the planning, des ign and cos ting of the key project infras tructure such as power, water and acces s . There can be no as surances that forward-looking information and s ta tements will prove to be accurate, as many factors and future events , both known and unknown could cause actual results , performance or achievements to vary or differ materia lly, from the results , performance or achievements that are or may be expres sed or implied by such forward-looking s ta tements contained herein or incorporated by reference. Accordingly, a ll such factors should be cons idered carefully when making decis ions with respect to Centerra/ Premier, and prospective inves tors should not place undue reliance on forward-looking information. Forward-looking information is as of November 16, 2016. Centerra/ Premier as sumes no obliga tion to update or revis e forward-looking information to reflect changes in as sumptions , changes in circums tances or any other events affecting such forward looking information, except as required by applicable law. The Mineral Reserve and Mineral Resource es timates , LOM plan, and other s cientific and technical information in this presentation were prepared in accordance with the s tandards of the Canadian Ins titute of Mining, Metallurgy and Petroleum and National Ins trument 43-101 – Standards of Disclosure for Mineral Projects (“NI 43-101”) and were prepared or supervis ed by Mr. Réjean Sirois , Vice-Pres ident of Geology and Resources for G Mining Services Inc., and Mr. Louis -Pierre Gignac, Co-Pres ident of G Mining Services Inc., both of whom are “Qualified Person” as defined by NI 43-101.
2

Non-GAAP Meas ures
This news release contains the following non-GAAP financial meas ures : a ll-in s us ta ining cos ts and s us ta ining capita l. Thes e financial meas ures do not have any s tandardized meaning pres cribed by GAAP and are therefore unlikely to be comparable to s imilar meas ures pres ented by other is s uers , even as compared to other is s uers who may be applying the World Gold Council (“WGC”) guidelines , which can be found at http:/ / www.gold.org. The Partners hip believes that the us e of thes e non-GAAP meas ures will as s is t analys ts , inves tors and other s takeholders in unders tanding the cos ts as s ociated with producing gold, unders tanding the economics of gold mining and the ability of the project to generate free cas h flow. However, the meas ures do have limita tions as analytical tools as they may be influenced by the point in the life cycle of a s pecific mine and the level of additional exploration or expenditures a company has to make to fully develop the property. Accordingly, thes e non-GAAP meas ures s hould not be cons idered in is olation. Definitions The following is a des cription of the non-GAAP meas ures us ed in this news releas e. The definitions are s imilar to the WGC’s Guidance Note on thes e non-GAAP meas ures : Sustaining capital is a capital expenditure neces s ary to maintain levels of production. The s us ta ining capita l expenditures include maintaining the mine fleet, mill and other facilities s o that they function at levels cons is tent from year-to-year. All-in sustaining costs per ounce include all operating cos ts , royalties , general and adminis trative expens es , s us ta ining capita l, clos ure and reclamation cos ts .
3

Company and Project
• Greenstone Gold Mines (“GGM”) is a Partnership between Centerra Gold Inc. and Premier Gold Mines Limited formed in March 2015
• Hardrock open pit project (“Project”) is located 275 kilometres northeast of Thunder Bay along the Trans-Canada Highway
• Active mining district with good transportation and mining-related infrastructure
• Conventional open pit operation with hydraulic shovels and mining trucks with 10-metre benches
• Standard processing technology based on crushing, grinding and carbon-in-pulp (“CIP”)
• Other gold deposits are being scoped for future development, including Brookbank, Hardrock underground, and other satellite deposits
• Feasibility study is completed and the Partnership is reviewing programs to minimize the risk profile of the Project – no development or construction decision has been made and project permits remain outstanding (expected in 2018)
4

Greens tone Team
Eric Lamontagne, General Manager
• 17 years of operations and development senior management experience in the mining industry
• Project Manager and Operational Manager roles on several successful northern Canada gold projects
• PhD, Rock Mechanics
David Morgan, Director of Finance
• Finance Leader with over 10 years of progressive experience • Broad mining industry experience in acquisitions, integrations,
management systems implementation, treasury and audit • Obtained Chartered Accountant (CA) designation while at KPMG
Dyane Duquette Director of Geology
• Over 20 years experience in gold projects and operations, including Premier Gold Mines Ltd, Agnico Eagle and TVX Gold; responsible for project evaluations, resource development, production and drilling
• BSc Honours Geology
Bertho Caron Director, Infrastructure
• Extensive global project development experience in the mining industry • Senior project manager, engineering and construction roles in gold
projects across all project phases, including studies, construction and commissioning
Ian Horne Director of Env and Community Relations
• Environmental and community relations experience within the mining industry spans 35 years, including permitting and Aboriginal consultation
• Global project and operations roles in base metals, gold and diamonds • BSc Biology, Past Chair of CIM Environmental Society and OMA
Environment Committee 5

Feas ibility Study Hardrock Project
6
Feas ibility Study (“FS”)
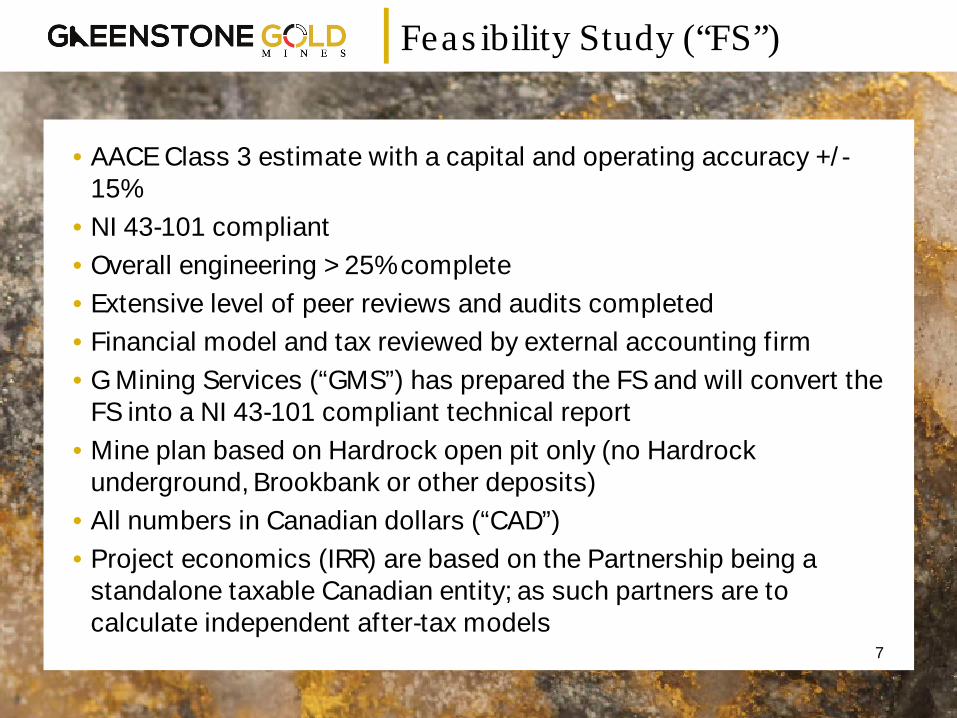
• AACE Class 3 estimate with a capital and operating accuracy +/ - 15%
• NI 43-101 compliant • Overall engineering > 25% complete • Extensive level of peer reviews and audits completed • Financial model and tax reviewed by external accounting firm • G Mining Services (“GMS”) has prepared the FS and will convert the
FS into a NI 43-101 compliant technical report • Mine plan based on Hardrock open pit only (no Hardrock
underground, Brookbank or other deposits) • All numbers in Canadian dollars (“CAD”) • Project economics (IRR) are based on the Partnership being a
standalone taxable Canadian entity; as such partners are to calculate independent after-tax models
7

Qualified Pers ons /Peer Reviews
Section Qualif ied Person Peer Review
Geology GMS - Rejean Sirois Roscoe Postle Associates
Mining GMS – Louis-Pierre Gignac Roscoe Postle Associates
Process WSP -Eric Poirier
Soutex – Pierre Roy Orway Mineral Consultants
(Comminution)
Surface Infrastructure
GMS – Glen Schlyter GMS – Martin Menard Amec – David Ritchie
(Geotech)
Golder Associates (Construction over Historic Tailings)
Slope Golder – Marc Rougier Piteau Associates
Tailings Management Amec – David Ritchie Golder Associates
Environment Stantec – Craig Johnston Golder Associates (Geochem)
CAPEX Various Amec Foster Wheeler
Economic Parameters GMS – Louis-Pierre Gignac Roscoe Postle Associates
Tax PWC – Liam Fitzgerald PWC 8

Site Layout
9

Environment
• Final Environmental Assessment / Environmental Impact Statement (“EA/EIS”) submission planned end of Q1 2017 with an expected approval date of Q1 2018 (12 months)
• After implementation of mitigation measures, the Project is not predicted to cause significant adverse environmental effects
• Water quality in Kenogamisis Lake is predicted to improve as a result of the Project plans to reduce the effects of historical mining activities
• To enhance environmental management of the project GGM is working to establish the following:
• Aboriginal Environmental Review Committee to advise on environmental monitoring activities
• Independent Tailings Review Board to oversee the design, construction, operation and closure of the tailings management facility
10

Community
First Nations and Metis • Greenstone Gold has been actively consulting with potentially impacted
Aboriginal communities • Generally support the project, subject to addressing Aboriginal and/or Treaty
Rights • Negotiations are underway with several communities on Long Term
Relationship Agreements expected to be signed during 2017
Municipality of Greenstone • The wards of Geraldton and Longlac support the project and anticipate the
benefits of economic development • GGM is working with local hunters, fishers and snowmobilers to mitigate
impacts to their activities
The Project is expected to have a positive effect on the economies of local communities
11

Geology, Mining & Milling
12
Res ource Block Model
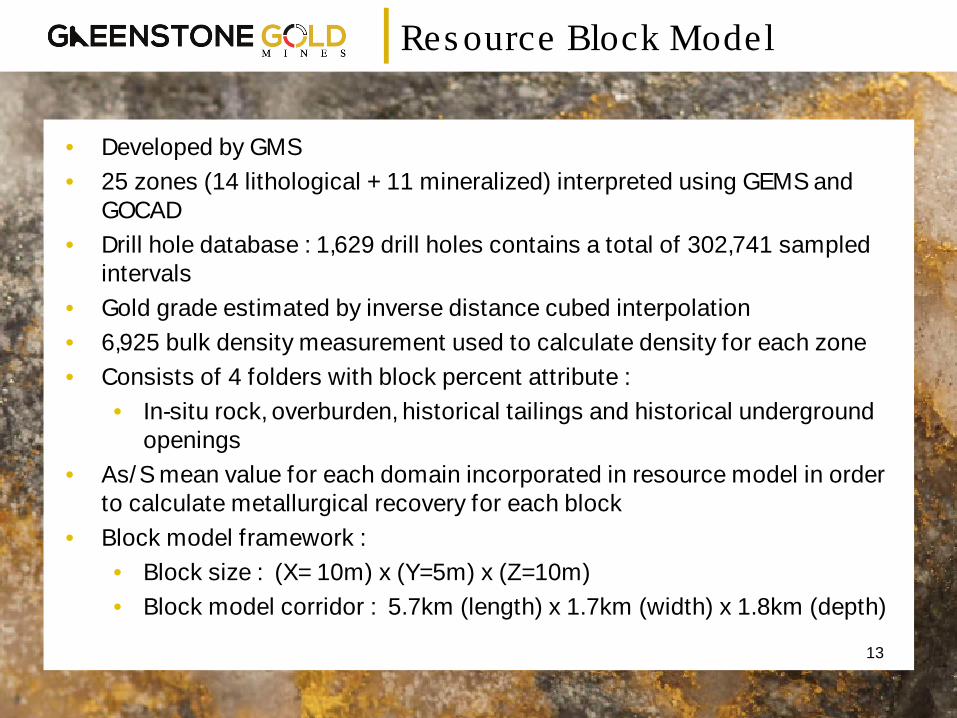
• Developed by GMS • 25 zones (14 lithological + 11 mineralized) interpreted using GEMS and
GOCAD • Drill hole database : 1,629 drill holes contains a total of 302,741 sampled
intervals • Gold grade estimated by inverse distance cubed interpolation • 6,925 bulk density measurement used to calculate density for each zone • Consists of 4 folders with block percent attribute :
• In-situ rock, overburden, historical tailings and historical underground openings
• As/S mean value for each domain incorporated in resource model in order to calculate metallurgical recovery for each block
• Block model framework : • Block size : (X= 10m) x (Y=5m) x (Z=10m) • Block model corridor : 5.7km (length) x 1.7km (width) x 1.8km (depth)
13

Final Pit Des ign
• Selected whittle shell for pit design corresponds to a US$ 687/oz (RF=0.55)
• Final pit design dimensions : 1,800m length x 875m width • Maximum depth = 570m • Three exits in total : two at the east side, one at south-west side • Several switchbacks to avoid underground openings • Pit design follows closely selected whittle shell
3D View of Final Pit with Historical Underground Voids 14
Mineral Res ource Es timate
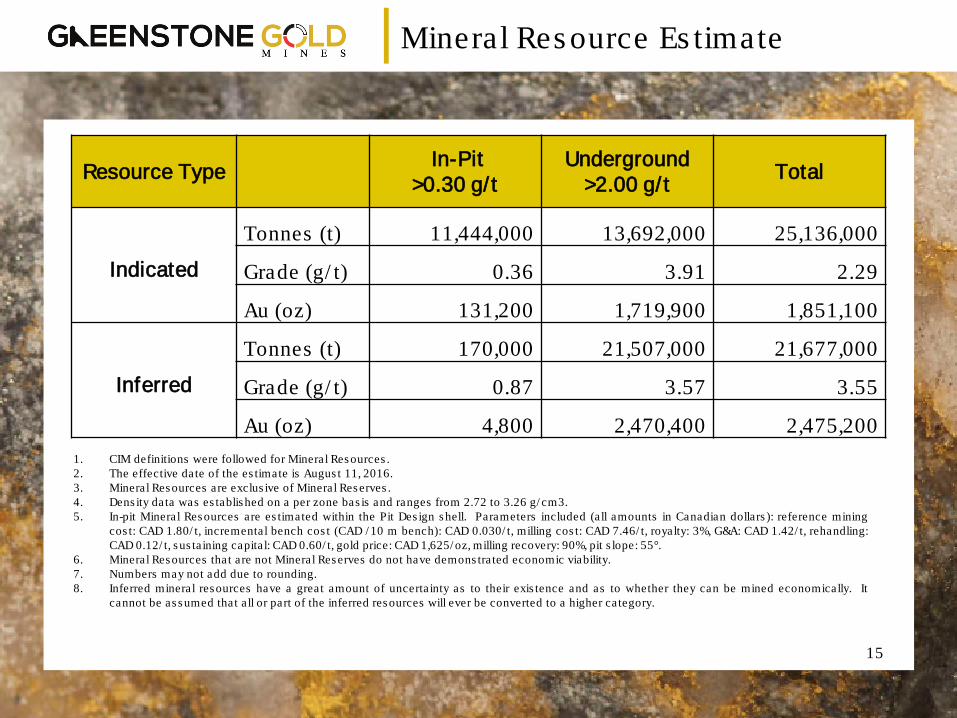
Resource Type In-Pit >0.30 g/t
Underground >2.00 g/t Total
Indicated
Tonnes (t) 11,444,000 13,692,000 25,136,000
Grade (g/ t) 0.36 3.91 2.29
Au (oz) 131,200 1,719,900 1,851,100
Inferred
Tonnes (t) 170,000 21,507,000 21,677,000
Grade (g/ t) 0.87 3.57 3.55
Au (oz) 4,800 2,470,400 2,475,200 1. CIM definitions were followed for Mineral Resources . 2. The effective date of the es timate is Augus t 11, 2016. 3. Mineral Resources are exclus ive of Mineral Reserves . 4. Dens ity data was es tablished on a per zone bas is and ranges from 2.72 to 3.26 g/ cm3. 5. In-pit Mineral Resources are es timated within the Pit Des ign shell. Parameters included (a ll amounts in Canadian dollars ): reference mining
cos t: CAD 1.80/ t, incremental bench cos t (CAD / 10 m bench): CAD 0.030/ t, milling cos t: CAD 7.46/ t, royalty: 3%, G&A: CAD 1.42/ t, rehandling: CAD 0.12/ t, s us ta ining capita l: CAD 0.60/ t, gold price: CAD 1,625/ oz, milling recovery: 90%, pit s lope: 55°.
6. Mineral Resources that are not Mineral Reserves do not have demons tra ted economic viability. 7. Numbers may not add due to rounding. 8. Inferred mineral resources have a great amount of uncerta inty as to their exis tence and as to whether they can be mined economically. It
cannot be as sumed that a ll or part of the inferred resources will ever be converted to a higher category.
15

Mineral Res erve Es timate
1. CIM definitions were followed for Mineral Res erves . 2. Mineral Res erves are es timated at a cut-off grade of 0.33 g Au/ t. 3. Mineral Reserves are es timated us ing a long-term gold price of USD
1,250/ oz and an exchange rate of CAD/ USD 1.30. 4. A minimum mining width of 5 m was us ed. 5. Bulk dens ity of ore is variable but averages 2.83 t/ m3. 6. The average s trip ratio is 3.87:1. 7. Mining dilution factor is 17.3%.
Category Diluted Ore Tonnage (kt)
Diluted Grade (g/ t Au)
Contained Metal (k oz Au)
Proven - - -
Probable 141,715 1.02 4,647
Total P&P 141,715 1.02 4,647
16

Mine Schedule (Mining Phas es )
Borrow Pit Depth = 120m
Phas e 1 depth = 280m Phas e 2 depth = 370m Phas e 3 depth = 570m
• Main pit is mined through 3 phas es to feed the mill with the available highes t grade ore in the early years (low grade is s tockpiled) and to balance the s tripping ratios
• Borrow pit is mined within Phas e 1 for cons truction purpos es
17

Mine Plan
• Pre-production tonnage (ore and waste) is 42 Mt over 17 months
• Total tonnage mined at 691 Mt with a strip ratio of 3.9 : 1
• Mining peak production (68 Mt/ year) is maintained for 4 years (starting in the second year of production)
• Mining Fleet: • 30 haul truck (200t) • 2 hydraulic shovels (26m3) • 1 hydraulic shovel (19m3) • 2 front loaders (21m3)
Grade Range (g/t)
Low 0.33 to 0.50 Medium 0.50 to 1.10
High > 1.10
18
-
1.00
2.00
3.00
4.00
5.00
6.00
7.00
8.00
-
10.00
20.00
30.00
40.00
50.00
60.00
70.00
80.00
-3 -1 2 4 6 8 10 12 14
Strip
Rat
io
Tonn
age
Min
ed (M
t)
YearOre Waste Overburden Other Strip Ratio

Simplified Flow Sheet
Mill is planned to operate 24 hours/day for 365 days/ year at 92% availability HPGR – proven reliable technology, energy efficient and high online time
19

Milling Plan
• Commissioning/ ramp-up: 4 month period • Commercial operation: 60% nameplate production for 30 days • Milling rate: 24 ktpd (Years 1-2), 27 ktpd • LOM average gold recovery: 90.2%
20

Annual Gold Production
• LOM production is 4.2 million ozs, including 11,000 ozs during pre-production
• Gold production averages 356koz for the first 4 full years of production with an average grade of 1.27g/ t (38Mt milled) 21

Project Schedule
22

Pre-Production Capex
Area (Work Breakdown Structure) M CAD
Infrastructure 63
Power & Electrical 72
Water & Tailings Management 80
Mobile Equipment 178
Infrastructure relation 46
Process Plant 343
Construction Indirects 175
General Services - Owner's Cost 60
Preproduction, Start-up Commissioning 94
Contingency (~ 12% of capex) 131
Other Initia l Capital Cos ts 5
Grand Total 1,247 23

Operating Cas h Cos ts
Area M CAD CAD/t ore CAD/oz
Mining 1,412 10.03 338
Processing 1,061 7.54 254
General and Administrative 205 1.45 49
Transportation and Refining 13 0.09 3
Royalties (1) and Other 259 1.85 62
Operating Cost (CAD) 2,950 20.95 705
All-in Sustaining Cost (CAD) 3,261 23.16 780
Total Cost (pre-tax) (CAD) 4,507 1,078
Peak Operations Workforce is 544 personnel
(1) 3% net smelter royalty
24

Operating Cas h Cos ts

Mining Operating Cos ts
Area Total M CAD CAD/t mined % of Costs Hauling 521 0.80 36.9% Blasting 185 0.28 13.1% Loading 128 0.20 9.1% Drilling 122 0.19 8.7% Mine Maintenance Admin. 65 0.10 4.6% Dump Maintenance 61 0.09 4.3% Road Maintenance 57 0.09 4.0% Grade Control 52 0.08 3.7% Support Equipment 51 0.08 3.6% Pre-Split Drilling and Blasting 42 0.06 3.0% Mine Operations 39 0.06 2.7% Mine Engineering 31 0.05 2.2% Voids Management 24 0.04 1.7% Rehandling 17 0.03 1.2% Mine Geology 13 0.02 0.9% Dewatering 4 0.01 0.3% Total Mine OPEX 1,412 2.18 100.0%
26

Mining Opex by Cos t Element
27

Milling Opex by Cos t Element

General and Adminis trative Opex by Cos t Element
29

Economic Model
30

Key Parameters and As s umptions
Key Parameters • Gold price: US$1250/oz • CAD$/US$ exchange rate 1.30; CAD$/Euro exchange rate: 1.4 • Delivered diesel fuel price: CAD$0.75/L • Real Canadian dollars (no inflation) Key Underlying Assumptions • Model start date 1 January 2017 - minimal sunk costs • Full tax compliance (GGM is not a taxable Canadian entity)
– Partners to calculate independent after tax model • Estimate base date Q2 2016 • Equity funded model (no debt financing)
31

Financial Model Summary
Production Summary
Total Tonnes (Mt) 691
Was te Tonnes (Mt) 549
Strip Ratio 3.87
Ore Tonnes (Mt) 141.7
Gold Grade (g/ t Au) 1.02
Contained Gold (kozs ) 4,647
Recovered Gold (kozs ) 4,193
Average Recovery (%) 90.2
Gold Sales Pre-Prod. (kozs ) 11
Gold Sales Operations (kozs ) 4,181
Capita l Cos ts (M CAD)
Total Initia l Capita l 1,247
Clos ure & Reclamation 54
Sus taining Capita l 257
Salvage Value (38)
Life-of-Mine Cas h Flow (M CAD)
Gold Revenue 6,796
Operating Cos ts (2,950)
Initia l and s us ta ining capita l (1,514)
Other (reclamation, s a lvage value, working capita l) (16)
Taxes (689)
Project Economics Before-Tax Results
Cash Flow (M CAD) 2,325
Project Economics After-Tax Results
Cash Flow (M CAD) 1,636
NPV 5% (M CAD) 709
Payback Period (years) 4.5
IRR (%) 14.4% 32

LOM Project Cas hflow (Before-Tax)

Sens itivity Analys is
Project is most sensitive to gold price, followed by exchange rate
Dis count Rate 5% 6% 7% 8%
After-Tax NPV M CAD 709 587 481 387
34

Opportunities
• Additional ounces from other properties may be processed via plant and TMF capacity (Brookbank and Hardrock underground)
• Recover ounces and mitigate environment liabilities by processing historical tailings
• Utilize technologies to increase operational effectiveness and reduce costs
• Availability of high quality second hand equipment
• Modular and prefabrication early in process
• Potential for third party power supplier to reduce capital
• Ability to enter into capital lease arrangements for certain equipment (mobile fleet)
35

End of Pres entation
36