hardware startup report · 2019-07-19 · hardwareclub.co/pages/hardware-startup-report 01...
TRANSCRIPT

HARDWARE STARTUP REPORTedition 2019
hardwareclub.co/pages/hardware-startup-report
0 1 I N T R O D U C T I O N
The goal of this survey was to crowdsource answers to all the questions regularly asked by our community of Hardware Club founders (manufacturing delays, CAC, size of option pool…). The scope and relevance of the questions have been reviewed and validated by 12 founders from the club.
This report only features a sample of the questions and answers provided, other key results will be made accessible only to the Hardware Club member startups.
The survey has been administered online during fall 2018 and only CEOs from the club were invited to participate.
To maintain consistency across answers only 80 responses out of 100+ were kept in order to produce the report.
The profile of the participants presented in the first section will give you an overview of the sample.
This report is not intended to provide general trends applicable to the whole hardware ecosystem since the size of the sample is limited. We wanted to share some interesting insights that haven’t been documented so far.
If you have questions, you can contact Pénélope, associate & community director, at [email protected].
About the reportINTRODUCTION
SURVEY PARTICIPANT PROFILES
MANUFACTURING & SUPPLY CHAIN
MARKETING & SALES
TEAM & HIRING
FINANCIALS
FUNDING
2
5
11
24
31
42
45
01
02
03
04
05
06
07
CO N T E N T
2

hardwareclub.co/pages/hardware-startup-report3
0 1 I N T R O D U C T I O N
Pénélope ROMAND-MONNIERAssociate & Community Director, Hardware Club
The idea of this survey had been in the pipeline for quite a long time. It only took a conversation with a founder last summer to finally kick off the project.
Since inception, Hardware Club has always been about providing a safe space for member startups to exchange resources, network and feedback. We wanted to find a way to gather and document the
information shared within the club and we consider this survey to be a first and humble step towards this goal.
We’re excited to share some of the results with people who are passionate, interested or just curious about hardware. We hope you’ll get some interesting food for thoughts that will spark new conversations on hardware startups.
I’d like to thank again the whole community for their support in making the project happen, and especially to the 100+ founders who participated. I know it took them tremendous courage and grit to go through the whole survey.
I’d like to thank as well the 12 fantastic founders from our review committee for their precious feedback and input. The survey would not have been possible without you! Big shout-out to Eric Dy from Bloomlife, Dorrian Porter from Vestaboard, Michele Baggio from Instamic, Omer Elfakir from Blocks, Pieter Palmers from MuuseLabs, Silas Adekunle from Reach Robotics, Suma Reddy from Farmshelf, Tristan Rousselle from Aryballe and Vipin Jain from Blendid.
Special mention to our amazing analyst Marta for her considerable help.
We hope you enjoy the reading!

hardwareclub.co/pages/hardware-startup-report4
0 1 I N T R O D U C T I O N
550+ Member startups
35+ Countries
The Hardware Club community today
Agriculture
Audio
Communications
Computing
Construction
Education
Energy
Food
Gaming
Image
Industrial
Materials
Medical
Robotics
Security
Space
Sports
Toys
Transportation
Wellness
410+ Active member startups
INDUSTRIES

hardwareclub.co/pages/hardware-startup-report5
02 SURVEY PARTICIPANT PROFILES
� 6
� 7
� 8
� 9
� 10
— Distribution of survey participants by location
— Distribution of survey participants by vertical
— Distribution of survey participants by market segment
— Distribution of survey participants by development stage
— Distribution of survey participants by last funding round

hardwareclub.co/pages/hardware-startup-report6
S U RV E Y PA R T I C I PA N T P R O F I L E S02
North America
Europe
57%24%16%3%
Other citiesParisLondon
BerlinLisbonStockholm
50%21%18%
5%3%3%
Bay Area Other citiesNYCBoston
Other citiesHong KongTaipei
50%25%25%
Asia & Oceania
Distribution of survey participants by location
48%46%
5%1%
Europe North AmericaAsia & OceaniaSouth America
DISTRIBUTION OF RESPONDENTS BY GEOGRAPHICAL AREA DISTRIBUTION OF RESPONDENTS BY TECH HUB

hardwareclub.co/pages/hardware-startup-report7
S U RV E Y PA R T I C I PA N T P R O F I L E S02
Distribution of survey participants by vertical
19%19%
18%10%
9%9%
8%9%
8%6%6%
5%
5%5%
5%
3%
3%
3%
3%
1%
DISTRIBUTION OF RESPONDENTS BY VERTICAL
N.B.: Companies could pick up to 3 answers among the list of verticals.
IndustrialRoboticsWellnessConstruction / smart buildingEnergyMedicalTransportationFoodSecuritySportsToysAgricultureAudioComputingEducationGamingImageMaterialsSpaceCommunications
hardwareclub.co/pages/hardware-startup-report8
S U RV E Y PA R T I C I PA N T P R O F I L E S02
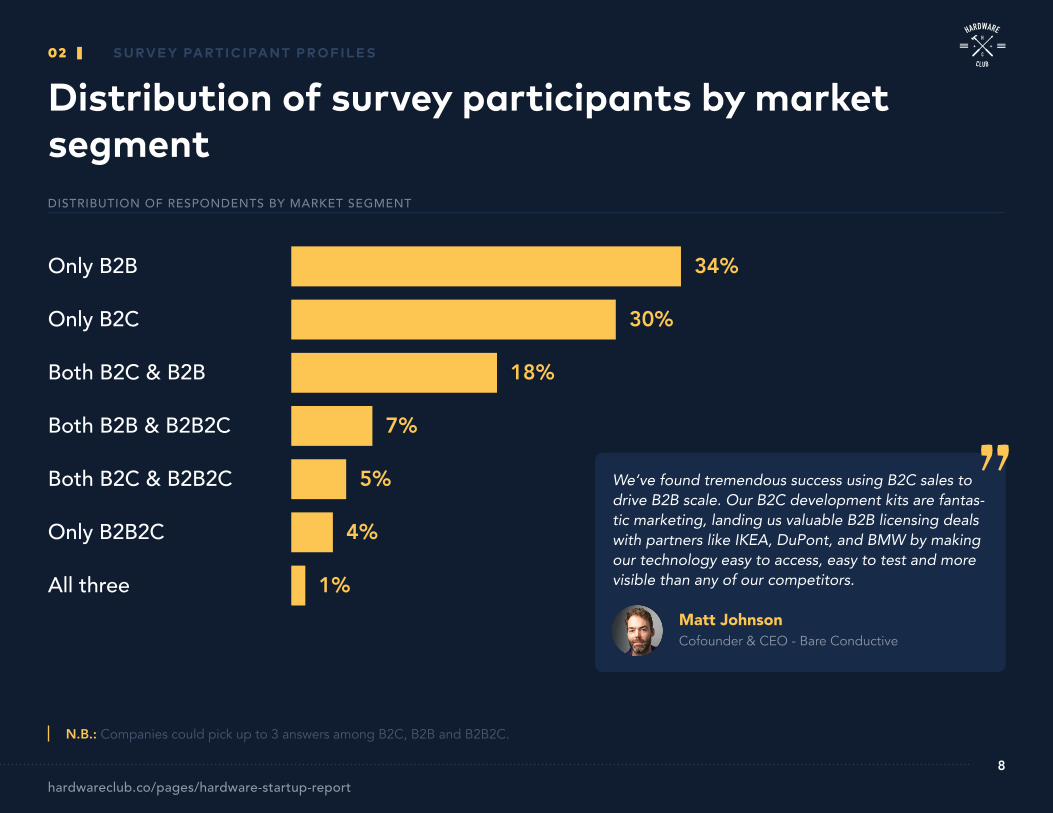
Distribution of survey participants by market segment
Only B2B
Only B2C
Both B2C & B2B
Both B2B & B2B2C
Both B2C & B2B2C
Only B2B2C
All three
34%
30%
18%
7%
5%
4%
1%
N.B.: Companies could pick up to 3 answers among B2C, B2B and B2B2C.
DISTRIBUTION OF RESPONDENTS BY MARKET SEGMENT
We’ve found tremendous success using B2C sales to drive B2B scale. Our B2C development kits are fantas-tic marketing, landing us valuable B2B licensing deals with partners like IKEA, DuPont, and BMW by making our technology easy to access, easy to test and more visible than any of our competitors.
Matt Johnson Cofounder & CEO - Bare Conductive
”

hardwareclub.co/pages/hardware-startup-report9
S U RV E Y PA R T I C I PA N T P R O F I L E S02
Distribution of survey participants by development stage
4%
15%
39%
42%
�Concept
�Prototyping
�Industrialization
�Mass-production(e.g. working with EMS)
DISTRIBUTION OF RESPONDENTS BY DEVELOPMENT STAGE

hardwareclub.co/pages/hardware-startup-report10
S U RV E Y PA R T I C I PA N T P R O F I L E S02
Distribution of survey participants by last funding round
13%
51%
21%
11%
1%
3% �Self-funded
�Pre-seed
�Seed
�Bridge to series A
�Series A
�Series B
N.B.: Given the limited number of companies who are self-funded or at series B stage in the sample, we will not feature them in some of the analyses and charts.
DISTRIBUTION OF RESPONDENTS BY LAST FUNDING ROUND

hardwareclub.co/pages/hardware-startup-report11
03 MANUFACTURING & SUPPLY CHAIN
— Manufacturing happens at seed stage
— Almost 50% of the US startups are manufacturing in China
— Half of the European startups are manufacturing in China
— It takes 3+ months to find a contract manufacturer (CM)
— 65% of the startups found that their CM was involved in the development of their product
— Price is the most important factor when it comes to picking a manufacturer
— Ensuring the quality at every step and getting to DFM are the most difficult manufacturing challenges
— Back in Q4 2018, 91% of the US respondents were very or somewhat worried about the US tariffs
— Companies are on average late to ship by 3+ months
— Most companies (86%) protect their technology through patents
— Startups tend to fill more patent applications post Series A funding
— Half (51%) of the seed stage companies are shipping
� 12
� 13
� 14
� 15
� 16
� 17
� 18
� 19
� 20
� 21
� 22
� 23

hardwareclub.co/pages/hardware-startup-report12
24% of the respondents whose last round was a bridge to series A are still at a pre-manufacturing stage.
Series
ASee
d
Pre-see
d
Bridge t
o serie
s A
Manufacturing happens at seed stage
�Yes, we’re currently manufacturing / we’ve already manufactured
�More or less, we’re working on launching our first batch (sourcing manufacturers, vendors, etc.)
�No, we haven’t started anything related to manufacturing
30%
30%
61%76%
89%
24%11%
32%
7%
40%
03 M A N U FAC T U R I N G & S U P P LY C H A I N
DISTRIBUTION OF RESPONDENTS BY MANUFACTURING STAGE AND LAST FUNDING ROUND

hardwareclub.co/pages/hardware-startup-report13
03 M A N U FAC T U R I N G & S U P P LY C H A I N
Almost 50% of the US startups are manufacturing in ChinaOnly 32% of the USA-based surveyed startups are manufacturing locally.
�China
�USA
�Canada
�Dominican Republic
�Mexico
49%
32%
3%
3%
3%
DISTRIBUTION OF MANUFACTURING LOCATIONS FOR US RESPONDENTS
At Bellwether Coffee we had less expensive manufacturing options in Asia. We chose to manufacture in the US where we can iterate designs faster, create a shorter supply chain, and ship product to customers faster.
Nathan Gilliland CEO - Bellwether
”

hardwareclub.co/pages/hardware-startup-report14
M A N U FAC T U R I N G & S U P P LY C H A I N03
Half of the European startups are manufacturing in ChinaChina is a manufacturing destination as popular among the US respondents as among the European ones (respectively 49% and 50% are manufacturing in China).
�China �France �Spain �Portugal �Italy �Netherlands
�Austria �USA �UK �Ireland �Switzerland
50%
18%
6%
6%
3%
3%
3%
3%
3%
3%
3%
DISTRIBUTION OF MANUFACTURING LOCATIONS FOR EUROPEAN RESPONDENTS

hardwareclub.co/pages/hardware-startup-report15
03 M A N U FAC T U R I N G & S U P P LY C H A I N
Companies found their CM (Contract Manufacturer) primarly through active searching (24%). Only 8% of the respondents found their CM through their investors or incubator / accelerator.
It takes 3+ months to find a contract manufacturer (CM)
2%
3%
6%
8%
8%
8%
10%
10%
22%
24% �Active searching
�Previous professional / experiences / network
�Other hardware founders
�Advisors
�Haven’t found it yet
�Already connected to the CM prior to the company
�They reached out to you
�Investors
�Incubator / accelerator
�Consultants
N.B.: The answer “Other (please specify)” includes: vendor, industrial design firm, Hardware Club, the startup manufactures itself, mentor, friend.
DISTRIBUTION OF RESPONDENTS BY SOURCE OF INTRODUCTION TO CM
Average time to find a CM
14.4weeks

hardwareclub.co/pages/hardware-startup-report16
03 M A N U FAC T U R I N G & S U P P LY C H A I N
65% of the startups found that their CM was involved in the development of their product17% of the respondents decided not to involve their manufacturing partner.
17%
18%
35%
30%
I didn’t involve them
Not involved at all
Somewhat involved
Very involved
DISTRIBUTION OF RESPONDENTS BY LEVEL OF INVOLVEMENT OF THEIR CM

hardwareclub.co/pages/hardware-startup-report17
M A N U FAC T U R I N G & S U P P LY C H A I N03
Price is the most important factor when it comes to picking a manufacturerThe manufacturer’s capabilities only comes in the 4th position.
#1 Price
#2 Location
#3 Size
#4 Other (see graph on the right)
#5 Portfolio
#6 Language
18%CapabilitiesRelationship
QualityExperience
TrustExpertise
Financing termsSpeed
NAReferences
IP protection
16%
13%
9%
9%
9%
7%
7%
6%
4%
2%N.B.: Companies could pick up to 3 criteria among the list.
WHAT ARE / WERE THE 3 MOST IMPORTANT FACTORS WHEN CHOOSING YOUR CM?

hardwareclub.co/pages/hardware-startup-report18
03 M A N U FAC T U R I N G & S U P P LY C H A I N
Ensuring the quality at every step and getting to DFM are the most difficult manufacturing challengesFinancing and scaling the production are the next two biggest roadblocks that hardware startups face.
Very easy Somewhat difficultSomewhat easy Neither difficult nor easy Very difficult
2%
1%
31%15% 41% 13%
19%
19%
19% 17%
9%28%
43%
43%
Managing inventoryNegotiating the contracts & pricing
Communicating properly with the CMGetting the certifications
Finding the right manufacturerManaging the supply chain
Scaling productionFinancing the production
Going from prototype to DFMEnsuring quality at every step
6% 32% 21% 30% 11%
5% 28% 24% 26% 17%
29%21% 31% 19%
21%7% 16% 35% 21%
18%5% 11% 28% 38%
12%1% 15% 35% 37%
18%10% 40% 32%
HOW DIFFICULT OR EASY WERE THESE ASPECTS OF THE MANUFACTURING PROCESS?

hardwareclub.co/pages/hardware-startup-report19
03 M A N U FAC T U R I N G & S U P P LY C H A I N
Back in Q4 2018, 91% of the US respondents were very or somewhat worried about the US tariffs9% of the USA-based respondents were very worried about the tariffs, which is only 1% more than Europe-based startups (8%).
Among US founders, there were as many respondents not worried at all about the tariffs than there were that were very worried (9%).
8%9%19%
9%
82%73%
USAEurope
Somewhat worried Very worriedNot worried at all
DISTRIBUTION OF LEVEL OF WORRY REGARDING THE US TARIFFS BY GEOGRAPHICAL AREA
hardwareclub.co/pages/hardware-startup-report20
03 M A N U FAC T U R I N G & S U P P LY C H A I N
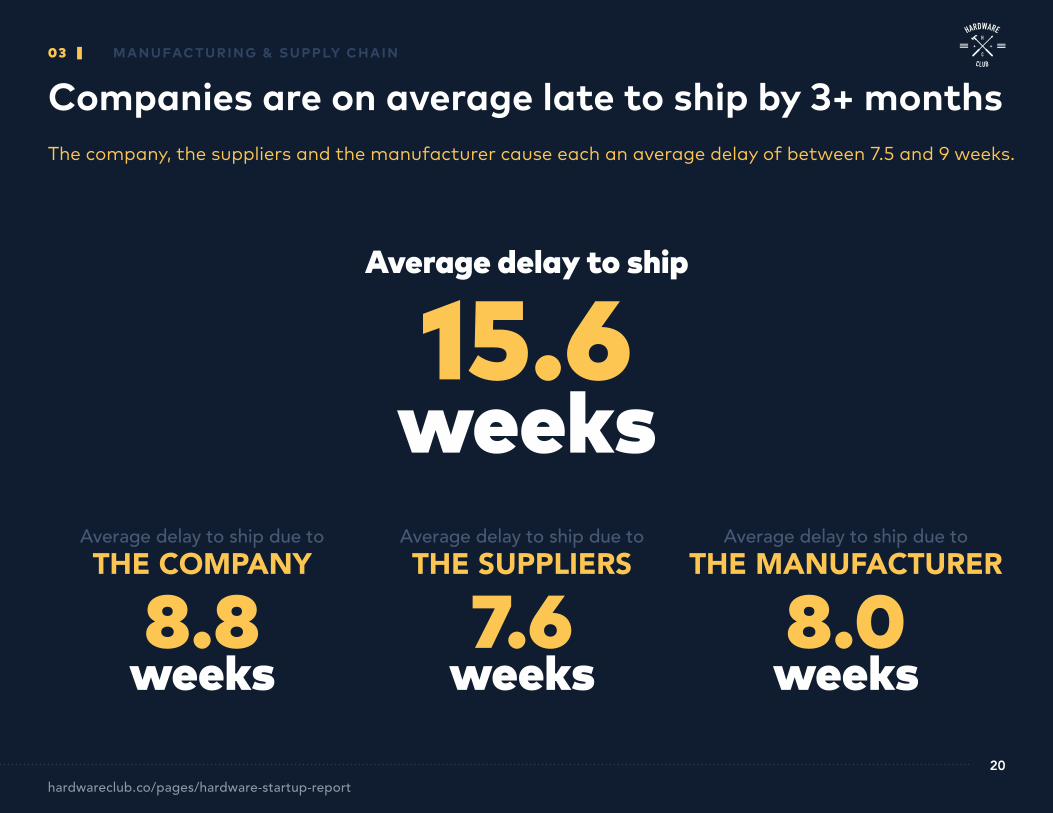
Companies are on average late to ship by 3+ monthsThe company, the suppliers and the manufacturer cause each an average delay of between 7.5 and 9 weeks.
Average delay to ship
15.6weeks
Average delay to ship due to THE COMPANY
8.8weeks
Average delay to ship due to THE SUPPLIERS
7.6weeks
Average delay to ship due to THE MANUFACTURER
8.0weeks

hardwareclub.co/pages/hardware-startup-report21
03 M A N U FAC T U R I N G & S U P P LY C H A I N
Most companies (86%) protect their technology through patents14% of the respondents have not protected their innovation yet or not planning to do so in the near future (“trade secret protection”, “stealth mode”, “I have not protected my product”).
12%
43%
21%
11%
5%
5%
3%
�Provisional applications
�Pending applications
�Granted patent
�Portfolio of granted patents
�Trade secret protection
�Stealth mode
�I have not protected my product
DISTRIBUTION OF RESPONDENTS BY IP PROTECTION STATUS
Most great hardware companies are really software companies in disguise. And so while patents are a nice contributing factor in creating a moat, the real defen-sibility still should come from software, e.g. via your algorithms, the network effects of your ecosystem or just a great & deeply integrated product experience.
Florian Simmendinger Founder & CEO - Soundbrenner
”

hardwareclub.co/pages/hardware-startup-report22
03 M A N U FAC T U R I N G & S U P P LY C H A I N
Startups tend to fill more patent applications post Series A fundingPre-series A startups have mostly filled between 1 and 5 patent applications while 63% of the series A startups have filled between 6 and 10 of them.
31%69%
83%17%
11% 3%77%9%
0% 1-5 patent applications 6-10 patent applications More than 10 patent applications
63%37% �Series A
�Bridge to series A
�Seed
�Pre-seed
DISTRIBUTION OF NUMBER OF PATENT APPLICATIONS BY LAST FUNDING ROUND

hardwareclub.co/pages/hardware-startup-report23
03 M A N U FAC T U R I N G & S U P P LY C H A I N
Half (51%) of the seed stage companies are shipping12% of the companies whose last funding round was a bridge are still not shipping.
Pre-seed Seed Series ABridge to series A
0%
11%
89%
12%18%
70%
29%20%
51%
No, we haven’t started anything related to shipping More or less, we are working on shipping our first batch (sourcing shipping partners, etc.)Yes, we are currently shipping / we have already shipped
10%
30%
60%
DISTRIBUTION OF SHIPPING STATUS BY LAST FUNDING ROUND
What is exciting about the future of hardware is the possibility to prototype, polish and ship without big capital investments thanks to good quality off-the-shelf components and rapid prototyping.
Felipe Chávez Cofounder & CEO Kiwi Campus
”
hardwareclub.co/pages/hardware-startup-report24
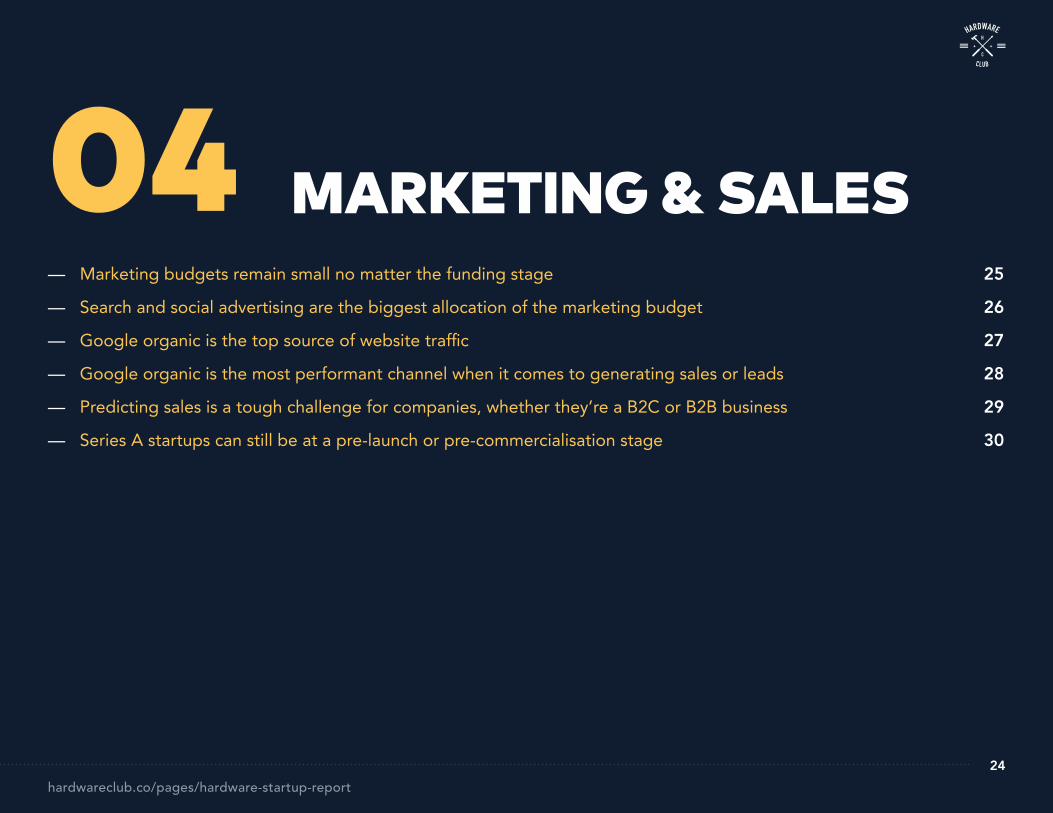
04 MARKETING & SALES — Marketing budgets remain small no matter the funding stage
— Search and social advertising are the biggest allocation of the marketing budget
— Google organic is the top source of website traffic
— Google organic is the most performant channel when it comes to generating sales or leads
— Predicting sales is a tough challenge for companies, whether they’re a B2C or B2B business
— Series A startups can still be at a pre-launch or pre-commercialisation stage
� 25
� 26
� 27
� 28
� 29
� 30

hardwareclub.co/pages/hardware-startup-report25
0 4 M A R K E T I N G & SA L E S
Marketing budgets remain small no matter the funding stageThe marketing budget grows in small increments from pre-seed to series A, the average series A marketing budget being only x1.5 the average marketing budget of seed stage respondents.
$ 24 000
$ 114 868
$ 140 533
$168 250
�Pre-seed
�Seed
�Bridge to series A
�Series A
AVERAGE MARKETING BUDGET BY LAST FUNDING ROUND

hardwareclub.co/pages/hardware-startup-report26
M A R K E T I N G & SA L E S0 4
Search and social advertising are the biggest allocation of the marketing budgetPinterest and Reddit remain pretty untapped compared to Facebook and Instagram when it comes to promoting the company or product over digital channels.
63%46%
41%
39%33%
30%21%
19%
18%5%4%
0%0%
N.B.: Companies could pick as many options as they wanted among the list.
Top 3 marketing channels respondents are mostly spending their marketing budget on:
#1 Search and social advertising
#2 Website
#3 PR
WHICH DIGITAL CHANNELS ARE YOU ACTIVELY USING TO PROMOTE YOUR COMPANY / PRODUCT?
FacebookInstagram
LinkedinTwitter
YoutubeGoogle
InfluencersBlog
NonePinterest
RedditSnapchat
Other

hardwareclub.co/pages/hardware-startup-report27
M A R K E T I N G & SA L E S0 4
Google organic is the top source of website trafficInvesting in SEO over Facebook CPC (only ranks #6) seems like a better suited strategy when it comes to growing the website traffic.
68%64%
40%31%
26%19%
16%13%
10%8%
5%1%
0%0%
N.B.: Companies could pick three options among the list.
Google OrganicDirect
ReferralsEmailOther
Facebook CPCGoogle CPC
LinkedinFacebook OrganicAffiliate marketing
Crowdfunding platform (Indiegogo, Kickstarter, etc.)Facebook Messenger
Bing organicYahoo organic
WHAT ARE THE TOP 3 SOURCES THAT GENERATE MOST OF YOUR WEBSITE TRAFFIC?

hardwareclub.co/pages/hardware-startup-report28
0 4 M A R K E T I N G & SA L E S
Google organic is the most performant channel when it comes to generating sales or leadsEmail only got 10% of the votes.
31%26%
21%13%
10%8%
5%5%5%
4%1%
0%0%0%
WHAT ARE THE TOP 3 SOURCES THAT GENERATE MOST OF YOUR WEBSITE PRE-SALES / SALES / LEADS?
Google OrganicDirect
Facebook CPCReferrals
EmailOther
Facebook OrganicGoogle CPC
Crowdfunding platform (Indiegogo, Kickstarter, etc.)Affiliate marketing
LinkedinFacebook Messenger
Bing organicYahoo organic
N.B.: Companies could pick three options among the list.
hardwareclub.co/pages/hardware-startup-report29
0 4 M A R K E T I N G & SA L E S
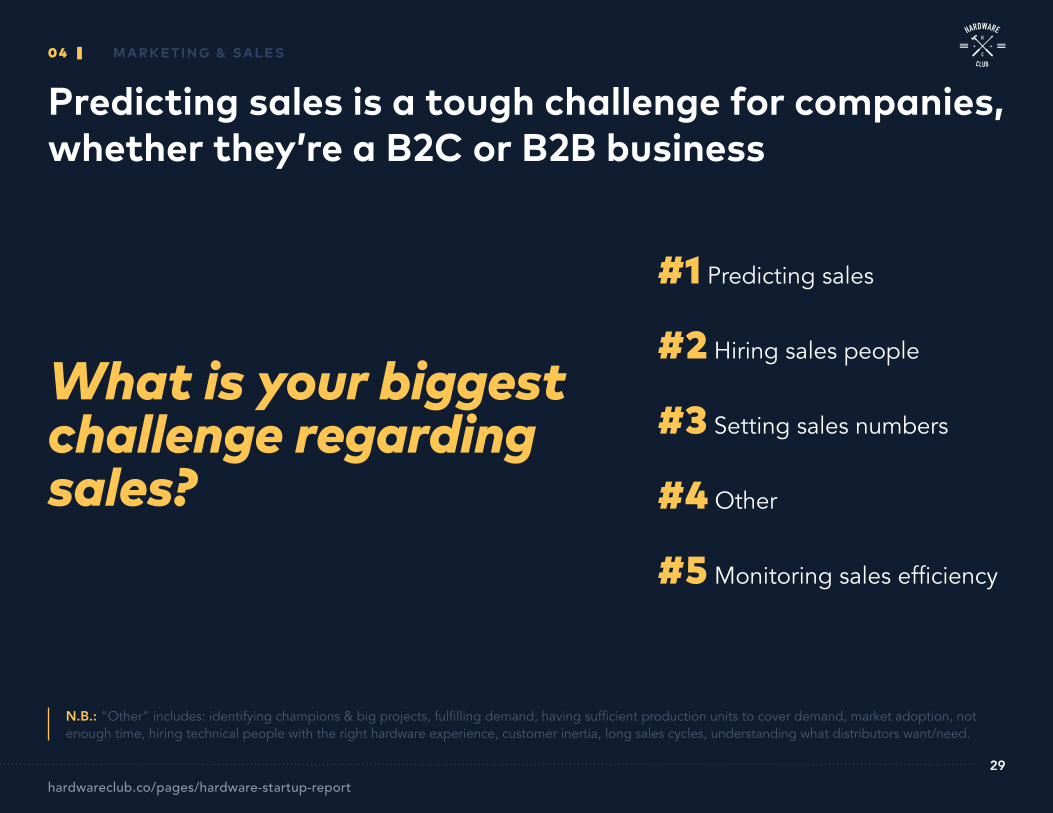
Predicting sales is a tough challenge for companies, whether they’re a B2C or B2B business
#1 Predicting sales
#2 Hiring sales people
#3 Setting sales numbers
#4 Other
#5 Monitoring sales efficiency
N.B.: “Other” includes: identifying champions & big projects, fulfilling demand, having sufficient production units to cover demand, market adoption, not enough time, hiring technical people with the right hardware experience, customer inertia, long sales cycles, understanding what distributors want/need.
What is your biggest challenge regarding sales?

hardwareclub.co/pages/hardware-startup-report30
0 4 M A R K E T I N G & SA L E S
Series A startups can still be at a pre-launch or pre-commercialisation stage11% of the series A respondents haven’t shipped yet, which is half the number for seed respondents (20%).
Pre-seed Seed Series ABridge to series A
10%
20%
40%
10%
20%
20%
22%
24%
15%
19%
24%
18%
41%
6%
11%
DISTRIBUTION OF SALES STATUS BY LAST FUNDING ROUND
11%
44%
34%
11%
Pre-launch / Pre-commercialisationPre-orders / LOIShipping / PilotRetail / DeployingScaling / Growth

hardwareclub.co/pages/hardware-startup-report31
X X X X X X X0 1
05 TEAM & HIRING — Most companies are aligned with their hiring plan timeline
— Hardware engineering positions are the hardest roles to fill across all departments
— Founders find new hires mostly through active outreach
— Founders own on average 34% in equity after the series A
— The option pool remains on average around 10% regardless of the funding stage
— Overall, the equity allocated to top management positions matches Silicon Valley’s standards
— Finding the right talents might be founders’ biggest challenge but making the right hire comes actually right after
— Having remote teams and multiple offices aren’t the norm yet but are pretty common practices
— Most pre-series A founders wear the CFO hat
— A pair of cofounders is the most common profile of founding teams
� 32
� 33
� 34
� 35
� 36
� 37
� 38
� 39
� 40
� 41

hardwareclub.co/pages/hardware-startup-report32
0 5 T E A M & H I R I N G
Most companies are aligned with their hiring plan timeline22% among the series A respondents are late on their hiring plan, which is x2.1 less than the companies at the bridge to series A stage.
Bridge to series A
40%
60%
0%
39%
56%
5%
47% 47%
6%
78%
22%
0%Pre-seed Seed Series A
DISTRIBUTION OF HIRING PLAN STATUS BY LAST FUNDING ROUND
Behind scheduleOn timeIn advance

hardwareclub.co/pages/hardware-startup-report33
0 5 T E A M & H I R I N G
Hardware engineering positions are the hardest roles to fill across all departmentsSoftware engineering is the second most challenging role (19%) to fill according to respondents.
N.B.: Companies could pick up to 3 answers among the listed roles
23%19%
15%10%
8%8%
6%3%3%3%
2%0%
Hardware engineeringSoftware engineering
SalesC-level / execs
ProductMarketing
MaunfacturingDesign
OperationsSupply chain / logistics
FinanceHR
WHAT ARE THE 3 MOST DIFFICULT ROLES TO HIRE?

hardwareclub.co/pages/hardware-startup-report34
T E A M & H I R I N G0 5
Founders find new hires mostly through active outreachInbound candidatures are also a very performant pipeline and ranks second before employee referrals and profesional recruiters.
N.B.: Companies could pick up to 3 answers among the listed roles
WHAT ARE YOUR TOP 3 PIPELINES FOR HIRING?
75%
66%
55%
34%
34%
23%
14%
�Active outreach
�Inbound candidatures
�Employee referrals
�Recruiting agencies / contractors
�Investors / advisors / board members referrals
�Internships
�Other (please specify)
We have been doubling in size every year since our founding. By offering an array of internships, we have an unfair advantage to fresh talent that is eager to get to work with our team of engineers, developers and roboticists to make the impossible possible at A&K.
Matthew Anderson Cofounder & CEO - A&K Robotics
”

hardwareclub.co/pages/hardware-startup-report35
T E A M & H I R I N G0 5
Founders own on average 34% of the equity after the series ASeries A founders own x2 less equity than seed founders (67%).
87%
67%
53%
34%
Series APre-seed Seed Bridge to series A
AVERAGE % OF EQUITY OWNED BY FOUNDERS BY LAST FUNDING ROUND

hardwareclub.co/pages/hardware-startup-report36
0 5 T E A M & H I R I N G
The option pool remains on average around 10% regardless of the funding stageSeries A respondents have the biggest option pool with 12% on average.
AVERAGE AND MAXIMUM SIZE OF OPTION POOL BY LAST FUNDING ROUND
18%
12%
20%
9%
15%
5%
10%
50%
Series APre-seed Seed Bridge to series A
MaxMean

hardwareclub.co/pages/hardware-startup-report37
T E A M & H I R I N G0 5
Overall, the equity allocated to top management positions matches Silicon Valley’s standards
�Director-level
�VP-level
�C-level 20%
1.86%
3.74%
5%
1.34%
4%
AVERAGE EQUITY GRANTED BY SENIORITY LEVEL STANDARD VALUES FOR ALLOCATING EQUITY
TITLE RANGE (%)
CEO 5 - 10
COO 2 - 5
VP 1 - 2
Independent board member 0.4 - 1.25
Director 0.5 - 1
Lead engineer 0.5 - 1
5+ years experience engineer 0.33 - 0.66
Manager or junior engineer 0.2 - 0.33
MaxMean
N.B.: Data according to Venture Hacks (source: https://venturehacks.com/articles/option-pool-shuffle#market)

hardwareclub.co/pages/hardware-startup-report38
0 5 T E A M & H I R I N G
Designing and running an efficient hiring process is the 4th biggest challenge met by respondents. Competition with other big tech companies or startups is very difficult for only 14% of the companies.
Finding the right talents might be founders’ biggest challenge but making the right hire comes actually right after
43% 9%31%16%
HOW DIFFICULT OR EASY WERE THESE ASPECTS OF THE HIRING PROCESS?
Very easy Somewhat easy Neither difficult nor easy Somewhat difficult Very difficult
Getting candidates excited about the job / company
Designing a compensation package
Designing an efficient recruiting process
Competing with other big tech co or startups for the final offer
Designing and running an efficient hiring process
Nurturing a constant flow of interesting profiles for your hiring pipeline
Making the right hire
Finding the tallents with the right skills / experience
Vetting a candidate (through home projects, reference calls, third-party opinions...)
Onboarding a new employee
Writing the job position ads
35%21% 25% 14%5%
42% 19%30%9%
26%45%3% 21% 5%
40%38%17% 5%
8%41% 23%28%
19% 26%36%18%1%
22% 26%39%11%1%
45%33%17%4%1%
36% 13% 1%41%9%
4% 34% 18% 4%40%

hardwareclub.co/pages/hardware-startup-report39
0 5 T E A M & H I R I N G
Remote teams and multiple offices aren’t the norm yet but are pretty common practicesA third of the respondents have more than one office and a third of them are working across multiple countries.
54% of the respondents have 0 FTEs working remote
24% of the respondents have 15% or more of their FTEs working remote
1 office: 70%2 offices: 25%3 offices: 5%
1 country: 64%2 countries: 29%3 countries: 7%
How many offices do you have?
On how many countries is your team split?
Europe and the Bay Area remain dominant centers of tech concentration, but teams are becoming more distributed as well. Arch Systems is headquartered in the Silicon Valley Bay Area, but will soon have around half of our team working distributed in other regions as we serve global manufacturing customers with machine data and analytics.
Andrew Scheuermann CEO - Arch Systems
”

hardwareclub.co/pages/hardware-startup-report40
0 5 T E A M & H I R I N G
Most pre-series A founders wear the CFO hat
22% 56%Series A
Bridge to series A
Seed
Pre-seed
11%
35%
11%
6%12%47%
45%
70% 20% 10%
28% 18% 10%
DO YOU HAVE AN IN-HOUSE CFO?
No, I’m taking care of our financials & accountingNo, I’m doing some and outsourcing some functionsYes, we have a dedicated CFONo, I’m outsourcing financials & accounting

hardwareclub.co/pages/hardware-startup-report41
0 5 T E A M & H I R I N G
A pair of cofounders is the most common profile of founding teams22% of the series A CEOs aren’t a founder of the company, which is x2.4 more than CEOs at the bridge to series A stage.
2 cofounders: 41%3 cofounders: 26%1 cofounder: 16%4 cofounders: 10%5 cofounders: 7%
�Pre-seed
�Seed
�Bridge to series A
�Series A
98%
0%
2%
6%
100%
94%
78%22%
CEO’S FOUNDER STATUS BY LAST FUNDING ROUND
How many cofounders does the company have?
CEO is a founderCEO isn’t a founder

hardwareclub.co/pages/hardware-startup-report42
06 FINANCIALS — Companies majoritarily optimize for growth over profitability
— Companies forecast to be profitable within a 18-month window, no matter the funding stage
� 43
� 44

hardwareclub.co/pages/hardware-startup-report43
F I N A N C I A L S0 6
Companies majoritarily optimize for growth over profitability40% of the pre-seed respondents are optimizing for profitability, which is x3.6 more than the series A respondents.
Series A
60%
40%
70%
30%
71%
29%
89%
11%
Pre-seed Seed Bridge to series A
GROWTH OR PROFITABILITY GOAL BY LAST FUNDING ROUND
Growth Profitability

hardwareclub.co/pages/hardware-startup-report44
0 6 F I N A N C I A L S
Companies forecast to be profitable within a 18-month window, no matter the funding stageRespondents who raised a bridge to series A round have the highest MoM (Month-over-Month) growth and the shortest expected path to profitability.
AVERAGE MoM GROWTH AND PROFITABILITY TIMELINE BY LAST FUNDING ROUND
17
16
15%
15
16
19%
Pre-seed Seed Series ABridge to series A
12%7%
Average MoM (Month-over-Month) growth so far in 2018Average number of months before reaching profitability

hardwareclub.co/pages/hardware-startup-report45
07 FUNDING — For pre-seed rounds, European startups massively prefer priced round to convertible notes unlike North
American startups
— At pre-seed, North American startups raised x1.4 the amount raised by European startups
— 43% of North American respondents picked a priced round for their seed funding versus 15% at pre-seed
— The seed rounds of North American respondents are x1.9 higher than Europeans’ both in terms of capital raised and valuation / cap
— Convertible notes are the preferred way to raise a bridge to series A round among North American respondents
— Bridge rounds are x2.7 bigger for respondents based in North America compared to respondents in Europe
— Finding who invests in hardware / who could be a good fit is founders’ biggest challenges regarding fundraising
— A majority of European respondents (69%) have benefited from grants
— Angels are the most represented class of investors across early-stage funding rounds
— A third of the founders consider their investors to be very involved, no matter the funding stage
— When it comes to their exit strategy, hardware companies majoritarily target acquisitions over IPOs
— Founders are optimistic regarding the M&A market for hardware startups
� 46
� 47
� 48
� 49
� 50
� 51
� 52
� 53
� 54
� 55
� 56
� 57

hardwareclub.co/pages/hardware-startup-report46
F U N D I N G0 7
For pre-seed rounds, European startups massively prefer priced round to convertible notes unlike North American startups85% of the companies based in North America choose convertible notes for their seed round, which is x4.5 more than respondents based in Europe.
Europe North America
81%
19% 15%
85%
N.B.: Due to the limited number of answers obtained for other regions we decided to not feature Asia, South America and Australia.
DISTRIBUTION OF TYPES OF ROUND BY GEOGRAPHICAL AREA FOR PRE-SEED ROUNDS
ConvertiblePriced

hardwareclub.co/pages/hardware-startup-report47
0 7 F U N D I N G
At pre-seed, North American startups raised x1.4 the amount raised by European startupsThe average valuation / cap of North American respondents is x2.1 higher than their European counterparts.
N.B.: Due to the limited number of answers obtained for other regions we decided to not feature Asia, South America and Australia.
AVERAGE AMOUNT RAISED AND VALUATION / CAP BY GEOGRAPHICAL AREA FOR PRE-SEED ROUNDS
Average amount raisedAverage valuation/cap
Europe North America
$ 5 192 308
$ 721 385
$ 2 447 619
$ 513 812

hardwareclub.co/pages/hardware-startup-report48
F U N D I N G0 7
43% of North American respondents picked a priced round for their seed funding versus 15% at pre-seedFor European respondents, the distribution between convertible and priced rounds at seed stage (respectively 20% and 80%) is the same as at pre-seed stage (cf. previous slide).
N.B.: Due to the limited number of answers obtained for other regions we decided to not feature Asia, South America and Australia.
DISTRIBUTION OF TYPES OF ROUND BY GEOGRAPHICAL AREA FOR SEED ROUNDS
43%
57%
43%
20%
80%
Europe North America
ConvertiblePriced

hardwareclub.co/pages/hardware-startup-report49
F U N D I N G0 7
The seed rounds of North American respondents are x1.9 higher than Europeans’ both in terms of capital raised and valuation / capThe average amount raised by respondents at seed stage fluctuates between $1M and $2M across Europe and North America.
N.B.: Due to the limited number of answers obtained for other regions we decided to not feature Asia, South America and Australia.
AVERAGE AMOUNT RAISED AND VALUATION / CAP BY GEOGRAPHICAL AREA FOR SEED ROUNDS
$ 1 988 267
$ 1 060 745
$ 8 250 934
$ 4 430 207
Europe North America
Average amount raisedAverage valuation / cap

hardwareclub.co/pages/hardware-startup-report50
0 7 F U N D I N G
Convertible notes are the preferred way to raise a bridge to series A round among North American respondentsFor respondents based in Europe, priced round were as popular as convertible notes to raise a bridge to series A round.
N.B.: Due to the limited number of answers obtained for other regions we decided to not feature Asia, South America and Australia.
DISTRIBUTION OF TYPES OF ROUND BY GEOGRAPHICAL AREA FOR BRIDGE TO SERIES A ROUNDS
80%
20%
50% 50%
Europe North America
ConvertiblePriced

hardwareclub.co/pages/hardware-startup-report51
F U N D I N G0 7
Bridge rounds are x2.7 bigger for respondents based in North America compared to respondents in EuropeThe average valuation of North American startups is x1.7 higher than the European startups’ for bridge to series A rounds.
AVERAGE AMOUNT RAISED AND VALUATION / CAP BY GEOGRAPHICAL AREA FOR BRIDGE TO SERIES A ROUNDS
$ 777 500
$ 2 128 000
$ 5980 000
$ 10 175 000
Europe North America
Average amount raisedAverage valuation / cap
N.B.: Due to the limited number of answers obtained for series A rounds we decided not to feature the data.

hardwareclub.co/pages/hardware-startup-report52
F U N D I N G0 7
Finding who invests in hardware / who could be a good fit is founders’ biggest challenges regarding fundraising54% of the companies find it very difficult or somewhat difficult to answer odd questions asked by investors who have no experience in hardware.
The legal paperwork after signing the term sheetNegotiating the term sheet
Preparing the material for due diligenceGetting nos from VCs
Gathering all the data asked by VCsNot knowing where you stand in the process of the firm
Getting initial meetings (trough cold emailing, warm intros, etc.)Creating the fundraising deck
Having to answer odd questions by VCs unaccustomed to hardwareNot understanding why VCs have passed
The number of VCs I had to meet during the processGetting an idea of who invests in hardware / who could be a good fit
4% 25% 34% 30% 7%
41%38%18% 3%
27% 34% 31% 8%
9%30%27%33%
26%10% 16% 48%
25% 19% 38% 15%3%
23% 32%3% 29% 13%
21% 26% 44% 10%
34%31% 20%14%
25% 36% 19%20%
41% 30% 21%7%
31% 37% 26%6%
Very easy Somewhat easy Neither difficult nor easy Somewhat difficult Very difficult
HOW DIFFICULT OR EASY WERE THESE ASPECTS OF THE FUNDRAISING PROCESS?

hardwareclub.co/pages/hardware-startup-report53
0 7 F U N D I N G
A majority of European respondents (69%) have benefited from grantsOn one hand, 69% of the startups based in Europe received grant, which is x4 the number of North American companies who did so. On the other hand, the average amount of grants received in North America is almost twice as large as the average amount for European startups.
Average amount in grants received by startups
31%
17%
83%
69%
Europe North America
North America
$909 208Europe
$461 354
DISTRIBUTION OF GRANT FUNDING STATUS BY GEOGRAPHICAL AREA
Received grant fundingDid not receive grant funding

hardwareclub.co/pages/hardware-startup-report54
2%
0 7 F U N D I N G
Angels are the most represented class of investors across early-stage funding rounds Among respondents, angels and friends & family account for more than 50% of the investors present on the cap table from pre-seed up to series A.
9%9%
55%
27%
15%
32%
36%
15% 14%
36%
36%
14%
22%
42%
28%
7%1%
Pre-seed Seed Series ABridge to series A
DISTRIBUTION OF TYPES OF INVESTORS PRESENT ON THE CAP TABLE BY LAST FUNDING ROUND
Friends & familyAngelsVCCVCPE

hardwareclub.co/pages/hardware-startup-report55
0 7 F U N D I N G
A third of the founders consider their investors to be very involved, no matter the funding stageMost founders consider that their investors are “somewhat involved”.
HOW INVOLVED ARE YOUR INVESTORS IN SUPPORTING YOU?
36%
38% �Series A
�Bridge to series A
�Seed
�Pre-seed
62%
59%
54%
33% 33%33%
8%
41%
2%
I didn’t involve them Somewhat involved Very involvedNot involved at all

hardwareclub.co/pages/hardware-startup-report56
0 7 F U N D I N G
When it comes to their exit strategy, hardware companies majoritarily target acquisitions over IPOsOnly 17% of the respondents see the IPO as their realistic long-term goal for their company.
47% �Acquisition
�IPO
�Stay private
�Not decided yet
17%
11%
25%
WHAT IS YOUR REALISTIC LONG-TERM GOAL FOR THE COMPANY?

hardwareclub.co/pages/hardware-startup-report57
0 7 F U N D I N G
Founders are optimistic regarding the M&A market for hardware startupsMore than 50% of the respondents in Europe and North America predict more acquisitions to come in the hardware space
Europe North America
17%
54%
29% 36%
50%
14%
DISTRIBUTION OF M&A PROJECTIONS FOR HARDWARE STARTUPS BY GEOGRAPHICAL AREA
Fewer acquisitionsNo changeMore acquisitions
