harnessing success: determinants of university technology licensing performance
DESCRIPTION
Harnessing Success: Determinants of University Technology Licensing Performance. Sharon Belenzon Nuffield College, Oxford University Mark Schankerman London School of Economics and CEPR Presentation for Lausanne September 2006. Introduction. Many studies find that private universities - PowerPoint PPT PresentationTRANSCRIPT

Harnessing Success: Determinants of University Technology Licensing Performance
Sharon BelenzonNuffield College, Oxford University
Mark Schankerman London School of Economics and CEPR
Presentation for LausanneSeptember 2006
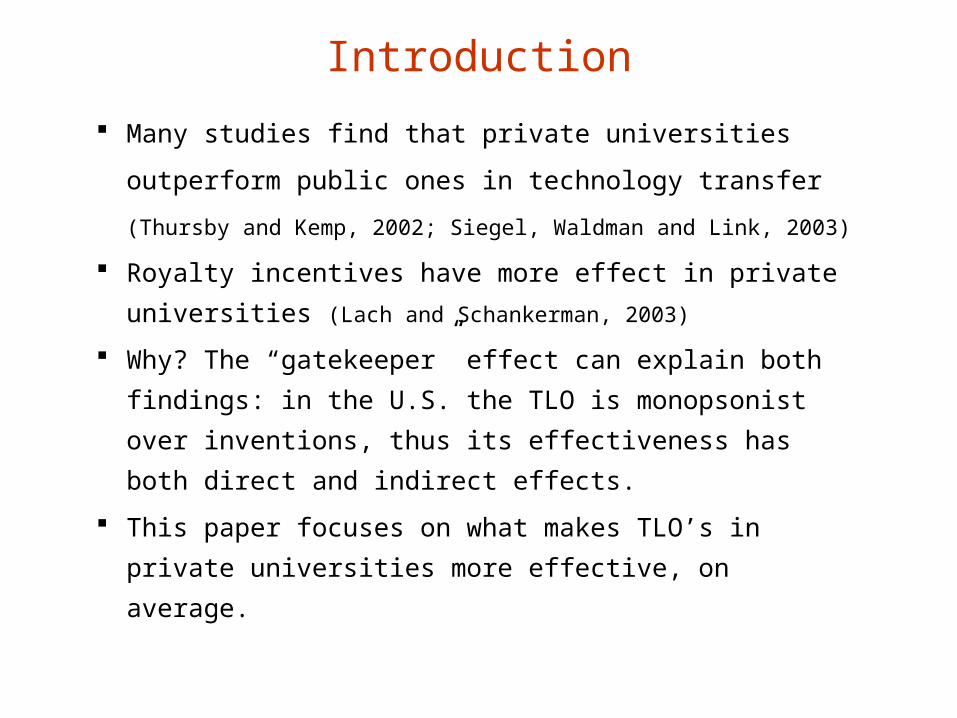
Introduction
Many studies find that private universities
outperform public ones in technology transfer
(Thursby and Kemp, 2002; Siegel, Waldman and Link, 2003)
Royalty incentives have more effect in private
universities (Lach and Schankerman, 2003)
Why? The “gatekeeper” effect can explain both
findings: in the U.S. the TLO is monopsonist over
inventions, thus its effectiveness has both direct
and indirect effects.
This paper focuses on what makes TLO’s in
private universities more effective, on average.
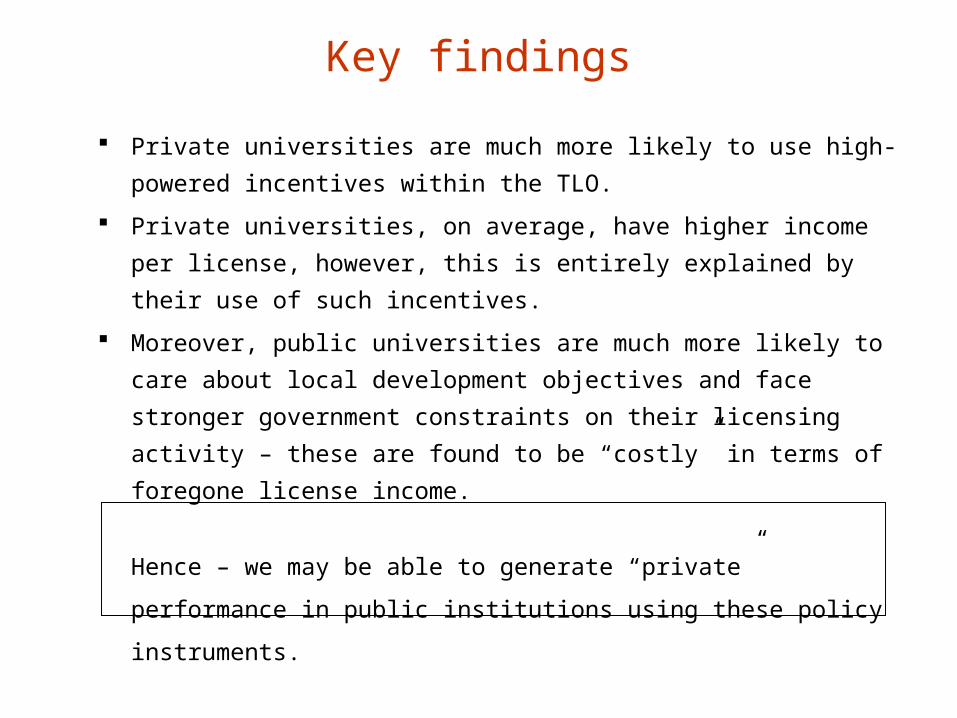
Private universities are much more likely to use high-powered
incentives within the TLO.
Private universities, on average, have higher income per license,
however, this is entirely explained by their use of such
incentives.
Moreover, public universities are much more likely to care about
local development objectives and face stronger government
constraints on their licensing activity – these are found to be
“costly” in terms of foregone license income.
Hence – we may be able to generate “private” performance in
public institutions using these policy instruments.
Key findings
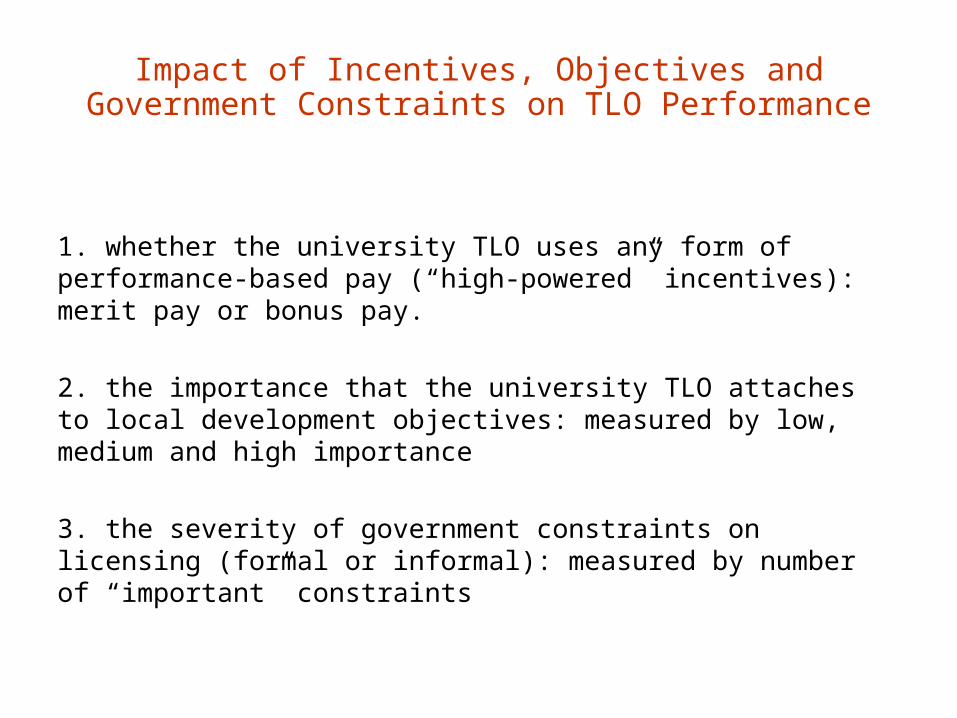
Impact of Incentives, Objectives andGovernment Constraints on TLO Performance
1. whether the university TLO uses any form of performance-based pay (“high-powered” incentives): merit pay or bonus pay.
2. the importance that the university TLO attaches to local development objectives: measured by low, medium and high importance
3. the severity of government constraints on licensing (formal or informal): measured by number of “important” constraints

An Agency Model of the TLO with Incentivesand Local Development Objectives
TLO licenses inventions in national or local market.
Unit cost:
Unit payoff:
= fraction of effort devoted to licensing in the local market
Quadratic effort costs:
L
1 and LN pp
2)))1((2
1)( LN ppeC
The TLO compensates the worker in two ways: a fixed-wage and
a performance-based pay (in the form of a constant fraction of
licensing revenues).
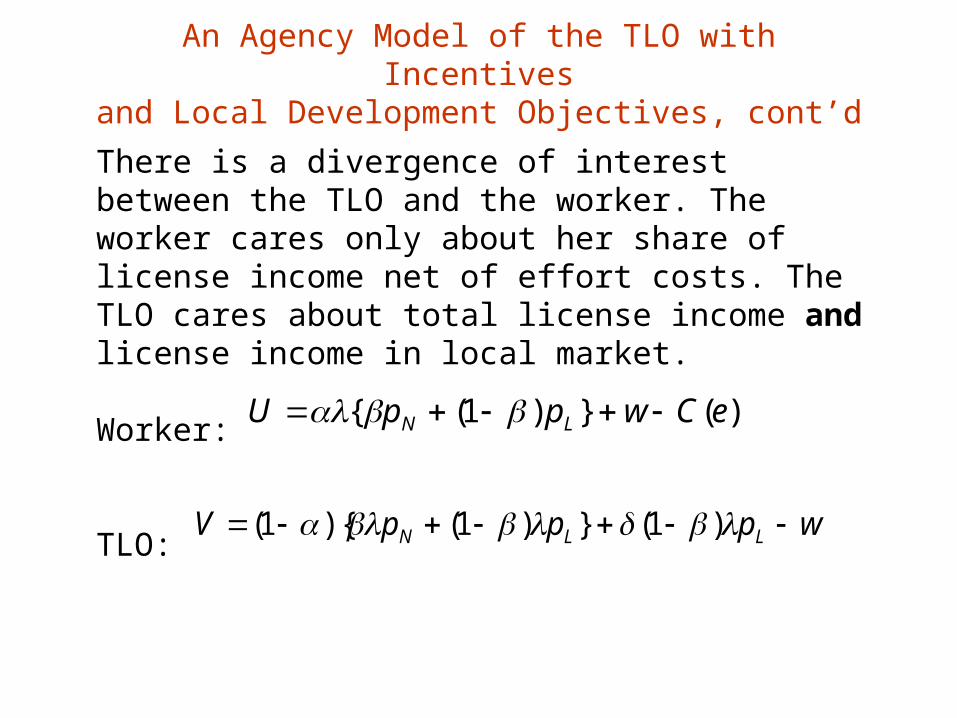
There is a divergence of interest between the TLO and the worker. The worker cares only about her share of license income net of effort costs. The TLO cares about total license income and license income in local market.
Worker:
TLO:
)(})1({ eCwppU LN
wpppV LLN )1(})1(){1(
An Agency Model of the TLO with Incentivesand Local Development Objectives, cont’d
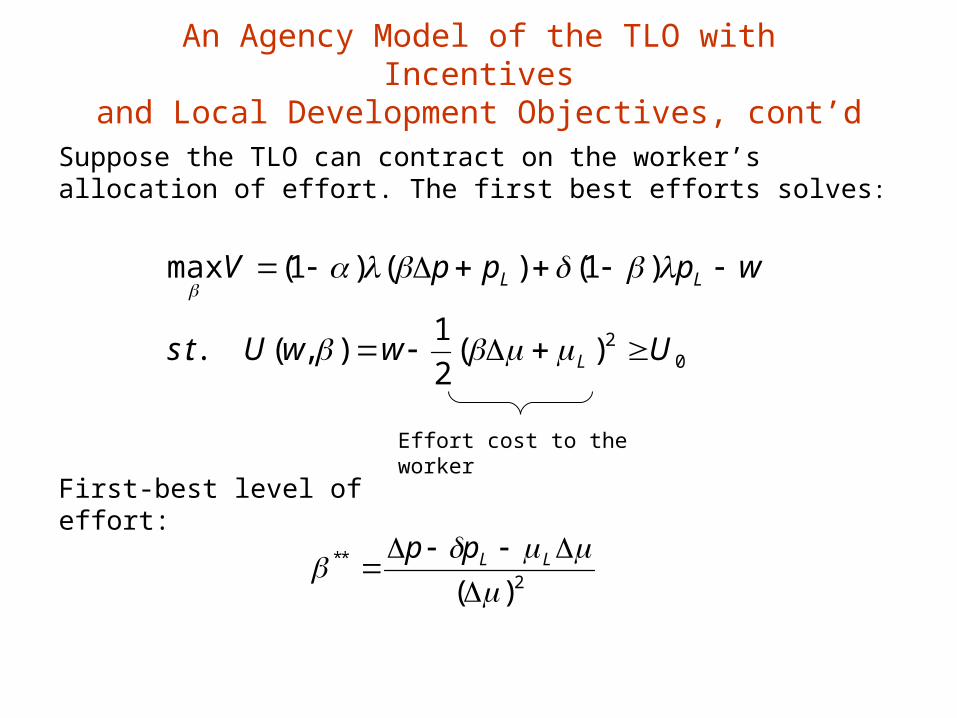
2**
)(
LLpp
First-best level of effort:
02)(
2
1),( ..
)1()()1(max
UwwUts
wpppV
L
LL
Effort cost to the worker
Suppose the TLO can contract on the worker’s allocation of effort. The first best efforts solves:
An Agency Model of the TLO with Incentivesand Local Development Objectives, cont’d
02 )( ..
2
1)()(max UUtswppU LL
2*
)(
LLpp
0***
,)( .. ))(1())()(1(max UUtswpppV LL
w
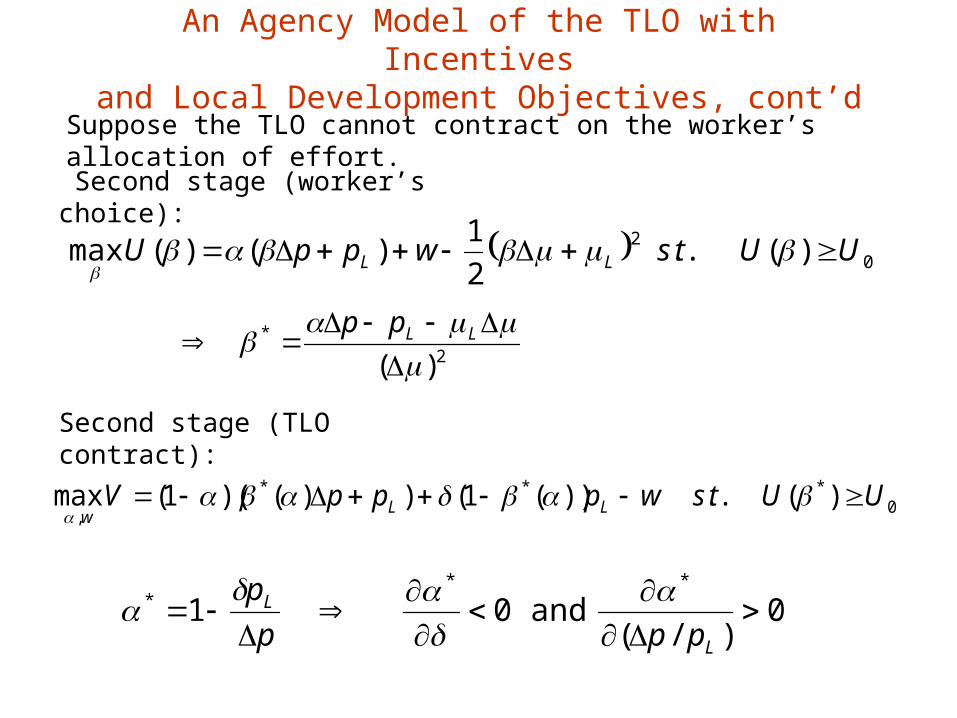
0)/(
and 0 1**
*
L
L
ppp
p
Suppose the TLO cannot contract on the worker’s allocation of effort.
Second stage (TLO contract):
Second stage (worker’s choice):
An Agency Model of the TLO with Incentivesand Local Development Objectives, cont’d
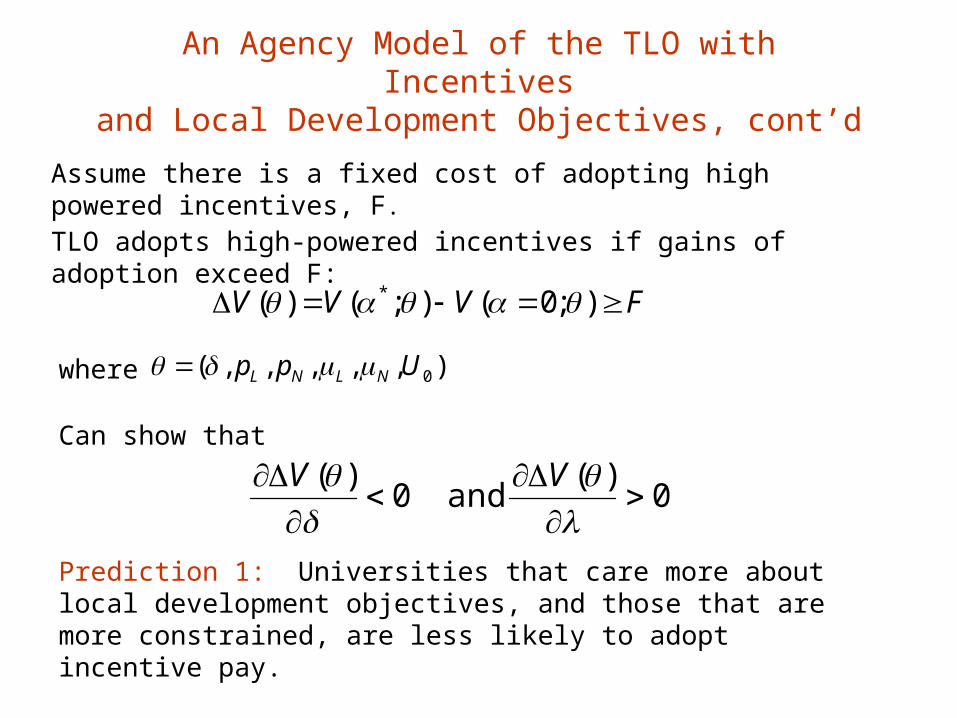
0)(
and 0)(
VV
Can show that
Prediction 1: Universities that care more about local development objectives, and those that are more constrained, are less likely to adopt incentive pay.
FVVV );0();()( *
),,,,,( 0Upp NLNL where
Assume there is a fixed cost of adopting high powered incentives, F.
TLO adopts high-powered incentives if gains of adoption exceed F:
An Agency Model of the TLO with Incentivesand Local Development Objectives, cont’d
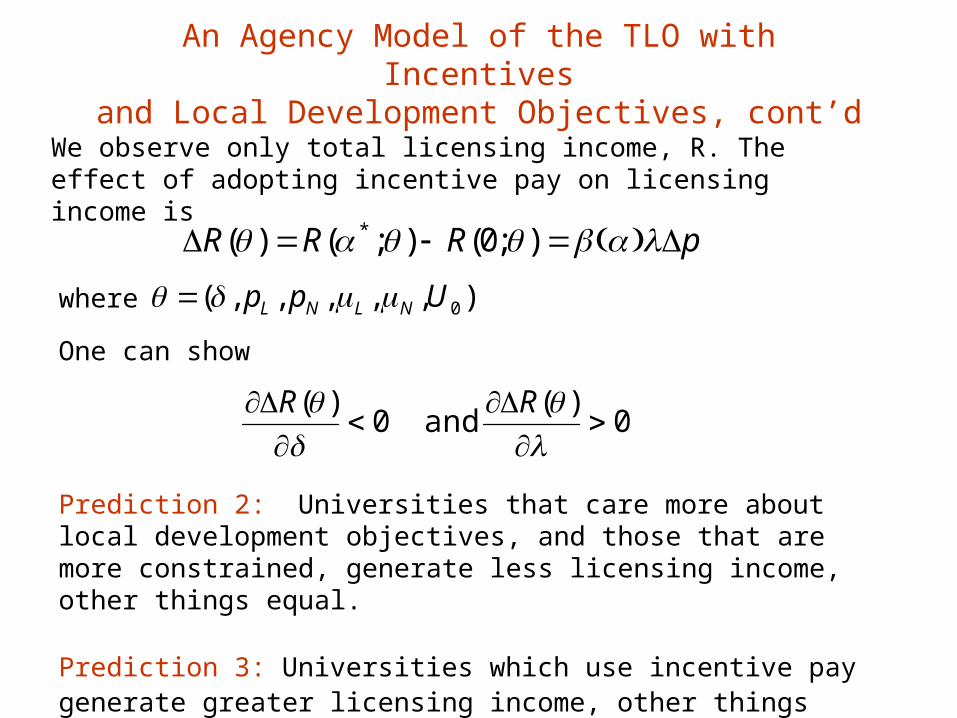
One can show
Prediction 2: Universities that care more about local development objectives, and those that are more constrained, generate less licensing income, other things equal.
Prediction 3: Universities which use incentive pay generate greater licensing income, other things equal.
pRRR );0();()( *
0)(
and 0)(
RR
),,,,,( 0Upp NLNL where
We observe only total licensing income, R. The effect of adopting incentive pay on licensing income is
An Agency Model of the TLO with Incentivesand Local Development Objectives, cont’d

Data description
VariableNumber of universities
Dummy for Private
Full-time TLO employees
TechPole
Incentives
No incentives 36 0.138 1.446 1.233
Merit pay 35 0.371 1.639 1.136
Bonus pay 15 0.400 2.046 3.526
Local objectives
LOCDEV=Low 20 0.450 1.430 1.617
LOCDEV=Medium 37 0.297 1.758 1.635
LOCDEV=High 29 0.138 1.603 1.524
Government constraint
NumConst<3 66 0.364 1.757 1.641
NumConst≥3 20 0 1.208 1.436
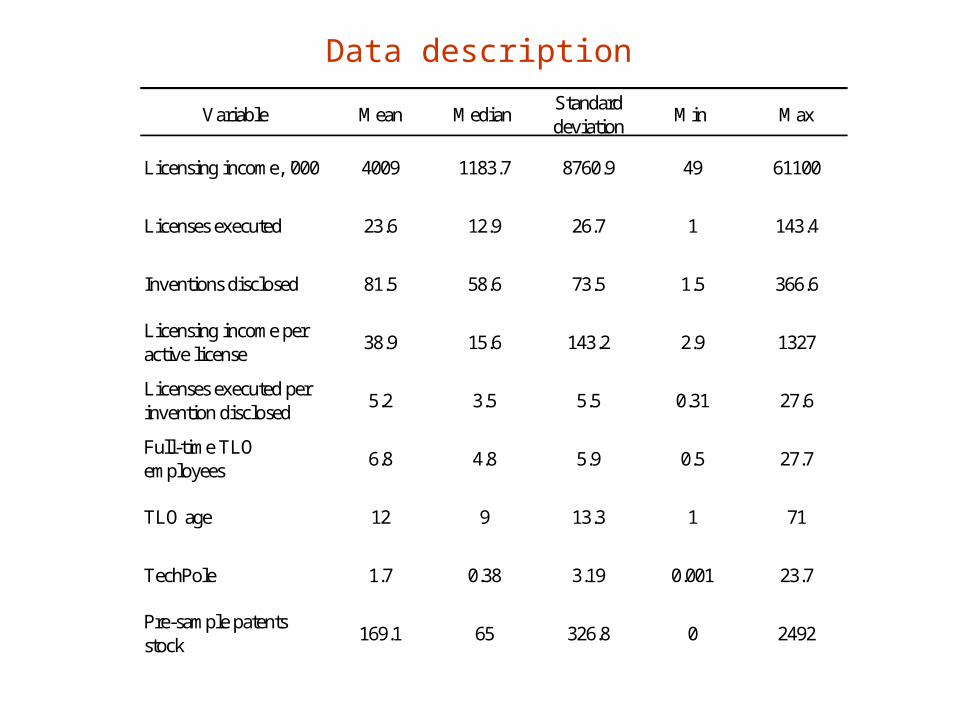
Data description
Variable Mean Median Standard deviation
Min Max
Licensing income, '000 4009 1183.7 8760.9 49 61100
Licenses executed 23.6 12.9 26.7 1 143.4
Inventions disclosed 81.5 58.6 73.5 1.5 366.6
Licensing income per active license
38.9 15.6 143.2 2.9 1327
Licenses executed per invention disclosed
5.2 3.5 5.5 0.31 27.6
Full-time TLO employees
6.8 4.8 5.9 0.5 27.7
TLO age 12 9 13.3 1 71
TechPole 1.7 0.38 3.19 0.001 23.7
Pre-sample patents stock
169.1 65 326.8 0 2492
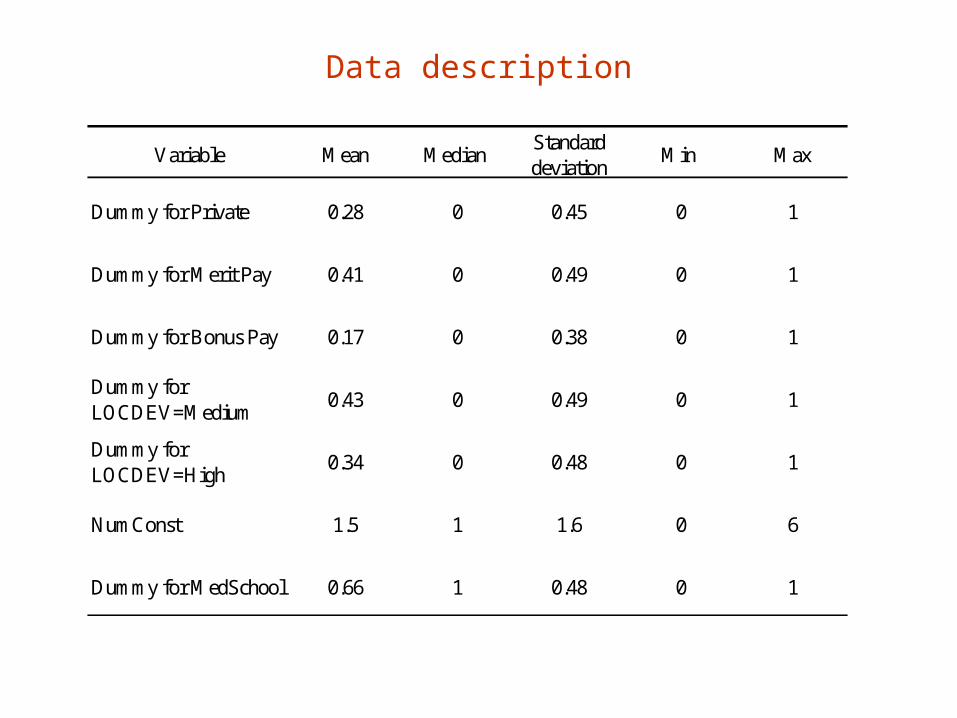
Data description
Variable Mean Median Standard deviation
Min Max
Dummy for Private 0.28 0 0.45 0 1
Dummy for Merit Pay 0.41 0 0.49 0 1
Dummy for Bonus Pay 0.17 0 0.38 0 1
Dummy for LOCDEV=Medium
0.43 0 0.49 0 1
Dummy for LOCDEV=High
0.34 0 0.48 0 1
NumConst 1.5 1 1.6 0 6
Dummy for MedSchool 0.66 1 0.48 0 1
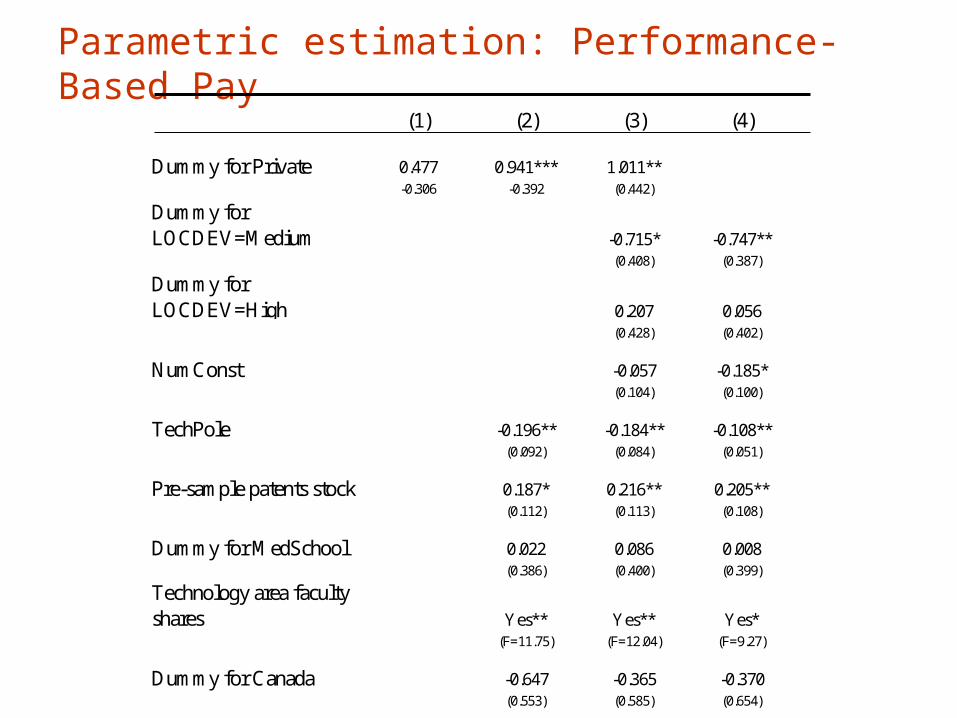
(1) (2) (3) (4)
Dummy for Private 0.477 0.941*** 1.011**-0.306 -0.392 (0.442)
Dummy for LOCDEV=Medium -0.715* -0.747**
(0.408) (0.387)
Dummy for LOCDEV=High 0.207 0.056
(0.428) (0.402)
NumConst -0.057 -0.185*(0.104) (0.100)
TechPole -0.196** -0.184** -0.108**(0.092) (0.084) (0.051)
Pre-sample patents stock 0.187* 0.216** 0.205**(0.112) (0.113) (0.108)
Dummy for MedSchool 0.022 0.086 0.008(0.386) (0.400) (0.399)
Technology area faculty shares Yes** Yes** Yes*
(F=11.75) (F=12.04) (F=9.27)
Dummy for Canada -0.647 -0.365 -0.370(0.553) (0.585) (0.654)
Parametric estimation: Performance-Based Pay
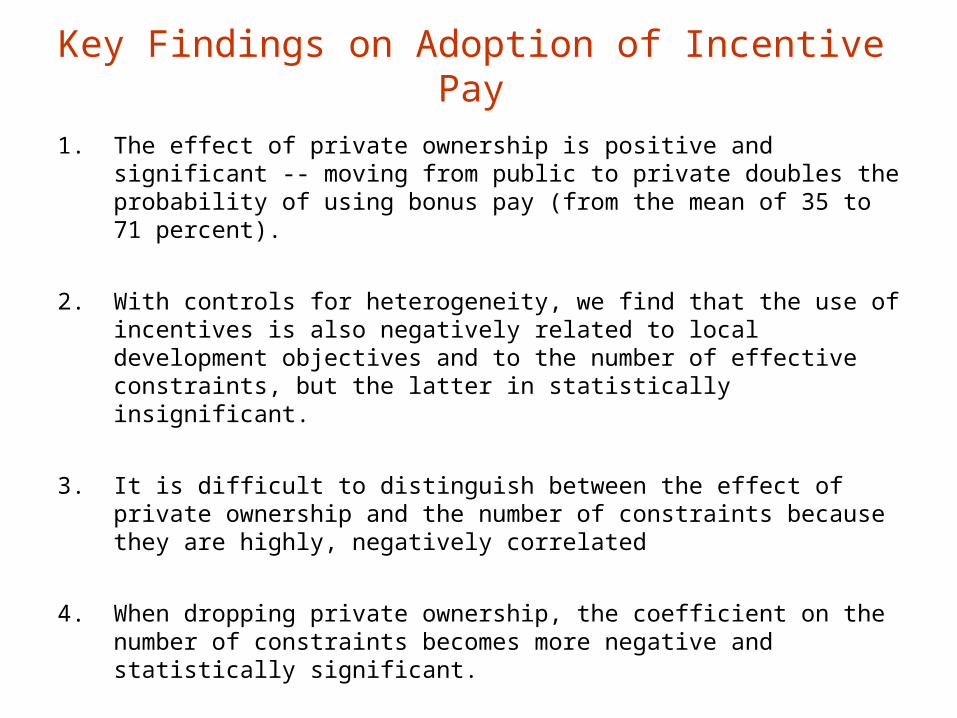
1. The effect of private ownership is positive and significant -- moving from public to private doubles the probability of using bonus pay (from the mean of 35 to 71 percent).
2. With controls for heterogeneity, we find that the use of incentives is also negatively related to local development objectives and to the number of effective constraints, but the latter in statistically insignificant.
3. It is difficult to distinguish between the effect of private ownership and the number of constraints because they are highly, negatively correlated
4. When dropping private ownership, the coefficient on the number of constraints becomes more negative and statistically significant.
Key Findings on Adoption of Incentive Pay
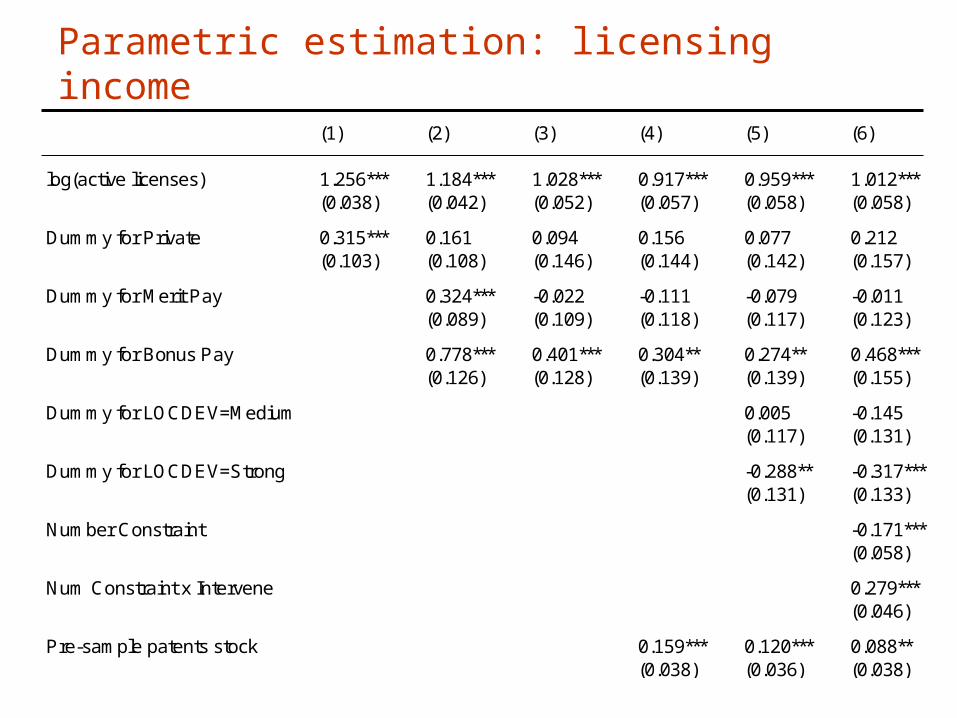
Parametric estimation: licensing income
(1) (2) (3) (4) (5) (6)
log(active licenses) 1.256*** 1.184*** 1.028*** 0.917*** 0.959*** 1.012***(0.038) (0.042) (0.052) (0.057) (0.058) (0.058)
Dummy for Private 0.315*** 0.161 0.094 0.156 0.077 0.212(0.103) (0.108) (0.146) (0.144) (0.142) (0.157)
Dummy for Merit Pay 0.324*** -0.022 -0.111 -0.079 -0.011(0.089) (0.109) (0.118) (0.117) (0.123)
Dummy for Bonus Pay 0.778*** 0.401*** 0.304** 0.274** 0.468***(0.126) (0.128) (0.139) (0.139) (0.155)
Dummy for LOCDEV=Medium 0.005 -0.145(0.117) (0.131)
Dummy for LOCDEV=Strong -0.288** -0.317***(0.131) (0.133)
Number Constraint -0.171***(0.058)
Num Constraint x Intervene 0.279***(0.046)
Pre-sample patents stock 0.159*** 0.120*** 0.088**(0.038) (0.036) (0.038)
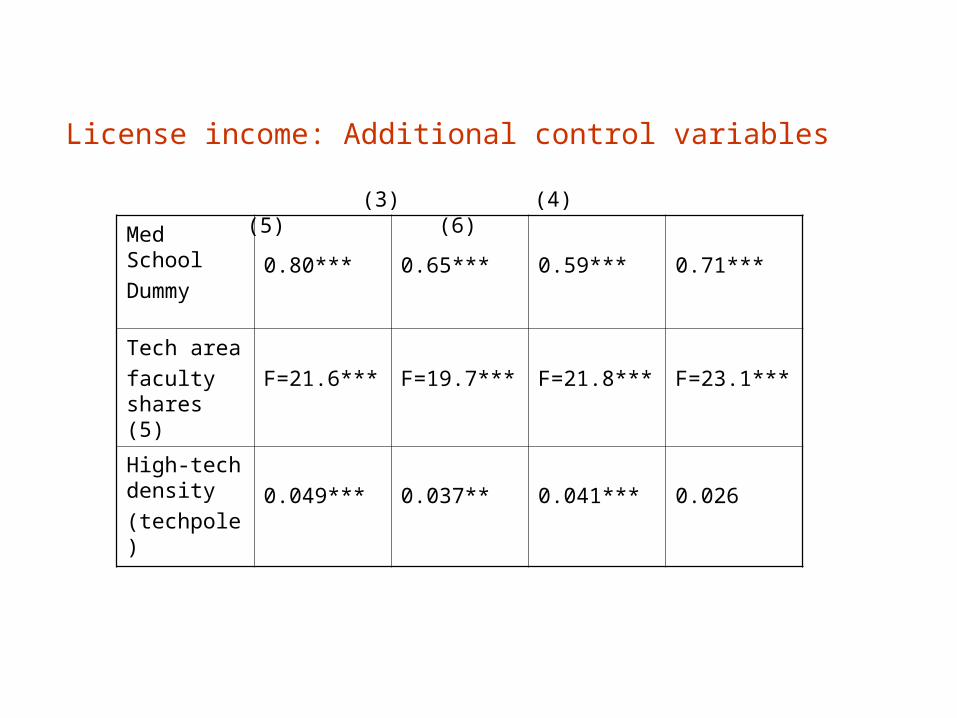
License income: Additional control variables
Med School
Dummy 0.80*** 0.65*** 0.59*** 0.71***
Tech area
faculty shares (5)
F=21.6*** F=19.7*** F=21.8*** F=23.1***
High-tech density
(techpole)0.049*** 0.037** 0.041*** 0.026
(3) (4) (5) (6)
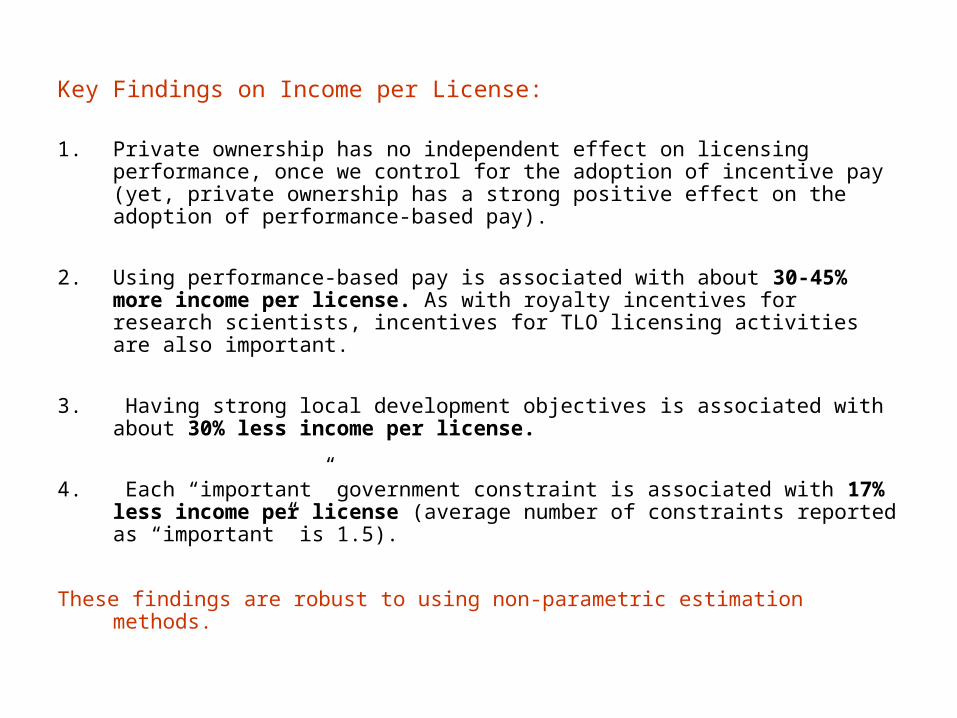
Key Findings on Income per License:
1. Private ownership has no independent effect on licensing performance, once we control for the adoption of incentive pay (yet, private ownership has a strong positive effect on the adoption of performance-based pay).
2. Using performance-based pay is associated with about 30-45% more income per license. As with royalty incentives for research scientists, incentives for TLO licensing activities are also important.
3. Having strong local development objectives is associated with about 30% less income per license.
4. Each “important” government constraint is associated with 17% less income per license (average number of constraints reported as “important” is 1.5).
These findings are robust to using non-parametric estimation methods.

Parametric estimation: licenses executed
(1) (2) (3) (4) (5) (6)
log(inventions disclosed) 0.855*** 0.849*** 0.838*** 0.754*** 0.744*** 0.756***(0.026) (0.028) (0.031) (0.039) (0.039) (0.039)
Dummy for Private 0.089 0.072 -0.039 -0.101 -0.042 0.017(0.059) (0.065) (0.068) (0.069) (0.071) (0.075)
Dummy for Merit Pay 0.023 0.058 0.039 0.023 0.055(0.069) (0.075) (0.073) (0.073) (0.075)
Dummy for Bonus Pay 0.136* 0.123 0.069 0.068 0.113(0.078) (0.079) (0.079) (0.078) (0.081)
Dummy for LOCDEV=Medium 0.127* 0.117*(0.068) (0.068)
Dummy for LOCDEV=Strong 0.288*** 0.282***(0.074) (0.073)
Number Constraint 0.038(0.033)
Num Constraint x Intervene 0.007(0.031)
Pre-sample patents stock 0.088*** 0.098*** 0.096***(0.024) (0.024) (0.024)
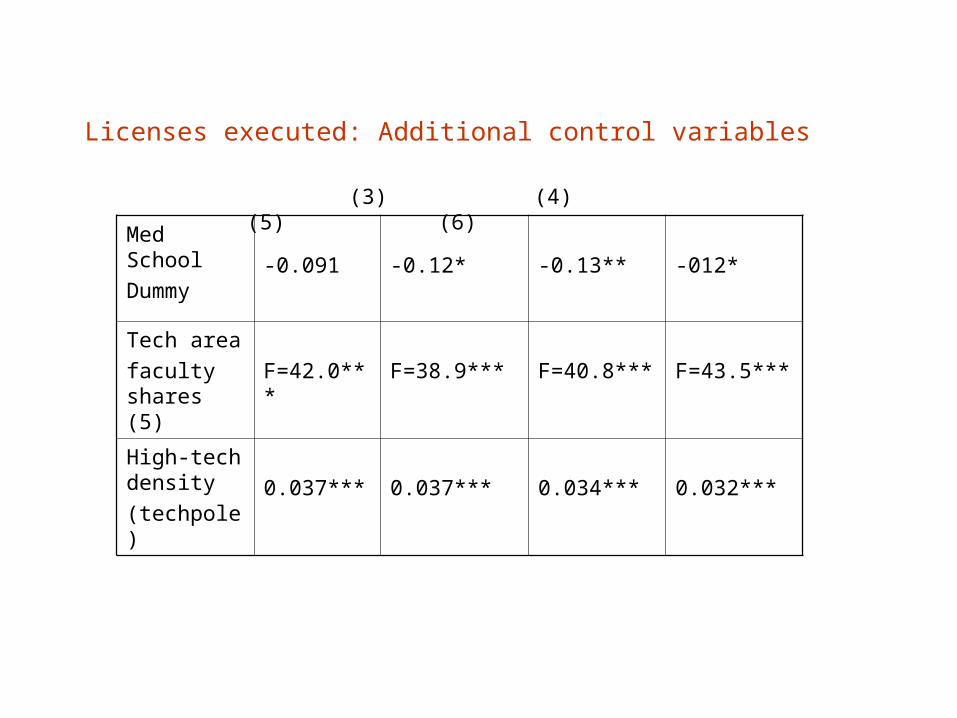
Licenses executed: Additional control variables
Med School
Dummy -0.091 -0.12* -0.13** -012*
Tech area
faculty shares (5)
F=42.0*** F=38.9*** F=40.8*** F=43.5***
High-tech density
(techpole)0.037*** 0.037*** 0.034*** 0.032***
(3) (4) (5) (6)
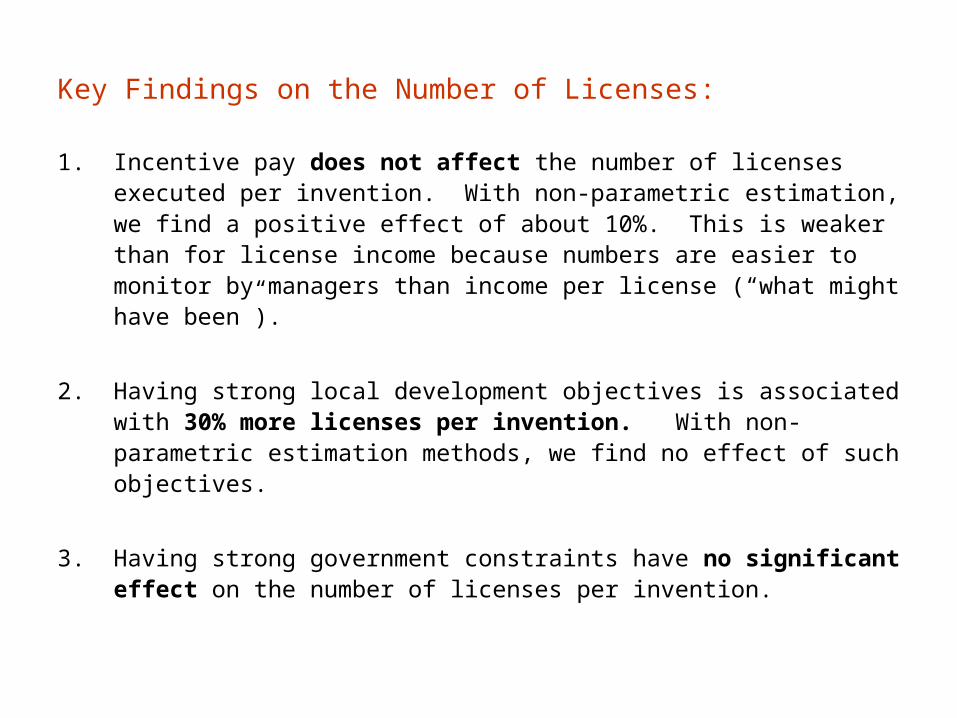
Key Findings on the Number of Licenses:
1. Incentive pay does not affect the number of licenses executed per invention. With non-parametric estimation, we find a positive effect of about 10%. This is weaker than for license income because numbers are easier to monitor by managers than income per license (“what might have been”).
2. Having strong local development objectives is associated with 30% more licenses per invention. With non-parametric estimation methods, we find no effect of such objectives.
3. Having strong government constraints have no significant effect on the number of licenses per invention.
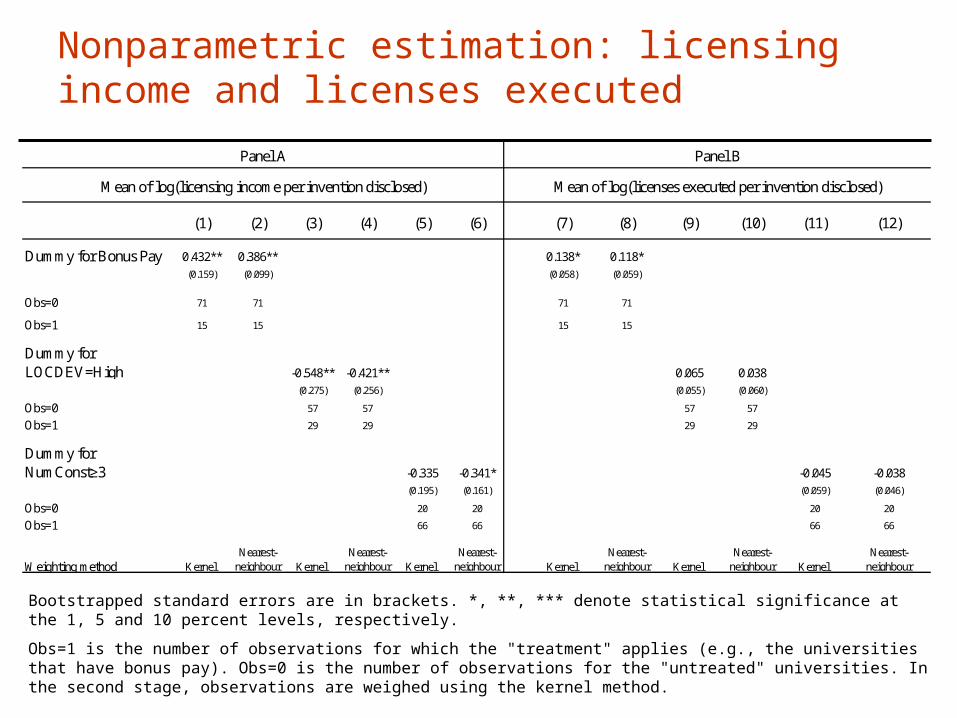
(1) (2) (3) (4) (5) (6) (7) (8) (9) (10) (11) (12)
Dummy for Bonus Pay 0.432** 0.386** 0.138* 0.118*(0.159) (0.099) (0.058) (0.059)
Obs=0 71 71 71 71
Obs=1 15 15 15 15
Dummy for LOCDEV=High -0.548** -0.421** 0.065 0.038
(0.275) (0.256) (0.055) (0.060)
Obs=0 57 57 57 57
Obs=1 29 29 29 29
Dummy for NumConst≥3 -0.335 -0.341* -0.045 -0.038
(0.195) (0.161) (0.059) (0.046)
Obs=0 20 20 20 20
Obs=1 66 66 66 66
Weighting method Kernel Nearest-
neighbour Kernel Nearest-
neighbour Kernel Nearest-
neighbour Kernel Nearest-
neighbour Kernel Nearest-
neighbour Kernel Nearest-
neighbour
Panel B
Mean of log(licenses executed per invention disclosed)Mean of log(licensing income per invention disclosed)
Panel A
Nonparametric estimation: licensing income and licenses executed
Bootstrapped standard errors are in brackets. *, **, *** denote statistical significance at the 1, 5 and 10 percent levels, respectively.
Obs=1 is the number of observations for which the "treatment" applies (e.g., the universities that have bonus pay). Obs=0 is the number of observations for the "untreated" universities. In the second stage, observations are weighed using the kernel method.
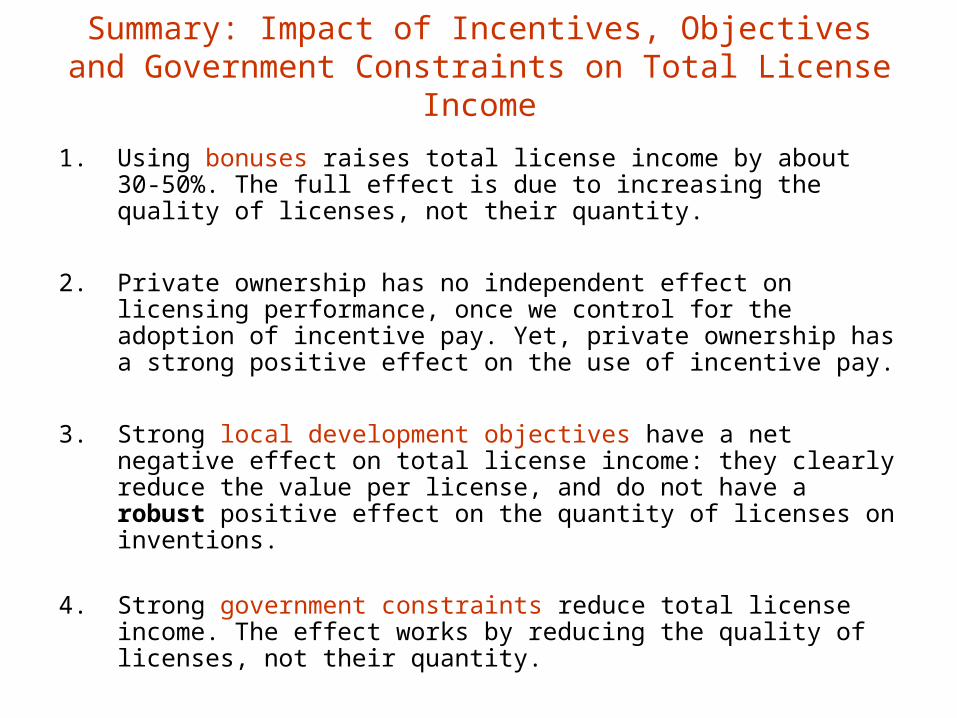
Summary: Impact of Incentives, Objectives and Government Constraints on Total License Income
1. Using bonuses raises total license income by about 30-50%. The full effect is due to increasing the quality of licenses, not their quantity.
2. Private ownership has no independent effect on licensing performance, once we control for the adoption of incentive pay. Yet, private ownership has a strong positive effect on the use of incentive pay.
3. Strong local development objectives have a net negative effect on total license income: they clearly reduce the value per license, and do not have a robust positive effect on the quantity of licenses on inventions.
4. Strong government constraints reduce total license income. The effect works by reducing the quality of licenses, not their quantity.