harnessing the data advantage
TRANSCRIPT
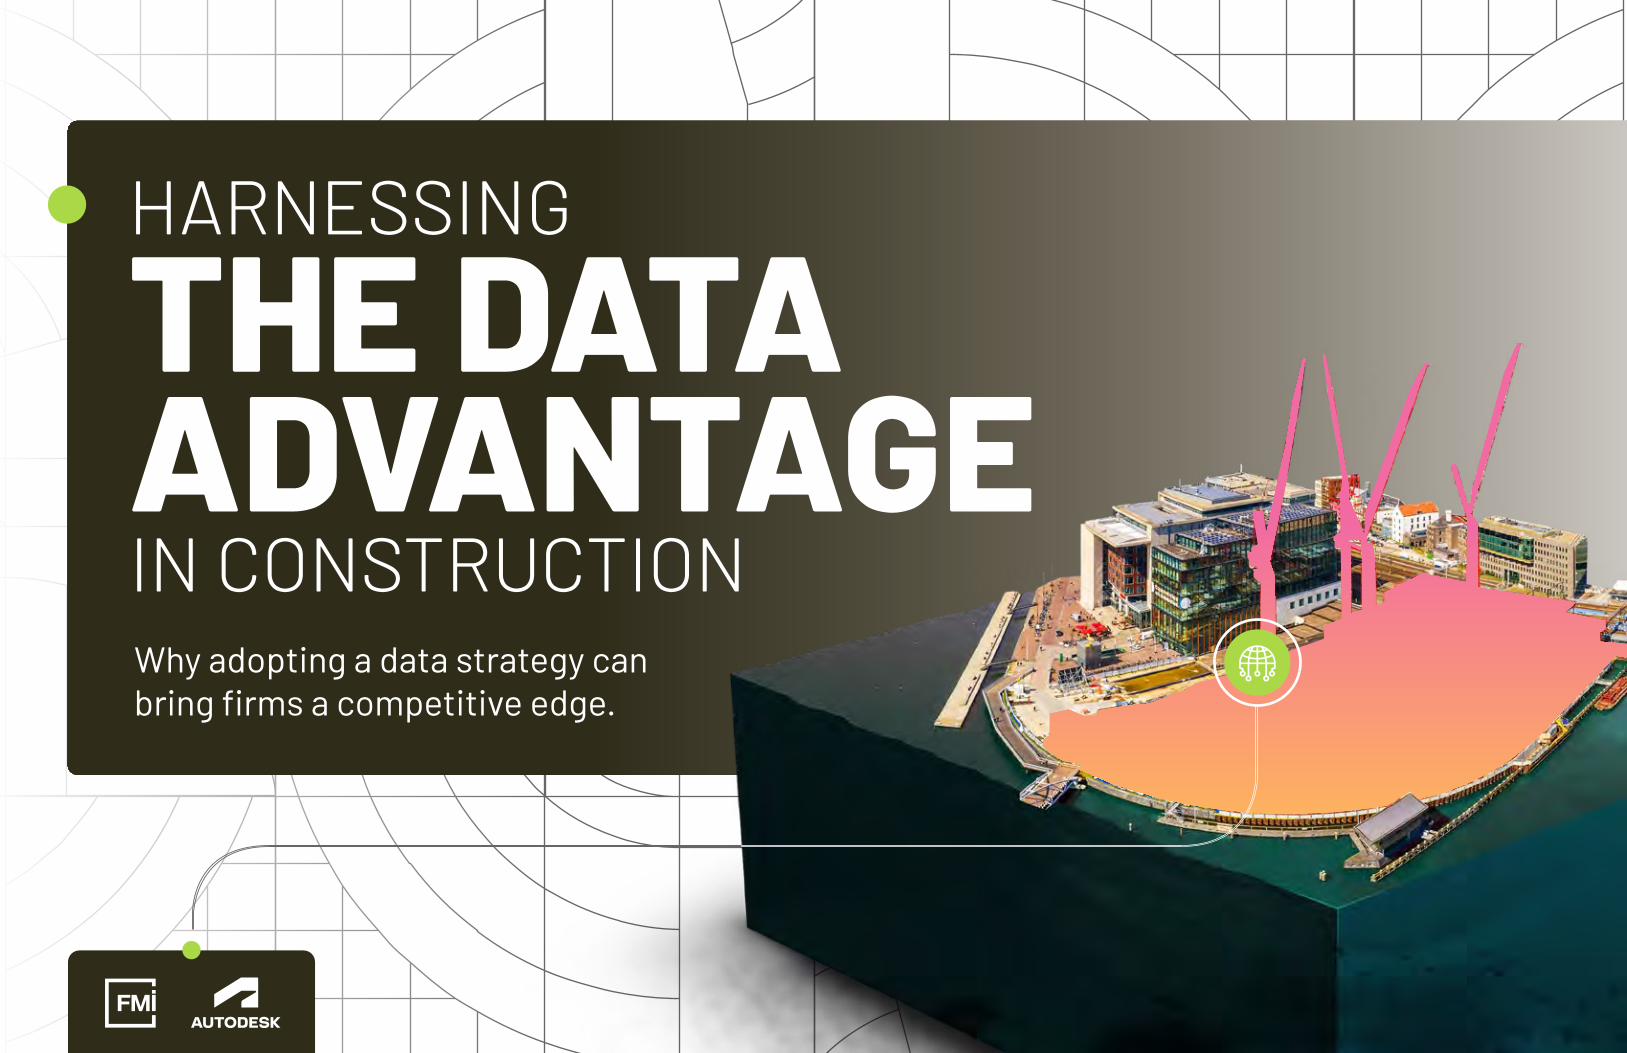
THE DATAADVANTAGEWhy adopting a data strategy can bring firms a competitive edge.
HARNESSING
IN CONSTRUCTION

| HARNESSING THE DATA ADVANTAGE IN CONSTRUCTION HARNESSING THE DATA ADVANTAGE IN CONSTRUCTION | 2 3
FORWARD
Forward
Today’s construction industry is under more pressure than ever to deliver projects that are on time and on budget—all while dealing with record global labor shortages, supply chain issues, and other challenging external constraints. Factors like accelerated construction schedules mean critical decisions must be made quickly by the project leaders working in the field and in the office. The quality of these decisions often determines a project’s success or failure. Technology adoption in our industry has rapidly accelerated in recent years and we’re on a journey to full-scale digital transformation. As a result, the volume of project data has grown exponentially—with construction leaders identifying that their own data has doubled in just the last three years. A key factor that empowers these leaders to quickly make critical decisions in the field is access to accurate project data. To better understand how our industry is managing these challenges, Autodesk partnered with FMI to survey over 3,900 industry leaders worldwide to understand their current data strategies. The findings show that many in the industry agree—operating without a formal strategy for collecting, managing, and using data poses a significant risk for many firms. These are themes I have heard myself during conversations with leaders in the construction industry. I invite you to review the results of our analysis and the guidance contained within this report. Ultimately, the real value that technology brings to your business is the ability to learn from each piece of data to help you achieve your business goals.
Jim LynchSenior Vice President & General ManagerAutodesk Construction Solutions

| HARNESSING THE DATA ADVANTAGE IN CONSTRUCTION HARNESSING THE DATA ADVANTAGE IN CONSTRUCTION | 4 5
TABLE OF CONTENTSKey Terms and Definitions
Survey Demographics
Executive Summary
Chapter 1 Construction Data—Quantity, Not Quality
Chapter 2 Making Field Decisions Using Data is Critical
Chapter 3 Implementing Formal Data Strategies
Chapter 4 Buy-in from the Entire Organization is Vital
A Global Data Strategy: Key Findings by Region Data Strategies & Stories from Asia-Pacific Data Strategies & Stories from Europe Data Strategies & Stories from North America
Conclusion The Four Steps of a Successful Data Strategy
References
05
06
10
16
26
32
42
52
102
110
547086
Table of Contents
Key Terms and Definitions
KEY TERMSAND DEFINITIONSThis report includes several references to project-related data and information collected during the design and construction of buildings and infrastructure. For clarity, key terms and acronyms are defined below.
AEC — Architecture, Engineering, and Construction
AI — Artificial Intelligence
Bad Project Data — Bad data is either inaccurate, incomplete, inaccessible, inconsistent, or untimely. In other words, it cannot be used to provide either usable information or actionable insights.
CDE — Common Data Environment
Construction Technology — Construction technologies include hardware (e.g., cameras, sensors) and software (e.g., BIM, SaaS tools, applications) that collects and/or creates project data.
CRM — Customer Relationship Management
Data — Project-related measurements, observations, or statistics, including building information modeling (BIM) inputs, material quantities, safety incidents, request for information (RFI) data, schedules, assigned staff, and cost data.
Data Strategy — The framework for capturing and managing data.
Data Plan — The actual implementation of a data strategy.
Information — Project-related information that has been organized in a structured environment, providing context, revealing relationships, and making information understandable and usable.
Insight — An understanding of what is causing the relationships or trends that information reveals, making the information actionable. With insight into project information, decisions should produce intended project outcomes and results.
KPI — Key Performance Indicator
Usable Data — Usable project data is readily accessible, consumable, understandable, and actionable. Usable data must be accurate and formatted effectively and efficiently.

| HARNESSING THE DATA ADVANTAGE IN CONSTRUCTION HARNESSING THE DATA ADVANTAGE IN CONSTRUCTION | 6 7
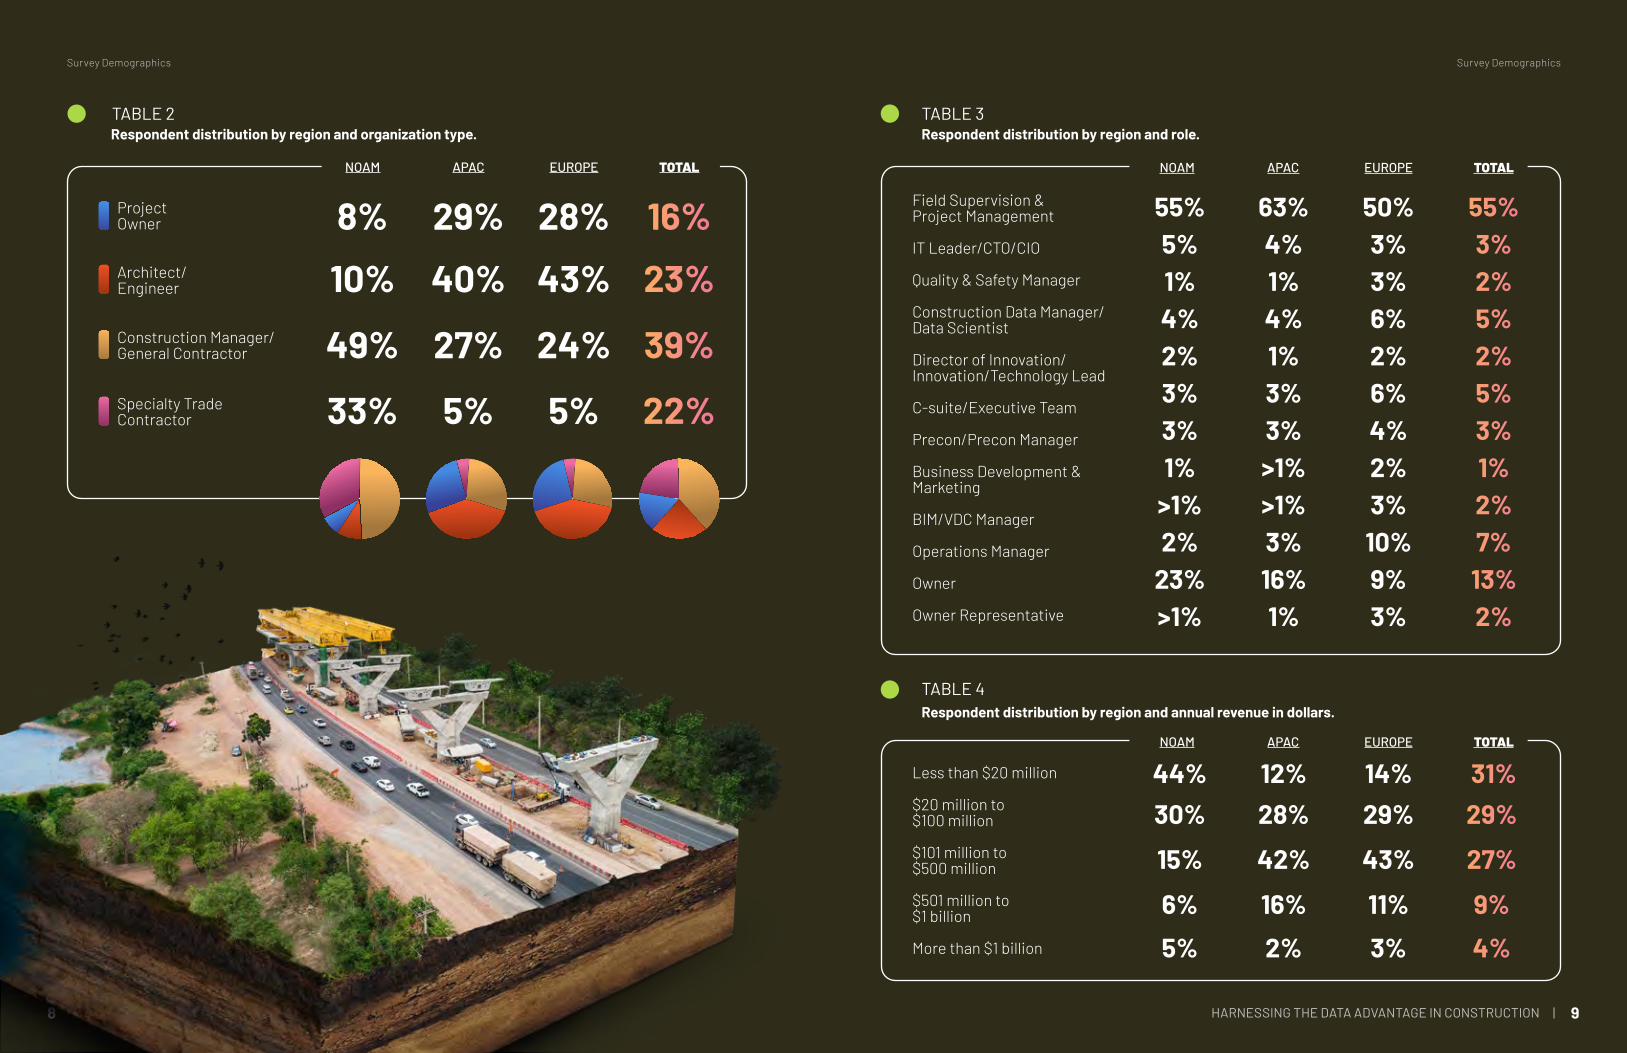
SURVEYDEMOGRAPHICSSurvey respondents represent the opinions and experience of 3,916 global construction industry stakeholders (project owners, architects/engineers, managers, general contractors, and specialty trade contractors) across 18 countries and three regions: North America, Asia-Pacific (APAC), and Europe.
Survey Demographics
PROJECT OWNERSARCHITECTS/ENGINEERSGENERAL CONTRACTORSSPECIALTY TRADE CONTRACTORS
NORTH AMERICA (NOAM)ASIA-PACIFIC (APAC)EUROPE
3,916
3GLOBAL CONSTRUCTION INDUSTRY STAKEHOLDERS
REGIONS
18COUNTRIES
TABLE 1Respondent distribution (3,913)
• Australia• Hong Kong• India• New Zealand• Singapore
102102102100102
APAC EUROPENOAM• Belgium• Denmark• Finland• France• Germany• Ireland• Luxembourg• Netherlands• Norway • Sweden• U.K.
100100106100102102103101101100100
• Canada• U.S.A.
3661,927
| HARNESSING THE DATA ADVANTAGE IN CONSTRUCTION HARNESSING THE DATA ADVANTAGE IN CONSTRUCTION | 8 9
TABLE 2Respondent distribution by region and organization type.
Project Owner
Architect/Engineer
Specialty Trade Contractor
APACNOAM EUROPE TOTAL
29% 28% 16%
23%
39%
22%
8%
10%
49%
33%
43%
24%
5%
40%
27%
5%
Construction Manager/General Contractor
Survey Demographics
TABLE 3Respondent distribution by region and role.
TABLE 4Respondent distribution by region and annual revenue in dollars.
APAC
APAC
NOAM
NOAM
EUROPE
EUROPE
TOTAL
TOTAL
Field Supervision & Project Management
IT Leader/CTO/CIO
Quality & Safety Manager
Construction Data Manager/Data Scientist
Director of Innovation/ Innovation/Technology Lead
C-suite/Executive Team
Precon/Precon Manager
Business Development & Marketing
BIM/VDC Manager
Operations Manager
Owner
Owner Representative
Less than $20 million
$20 million to $100 million
$101 million to $500 million
$501 million to $1 billion
More than $1 billion
55%5%1%4%2%3%3%1%
>1%2%
23%>1%
12%28% 29% 29%
42% 43% 27%
16% 11% 9%2% 3% 4%
63%4%1%4%1%3%3%>1%>1%3%16%1%
14%
50%3%3%6%2%6%4%2%3%10%9%3%
55%3%2%5%2%5%3%1%2%7%13%2%
31%30%
15%
6%5%
44%
Survey Demographics

10
EXECUTIVE SUMMARYIn construction, decisions are usually made in an environment where some amount of data is available to consider. But all too frequently, that data is not easily accessible for quick decisions, or even worse, the available data is simply bad*. Across the globe, the ability to utilize data in an insightful manner is no longer a nice-to-have, it has become a primary source of competitive advantage. Those who utilize their data to make informed decisions and gain performance insights from it will ultimately emerge as leaders in construction.
The research shows that adopting a data strategy can eliminate many avoidable costs in construction, both direct and indirect. It’s clear that making decisions using “good” data can propel an organization to a higher level of performance. Fortunately, the future
Executive Summ
ary
for a data-driven construction industry is bright—with many industry leaders identifying that hiring employees with data management skills is now a core component of their operating model.
Read on to learn more about the impacts bad data has on the construction industry. Throughout this report you will find insights from industry leaders on how to begin creating your own data strategy, including actionable steps that can quickly bring improvements to how your organization manages data.
Volume of availableproject data
could be as high as
including
in avoidable rework directly caused by bad data**
of all poor decisions were made as a result of bad data
stated an increasing need for rapid decision-making in the field
have implemented a formal data strategy for project data
alwaysincorporate project data into their decision-making
The total cost of bad data for a contractor performing
Global GDP was
in annual revenue
$
Construction accounted for
**
**
**
**
*
Bad data in construction may have cost
due to poor decision making**
in avoidable rework worldwide*
causing
Additionally, bad data may have caused
in the last 3 yearsDOUBLED
$165 MILLION
$7.1 MILLION
75%
55% 12%
$84.5 TRILLION
$1 BILLION
13.2% of Global GDP
$1.84 TRILLION
$88.69 BILLION
1/3Bad Data = Bad Outcomes. Respondents stated...
The cost of bad data is high. In ...
What does this mean for you? Here’s an example...
When asked about their current relationship with construction data, respondents indicated...
of their data is bad50%Only 36% have implemented a process for identifying bad data and repairing it
of all construction rework** 14%
*Bad data is either inaccurate, incomplete, inaccessible, inconsistent, or untimely. It cannot be used to provide either usable information or actionable insights.
**See a detailed cost breakdown on page 13 of this report.
Executive Summary
2020
overAn alarming 30% shared that
| HARNESSING THE DATA ADVANTAGE IN CONSTRUCTION12 HARNESSING THE DATA ADVANTAGE IN CONSTRUCTION | 13
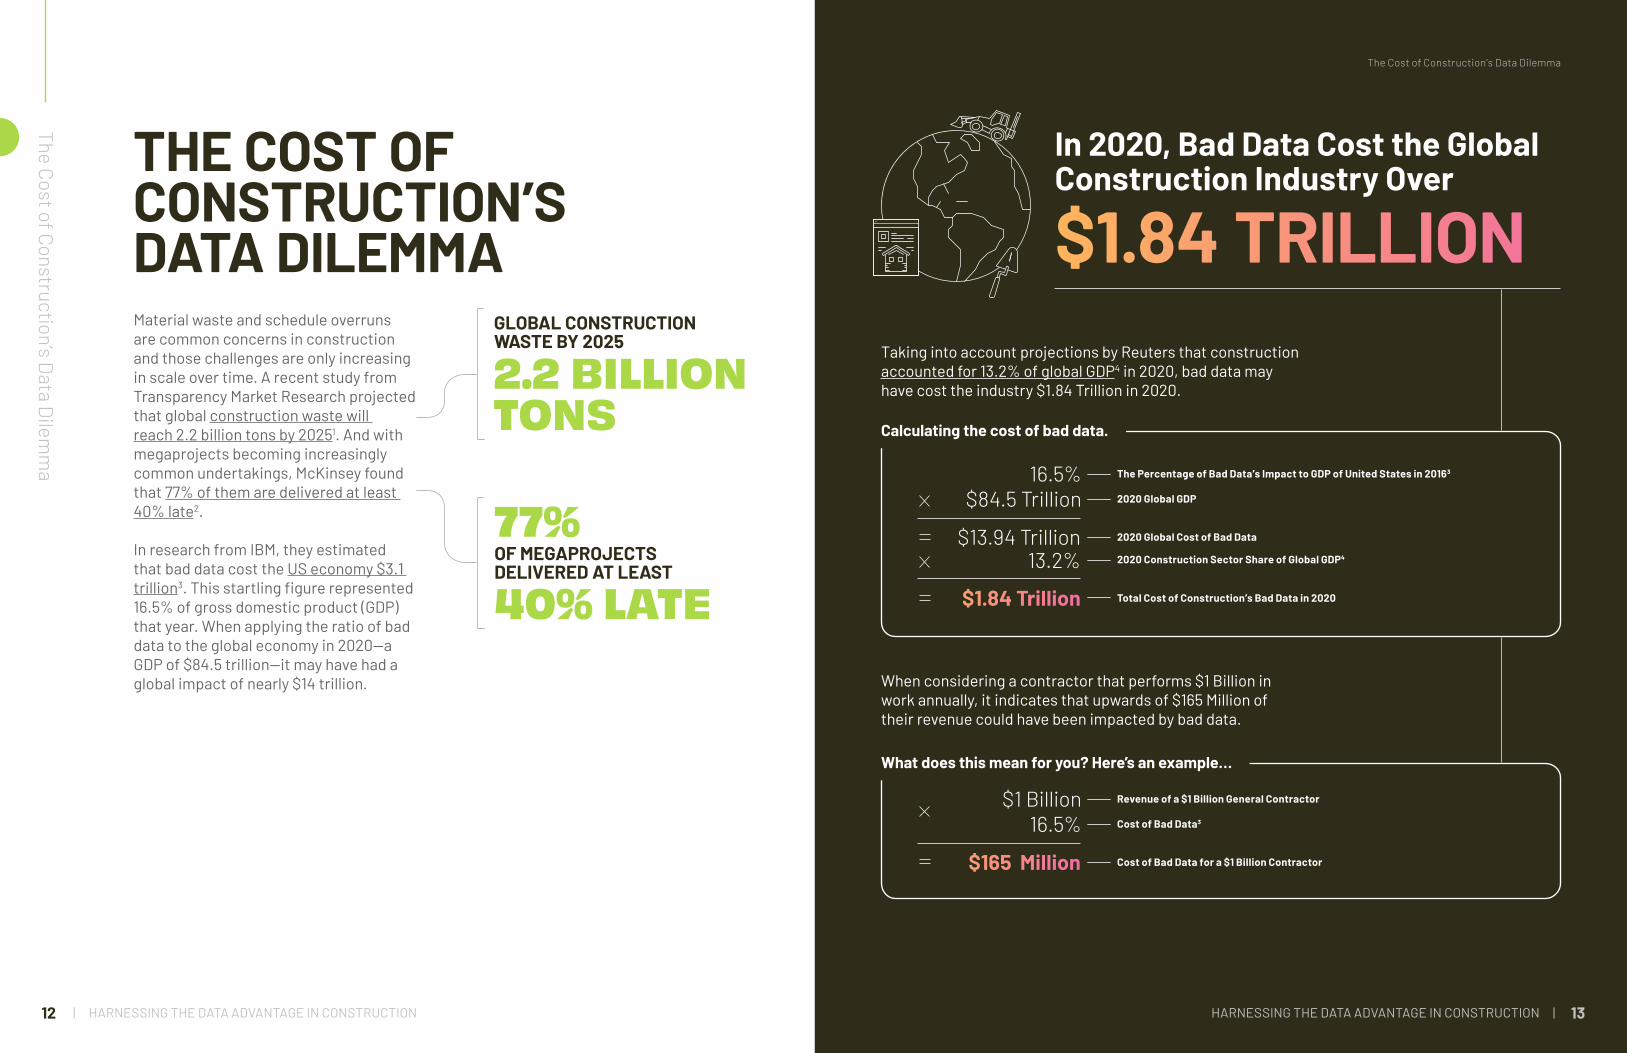
THE COST OFCONSTRUCTION’S DATA DILEMMAMaterial waste and schedule overruns are common concerns in construction and those challenges are only increasing in scale over time. A recent study from Transparency Market Research projected that global construction waste will reach 2.2 billion tons by 20251. And with megaprojects becoming increasingly common undertakings, McKinsey found that 77% of them are delivered at least 40% late2.
In research from IBM, they estimated that bad data cost the US economy $3.1 trillion3. This startling figure represented 16.5% of gross domestic product (GDP) that year. When applying the ratio of bad data to the global economy in 2020—a GDP of $84.5 trillion—it may have had a global impact of nearly $14 trillion.
The Cost of Construction’s Data Dilemm
a
GLOBAL CONSTRUCTION WASTE BY 2025
OF MEGAPROJECTS DELIVERED AT LEAST
2.2 BILLIONTONS
77%
40% LATE
In 2020, Bad Data Cost the Global Construction Industry Over
Taking into account projections by Reuters that construction accounted for 13.2% of global GDP4 in 2020, bad data may have cost the industry $1.84 Trillion in 2020.
When considering a contractor that performs $1 Billion in work annually, it indicates that upwards of $165 Million of their revenue could have been impacted by bad data.
16.5%
$1 Billion
$84.5 Trillion
16.5%
$13.94 Trillion
$165 Million
13.2%
$1.84 Trillion
Calculating the cost of bad data.
What does this mean for you? Here’s an example…
The Percentage of Bad Data’s Impact to GDP of United States in 20163
Revenue of a $1 Billion General Contractor
2020 Global GDP
Cost of Bad Data3
2020 Global Cost of Bad Data
Cost of Bad Data for a $1 Billion Contractor
2020 Construction Sector Share of Global GDP4
Total Cost of Construction’s Bad Data in 2020
$1.84 TRILLION
The Cost of Construction’s Data Dilemma

| HARNESSING THE DATA ADVANTAGE IN CONSTRUCTION HARNESSING THE DATA ADVANTAGE IN CONSTRUCTION | 14 15
of all Rework in Construction Globally is Caused by Bad Data
Survey respondents clearly stated that the need for making quick decisions in the field is rapidly increasing—and with that increase, so will the costs of making those decisions using bad data.
An earlier study from Autodesk and FMI highlighted that poor project data and miscommunication is responsible for 48% of all rework in the United States5. And in 2020, the global cost of rework was estimated to represent 5% of all construction spending6, or $625 billion according to Navigant.
While bad data is not the only factor that causes rework, a McKinsey study highlighted that 43% of organizations do not consistently make high-quality decisions7. Furthermore, our research uncovered that one out of every three (33%) poor decisions are made as a result of bad data. This means decisions using bad data may have had a global rework cost of $88.69 billion, or 14% of all rework performed in 2020.
14%
$12.5 Trillion5%
$625 Billion
$269 Billion
43%
33%
Global Construction Spend
Construction Spending on Rework8
The Cost of Rework Globally
Firms Not Consistently Making High Quality Decisions7
The Cost of Rework From Making Poor Decisions
Bad Decisions Attributable to Bad Data
The Cost of Rework Associated with Bad Data$88.69 Billion
The Cost of Construction’s Data Dilemma
Global rework caused by bad data.
When applying this model to the revenue of a $1 billion general contractor, they would have performed $50 million in rework in 2020. Assuming 14% of this rework was caused by bad data, it means that $7.1 million of waste could have been avoided by making decisions using accurate data.
$1 Billion5%
$50 Million14.19%
Revenue for a $1 Billion General Contractor
Construction Spend in Rework8
Cost of Rework for a $1 Billion General Contractor
Percent of Avoidable Rework Caused by Decisions Using Bad Data
Value of Avoidable Rework from Bad Data$7.1 Million
The Cost of Construction’s Data Dilemma
What does this mean for you? Here’s an example…

16 17
CONSTRUCTION DATA—QUANTITY DOES NOT EQUAL QUALITYThe volume of data collected in the construction industry is rapidly rising due to the increased adoption of technology. This should prompt industry leaders to step back and ask themselves this important question: “How much of our data can be used to make informed and actionable decisions?”
More than 80% of respondents reported an increase in the project data their organizations are creating from construction technology over the past three years (see Table 5). Almost half experienced more than a 50% increase.
01020304
Construction Data—
Quantity D
oes Not Equal Quality
TABLE 5How much project data (text files, model data, photos, satellite imagery, sensor data, etc.) do you estimate your organization is creating from construction technology your organization employs now compared to three years ago?
More than 75% increase
>50% but less than 75% increase
25-50% increase
No change
25-50% decrease
>50% but less than 75% decrease
More than 75% decrease
30%17%
11%
1%1%
4%
36%
01 Construction Data—Quantity Does Not Equal Quality

| HARNESSING THE DATA ADVANTAGE IN CONSTRUCTION HARNESSING THE DATA ADVANTAGE IN CONSTRUCTION | 18 19
Despite the Masses of Data, Much Is UnusableAs a result of the dramatic increase in technology adoption, a substantial amount of data is being generated throughout the project lifecycle. Unfortunately, as Table 6 shows, more than 80% of all respondents describe at least 25% of their project data as unusable.
TABLE 6What percent of the project data that your organization has access to would you describe as “usable” (readily accessible, consumable, understandable, and actionable) or something you can act on?
01020304
Construction Data—
Quantity D
oes Not Equal Quality
More than 75% Usable
Less than 10% Usable
11-25% Usable
26-50% Usable
51-75% Usable
43%
31%
17%6%3%
In contrast, only 17% of all respondents describe more than 75% of their project data as usable. For most respondents, about half of their organization’s project data are usable.
Respondents to the survey didn’t indicate any single reason that explains what makes their project data unusable (see Table 7). Of the five potential data challenges presented, each option averaged a ranking of three out of five, meaning challenges are unique to each organization. However, the inability to easily combine data from different sources was ranked either first or second by nearly 50% of all respondents.
TABLE 7How do you rank the following from most challenging to least challenging when working with your organization’s project data?
LeastChallenging
MostChallenging
532 41
Data from one source cannot be easily
combined with another source (e.g. data silos)
Data is incomplete and missing certain aspects that would
make it more usable
Data is not easily accessible, either
due to its structure or the unwillingness of
others to share
There is too much data to know how to use it efficiently/effectively
Errors raise suspicion about that data and its usefulness/value (e.g.
bad data)
01 Construction Data—Quantity Does Not Equal Quality
| HARNESSING THE DATA ADVANTAGE IN CONSTRUCTION HARNESSING THE DATA ADVANTAGE IN CONSTRUCTION | 20 21
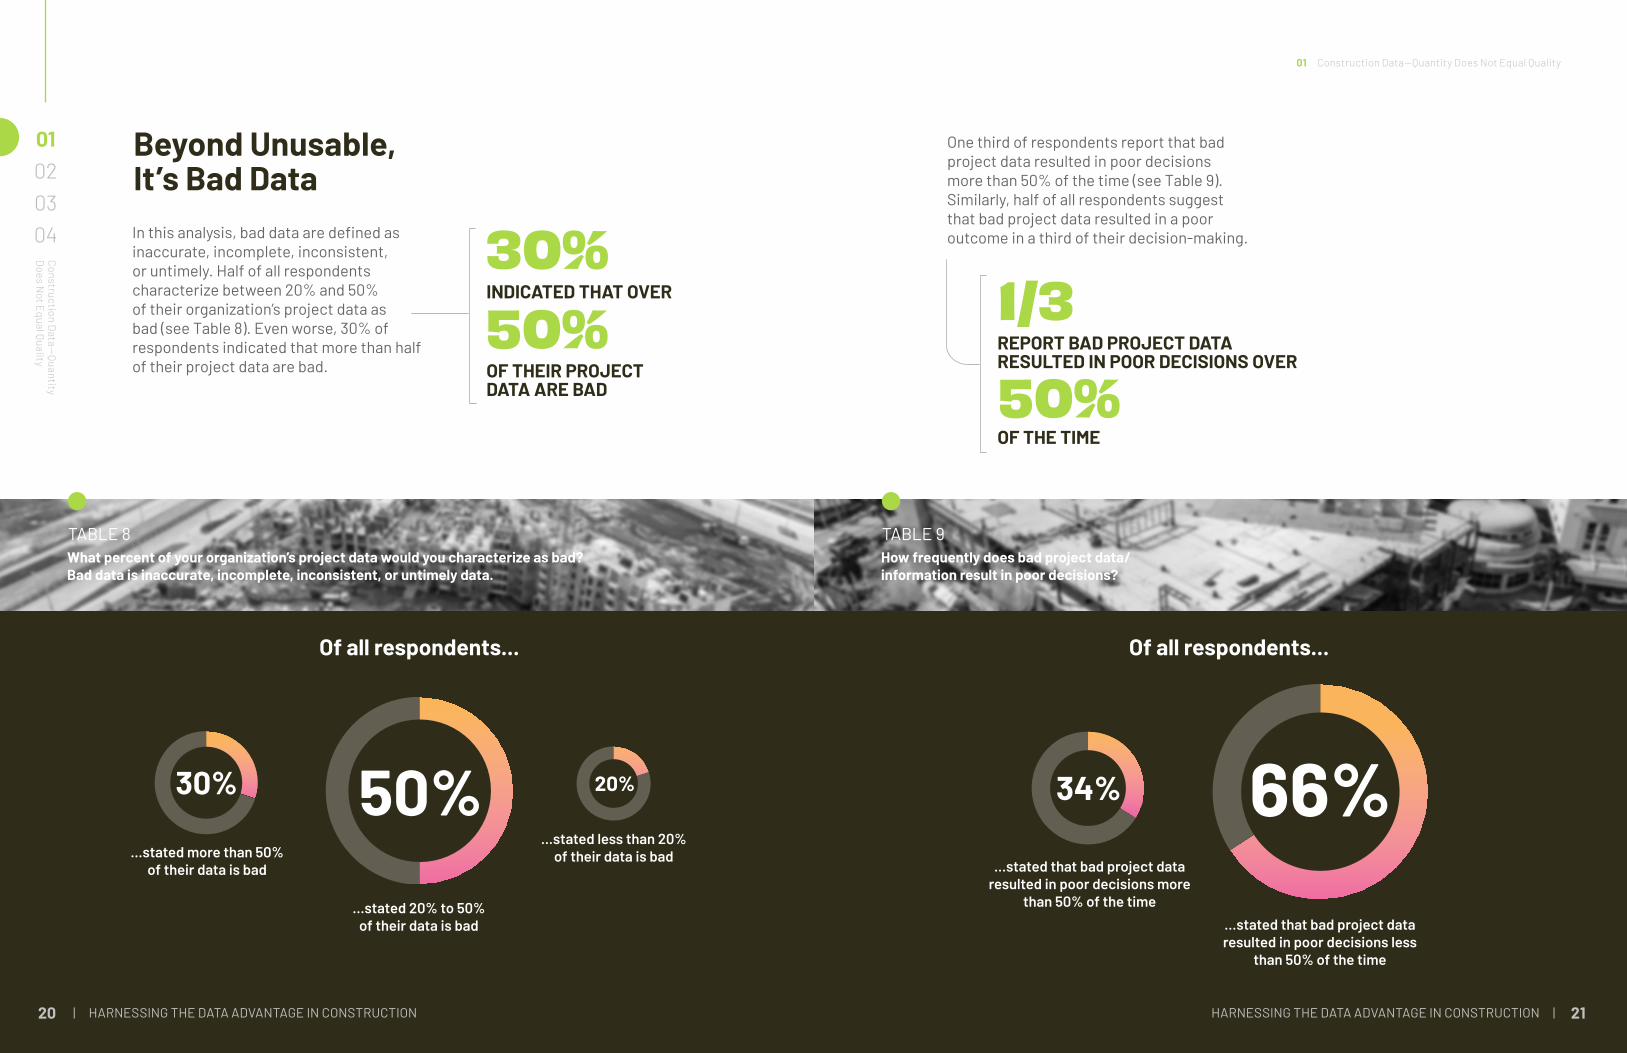
Beyond Unusable, It’s Bad DataIn this analysis, bad data are defined as inaccurate, incomplete, inconsistent, or untimely. Half of all respondents characterize between 20% and 50% of their organization’s project data as bad (see Table 8). Even worse, 30% of respondents indicated that more than half of their project data are bad.
01020304
Construction Data—
Quantity D
oes Not Equal Quality
TABLE 8What percent of your organization’s project data would you characterize as bad? Bad data is inaccurate, incomplete, inconsistent, or untimely data.
INDICATED THAT OVER
OF THEIR PROJECTDATA ARE BAD
30%50%
...stated more than 50% of their data is bad
...stated less than 20% of their data is bad
...stated 20% to 50% of their data is bad
30% 20%50%
One third of respondents report that bad project data resulted in poor decisions more than 50% of the time (see Table 9). Similarly, half of all respondents suggest that bad project data resulted in a poor outcome in a third of their decision-making.
TABLE 9How frequently does bad project data/information result in poor decisions?
REPORT BAD PROJECT DATARESULTED IN POOR DECISIONS OVER
OF THE TIME
1/3
50%
01 Construction Data—Quantity Does Not Equal Quality
34% 66%...stated that bad project data
resulted in poor decisions more than 50% of the time
...stated that bad project data resulted in poor decisions less
than 50% of the time
Of all respondents... Of all respondents...
| HARNESSING THE DATA ADVANTAGE IN CONSTRUCTION HARNESSING THE DATA ADVANTAGE IN CONSTRUCTION | 22 23
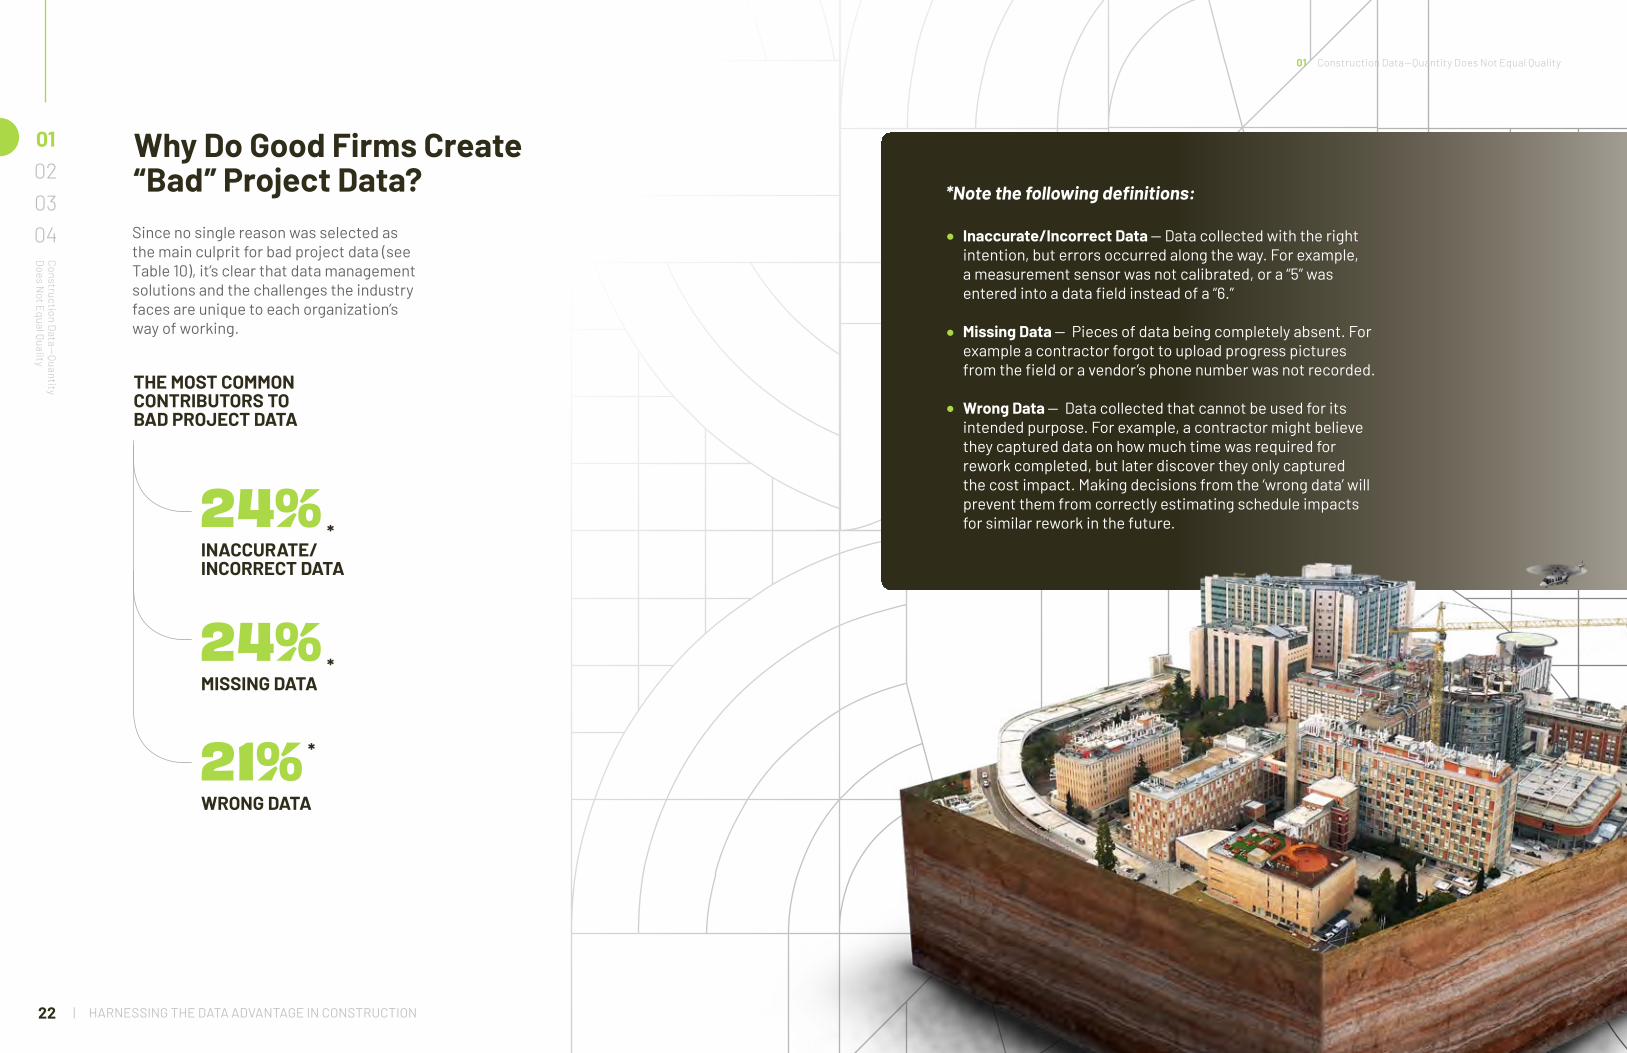
Why Do Good Firms Create “Bad” Project Data?Since no single reason was selected as the main culprit for bad project data (see Table 10), it’s clear that data management solutions and the challenges the industry faces are unique to each organization’s way of working.
01020304
Construction Data—
Quantity D
oes Not Equal Quality
INACCURATE/INCORRECT DATA
*
*
*
THE MOST COMMON CONTRIBUTORS TO BAD PROJECT DATA
MISSING DATA
WRONG DATA
24%
24%
21%
*Note the following definitions:
Inaccurate/Incorrect Data — Data collected with the right intention, but errors occurred along the way. For example, a measurement sensor was not calibrated, or a “5” was entered into a data field instead of a “6.”
Missing Data — Pieces of data being completely absent. For example a contractor forgot to upload progress pictures from the field or a vendor’s phone number was not recorded.
Wrong Data — Data collected that cannot be used for its intended purpose. For example, a contractor might believe they captured data on how much time was required for rework completed, but later discover they only captured the cost impact. Making decisions from the ‘wrong data’ will prevent them from correctly estimating schedule impacts for similar rework in the future.
01 Construction Data—Quantity Does Not Equal Quality
| HARNESSING THE DATA ADVANTAGE IN CONSTRUCTION24 HARNESSING THE DATA ADVANTAGE IN CONSTRUCTION | 25
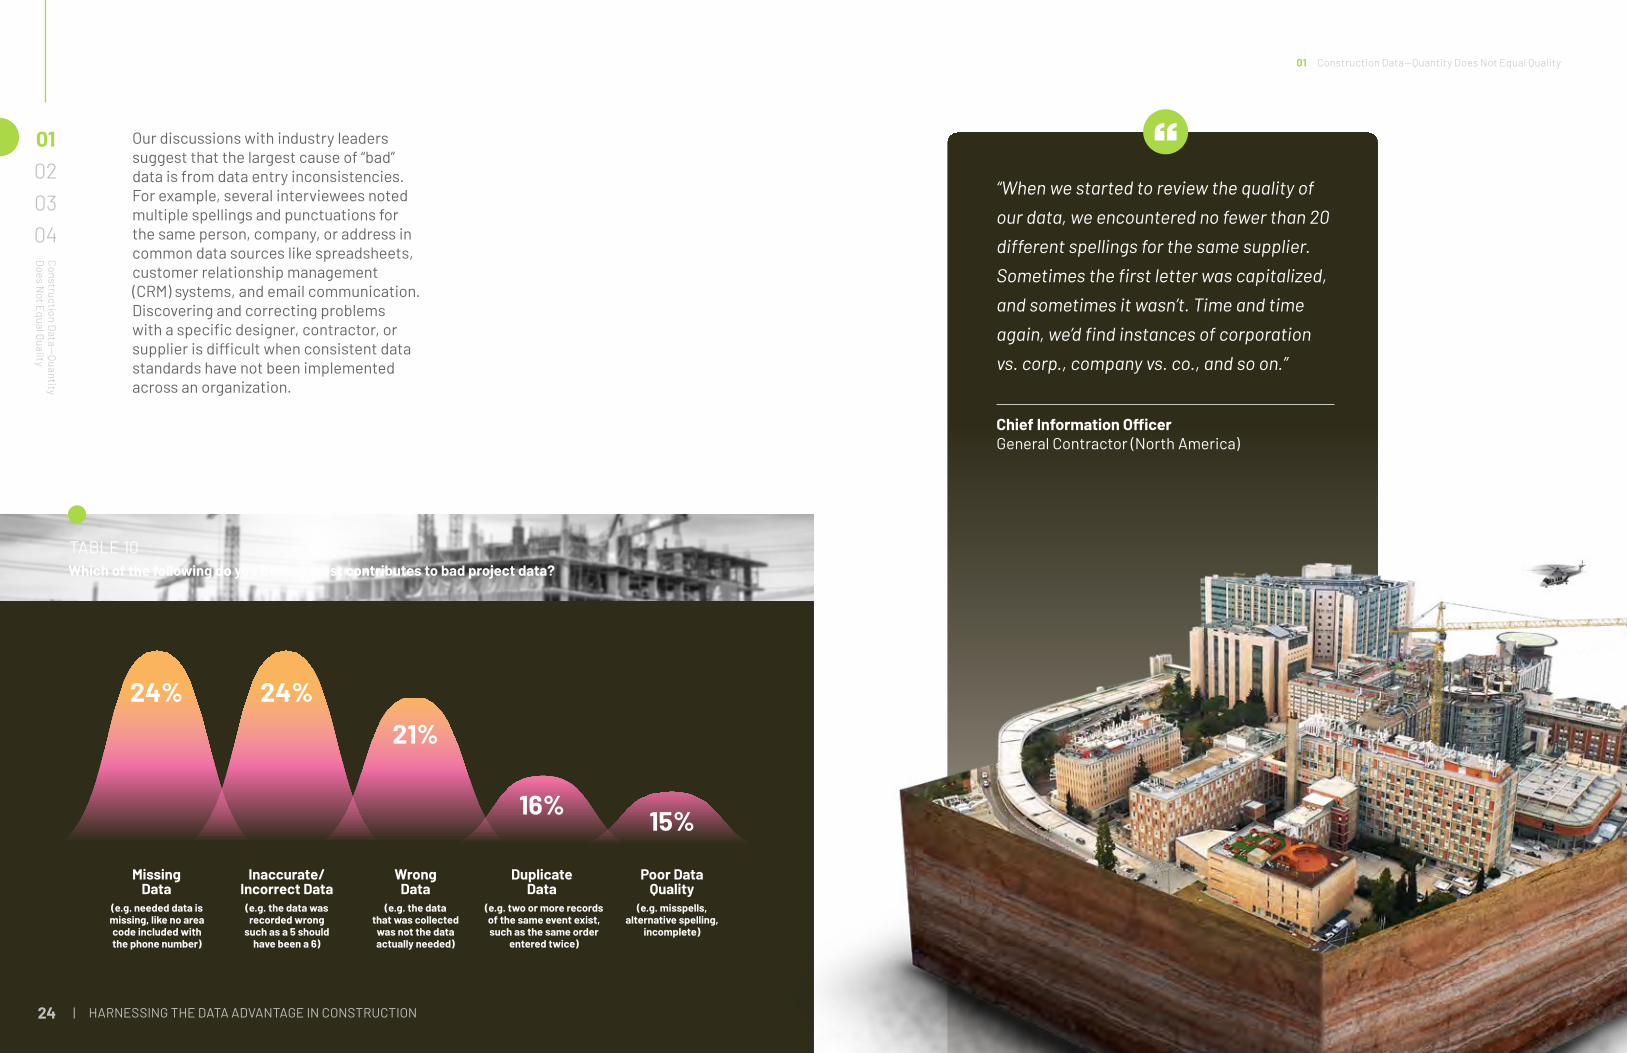
Our discussions with industry leaders suggest that the largest cause of “bad” data is from data entry inconsistencies. For example, several interviewees noted multiple spellings and punctuations for the same person, company, or address in common data sources like spreadsheets, customer relationship management (CRM) systems, and email communication. Discovering and correcting problems with a specific designer, contractor, or supplier is difficult when consistent data standards have not been implemented across an organization.
TABLE 10Which of the following do you believe most contributes to bad project data?
24% 24%21%
16% 15%
MissingData
(e.g. the data was recorded wrong
such as a 5 shouldhave been a 6)
(e.g. needed data is missing, like no areacode included withthe phone number)
(e.g. the datathat was collected
was not the dataactually needed)
(e.g. two or more records of the same event exist, such as the same order
entered twice)
(e.g. misspells,alternative spelling,
incomplete)
Inaccurate/ Incorrect Data
WrongData
Duplicate Data
Poor DataQuality
01020304
Construction Data—
Quantity D
oes Not Equal Quality
“When we started to review the quality of our data, we encountered no fewer than 20 different spellings for the same supplier. Sometimes the first letter was capitalized, and sometimes it wasn’t. Time and time again, we’d find instances of corporation vs. corp., company vs. co., and so on.”
Chief Information OfficerGeneral Contractor (North America)
01 Construction Data—Quantity Does Not Equal Quality
| HARNESSING THE DATA ADVANTAGE IN CONSTRUCTION26 HARNESSING THE DATA ADVANTAGE IN CONSTRUCTION | 27
MAKING FIELD DECISIONS USING DATA IS CRITICALAlthough most respondents agreed that data-driven decisions are required for better outcomes, getting the data into a usable state is another common challenge. Hiring a data scientist may not be practical or economical for all companies, so managing the data has fallen largely on the shoulders of existing staff.
In addition to keeping projects and personnel on track, project management and field supervision staff are the ones collecting, managing, and analyzing data each week. In our discussions with industry leaders, they indicated that when in the field, many project leaders are required to make fast decisions with increasing frequency, often without guidance from others.
01020304
Making Field D
ecisions U
sing Data is Critical
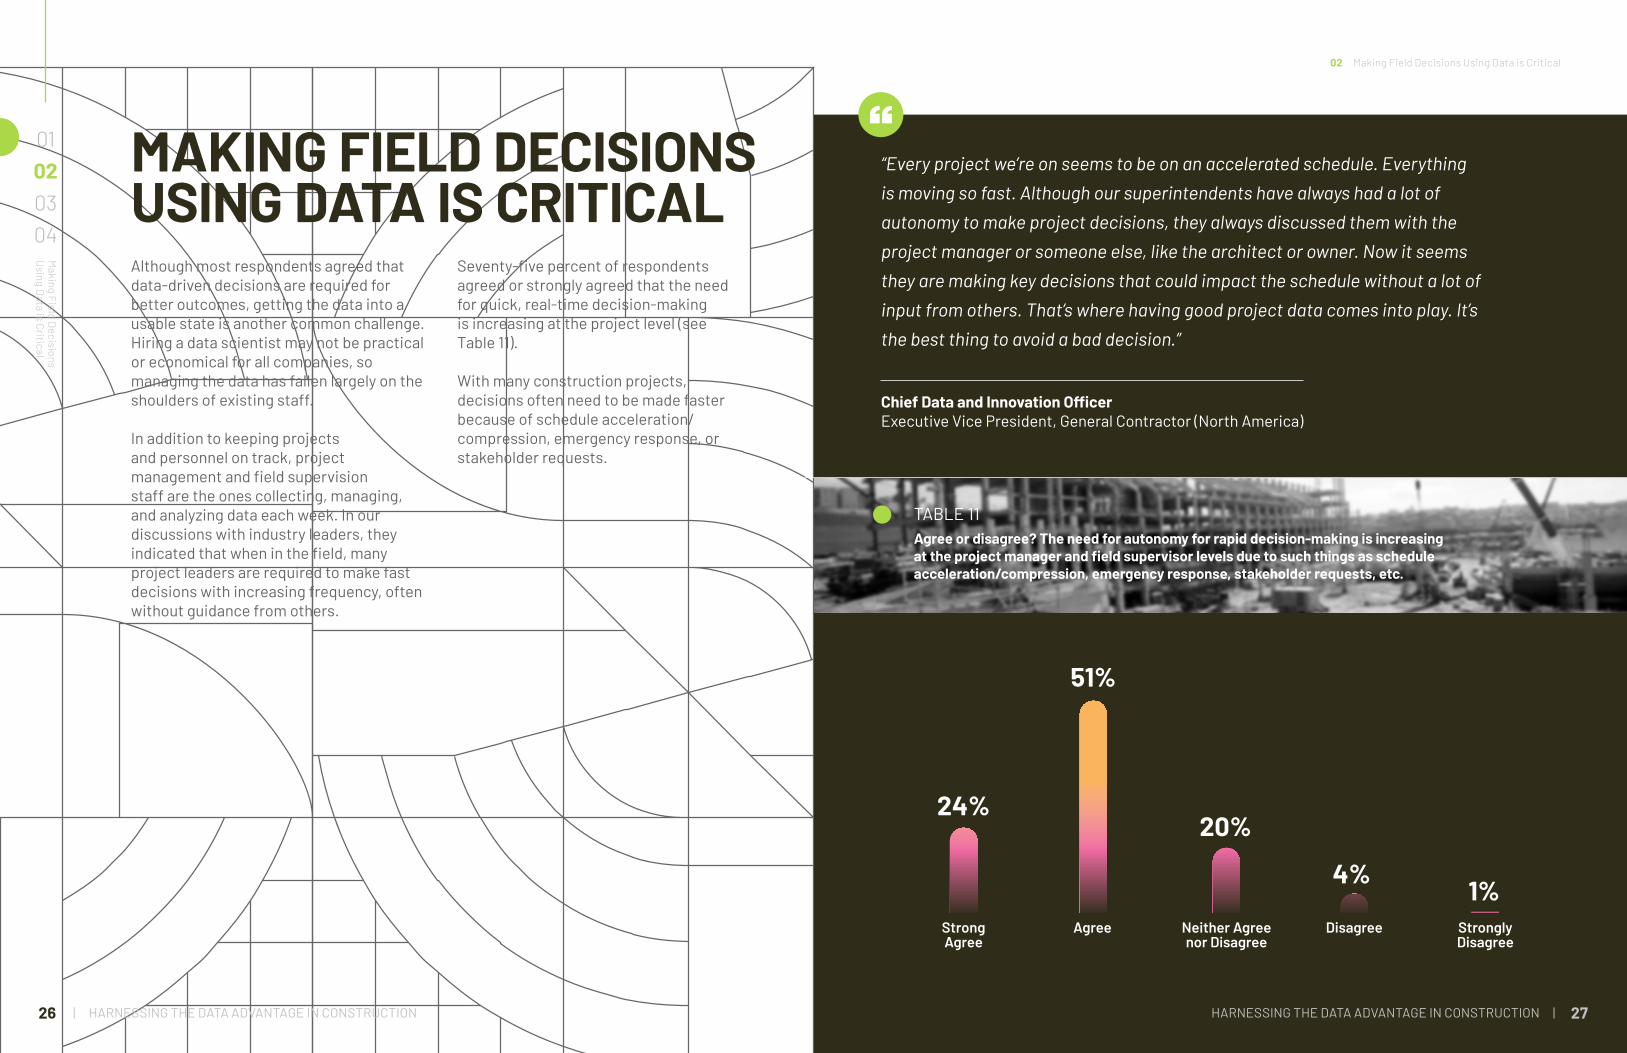
Seventy-five percent of respondents agreed or strongly agreed that the need for quick, real-time decision-making is increasing at the project level (see Table 11).
With many construction projects, decisions often need to be made faster because of schedule acceleration/compression, emergency response, or stakeholder requests.
“Every project we’re on seems to be on an accelerated schedule. Everything is moving so fast. Although our superintendents have always had a lot of autonomy to make project decisions, they always discussed them with the project manager or someone else, like the architect or owner. Now it seems they are making key decisions that could impact the schedule without a lot of input from others. That’s where having good project data comes into play. It’s the best thing to avoid a bad decision.”
Chief Data and Innovation OfficerExecutive Vice President, General Contractor (North America)
TABLE 11Agree or disagree? The need for autonomy for rapid decision-making is increasing at the project manager and field supervisor levels due to such things as schedule acceleration/compression, emergency response, stakeholder requests, etc.
StronglyDisagree
StrongAgree
Agree Neither Agree nor Disagree
Disagree
4%
20%
1%
51%
24%
02 Making Field Decisions Using Data is Critical

HARNESSING THE DATA ADVANTAGE IN CONSTRUCTION | 29
“Good” Project Data for Successful Decision MakingRespondents indicated that having readily available data is essential to accurate project decision-making. As Table 12 illustrates, “time constraint/urgency of decision” was most selected as the greatest risk (43%) to project decision making. This indicates that the quality of project data needs to improve if project leaders are to make critical decisions in the field quickly and autonomously. Respondents also indicated that an absence of reliable data and not having experience with similar projects brought considerable risk to their projects.
01020304
Making Field D
ecisions U
sing Data is Critical
“We are using project data to alert us to things before a problem arises. For example, we can track the number of encountered defects. We know once they exceed a certain number, the schedule is going to be delayed. Having these insights allows us to address things when we can still do something about them.”
BIM CoordinatorGeneral/Main Contractor (Europe)
TABLE 12Which of the following two areas presents the greatest risk to project decision-making?
02 Making Field Decisions Using Data is Critical
43%36%36%
33%
29%
22%
Time Constraint/Urgency of Decision
Lack of Reliable Data
Lack of Experience with Similar Project Decisions/Issues
Lack of Understanding the Relationship to Other Projects and Organization More Broadly
Lack of Input from Others (Particularly Senior Staff)
Personal Bias/Conflict
| HARNESSING THE DATA ADVANTAGE IN CONSTRUCTION HARNESSING THE DATA ADVANTAGE IN CONSTRUCTION | 30 31
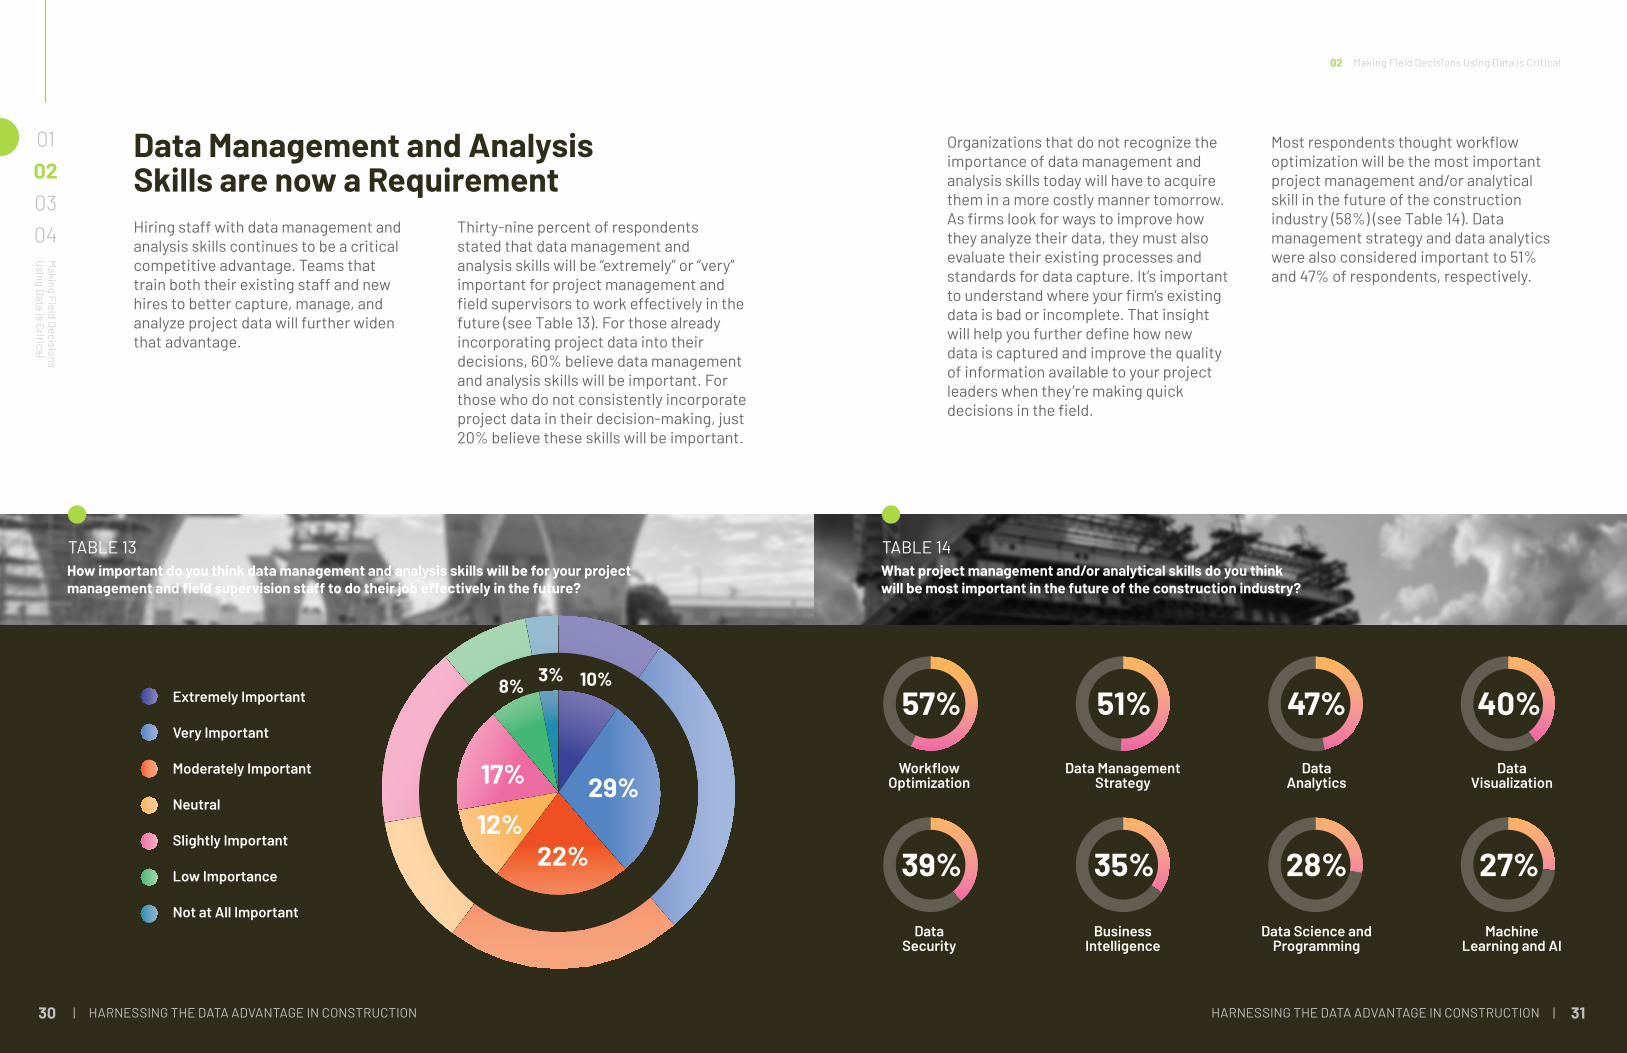
Data Management and Analysis Skills are now a RequirementHiring staff with data management and analysis skills continues to be a critical competitive advantage. Teams that train both their existing staff and new hires to better capture, manage, and analyze project data will further widen that advantage.
Thirty-nine percent of respondents stated that data management and analysis skills will be “extremely” or “very” important for project management and field supervisors to work effectively in the future (see Table 13). For those already incorporating project data into their decisions, 60% believe data management and analysis skills will be important. For those who do not consistently incorporate project data in their decision-making, just 20% believe these skills will be important.
01020304
Making Field D
ecisions U
sing Data is Critical
TABLE 13How important do you think data management and analysis skills will be for your project management and field supervision staff to do their job effectively in the future?
Extremely Important
Very Important
Moderately Important
Neutral
Slightly Important
Low Importance
Not at All Important
29%
22%12%
17%
8% 3% 10%
TABLE 14What project management and/or analytical skills do you think will be most important in the future of the construction industry?
Organizations that do not recognize the importance of data management and analysis skills today will have to acquire them in a more costly manner tomorrow. As firms look for ways to improve how they analyze their data, they must also evaluate their existing processes and standards for data capture. It’s important to understand where your firm’s existing data is bad or incomplete. That insight will help you further define how new data is captured and improve the quality of information available to your project leaders when they’re making quick decisions in the field.
Most respondents thought workflow optimization will be the most important project management and/or analytical skill in the future of the construction industry (58%) (see Table 14). Data management strategy and data analytics were also considered important to 51% and 47% of respondents, respectively.
Workflow Optimization
Data Security
Business Intelligence
Data Science and Programming
Machine Learning and AI
Data Management Strategy
Data Analytics
Data Visualization
57%
39%
47%
28%
51%
35%
40%
27%
02 Making Field Decisions Using Data is Critical
| HARNESSING THE DATA ADVANTAGE IN CONSTRUCTION32
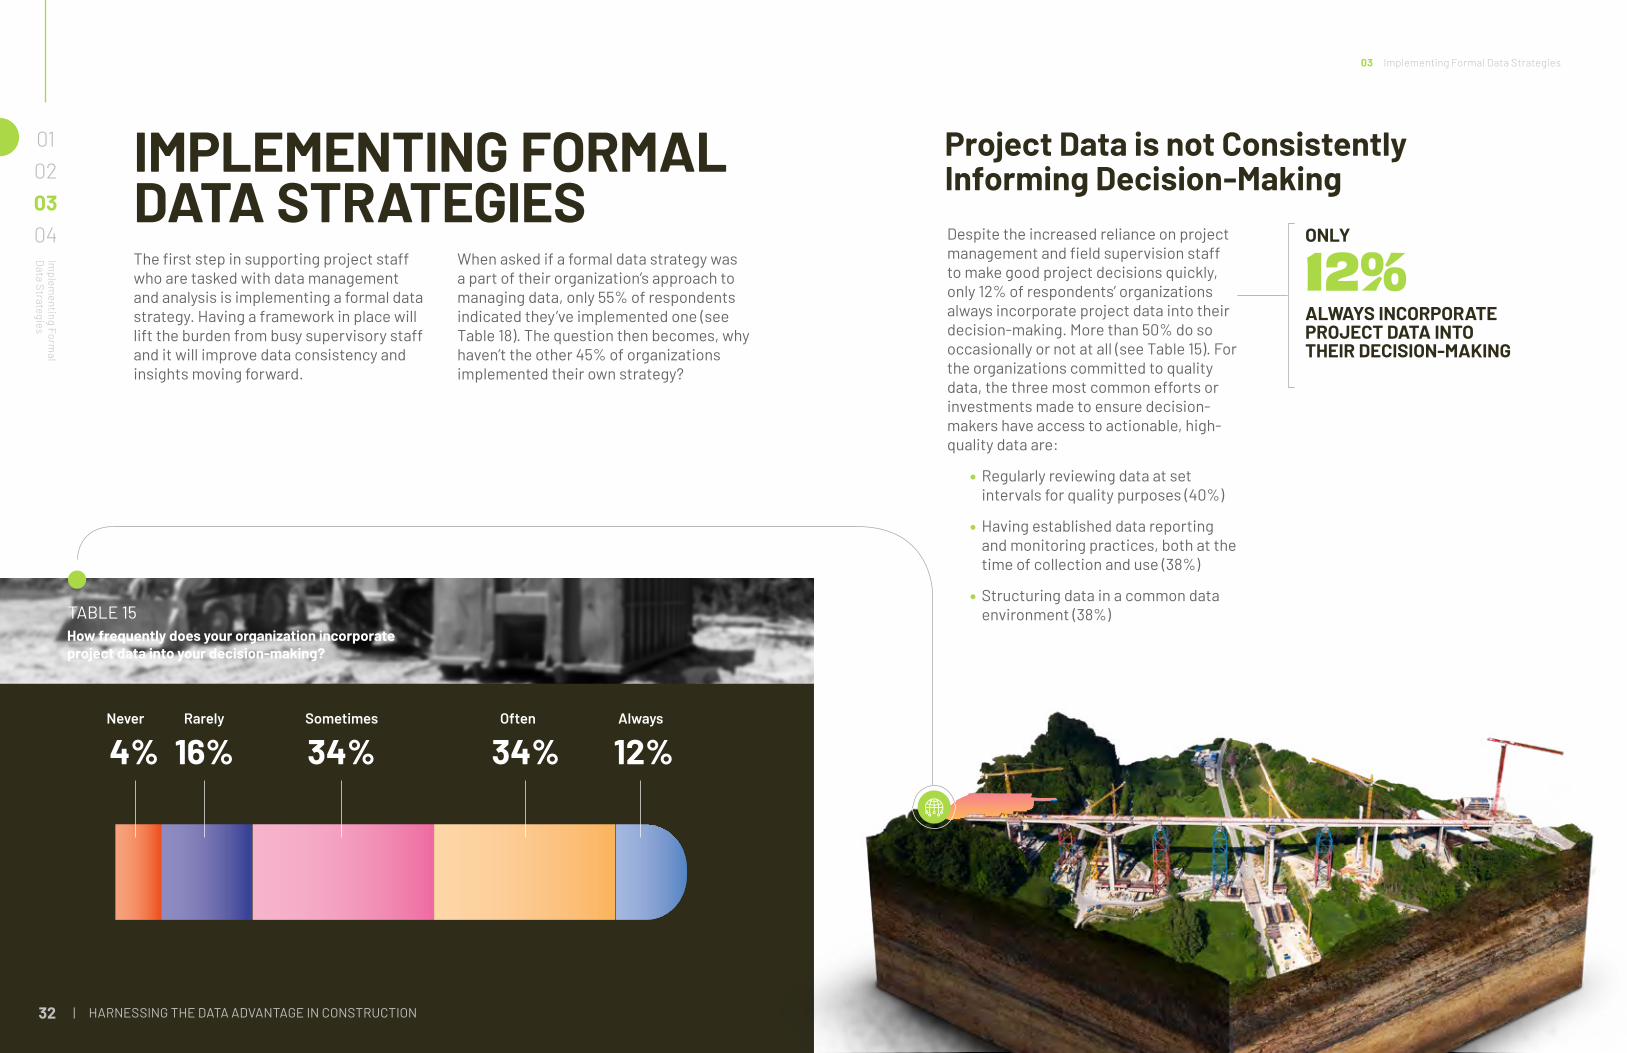
IMPLEMENTING FORMAL DATA STRATEGIESThe first step in supporting project staff who are tasked with data management and analysis is implementing a formal data strategy. Having a framework in place will lift the burden from busy supervisory staff and it will improve data consistency and insights moving forward.
When asked if a formal data strategy was a part of their organization’s approach to managing data, only 55% of respondents indicated they’ve implemented one (see Table 18). The question then becomes, why haven’t the other 45% of organizations implemented their own strategy?
01020304
Implem
enting Formal
Data Strategies
12%34%34%16%4%
TABLE 15How frequently does your organization incorporate project data into your decision-making?
AlwaysOftenSometimesRarelyNever
Despite the increased reliance on project management and field supervision staff to make good project decisions quickly, only 12% of respondents’ organizations always incorporate project data into their decision-making. More than 50% do so occasionally or not at all (see Table 15). For the organizations committed to quality data, the three most common efforts or investments made to ensure decision-makers have access to actionable, high-quality data are:
• Regularly reviewing data at set intervals for quality purposes (40%)
• Having established data reporting and monitoring practices, both at the time of collection and use (38%)
• Structuring data in a common data environment (38%)
Project Data is not Consistently Informing Decision-Making
ALWAYS INCORPORATE PROJECT DATA INTO THEIR DECISION-MAKING
ONLY
12%
03 Implementing Formal Data Strategies

“You have to have a single data solution. If you allow each job to choose their own data solution, they are all going to choose a different one. Then you can’t roll up the data into a single framework. You need this if you want to analyze RFIs, change orders, etc.”
Chief Information OfficerGeneral Contractor (North America)
| HARNESSING THE DATA ADVANTAGE IN CONSTRUCTION34 HARNESSING THE DATA ADVANTAGE IN CONSTRUCTION | 35
Why Isn’t More Being Done to Reduce Bad Project Data?
With the technology and tools leveraged throughout all stages of construction projects, most organizations can create and capture more project data than ever before. However, when discussing this with industry leaders we learned that the sheer volume of project data available is overwhelming and can cause a state of decision paralysis. The absence of a formal data strategy may be a contributor to this.
Only 30% of respondents’ organizations implemented a process to identify and repair bad data (see Table 16). The large percentage of unusable and bad project data may be why so few respondents always incorporate project data into their decision-making.
When considering respondents that have implemented a formal data strategy, they more frequently attempt to reduce the volume of bad project data captured.
01020304
Implem
enting Formal
Data Strategies
ONLY
OF ORGANIZATIONS IMPLEMENTED A PROCESS TO IDENTIFY AND REPAIR BAD DATA
30%
03 Implementing Formal Data Strategies
TABLE 16What efforts or investments has your organization made to ensure decision-makers have access to actionable, high-quality data/information/insights?
Regularly review our data at set intervals for quality purposes
Established data reporting and monitoring practices both at
the time of collection and use
Structured our data in a common data environment
Implemented processes for identifying bad data
and repairing it
Created a formal position to oversee our data
Don’t know/ Unsure
40% 38% 38%
28% 10%30%
| HARNESSING THE DATA ADVANTAGE IN CONSTRUCTION36 HARNESSING THE DATA ADVANTAGE IN CONSTRUCTION | 37
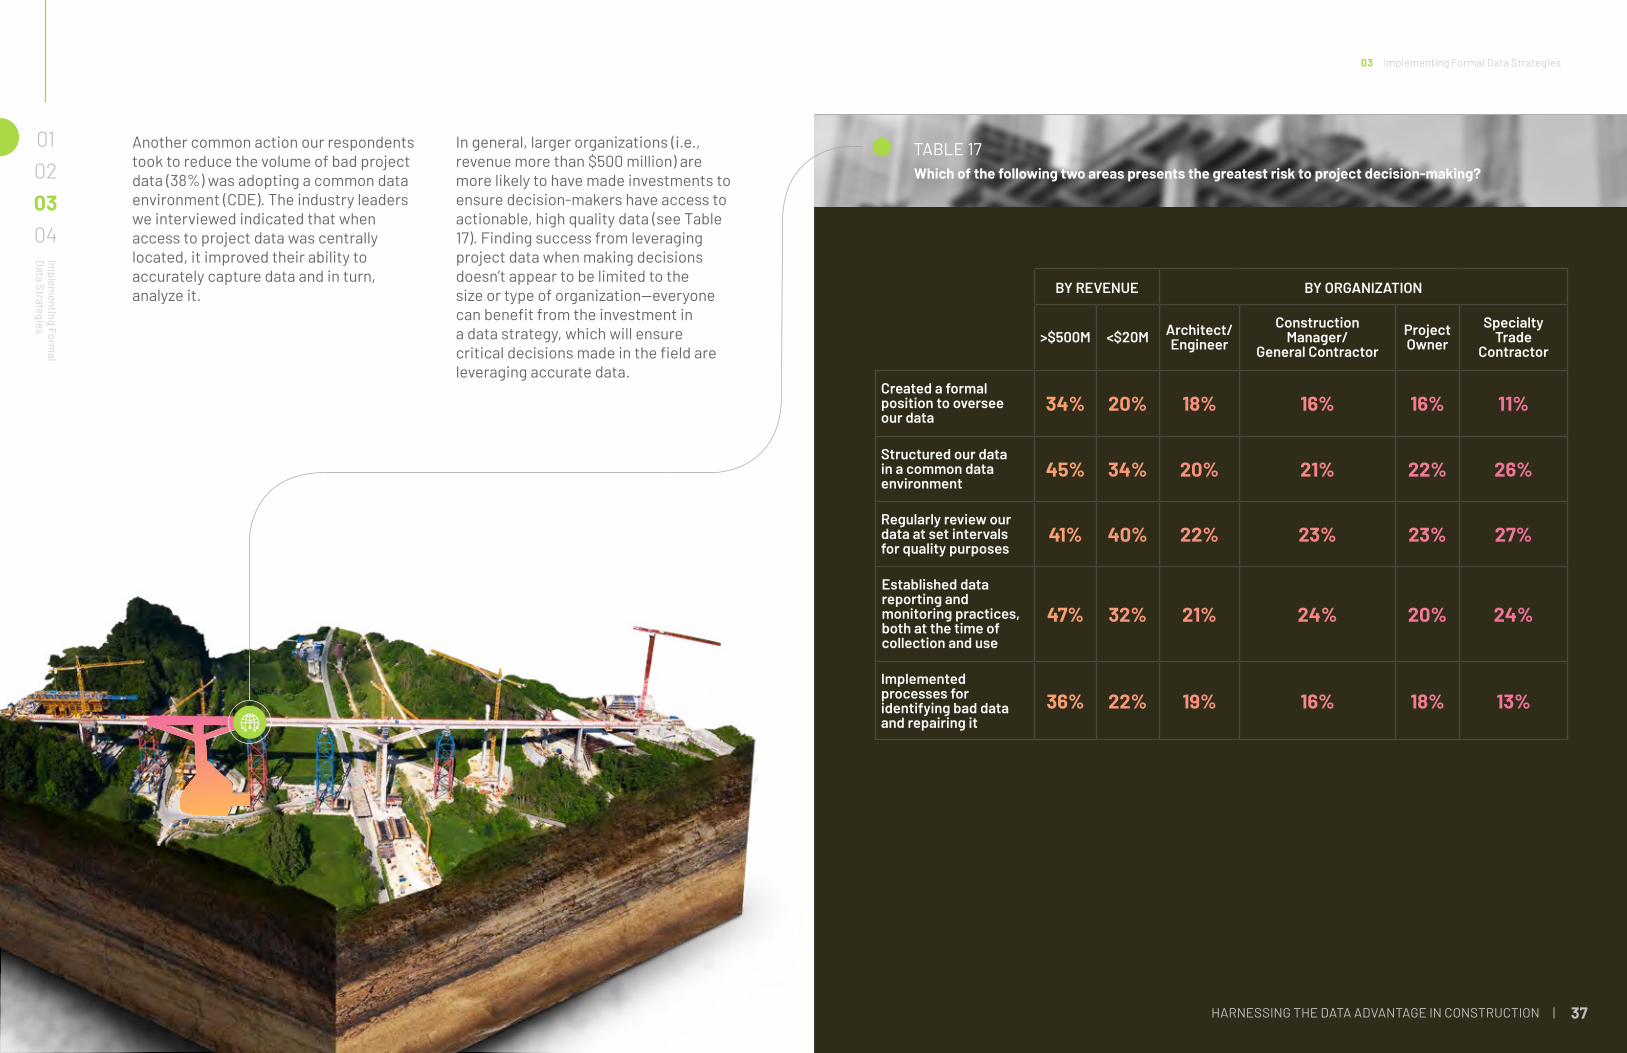
TABLE 17Which of the following two areas presents the greatest risk to project decision-making?
BY REVENUE BY ORGANIZATION
>$500M <$20M Architect/Engineer
Construction Manager/
General ContractorProject Owner
Specialty Trade
Contractor
Created a formal position to oversee our data
34% 20% 18% 16% 16% 11%
Structured our data in a common data environment
45% 34% 20% 21% 22% 26%
Regularly review our data at set intervals for quality purposes
41% 40% 22% 23% 23% 27%
Established data reporting and monitoring practices, both at the time of collection and use
47% 32% 21% 24% 20% 24%
Implemented processes for identifying bad data and repairing it
36% 22% 19% 16% 18% 13%
In general, larger organizations (i.e., revenue more than $500 million) are more likely to have made investments to ensure decision-makers have access to actionable, high quality data (see Table 17). Finding success from leveraging project data when making decisions doesn’t appear to be limited to the size or type of organization—everyone can benefit from the investment in a data strategy, which will ensure critical decisions made in the field are leveraging accurate data.
03 Implementing Formal Data Strategies
Another common action our respondents took to reduce the volume of bad project data (38%) was adopting a common data environment (CDE). The industry leaders we interviewed indicated that when access to project data was centrally located, it improved their ability to accurately capture data and in turn, analyze it.
01020304
Implem
enting Formal
Data Strategies
| HARNESSING THE DATA ADVANTAGE IN CONSTRUCTION HARNESSING THE DATA ADVANTAGE IN CONSTRUCTION | 38 39
Formal DataManagement StrategyWhen asked if they had a formal data strategy, only 55% of respondents selected “yes”.
Respondents that “always” or “often” incorporate project data into their decision-making were more likely to have a formal data management plan or strategy (see Table 19).
01020304
Implem
enting Formal
Data Strategies
03 Implementing Formal Data Strategies
TABLE 18
TABLE 19
Are you able to effectively use data captured from multiple projects at the organization level?
Existence of a formal plan/strategy and frequency of project data incorporated in decision-making.
Yes
No
I don’t know/Unsure
50%
45%
40%
35%
30%
25%
20%
15%
10%
5%
0%
13%
31%55%
Always Often Sometimes Rarely Never
APAC NOAMEurope
| HARNESSING THE DATA ADVANTAGE IN CONSTRUCTION HARNESSING THE DATA ADVANTAGE IN CONSTRUCTION | 40 41
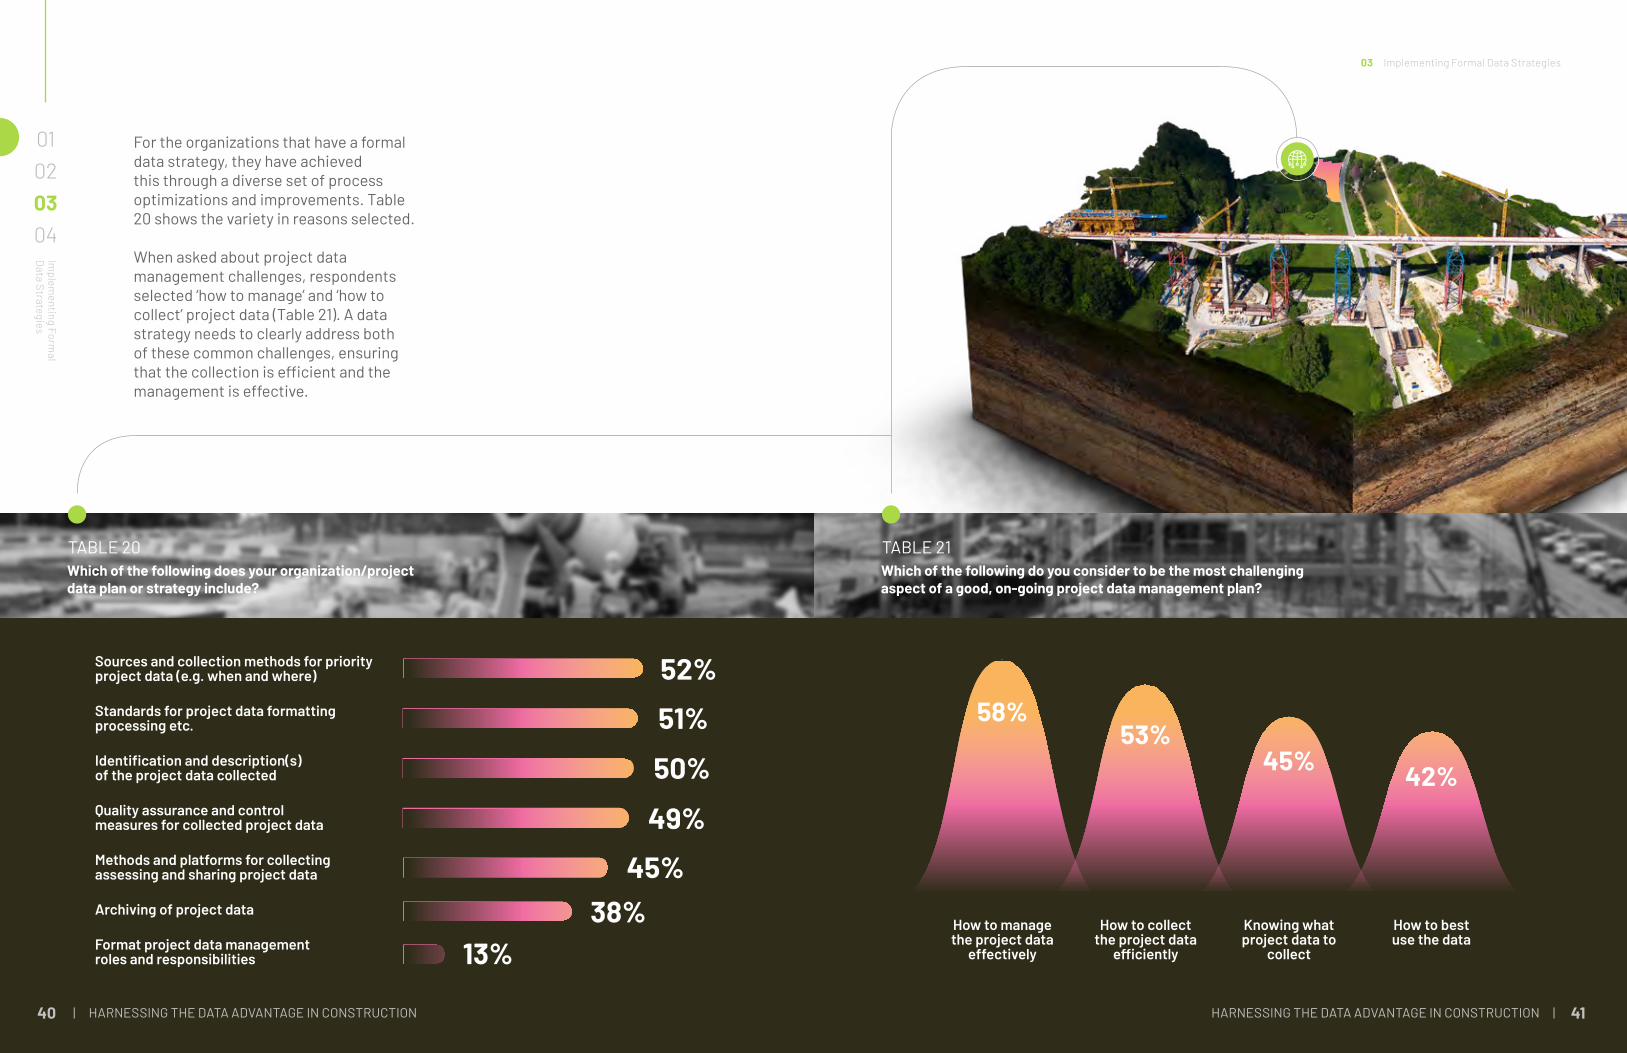
For the organizations that have a formal data strategy, they have achieved this through a diverse set of process optimizations and improvements. Table 20 shows the variety in reasons selected.
When asked about project data management challenges, respondents selected ‘how to manage’ and ‘how to collect’ project data (Table 21). A data strategy needs to clearly address both of these common challenges, ensuring that the collection is efficient and the management is effective.
01020304
Implem
enting Formal
Data Strategies
TABLE 20Which of the following does your organization/project data plan or strategy include?
Sources and collection methods for priority project data (e.g. when and where)
Standards for project data formatting processing etc.
Identification and description(s) of the project data collected
Quality assurance and control measures for collected project data
Methods and platforms for collecting assessing and sharing project data
Archiving of project data
Format project data management roles and responsibilities
52%
51%
50%
49%
45%38%
13%
03 Implementing Formal Data Strategies
TABLE 21Which of the following do you consider to be the most challenging aspect of a good, on-going project data management plan?
How to manage the project data
effectively
How to collect the project data
efficiently
Knowing what project data to
collect
How to best use the data
58%53%
45% 42%
| HARNESSING THE DATA ADVANTAGE IN CONSTRUCTION HARNESSING THE DATA ADVANTAGE IN CONSTRUCTION | 42 43
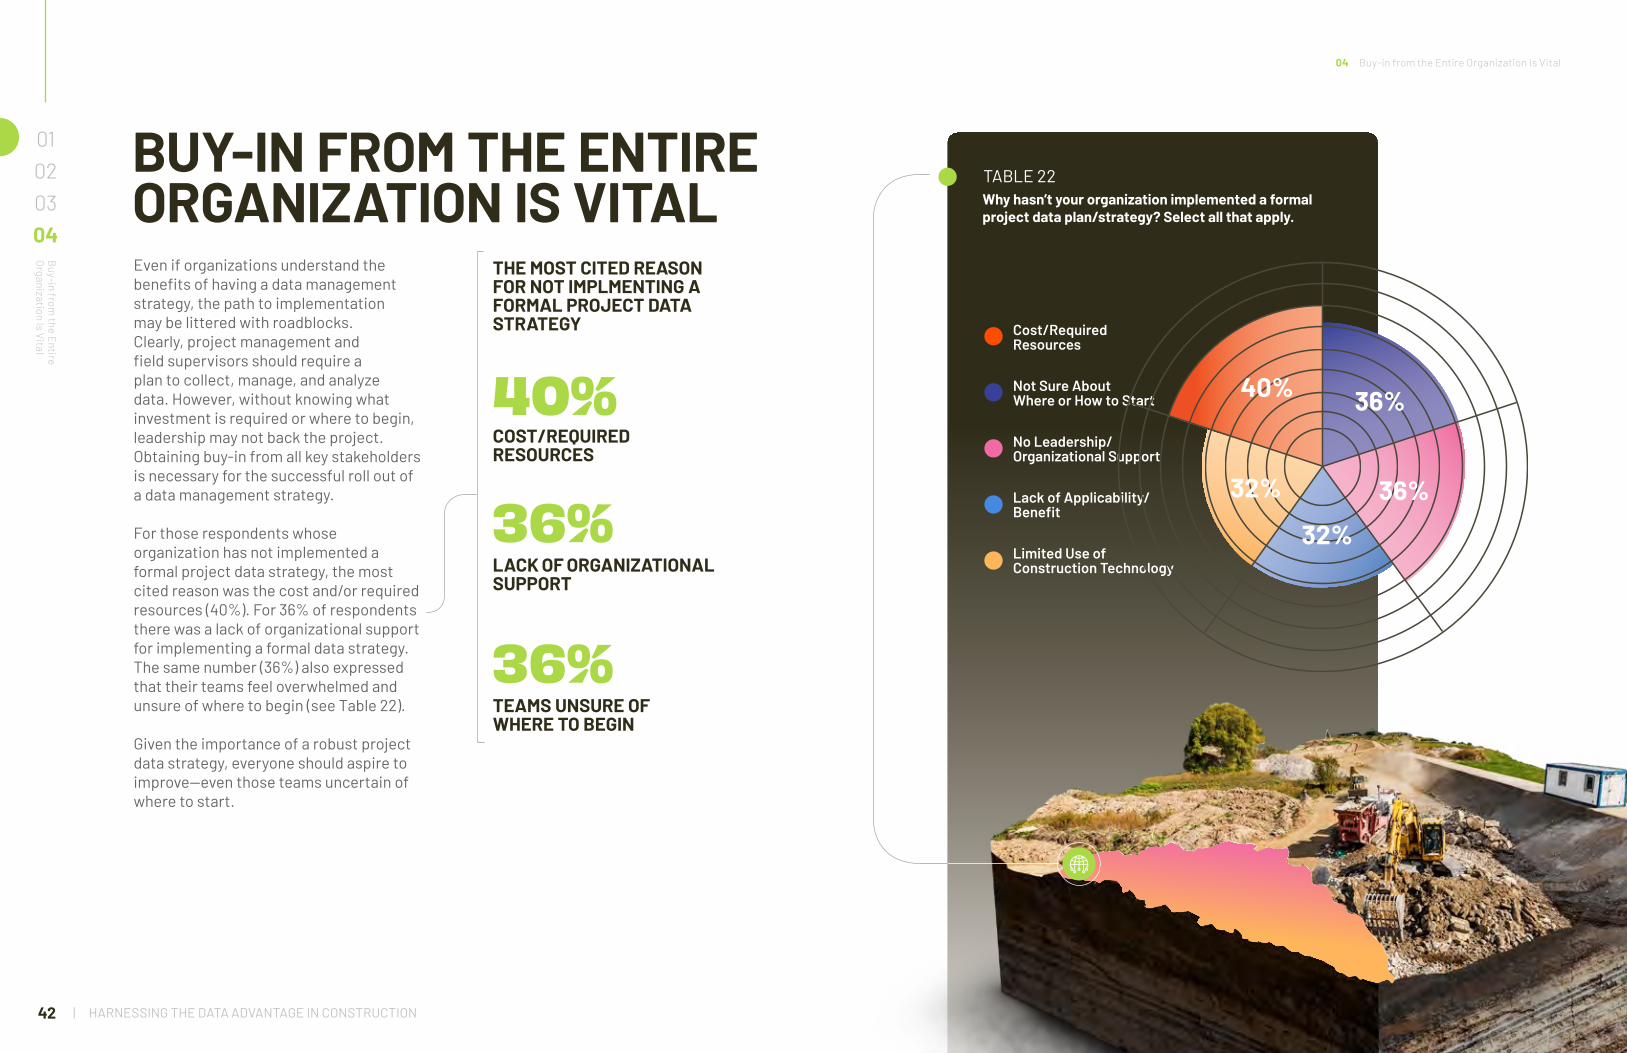
BUY-IN FROM THE ENTIRE ORGANIZATION IS VITAL Even if organizations understand the benefits of having a data management strategy, the path to implementation may be littered with roadblocks. Clearly, project management and field supervisors should require a plan to collect, manage, and analyze data. However, without knowing what investment is required or where to begin, leadership may not back the project. Obtaining buy-in from all key stakeholders is necessary for the successful roll out of a data management strategy.
For those respondents whose organization has not implemented a formal project data strategy, the most cited reason was the cost and/or required resources (40%). For 36% of respondents there was a lack of organizational support for implementing a formal data strategy. The same number (36%) also expressed that their teams feel overwhelmed and unsure of where to begin (see Table 22).
Given the importance of a robust project data strategy, everyone should aspire to improve—even those teams uncertain of where to start.
01020304
Buy-in from
the Entire O
rganization Is Vital
COST/REQUIRED RESOURCES
LACK OF ORGANIZATIONAL SUPPORT
TEAMS UNSURE OF WHERE TO BEGIN
THE MOST CITED REASON FOR NOT IMPLMENTING A FORMAL PROJECT DATA STRATEGY
40%
36%
36%
TABLE 22Why hasn’t your organization implemented a formal project data plan/strategy? Select all that apply.
Cost/Required Resources
Not Sure About Where or How to Start
No Leadership/Organizational Support
Lack of Applicability/Benefit
Limited Use of Construction Technology
40% 36%
36%
32%
32%
04 Buy-in from the Entire Organization Is Vital
| HARNESSING THE DATA ADVANTAGE IN CONSTRUCTION HARNESSING THE DATA ADVANTAGE IN CONSTRUCTION | 44 45
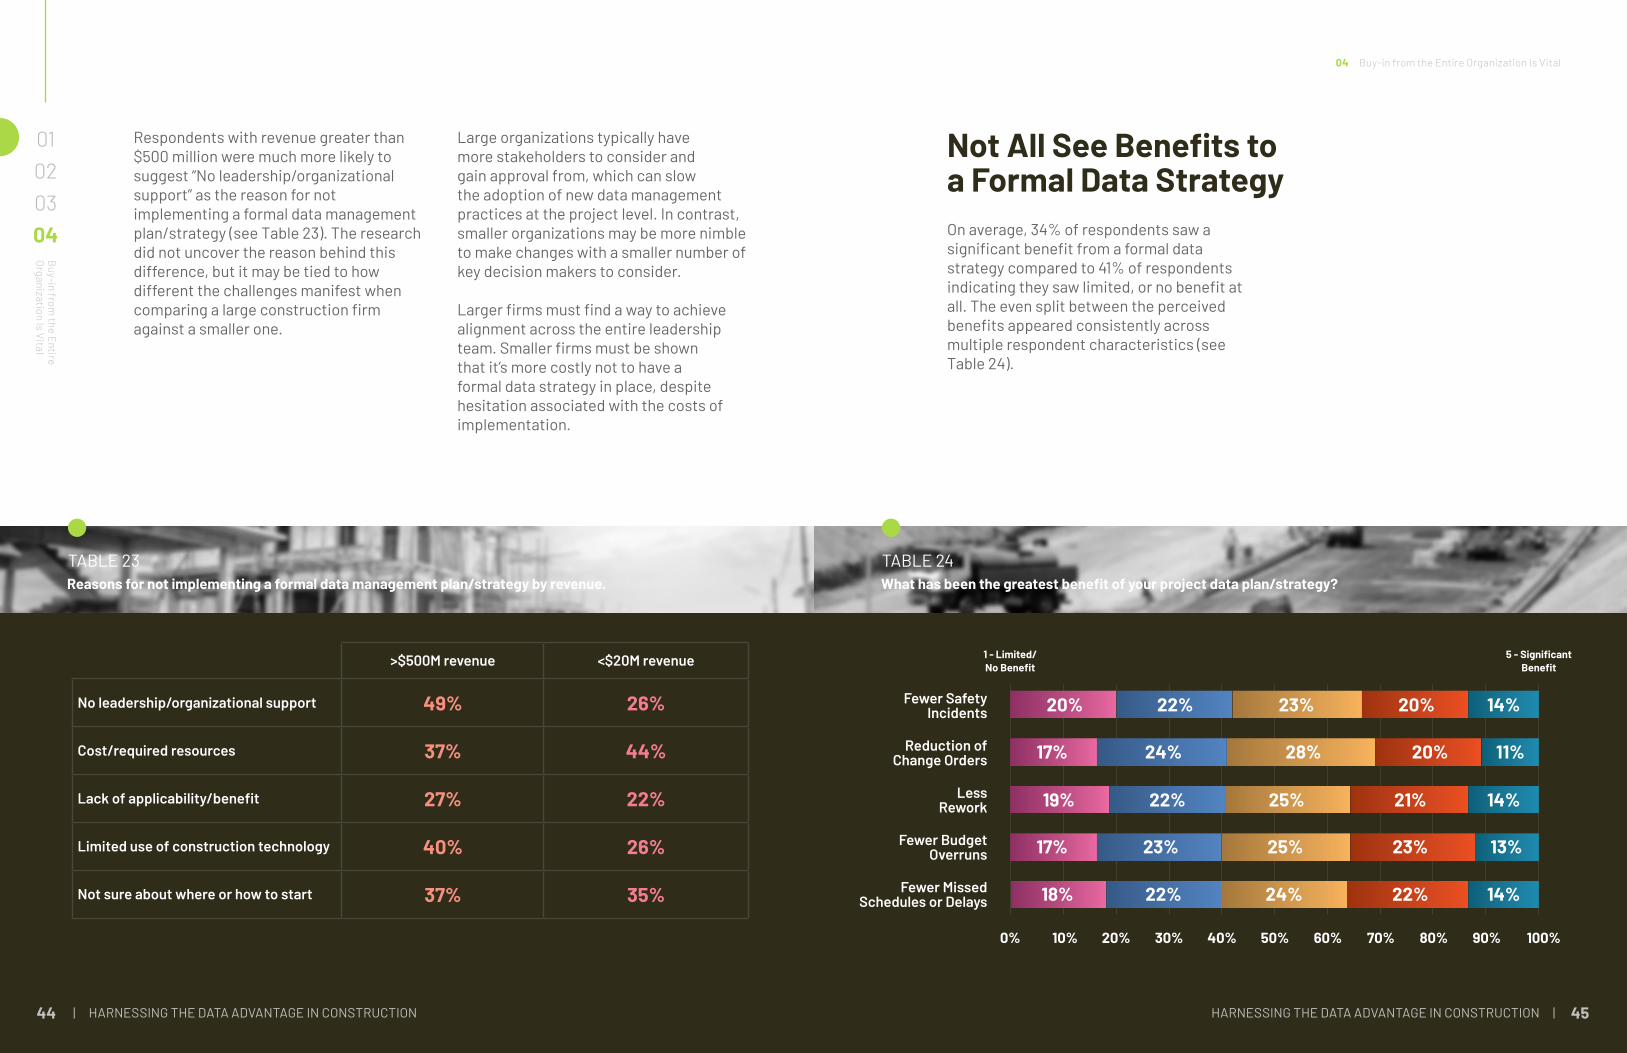
Respondents with revenue greater than $500 million were much more likely to suggest “No leadership/organizational support” as the reason for not implementing a formal data management plan/strategy (see Table 23). The research did not uncover the reason behind this difference, but it may be tied to how different the challenges manifest when comparing a large construction firm against a smaller one.
Large organizations typically have more stakeholders to consider and gain approval from, which can slow the adoption of new data management practices at the project level. In contrast, smaller organizations may be more nimble to make changes with a smaller number of key decision makers to consider.
Larger firms must find a way to achieve alignment across the entire leadership team. Smaller firms must be shown that it’s more costly not to have a formal data strategy in place, despite hesitation associated with the costs of implementation.
01020304
Buy-in from
the Entire O
rganization Is Vital
TABLE 23Reasons for not implementing a formal data management plan/strategy by revenue.
>$500M revenue <$20M revenue
No leadership/organizational support 49% 26%
Cost/required resources 37% 44%
Lack of applicability/benefit 27% 22%
Limited use of construction technology 40% 26%
Not sure about where or how to start 37% 35%
On average, 34% of respondents saw a significant benefit from a formal data strategy compared to 41% of respondents indicating they saw limited, or no benefit at all. The even split between the perceived benefits appeared consistently across multiple respondent characteristics (see Table 24).
Not All See Benefits to a Formal Data Strategy
TABLE 24What has been the greatest benefit of your project data plan/strategy?
04 Buy-in from the Entire Organization Is Vital
Fewer Safety Incidents
Reduction of Change Orders
Less Rework
Fewer Budget Overruns
Fewer Missed Schedules or Delays
0%
1 - Limited/ No Benefit
5 - Significant Benefit
10% 20% 30% 40% 50% 60% 70% 80% 90% 100%
20% 22% 23% 20%
20%
21%
23%
22%24%
25%
25%
28%24%
22%
22%
23%17%
17%
18%
19%
14%
14%
14%
13%
11%
46 47
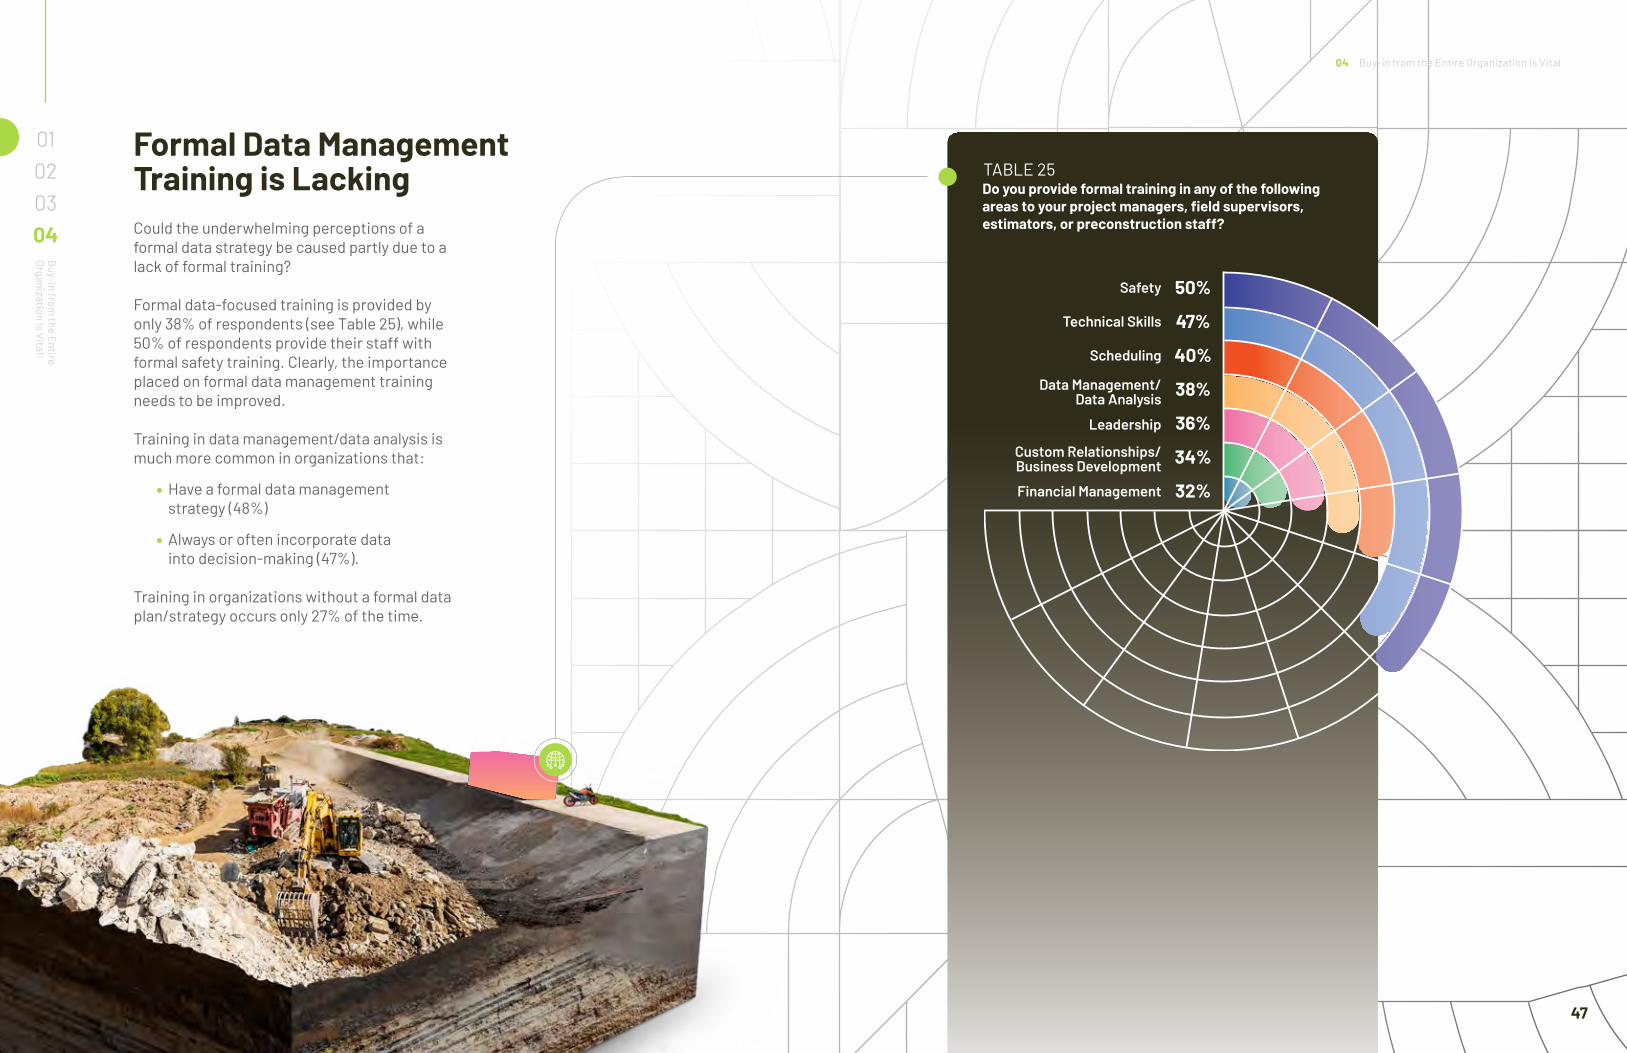
Formal Data Management Training is LackingCould the underwhelming perceptions of a formal data strategy be caused partly due to a lack of formal training?
Formal data-focused training is provided by only 38% of respondents (see Table 25), while 50% of respondents provide their staff with formal safety training. Clearly, the importance placed on formal data management training needs to be improved.
Training in data management/data analysis is much more common in organizations that:
• Have a formal data management strategy (48%)
• Always or often incorporate data into decision-making (47%).
Training in organizations without a formal data plan/strategy occurs only 27% of the time.
01020304
Buy-in from
the Entire O
rganization Is Vital
04 Buy-in from the Entire Organization Is Vital
TABLE 25Do you provide formal training in any of the following areas to your project managers, field supervisors, estimators, or preconstruction staff?
Safety
Technical Skills
Scheduling
Leadership
Financial Management
Data Management/ Data Analysis
Custom Relationships/Business Development
50%
47%
40%
38%
36%
34%
32%

| HARNESSING THE DATA ADVANTAGE IN CONSTRUCTION HARNESSING THE DATA ADVANTAGE IN CONSTRUCTION | 48 49
TABLE 26Types of training implemented at organzations, broken down by respondents’ data utilization and revenue.
70%
60%
50%
40%
30%
20%
10%
0%
CustomerRelationship/
BusinessDevelopment
DataManagement/Data Analysis
FinancialManagement
Always/often incorporate project data in decision making
Sometimes incorporate project data in decision making
Formal data plan/strategy
No formal data plan/strategy
>$500M revenue
<$500M revenue
04 Buy-in from the Entire Organization Is Vital
Leadership Safety Scheduling TechnicalSkills

50 51
For the respondents that did have training in data management, half had access to informal on-the-job training, 42% had formal in-house training, and 35% had formal third-party instruction (see Table 27). Increasing access to formal training for project-level staff instead of relying on informal on-the-job training would yield better results when implementing a data strategy.
01020304
Buy-in from
the Entire O
rganization Is Vital
TABLE 27In what format is data and information management training currently provided and how?
04 Buy-in from the Entire Organization Is Vital
On-the-Job Training (Informal)
Formal In-house Training
Formal Third Party Instruction (Online or in Person)
Self-directed Training
None
50%
42%
35%
18%
1%

52 HARNESSING THE DATA ADVANTAGE IN CONSTRUCTION | 53
A GLOBAL DATA STRATEGY: KEYFINDINGS BY REGIONThe data collected in this study spanned three regions: North America, Asia-Pacific (APAC), and Europe. Up until this point of the report, all statistics have been from a global perspective. What follows includes key insights into data management strategy broken down by the three regions surveyed. In addition, country-specific findings are given where data are available.
A Global Data Strategy: Key Findings by Region

HARNESSING THE DATA ADVANTAGE IN CONSTRUCTION | 55
ASIA-PACIFICDATA STRATEGIES & STORIES
AustraliaHong KongIndiaNew ZealandSingapore
Respondents in APAC were located in Australia, Hong Kong, India, New Zealand, and Singapore. In general, APAC appears further along in their efforts to address their project data needs than Europe and North American respondents. They also took a more formal approach to planning and training, meaning project management and field supervision staff spend much of their time each week working with data.
However, APAC respondents weren’t leveraging project data for decision-making at a high frequency. As a result, APAC respondents report fewer benefits from their data management efforts.
APAC
EuropeN
OAMA Global D
ata Strategy: Key Findings by Region

| HARNESSING THE DATA ADVANTAGE IN CONSTRUCTION HARNESSING THE DATA ADVANTAGE IN CONSTRUCTION | 56 57
More Effort in APAC to Collect Quality DataAPAC survey respondents have made more effort or invested more to ensure decision-makers have access to actionable, high-quality data/information/insights than respondents from the other regions. For example, (see Table 28), more APAC respondents implemented
APAC
EuropeN
OAMA Global D
ata Strategy: Key Findings by Region
TABLE 28What efforts or investments has your organization made to ensure decision makers have access to actionable, high quality data/information/insights?
Regularly review our data at certain intervals
for quality purposes
Structured our data in a common data
environment
Establish data reporting in monitoring practices
both at the time of collection and use
Implemented processes for
identifying bad data and repairing it
Created a formal position to oversee
our data
50%
40%
30%
20%
10%
0%
APAC NOAMEurope
processes for identifying bad data and repairing it (40% in APAC versus 27% in Europe and 19% in North America). They also review data at set intervals for quality purposes more regularly (49% APAC vs. 38% Europe and 36% in North America).
Respondents in both Hong Kong and Australia reported that their largest challenge was data not being easily accessible, either due to its structure or the unwillingness of others to share. India, New Zealand, and Singapore found their largest challenge to be errors, which raised suspicion about the data and its value.
All APAC respondents reported an increase in available project data when compared to the volume they collected three years ago.
TABLE 29Which of the following do you consider to be the most challenging aspect of a good, ongoing project data management plan?
Australia Hong Kong India New Zealand Singapore
Knowing what project data to collect 40% 45% 40% 56% 53%
How to collect the project data efficiently 56% 57% 44% 58% 55%
How to manage the project data effectively 57% 60% 63% 48% 51%
How to best use the data 47% 37% 53% 38% 41%
APAC A Global Data Strategy: Key Findings by Region
• India reported the largest increase in data collection, with 36% seeing an increase of 75% or greater.
• India had the most challenges when compared to other APAC nations with how to manage project data effectively and how to best use it.
• Australia and Hong Kong indicated their largest challenge was with managing project data effectively.
• New Zealand and Singapore struggled the most with knowing what project data to collect.
HARNESSING THE DATA ADVANTAGE IN CONSTRUCTION | 58 59
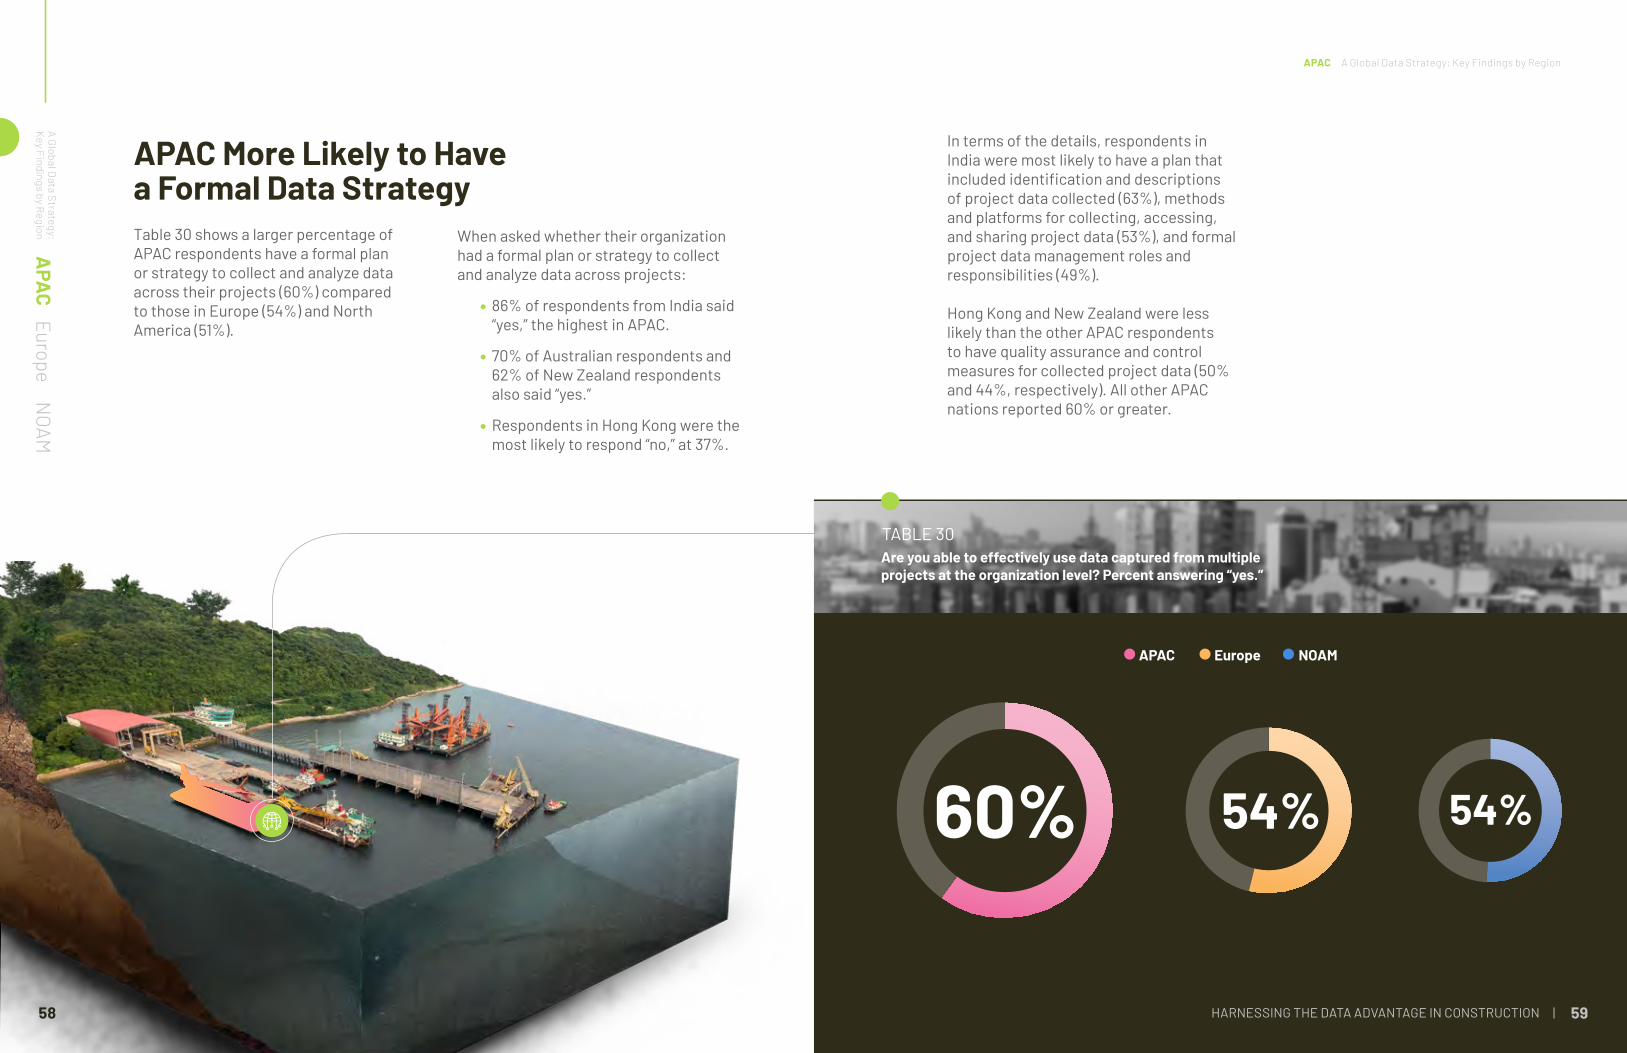
APAC More Likely to Have a Formal Data StrategyTable 30 shows a larger percentage of APAC respondents have a formal plan or strategy to collect and analyze data across their projects (60%) compared to those in Europe (54%) and North America (51%).
APAC
EuropeN
OAMA Global D
ata Strategy: Key Findings by Region When asked whether their organization
had a formal plan or strategy to collect and analyze data across projects:
• 86% of respondents from India said “yes,” the highest in APAC.
• 70% of Australian respondents and 62% of New Zealand respondents also said “yes.”
• Respondents in Hong Kong were the most likely to respond “no,” at 37%.
59
In terms of the details, respondents in India were most likely to have a plan that included identification and descriptions of project data collected (63%), methods and platforms for collecting, accessing, and sharing project data (53%), and formal project data management roles and responsibilities (49%).
Hong Kong and New Zealand were less likely than the other APAC respondents to have quality assurance and control measures for collected project data (50% and 44%, respectively). All other APAC nations reported 60% or greater.
TABLE 30Are you able to effectively use data captured from multiple projects at the organization level? Percent answering “yes.”
60% 54% 54%
APAC A Global Data Strategy: Key Findings by Region
APAC NOAMEurope
| HARNESSING THE DATA ADVANTAGE IN CONSTRUCTION HARNESSING THE DATA ADVANTAGE IN CONSTRUCTION | 60 61
Approaching Those Unwilling to Share Data
CASE STUDY
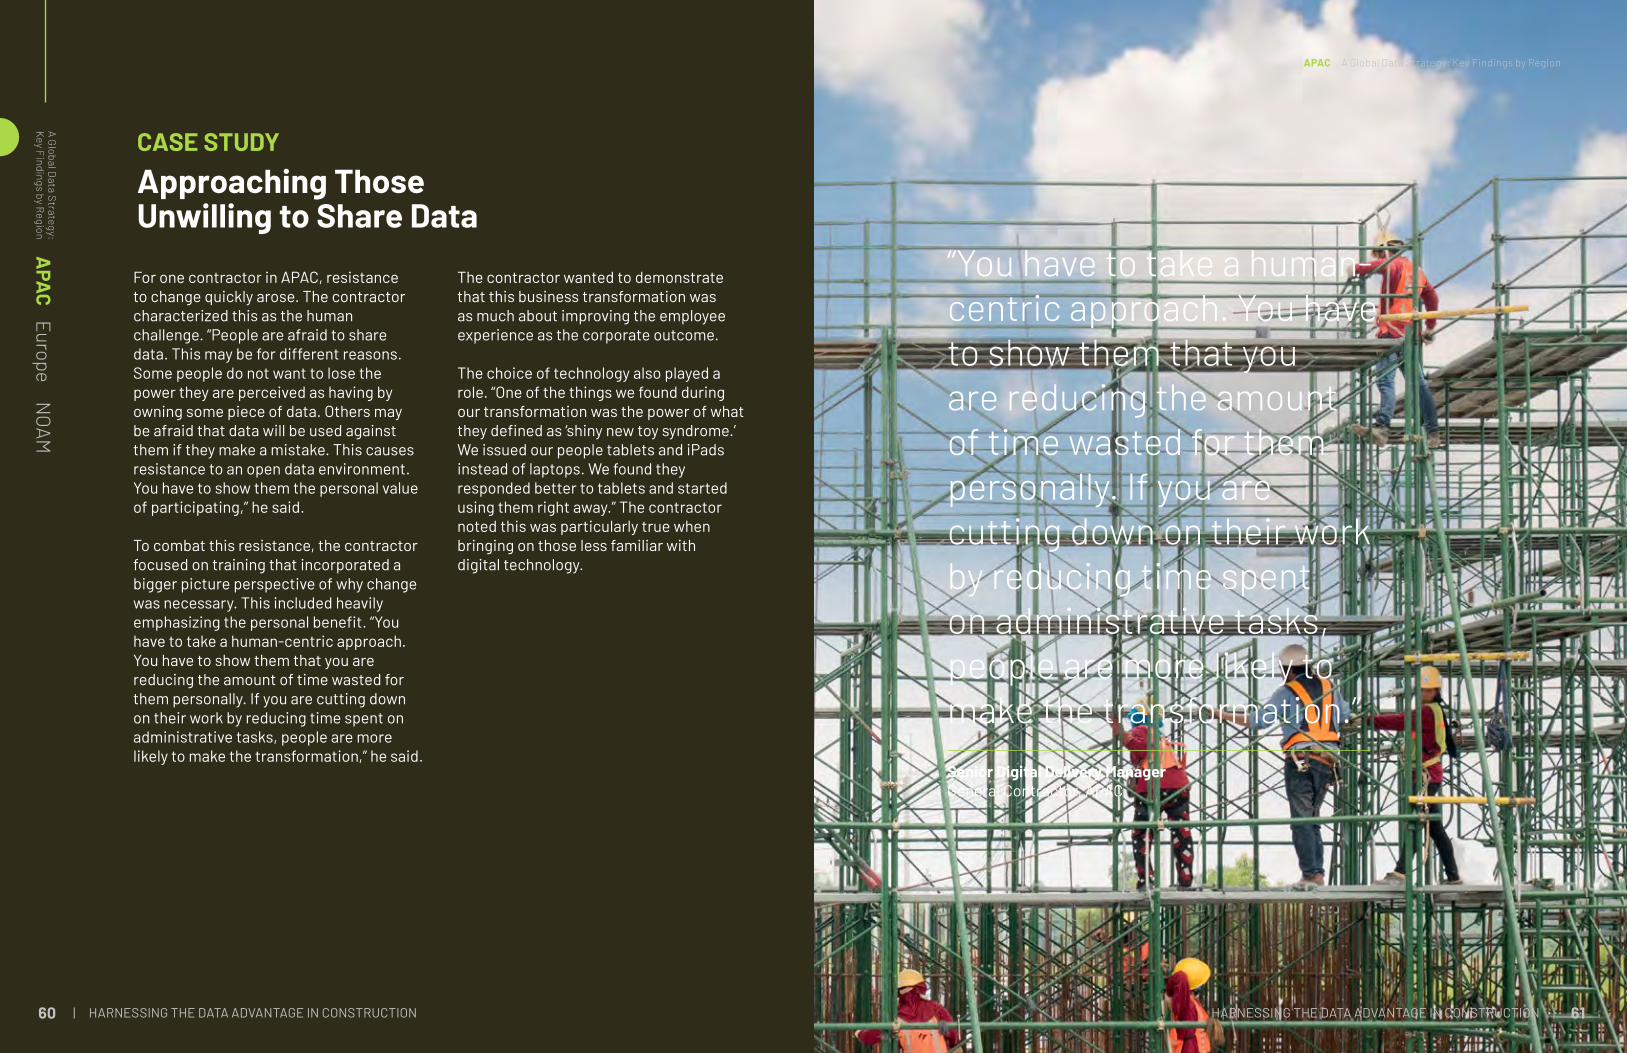
For one contractor in APAC, resistance to change quickly arose. The contractor characterized this as the human challenge. “People are afraid to share data. This may be for different reasons. Some people do not want to lose the power they are perceived as having by owning some piece of data. Others may be afraid that data will be used against them if they make a mistake. This causes resistance to an open data environment. You have to show them the personal value of participating,” he said.
To combat this resistance, the contractor focused on training that incorporated a bigger picture perspective of why change was necessary. This included heavily emphasizing the personal benefit. “You have to take a human-centric approach. You have to show them that you are reducing the amount of time wasted for them personally. If you are cutting down on their work by reducing time spent on administrative tasks, people are more likely to make the transformation,” he said.
The contractor wanted to demonstrate that this business transformation was as much about improving the employee experience as the corporate outcome.
The choice of technology also played a role. “One of the things we found during our transformation was the power of what they defined as ‘shiny new toy syndrome.’ We issued our people tablets and iPads instead of laptops. We found they responded better to tablets and started using them right away.” The contractor noted this was particularly true when bringing on those less familiar with digital technology.
APAC
EuropeN
OAMA Global D
ata Strategy: Key Findings by Region
“You have to take a human-centric approach. You have to show them that you are reducing the amount of time wasted for them personally. If you are cutting down on their work by reducing time spent on administrative tasks, people are more likely to make the transformation.”Senior Digital Delivery ManagerGeneral Contractor, APAC
APAC A Global Data Strategy: Key Findings by Region
| HARNESSING THE DATA ADVANTAGE IN CONSTRUCTION HARNESSING THE DATA ADVANTAGE IN CONSTRUCTION | 62 63
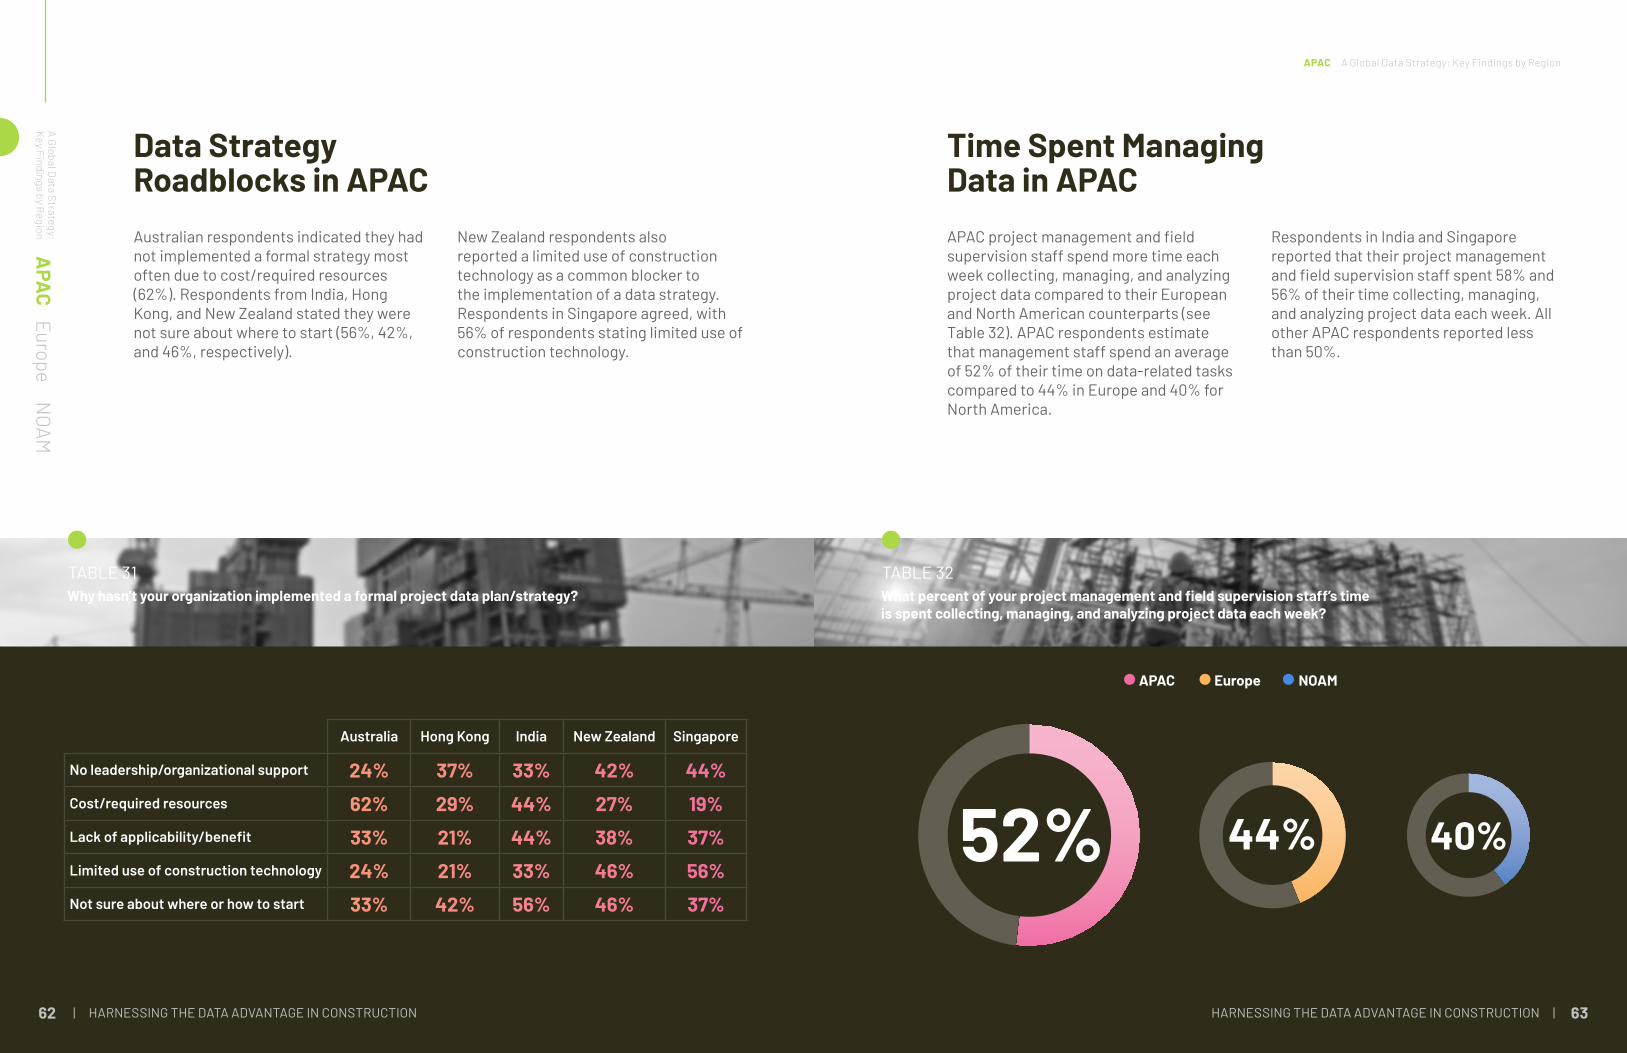
Australian respondents indicated they had not implemented a formal strategy most often due to cost/required resources (62%). Respondents from India, Hong Kong, and New Zealand stated they were not sure about where to start (56%, 42%, and 46%, respectively).
Data Strategy Roadblocks in APAC
New Zealand respondents also reported a limited use of construction technology as a common blocker to the implementation of a data strategy. Respondents in Singapore agreed, with 56% of respondents stating limited use of construction technology.
APAC
EuropeN
OAMA Global D
ata Strategy: Key Findings by Region
TABLE 31Why hasn’t your organization implemented a formal project data plan/strategy?
Australia Hong Kong India New Zealand Singapore
No leadership/organizational support 24% 37% 33% 42% 44%Cost/required resources 62% 29% 44% 27% 19%Lack of applicability/benefit 33% 21% 44% 38% 37%Limited use of construction technology 24% 21% 33% 46% 56%Not sure about where or how to start 33% 42% 56% 46% 37%
APAC project management and field supervision staff spend more time each week collecting, managing, and analyzing project data compared to their European and North American counterparts (see Table 32). APAC respondents estimate that management staff spend an average of 52% of their time on data-related tasks compared to 44% in Europe and 40% for North America.
Respondents in India and Singapore reported that their project management and field supervision staff spent 58% and 56% of their time collecting, managing, and analyzing project data each week. All other APAC respondents reported less than 50%.
Time Spent Managing Data in APAC
TABLE 32What percent of your project management and field supervision staff’s time is spent collecting, managing, and analyzing project data each week?
APAC A Global Data Strategy: Key Findings by Region
52% 44% 40%
APAC NOAMEurope

| HARNESSING THE DATA ADVANTAGE IN CONSTRUCTION HARNESSING THE DATA ADVANTAGE IN CONSTRUCTION | 64 65
Duplicate and Missing Data in APACNineteen percent of APAC respondents indicated that missing data was the primary contributor to bad project data, compared to 25% in Europe and 31% in North America. Duplicate data was the primary contributor for 20% of APAC respondents, compared to 15% in Europe and 9% in North America (see Table 33).
APAC
EuropeN
OAMA Global D
ata Strategy: Key Findings by Region
TABLE 33Which of the following do you believe most contributes to bad project data?
Missing Data Duplicate Data
APAC NOAMEurope
19%
25%31% 9% 15%
20%
APAC Respondents Preferred Formal TrainingHalf of APAC respondents provide formal data management/data analysis training, compared to 35% in Europe and 33% in North America. No APAC respondents utilize self-directed training, whereas 39% of North American respondents do (see Table 34).
Hong Kong and New Zealand reported that most of their training was formal in-house training (42% and 23%). This was in stark contrast to Australia, India, and Singapore, which reported most training was informal and done while on the job (34%, 38%, and 34%).
TABLE 34Do you provide formal training to your project managers, field supervisors, estimators, or preconstruction staff in data management/data analysis? AND In what format is data and information management training currently provided?
Data Management/Data Analysis Self-directed Training
APAC NOAMEurope
50%
35%33%
0%
24%
49%
APAC A Global Data Strategy: Key Findings by Region
| HARNESSING THE DATA ADVANTAGE IN CONSTRUCTION HARNESSING THE DATA ADVANTAGE IN CONSTRUCTION | 66 67
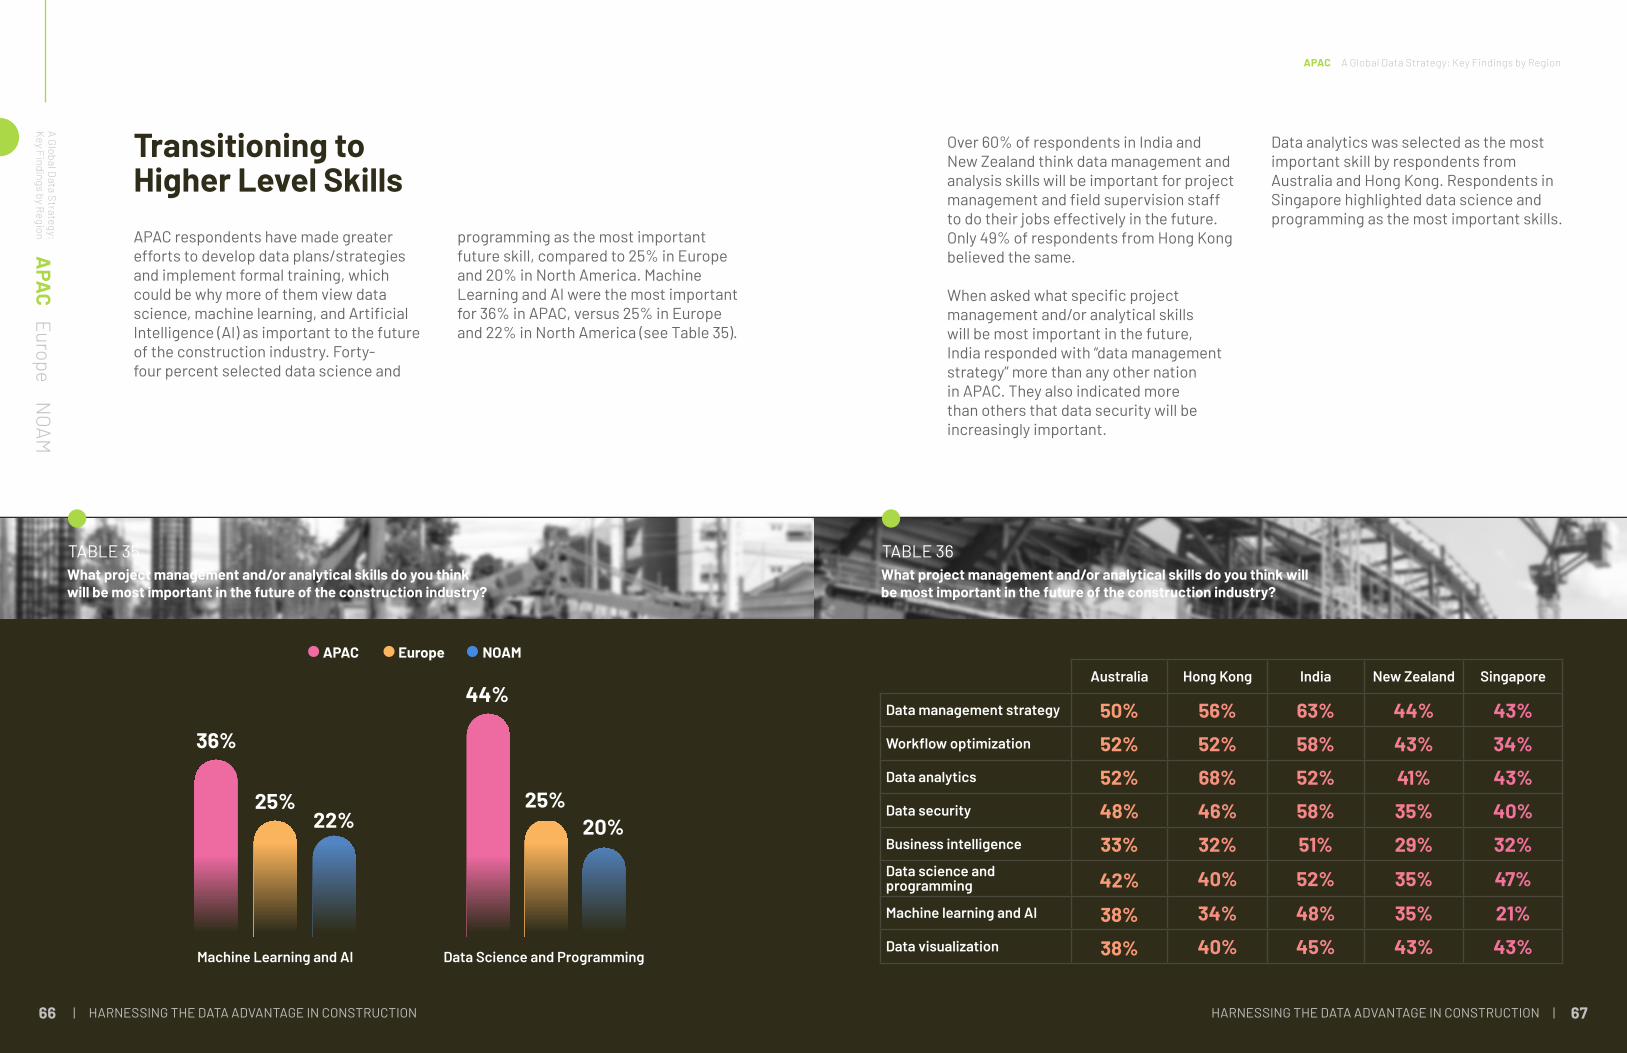
Transitioning to Higher Level SkillsAPAC respondents have made greater efforts to develop data plans/strategies and implement formal training, which could be why more of them view data science, machine learning, and Artificial Intelligence (AI) as important to the future of the construction industry. Forty-four percent selected data science and
APAC
EuropeN
OAMA Global D
ata Strategy: Key Findings by Region programming as the most important
future skill, compared to 25% in Europe and 20% in North America. Machine Learning and AI were the most important for 36% in APAC, versus 25% in Europe and 22% in North America (see Table 35).
TABLE 35What project management and/or analytical skills do you think will be most important in the future of the construction industry?
APAC NOAMEurope
Machine Learning and AI Data Science and Programming
36%
25%22%
44%
25%20%
Over 60% of respondents in India and New Zealand think data management and analysis skills will be important for project management and field supervision staff to do their jobs effectively in the future. Only 49% of respondents from Hong Kong believed the same.
When asked what specific project management and/or analytical skills will be most important in the future, India responded with “data management strategy” more than any other nation in APAC. They also indicated more than others that data security will be increasingly important.
Data analytics was selected as the most important skill by respondents from Australia and Hong Kong. Respondents in Singapore highlighted data science and programming as the most important skills.
TABLE 36What project management and/or analytical skills do you think will be most important in the future of the construction industry?
Australia Hong Kong India New Zealand Singapore
Data management strategy 50% 56% 63% 44% 43%Workflow optimization 52% 52% 58% 43% 34%Data analytics 52% 68% 52% 41% 43%Data security 48% 46% 58% 35% 40%Business intelligence 33% 32% 51% 29% 32%Data science and programming 42% 40% 52% 35% 47%Machine learning and AI 38% 34% 48% 35% 21%Data visualization 38% 40% 45% 43% 43%
APAC A Global Data Strategy: Key Findings by Region

68 69
Less Frequent Use of Project Data in APAC Decision-MakingRespondents from Hong Kong and Singapore were less likely to agree that the need for autonomy for rapid decision-making is increasing at the project manager and field supervisor levels due to such things as schedule acceleration/compression, emergency response, and stakeholder requests.
Overall, APAC respondents incorporate project data into their decision-making less frequently than North America and Europe, though not by a large margin (see Table 37).
APAC
EuropeN
OAMA Global D
ata Strategy: Key Findings by Region
TABLE 37How frequently does your organization incorporate project data into your decision making? Shown as the average response out of 5.
Never Rarely Often AlwaysSometimes
APAC NOAMEurope
APAC A Global Data Strategy: Key Findings by Region
3.6
3.34
3.6

HARNESSING THE DATA ADVANTAGE IN CONSTRUCTION | 71
EUROPEOverall, the European responses frequently trend between those from APAC and North America. Organizations in Europe took a more measured approach to incorporating data management and analysis in their day-to-day business.
Overall, the European responses frequently trend between those from APAC and North America. Organizations in Europe took a more measured approach to incorporating data management and analysis in their day-to-day business.
DATA STRATEGIES & STORIES
APACEurope
NOAM
A Global Data Strategy:
Key Findings by Region
BelgiumDenmarkFinlandFranceGermanyIrelandLuxembourgNetherlandsNorwaySwedenUnited Kingdom

| HARNESSING THE DATA ADVANTAGE IN CONSTRUCTION HARNESSING THE DATA ADVANTAGE IN CONSTRUCTION | 72 73
The Case for Quality Data in Formal Data StrategiesOf all European companies surveyed, those in Germany and France reported the greatest quantity of “usable” project data (more than 75%), while respondents in Luxembourg reported the lowest percentage of usable data.
In Europe, not all organizations have implemented a formal data management plan or strategy. Respondents in Sweden were least likely to have a formal strategy (42% of respondents), while
APACEurope
NOAM
A Global Data Strategy:
Key Findings by Region
TABLE 38What percent of the project data that your organization has access to would you describe as “usable” (readily accessible, consumable, understandable, and actionable) or something you can act on?
Belgium Denmark Finland France Germany Ireland Luxembourg Netherlands Norway Sweden U.K.
More than 75% usable 12% 14% 11% 31% 27% 20% 5% 11% 11% 18% 16%
51% to 75% usable 40% 41% 46% 41% 37% 56% 45% 51% 51% 43% 39%
26% to 50% usable 40% 39% 39% 21% 35% 23% 46% 29% 29% 35% 29%
11% to 25% usable 6% 6% 2% 6% 2% 2% 5% 9% 9% 4% 9%
Less than 10% usable 2% 0% 2% 1% 0% 0% 0% 0% 0% 0% 7%
those in Denmark, the U.K., France, and Germany had the highest percentage of respondents with a formal strategy (73%, 69%, 69%, and 68%, respectively).
For those with a formal data strategy, components of the strategy and benefits differed between European countries. France was more likely to have formal project data management roles and responsibilities (32%), well above the next highest – the U.K. (22%) and Belgium (20%) – but respondents reported low percentages across the board in Europe.
In contrast, more than half of the organizations in France (61%) and Sweden (56%) included identification and description(s) of the project data collected as part of their data strategy. Respondents from all other European nations reported less than 50%.
Respondents from Germany and Ireland were the only nations to report over 50% of their data strategies included:
• Standards for project data formatting and processing (58% and 55%)
• Quality assurance and control measures for collected project data (54% and 55%)
All other nations surveyed in Europe had percentages less than 50% for the same categories.
France was most likely to implement a formal data strategy and assign resources to ensure its execution. As such, respondents from France reported fewer budget overruns as the greatest benefit of a project data plan/strategy.
German companies whose respondents indicated having a formal data strategy were the most likely to have leadership/organizational support for implementing their strategy.
Europe A Global Data Strategy: Key Findings by Region

| HARNESSING THE DATA ADVANTAGE IN CONSTRUCTION HARNESSING THE DATA ADVANTAGE IN CONSTRUCTION | 74 75
An Innovation and Quality Manager in Europe reported: “We had a project that went terribly bad. A couple of years later, we had the exact same project. But because we did not have ready access to any data related to the first project, we made the same mistakes all over. Everything that went wrong was avoidable, had we had the lessons learned from the first project available to our team. I’m convinced of that.”
The Problems Associated with Bad Data
When asked about bad project data, the answers among European countries varied considerably. For instance, respondents in France were far more likely to indicate that capturing information inaccurately contributed most to the problem of bad project data.
However, respondents in Germany, Finland, Ireland, the Netherlands, and the U.K. all reported that the biggest contributor to bad project data was inaccurate/incorrect information. Denmark and Sweden both reported the largest contributor to be duplicate data.
APACEurope
NOAM
A Global Data Strategy:
Key Findings by Region
TABLE 39Which of the following do you believe most contributes to bad project data?
Belgium Denmark Finland France Germany Ireland Luxembourg Netherlands Norway Sweden U.K.
Inaccurate/incorrect data (e.g. the data recorded incorrectly, such as a 5 that should have been a 6) 20% 18% 31% 20% 28% 26% 13% 25% 17% 22% 28%Missing data (e.g. needed data is missing, like no area code included with the phone number) 20% 19% 24% 16% 19% 20% 23% 16% 28% 17% 23%Wrong data (e.g. the data that was collected was not the data actually needed) 21% 20% 10% 37% 15% 19% 24% 22% 17% 15% 17%Duplicate data (e.g. two or more records of the same event exist, such as the same order entered twice) 22% 29% 25% 14% 21% 14% 19% 21% 27% 23% 15%Poor data quality (e.g. misspells, alternative spelling, incomplete) 17% 14% 10% 13% 18% 22% 20% 16% 12% 23% 17%
Europe A Global Data Strategy: Key Findings by Region
| HARNESSING THE DATA ADVANTAGE IN CONSTRUCTION76 77
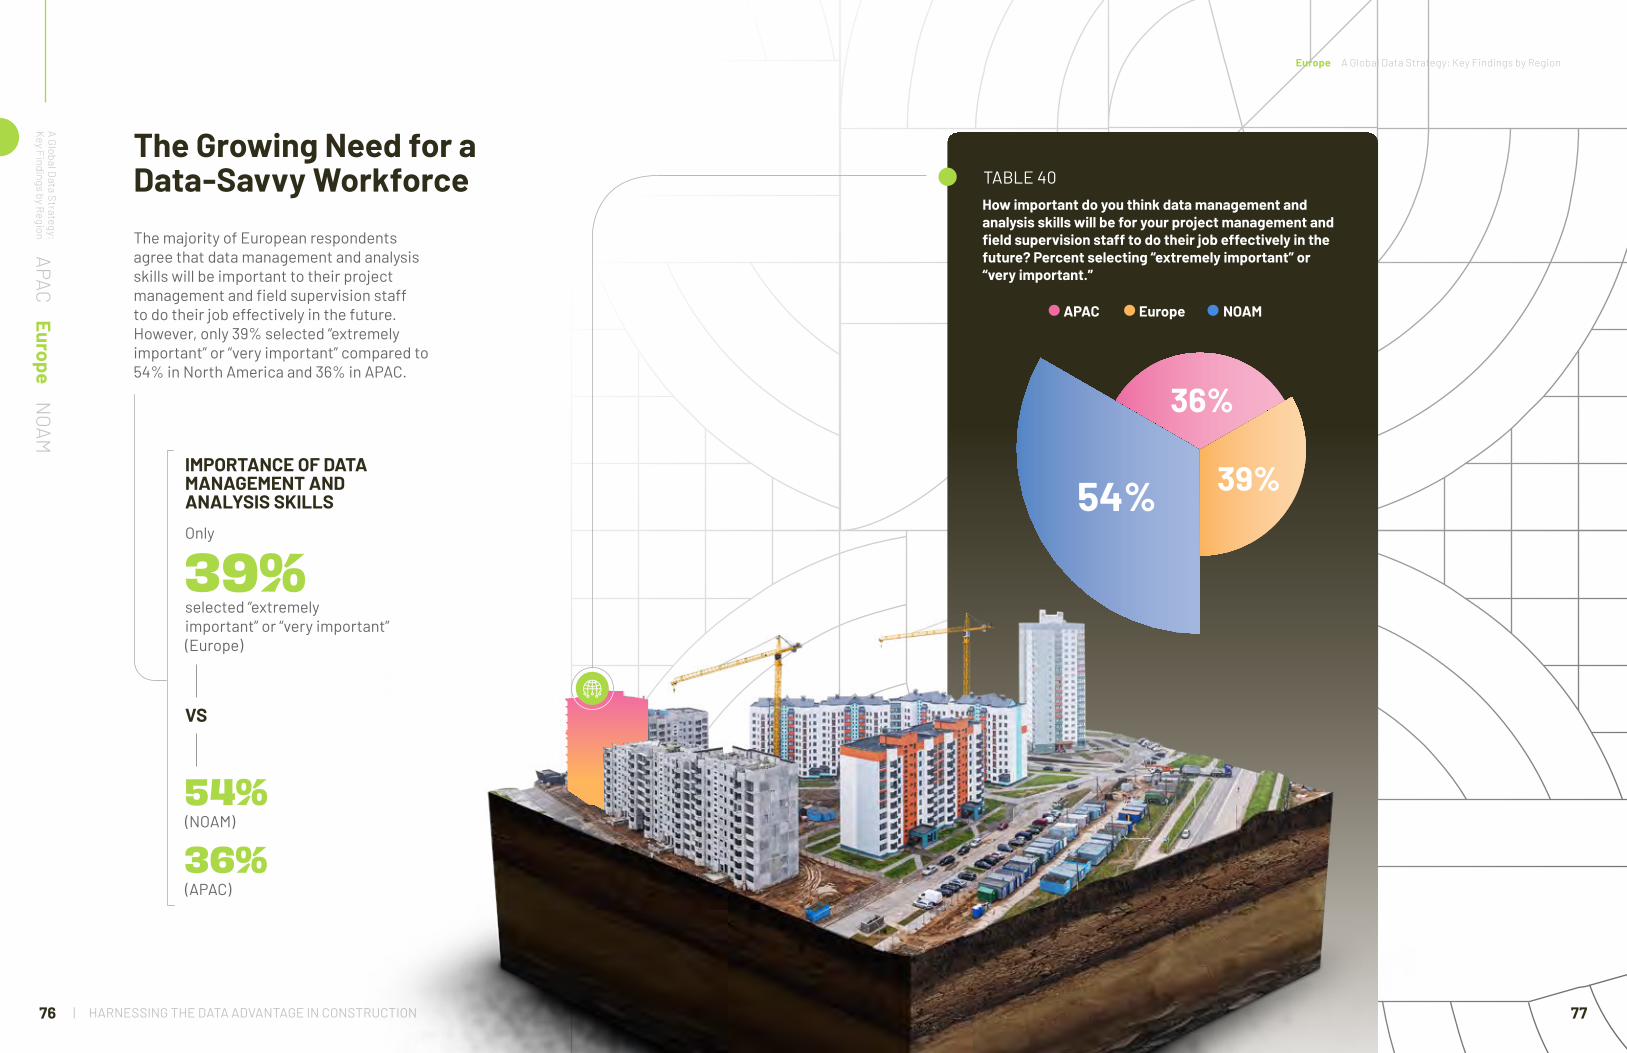
The Growing Need for a Data-Savvy WorkforceThe majority of European respondents agree that data management and analysis skills will be important to their project management and field supervision staff to do their job effectively in the future. However, only 39% selected “extremely important” or “very important” compared to 54% in North America and 36% in APAC.
APACEurope
NOAM
A Global Data Strategy:
Key Findings by Region
IMPORTANCE OF DATA MANAGEMENT AND ANALYSIS SKILLS
VS
39%
54%
36%
selected “extremely important” or “very important”(Europe)
(NOAM)
(APAC)
Only
TABLE 40How important do you think data management and analysis skills will be for your project management and field supervision staff to do their job effectively in the future? Percent selecting “extremely important” or “very important.”
Europe A Global Data Strategy: Key Findings by Region
APAC NOAMEurope
54% 39%
36%

| HARNESSING THE DATA ADVANTAGE IN CONSTRUCTION HARNESSING THE DATA ADVANTAGE IN CONSTRUCTION | 78 79
TABLE 41In what format is data and information management training currently provided and how?
Belgium Denmark Finland France Germany Ireland Luxembourg Netherlands Norway Sweden U.K.
Formal, third-party instruction (either online or in person) 21% 26% 30% 32% 36% 45% 19% 20% 45% 27% 29%
On-the-job training (informal) 25% 23% 30% 32% 30% 16% 31% 47% 6% 27% 26%
Self-directed training 21% 10% 14% 5% 9% 25% 28% 17% 26% 12% 8%
Formal in-house training 32% 42% 27% 30% 25% 11% 22% 17% 23% 34% 32%
None 0% 0% 0% 0% 0% 0% 0% 0% 0% 0% 5%
On average, project management and field supervision staff spent more than 50% of their time collecting, managing, and analyzing project data each week in Denmark, Finland, Ireland, Luxembourg, Norway, and Sweden.
Germany, Sweden, and Ireland were the countries most likely to provide formal training on data management/data analysis compared with others in Europe. Germany was also the country most likely to provide formal training for technical skills to project managers, field supervisors, estimators, or preconstruction staff.
Denmark was likely to rely mostly on formal in-house training for data and information management. Ireland and Norway were most likely to rely on formal third-party instruction. Norway utilized the least amount of informal, on-the-job training in data and information management. France, Germany, and the U.K. were least likely to use informal self-directed training at their organizations.
Europe A Global Data Strategy: Key Findings by Region
| HARNESSING THE DATA ADVANTAGE IN CONSTRUCTION HARNESSING THE DATA ADVANTAGE IN CONSTRUCTION | 80 81
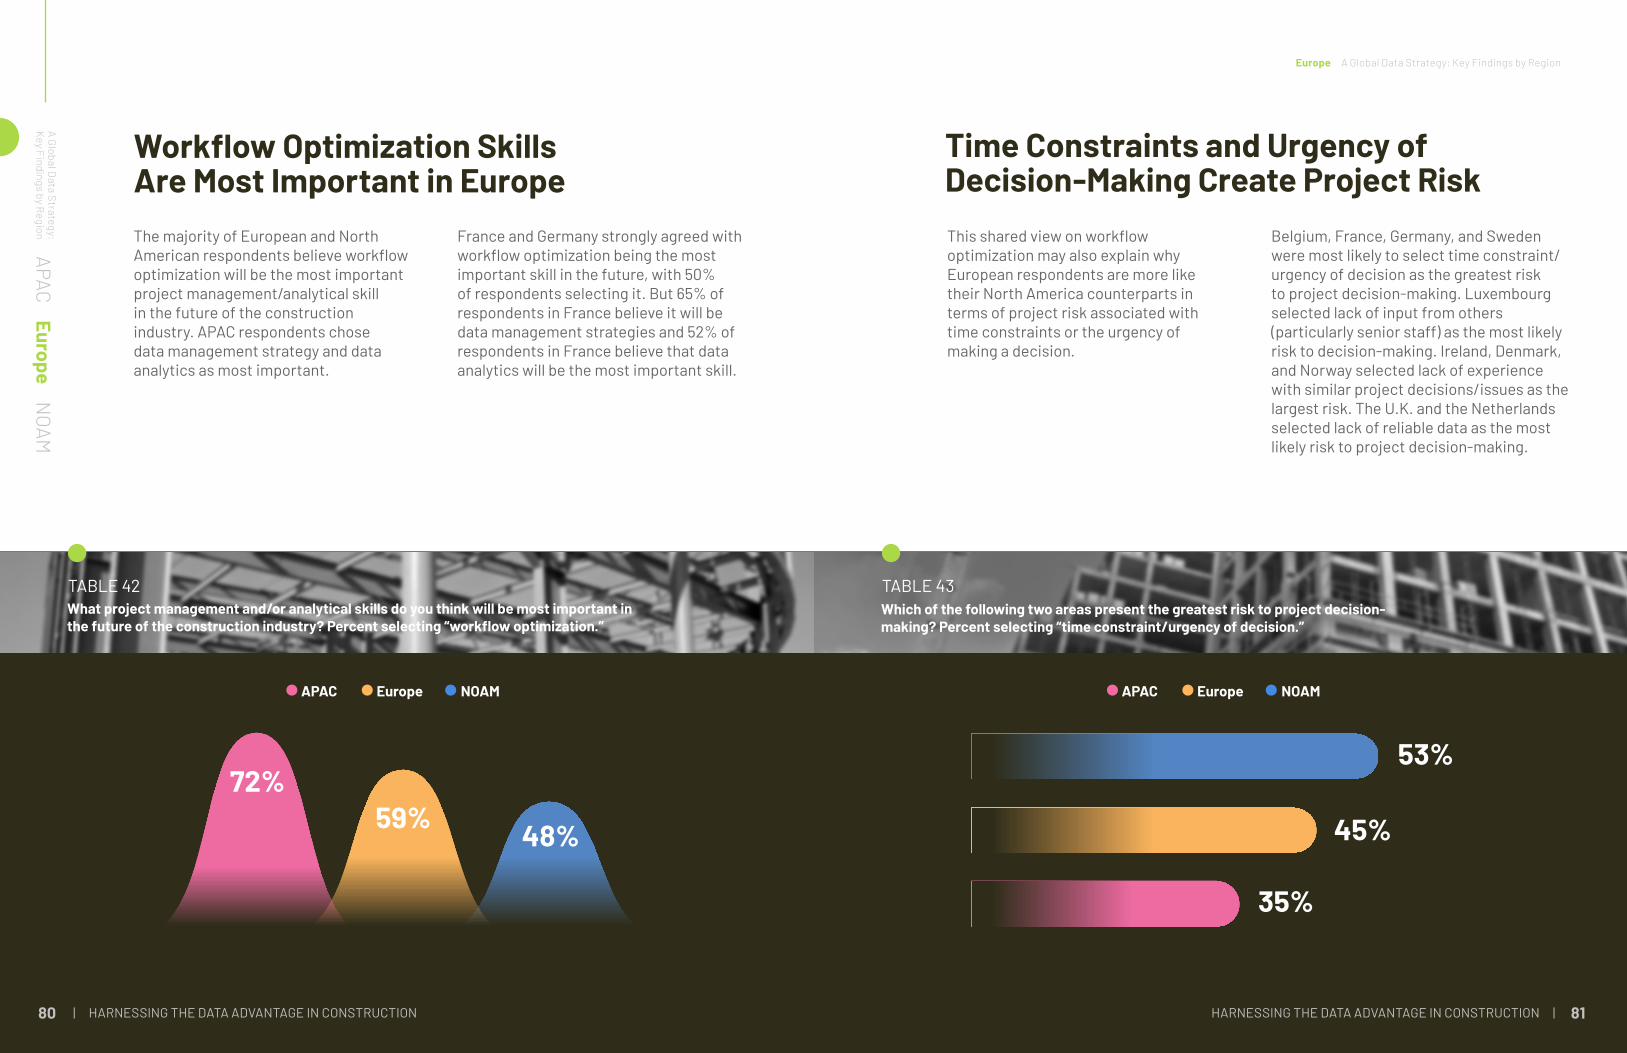
Workflow Optimization Skills Are Most Important in EuropeThe majority of European and North American respondents believe workflow optimization will be the most important project management/analytical skill in the future of the construction industry. APAC respondents chose data management strategy and data analytics as most important.
France and Germany strongly agreed with workflow optimization being the most important skill in the future, with 50% of respondents selecting it. But 65% of respondents in France believe it will be data management strategies and 52% of respondents in France believe that data analytics will be the most important skill.
APACEurope
NOAM
A Global Data Strategy:
Key Findings by Region
APAC NOAMEurope
TABLE 42What project management and/or analytical skills do you think will be most important in the future of the construction industry? Percent selecting “workflow optimization.”
72%59% 48%
Time Constraints and Urgency of Decision-Making Create Project RiskThis shared view on workflow optimization may also explain why European respondents are more like their North America counterparts in terms of project risk associated with time constraints or the urgency of making a decision.
Belgium, France, Germany, and Sweden were most likely to select time constraint/urgency of decision as the greatest risk to project decision-making. Luxembourg selected lack of input from others (particularly senior staff) as the most likely risk to decision-making. Ireland, Denmark, and Norway selected lack of experience with similar project decisions/issues as the largest risk. The U.K. and the Netherlands selected lack of reliable data as the most likely risk to project decision-making.
APAC NOAMEurope
TABLE 43Which of the following two areas present the greatest risk to project decision-making? Percent selecting “time constraint/urgency of decision.”
53%
45%
35%
Europe A Global Data Strategy: Key Findings by Region
| HARNESSING THE DATA ADVANTAGE IN CONSTRUCTION HARNESSING THE DATA ADVANTAGE IN CONSTRUCTION | 82 83
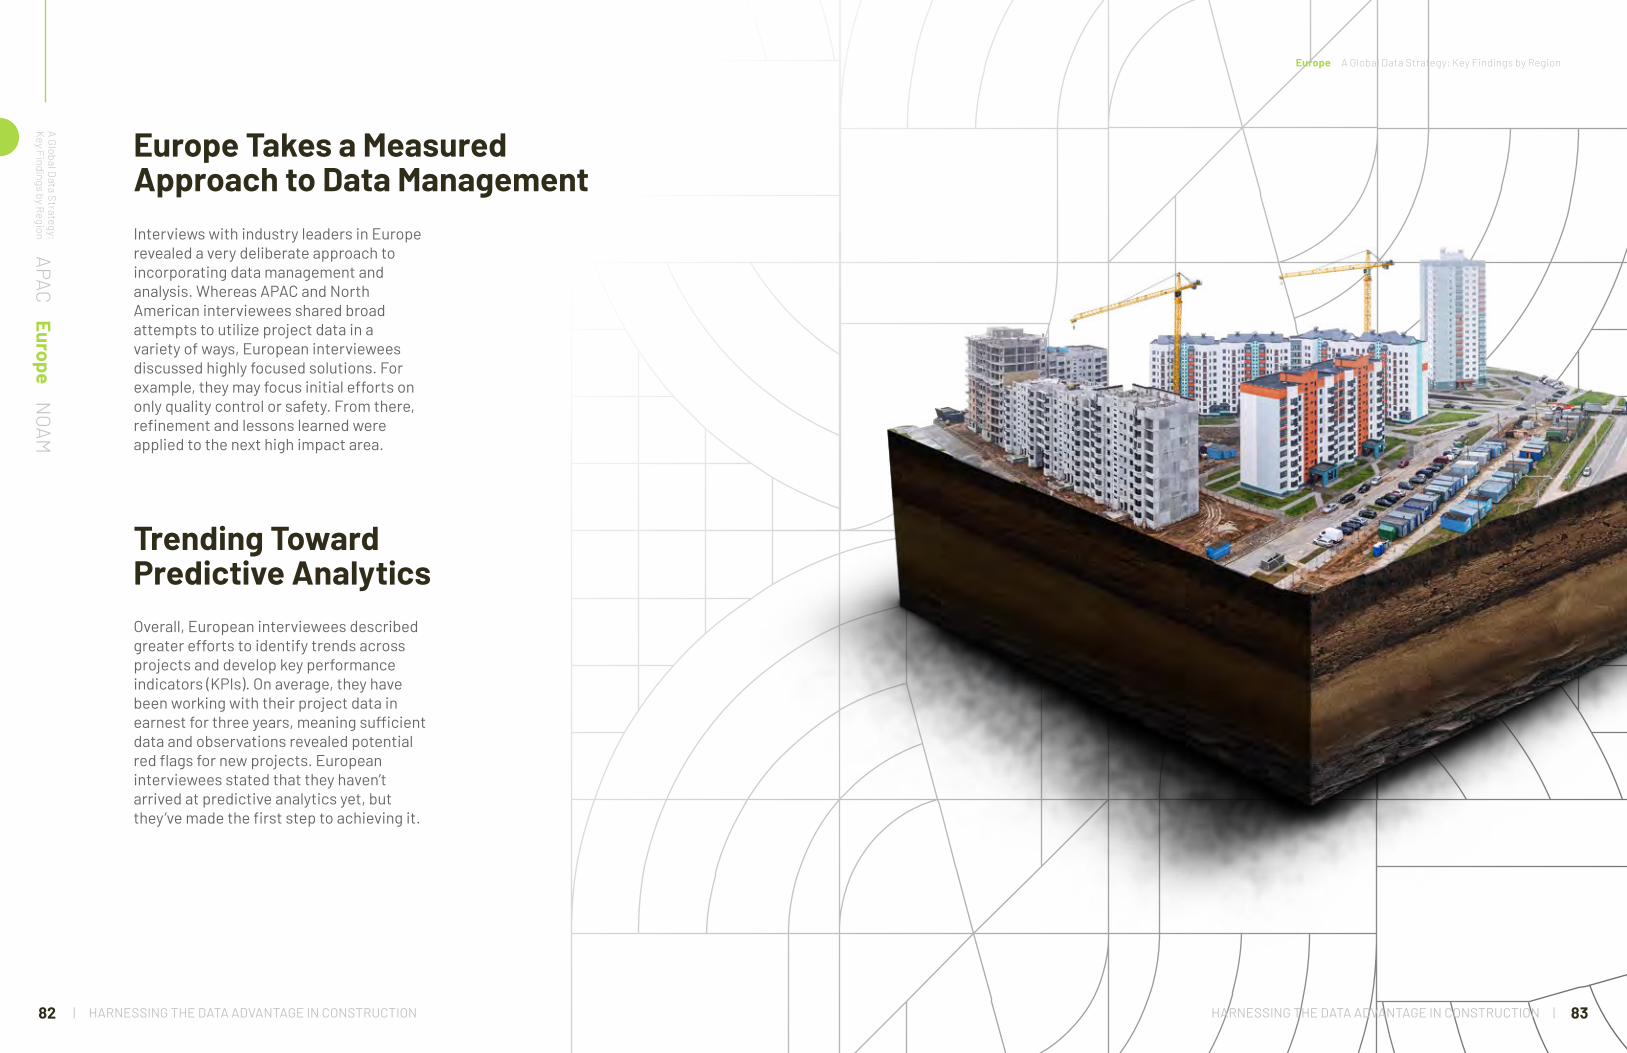
Interviews with industry leaders in Europe revealed a very deliberate approach to incorporating data management and analysis. Whereas APAC and North American interviewees shared broad attempts to utilize project data in a variety of ways, European interviewees discussed highly focused solutions. For example, they may focus initial efforts on only quality control or safety. From there, refinement and lessons learned were applied to the next high impact area.
Overall, European interviewees described greater efforts to identify trends across projects and develop key performance indicators (KPIs). On average, they have been working with their project data in earnest for three years, meaning sufficient data and observations revealed potential red flags for new projects. European interviewees stated that they haven’t arrived at predictive analytics yet, but they’ve made the first step to achieving it.
Europe Takes a Measured Approach to Data Management
Trending Toward Predictive Analytics
APACEurope
NOAM
A Global Data Strategy:
Key Findings by Region
Europe A Global Data Strategy: Key Findings by Region

| HARNESSING THE DATA ADVANTAGE IN CONSTRUCTION HARNESSING THE DATA ADVANTAGE IN CONSTRUCTION | 84 85
APACEurope
NOAM
A Global Data Strategy:
Key Findings by Region
How KPIs Connect the Dots from Data Capture to Analysis
CASE STUDY
One contractor realized that they were collecting project data only for immediate use and that identifying and benefiting from KPIs was limited at their firm. “We had to think about how to use the collection of the data we had to develop KPIs,” he said.
The contractor’s data revealed the impact of damages or defects as one KPI. “With this information, we are able to tell if a project is likely to run over budget based on damages or defects experienced to date,” he said. This early indication allows the contractor to adjust and introduce solutions to avoid further damages or defects and protect the project budget.
He went on to say, “We are using project data to alert us to things before a problem arises. For example, we can track the number of encountered defects. We know once they exceed a certain number that the schedule is going to be delayed. Having these insights allows us to address things when we can still do something about them.”
After identifying the project data that needed to be collected, the contractor encountered a challenge: the disconnect between those that “collect” it and those that “use” it. To ensure the data collection was accurate and timely, their solution was twofold.
First, the contractor demonstrated the value of project-data-driven KPIs to improve performance. He said, “The ability to see how everyone contributes to the success of a project has great value. A data-rich environment will help demonstrate this.”
Second, training focused on the expectations for specific roles was implemented. Referring to those who collect the project data, he said, “Our training is focused on how to collect the data accurately and not how to manage it. There’s no reason to train someone for a job they are not being asked to do. You have to keep it simple.”
“We are using project data to alert us to things before a problem arises. For example, we can track the number of encountered defects. We know once they exceed a certain number that the schedule is going to be delayed. Having these insights allows us to address things when we can still do something about them.” BIM CoordinatorGeneral/ Main Contractor, Europe
Europe A Global Data Strategy: Key Findings by Region

HARNESSING THE DATA ADVANTAGE IN CONSTRUCTION | 87
NORTH AMERICANorth American survey respondents were more schedule sensitive than those in APAC and Europe. These companies more frequently incorporated project data into their decision-making and a larger percentage have implemented methods for collecting, accessing, and sharing project data. North American organizations also perceive greater benefits from a formal data plan/strategy than those in APAC and Europe.
APACEurope
NOA
MA Global D
ata Strategy: Key Findings by Region
DATA STRATEGIES & STORIES
| HARNESSING THE DATA ADVANTAGE IN CONSTRUCTION HARNESSING THE DATA ADVANTAGE IN CONSTRUCTION | 88 89
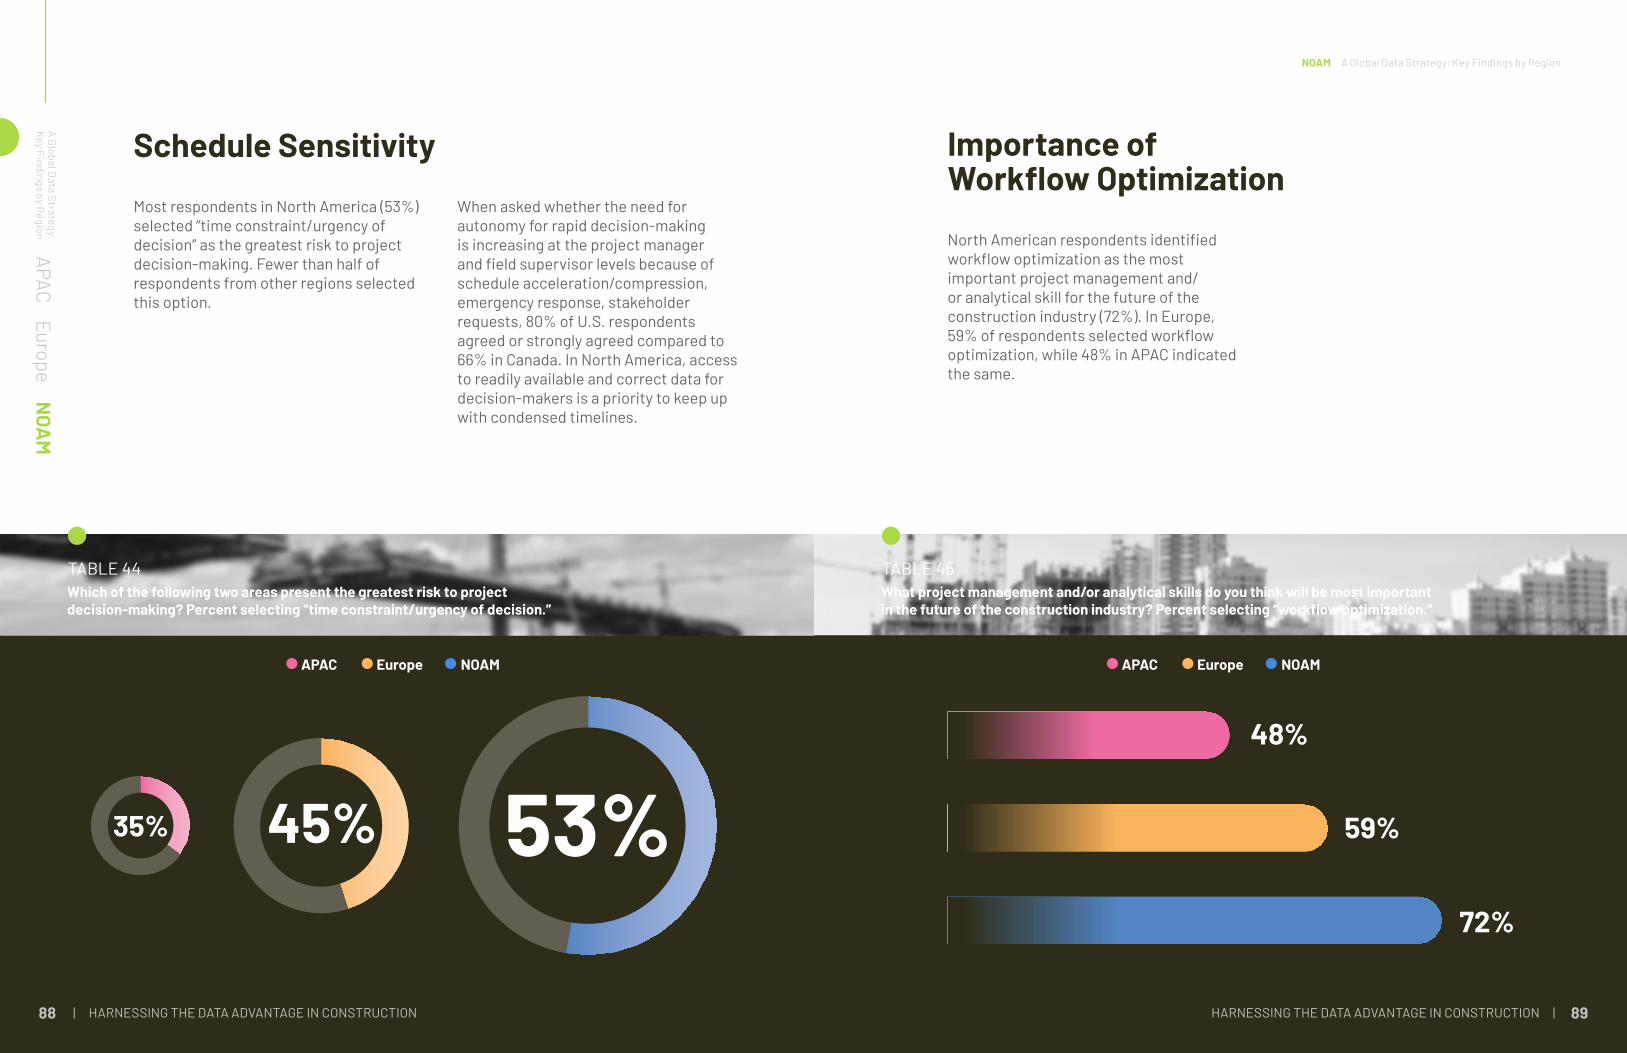
Schedule SensitivityMost respondents in North America (53%) selected “time constraint/urgency of decision” as the greatest risk to project decision-making. Fewer than half of respondents from other regions selected this option.
When asked whether the need for autonomy for rapid decision-making is increasing at the project manager and field supervisor levels because of schedule acceleration/compression, emergency response, stakeholder requests, 80% of U.S. respondents agreed or strongly agreed compared to 66% in Canada. In North America, access to readily available and correct data for decision-makers is a priority to keep up with condensed timelines.
APACEurope
NOA
MA Global D
ata Strategy: Key Findings by Region
TABLE 44Which of the following two areas present the greatest risk to project decision-making? Percent selecting “time constraint/urgency of decision.”
53%45%35%
APAC NOAMEurope
Importance of Workflow OptimizationNorth American respondents identified workflow optimization as the most important project management and/or analytical skill for the future of the construction industry (72%). In Europe, 59% of respondents selected workflow optimization, while 48% in APAC indicated the same.
NOAM A Global Data Strategy: Key Findings by Region
TABLE 45What project management and/or analytical skills do you think will be most important in the future of the construction industry? Percent selecting “workflow optimization.”
48%
59%
72%
APAC NOAMEurope
| HARNESSING THE DATA ADVANTAGE IN CONSTRUCTION HARNESSING THE DATA ADVANTAGE IN CONSTRUCTION | 90 91
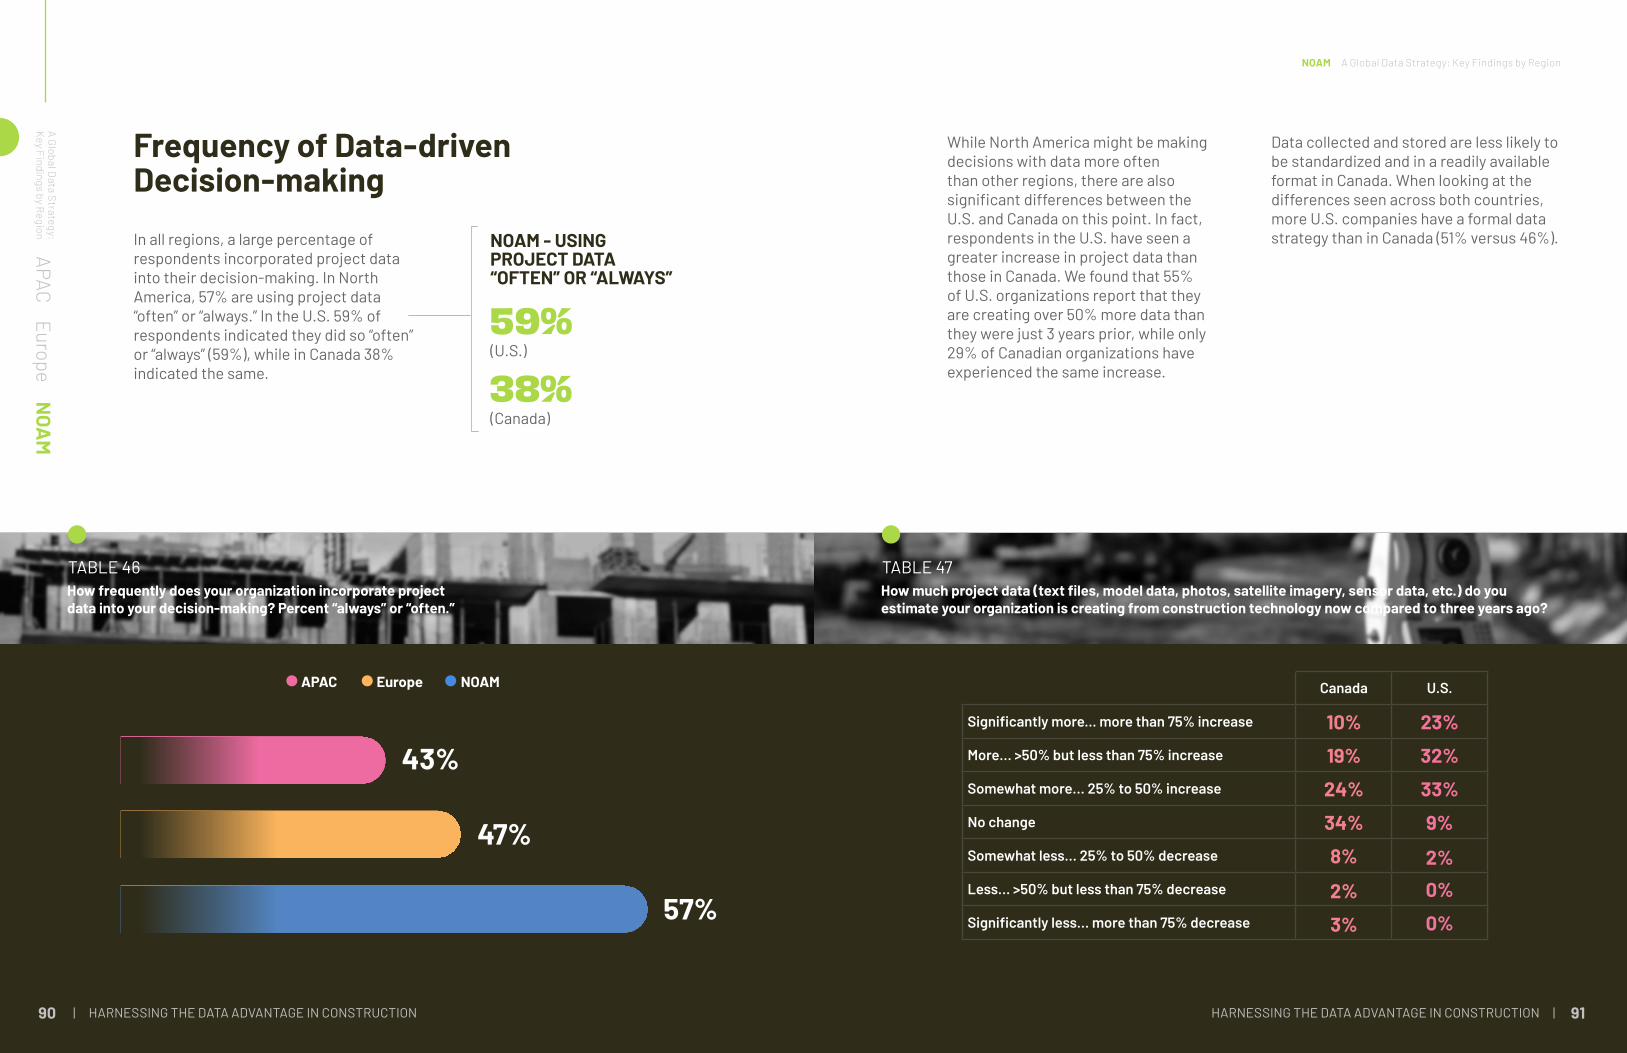
Frequency of Data-driven Decision-makingIn all regions, a large percentage of respondents incorporated project data into their decision-making. In North America, 57% are using project data “often” or “always.” In the U.S. 59% of respondents indicated they did so “often” or “always” (59%), while in Canada 38% indicated the same.
APACEurope
NOA
MA Global D
ata Strategy: Key Findings by Region
TABLE 46How frequently does your organization incorporate project data into your decision-making? Percent “always” or “often.”
43%
47%
57%
APAC NOAMEurope
NOAM - USINGPROJECT DATA“OFTEN” OR “ALWAYS”
59%
38%(U.S.)
(Canada)
While North America might be making decisions with data more often than other regions, there are also significant differences between the U.S. and Canada on this point. In fact, respondents in the U.S. have seen a greater increase in project data than those in Canada. We found that 55% of U.S. organizations report that they are creating over 50% more data than they were just 3 years prior, while only 29% of Canadian organizations have experienced the same increase.
Data collected and stored are less likely to be standardized and in a readily available format in Canada. When looking at the differences seen across both countries, more U.S. companies have a formal data strategy than in Canada (51% versus 46%).
TABLE 47How much project data (text files, model data, photos, satellite imagery, sensor data, etc.) do you estimate your organization is creating from construction technology now compared to three years ago?
Canada U.S.
Significantly more... more than 75% increase 10% 23%More… >50% but less than 75% increase 19% 32%Somewhat more… 25% to 50% increase 24% 33%No change 34% 9%Somewhat less… 25% to 50% decrease 8% 2%Less… >50% but less than 75% decrease 2% 0%Significantly less… more than 75% decrease 3% 0%
NOAM A Global Data Strategy: Key Findings by Region
HARNESSING THE DATA ADVANTAGE IN CONSTRUCTION | 92 93
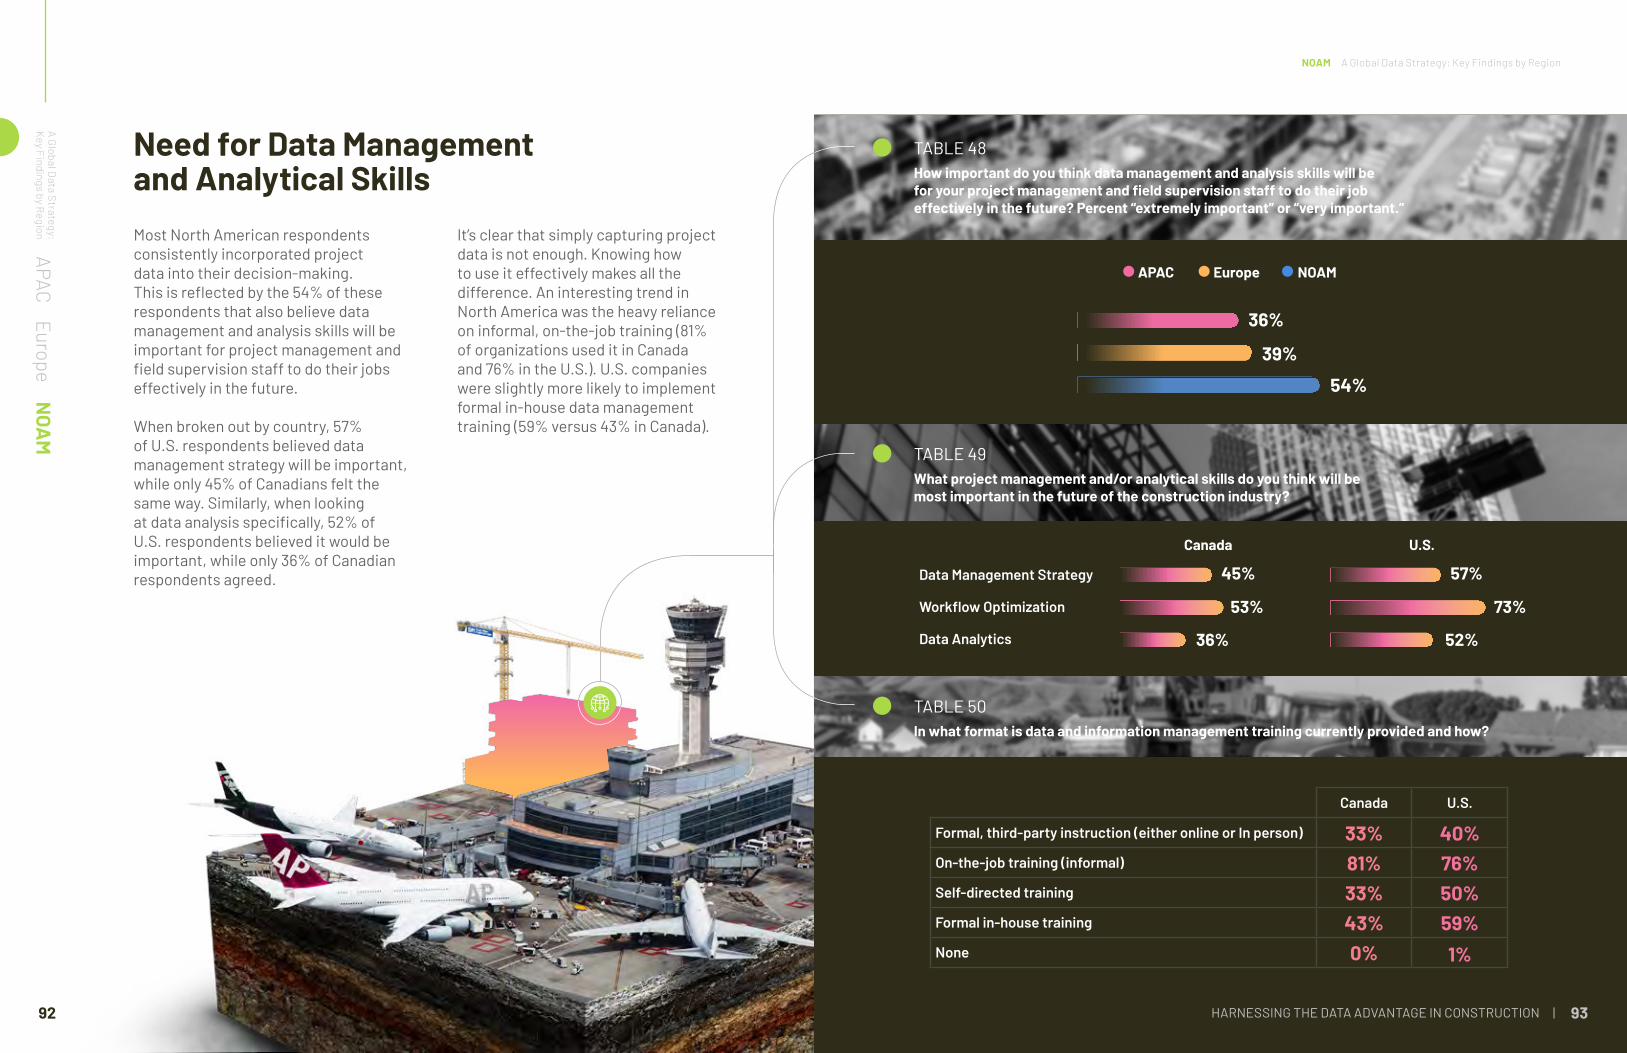
Need for Data Management and Analytical SkillsMost North American respondents consistently incorporated project data into their decision-making. This is reflected by the 54% of these respondents that also believe data management and analysis skills will be important for project management and field supervision staff to do their jobs effectively in the future.
When broken out by country, 57% of U.S. respondents believed data management strategy will be important, while only 45% of Canadians felt the same way. Similarly, when looking at data analysis specifically, 52% of U.S. respondents believed it would be important, while only 36% of Canadian respondents agreed.
APACEurope
NOA
MA Global D
ata Strategy: Key Findings by Region It’s clear that simply capturing project
data is not enough. Knowing how to use it effectively makes all the difference. An interesting trend in North America was the heavy reliance on informal, on-the-job training (81% of organizations used it in Canada and 76% in the U.S.). U.S. companies were slightly more likely to implement formal in-house data management training (59% versus 43% in Canada).
TABLE 48
TABLE 49
TABLE 50
How important do you think data management and analysis skills will be for your project management and field supervision staff to do their job effectively in the future? Percent “extremely important” or “very important.”
What project management and/or analytical skills do you think will be most important in the future of the construction industry?
In what format is data and information management training currently provided and how?
NOAM A Global Data Strategy: Key Findings by Region
Data Management Strategy
Workflow Optimization
Data Analytics
Canada U.S.
APAC NOAMEurope
Canada U.S.
Formal, third-party instruction (either online or In person) 33% 40%On-the-job training (informal) 81% 76%Self-directed training 33% 50%Formal in-house training 43% 59%None 0% 1%
36%
39%
54%
45% 57%
53% 73%
36% 52%

| HARNESSING THE DATA ADVANTAGE IN CONSTRUCTION HARNESSING THE DATA ADVANTAGE IN CONSTRUCTION | 94 95
APACEurope
NOA
MA Global D
ata Strategy: Key Findings by Region
Data Literacy Required to Keep Up with Competition
CASE STUDY
A North American contractor expressed concern about the increasing volume of data and corresponding lack of data literacy. She believes this is something AEC industry stakeholders must aggressively invest in their staff to remain competitive.
“A recent Accenture study reported that only 21% of employees have the data literacy skills to use data in a meaningful way.8 I agree with this and believe raising the bar on data literacy will be an important aspect of staff development in the future,” she said.
When her organization began to develop its data strategy, data literacy was a key feature. For this reason, she stressed the importance of presenting data in a meaningful and useful manner. “The challenge we experienced was not just bad data, but a lack of consumable data. We are a visual industry. Poorly presented data is difficult to interpret. This must be addressed to improve decision-making.”
Data literacy is important because of accelerated project schedules and the speed with which field supervision staff must make critical decisions. In the past, there was more time to discuss problems and solutions with multiple stakeholders before deciding on the best course of action. “Now it seems they are making key decisions that could impact the schedule without a lot of input from others. That’s where having good project data comes into play. It’s the best thing to avoid a bad decision,” she said.
One lesson learned during the development of her organization’s data strategy was the importance of good governance to make data consumable. Standards related to collecting, formatting, and processing data were necessary.
She advises contractors that have not implemented a data plan or strategy to do so now. “Many contractors are going to be caught well behind the competition when they realize the industry has shifted to a more data-driven environment.”
“Now it seems they are making key decisions that could impact the schedule without a lot of input from others. That’s where having good project data comes into play. It’s the best thing to avoid a bad decision.”Chief Data and Innovation OfficerExecutive Vice PresidentGeneral Contractor, North America
NOAM A Global Data Strategy: Key Findings by Region
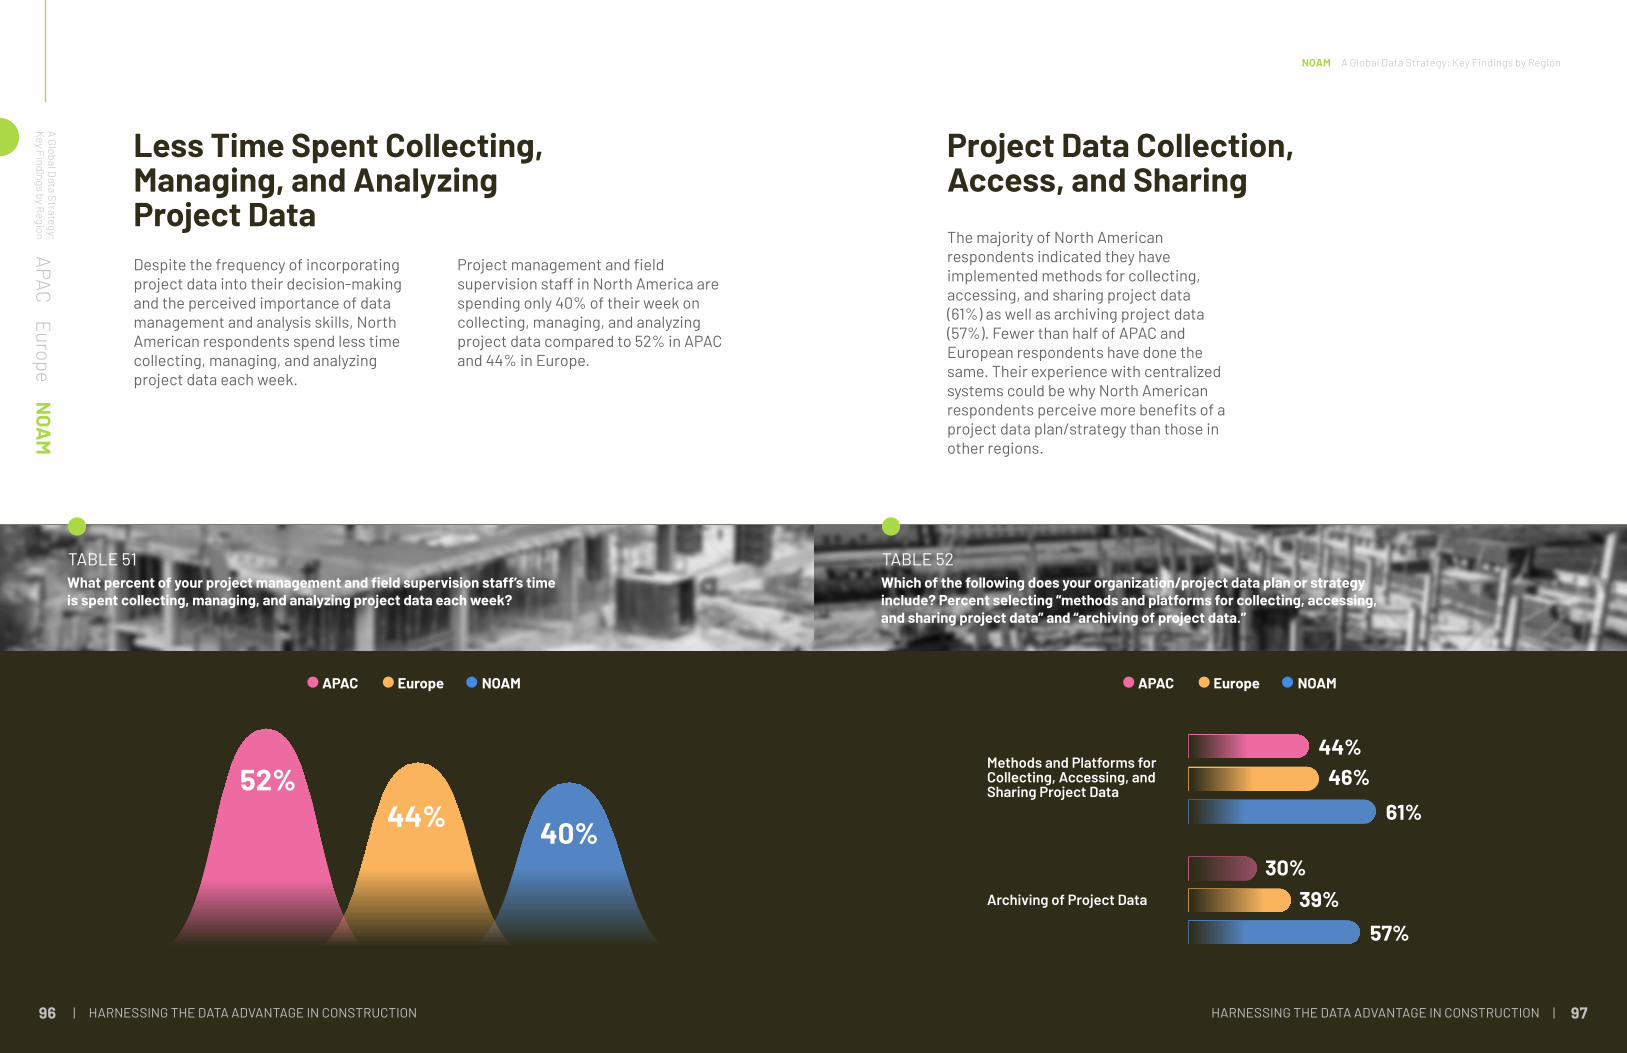
| HARNESSING THE DATA ADVANTAGE IN CONSTRUCTION HARNESSING THE DATA ADVANTAGE IN CONSTRUCTION | 96 97
Less Time Spent Collecting, Managing, and Analyzing Project DataDespite the frequency of incorporating project data into their decision-making and the perceived importance of data management and analysis skills, North American respondents spend less time collecting, managing, and analyzing project data each week.
APACEurope
NOA
MA Global D
ata Strategy: Key Findings by Region
TABLE 51What percent of your project management and field supervision staff’s time is spent collecting, managing, and analyzing project data each week?
Project management and field supervision staff in North America are spending only 40% of their week on collecting, managing, and analyzing project data compared to 52% in APAC and 44% in Europe.
52%44% 40%
APAC NOAMEurope
Project Data Collection, Access, and SharingThe majority of North American respondents indicated they have implemented methods for collecting, accessing, and sharing project data (61%) as well as archiving project data (57%). Fewer than half of APAC and European respondents have done the same. Their experience with centralized systems could be why North American respondents perceive more benefits of a project data plan/strategy than those in other regions.
TABLE 52Which of the following does your organization/project data plan or strategy include? Percent selecting “methods and platforms for collecting, accessing, and sharing project data” and “archiving of project data.”
NOAM A Global Data Strategy: Key Findings by Region
Methods and Platforms for Collecting, Accessing, and Sharing Project Data
Archiving of Project Data
44%46%
61%
57%39%
30%
APAC NOAMEurope

98 99
The U.S. and Canada differ dramatically in terms of their adoption of a formal data management strategy or plan. While 63% of U.S. organizations have methods for collecting, accessing, and sharing project data, only 32% of Canadian organizations say the same. Additionally, 57% of U.S. companies have standards in place for project data formatting and processing, while only 38% of Canadian companies had similar standards.
APACEurope
NOA
MA Global D
ata Strategy: Key Findings by Region
HAVE METHODS FOR COLLECTING, ACCESSING, AND SHARING PROJECT DATA
HAVE STANDARDS IN PLACE FOR PROJECT DATA FORMATTING AND PROCESSING
63%
57%
32%
38%
U.S.
U.S.
Canada
Canada
“Without a limited number of solutions, you will never achieve enterprise-based analytics. At a minimum, a single solution is required to get your project management data—RFIs, daily journals, change orders—to roll up. Taking it one step further to combine accounting/financial data with project management data gives real business intelligence.”
Chief Information OfficerGeneral Contractor, North America
NOAM A Global Data Strategy: Key Findings by Region

| HARNESSING THE DATA ADVANTAGE IN CONSTRUCTION HARNESSING THE DATA ADVANTAGE IN CONSTRUCTION | 100 101
Fewer Processes for Identifying and Repairing Bad DataVery few North American respondents (19%) have implemented processes for identifying bad data and repairing it, compared to 40% of APAC respondents and 27% of European respondents. Similarly, North Americans are less likely to have created a formal position to oversee their data (18%) to ensure decision-makers have access to actionable, high-quality data. In Europe, 26% of respondents created a position, while in APAC 34% of respondents had—nearly double that of North America.
Within the region, Canadian respondents were more likely to believe that duplicate data was the primary cause of bad data than U.S. respondents (22% versus 8%). However, U.S. respondents were more likely to point to missing data as the primary cause (32% in the U.S. versus 22% of Canadians). Both countries reported a low percentage of organizations keeping their data in a common data environment, with the U.S. at 37% and Canada at 27%.
TABLE 53What efforts or investments has your organization made to ensure decision-makers have access to actionable, high quality data/information/insights? Percent selecting “implemented processes for identifying bad data and repairing it” and “created a formal position to oversee our data.”
APAC NOAMEurope
Implemented Processes for Identifying Bad Data and Repairing It
Created a Formal Position to Oversee Our Data
40%27%
19%
18%26%
34%
APACEurope
NOA
MA Global D
ata Strategy: Key Findings by Region
NOAM A Global Data Strategy: Key Findings by Region
Understanding Applicability and BenefitsFor North American respondents that have not implemented a formal project data strategy, the most common explanation is a lack of perceived applicability/benefit (45%). Interestingly, a lack of leadership/organizational support was selected in only 24% of organizations.
TABLE 54Why hasn’t your organization implemented a formal project data plan/strategy? Percent selecting “lack of applicability/benefit” and “no leadership/organizational support.”
APAC NOAMEurope
Lack of Applicability/ Benefit
No Leadership/ Organizational Support
45%41%
33%
32%32%
24%
102 103
THE FOUR STEPS OF A SUCCESSFUL DATA STRATEGYInterviewees and survey respondents alike shared feeling overwhelmed by the volume of project data their organizations collect. Not surprisingly, many are also uncertain on how they would begin an initiative to leverage their data more effectively. To make implementing a data strategy easier, we’ve documented a four-step process on how to get started.
Conclusion
CONCLUSION
Decide where the organization could benefit most from data-driven insights. To maximize return on investment (ROI) and to encourage organizational buy-in, your first attempt at data process improvement must have clear value. For example, several industry leaders we interviewed began with quality assurance and safety, two areas where data was readily available. Having a single point of focus directs the efforts of individuals and can accelerate the impact of the improvements.
To apply learnings to future areas, it’s also important to consider what must be done to ensure data is structured and captured in a central location. Digitizing other high-impact processes such as RFIs or design reviews will ensure that your data is captured in a consistent way. This consistency will create data that is actionable as you move to the next area that needs improvement.
Select a Single Point of Focus
Conclusion
1
Before selecting your initial point of focus, clearly articulate your organization’s aspirations with data. Answer the following questions to understand your “why”:
• What do you want to do better?
• What would look different if you were able to leverage your project data and generate insights?
• Who could you consult to ask for advice when beginning this process?
• What tools already exist to help accelerate your data strategy implementation?
EXPERT ADVICE
CLEAR VALUE TO DATA PROCESS IMPROVEMENT
MAXIMIZE ROI
BUY-IN
104 105
Implementing data-driven insights into project decision-making was described by many as a cultural shift within their organizations. Achieving buy-in and including your project team in the decision-making ensures they will not be biased against the proposed changes.
Organizations that have successfully achieved buy-in for their data strategies share how you can do the same:
• Buy-in from all potential users is a requirement because the success or failure of a plan relies on the adoption by and execution of the frontline staff. Gather feedback from end-users, and constantly demonstrate the benefits of the plan to each person’s daily tasks.
• Buy-in can be accelerated when you explain to people how their own actions impact a colleague. Communicating the purpose of the plan and how all actions, roles, and responsibilities are connected is key.
• Reinforce the positive outcomes from your improvements in data management with training and sharing your stories of success.
Buy-in requires continual reinforcement and open discussion. Formal training can help and is a common part of a successful data strategy implementation. Learnings are then reinforced through additional on-the-job training. Organizations need to share how data-driven insights have improved project decision-making and project outcomes to continually ensure buy-in.
Get Buy-in to Reduce Hesitancy
Conclusion
2
EXPERT ADVICE
FORMAL TRAININGA COMMON PARTOF A SUCCESSFULDATA STRATEGY IMPLEMENTATION
Survey respondents stated that more than one-third of their organizations’ data is bad (i.e., inaccurate, incomplete, inconsistent). They also reported feeling overwhelmed with the volume of data being collected and at a loss for where to start. Only 36% of all respondents had implemented a process for identifying bad data and repairing it. Several industry leaders stated that it took up to two years to completely “clean” their own data.
To increase the likelihood of company-wide adoption, your data standards and data strategies should include:
• Resources (e.g., money, people, and tools).
• Metrics to track performance throughout implementation.
• A champion empowered to lead the way.
To prevent this time-consuming undertaking to clean your data, organizations need to be standardizing how data is captured.9 When implementing or improving data processes, it’s critical to examine how the data will be leveraged to ensure it will create accurate, actionable insights.
Standardize Your Data Capture Across All Projects
Conclusion
3
EXPERT ADVICE
IMPLEMENTED A PROCESS FOR IDENTIFYING BAD DATA AND REPAIRING IT
ONLY
36%

HARNESSING THE DATA ADVANTAGE IN CONSTRUCTION | 106 107
Interviewees stressed the importance of a common data environment and a preference for a single solution, or complementary technology solutions with robust integration capabilities to facilitate the flow of project data. Adopting a common data environment facilitates collaboration between project team members and helps avoid creating more bad data.
Industry leaders shared three best practices on data quality to give you a head start on your strategy:
• Ensure the data collected are accurate and in a standard format.
• Choose a single, open technology solution that supports integration.
• Be prepared to pivot as you implement your plan.
Keep Project Data in a Common Environment
Conclusion
4
EXPERT ADVICE
IMPROVE COLLABORATION BETWEEN PROJECT MEMBERS
AVOID CREATING MORE BAD DATA SILOS
COMMON DATAENVIRONMENTS
Conclusion
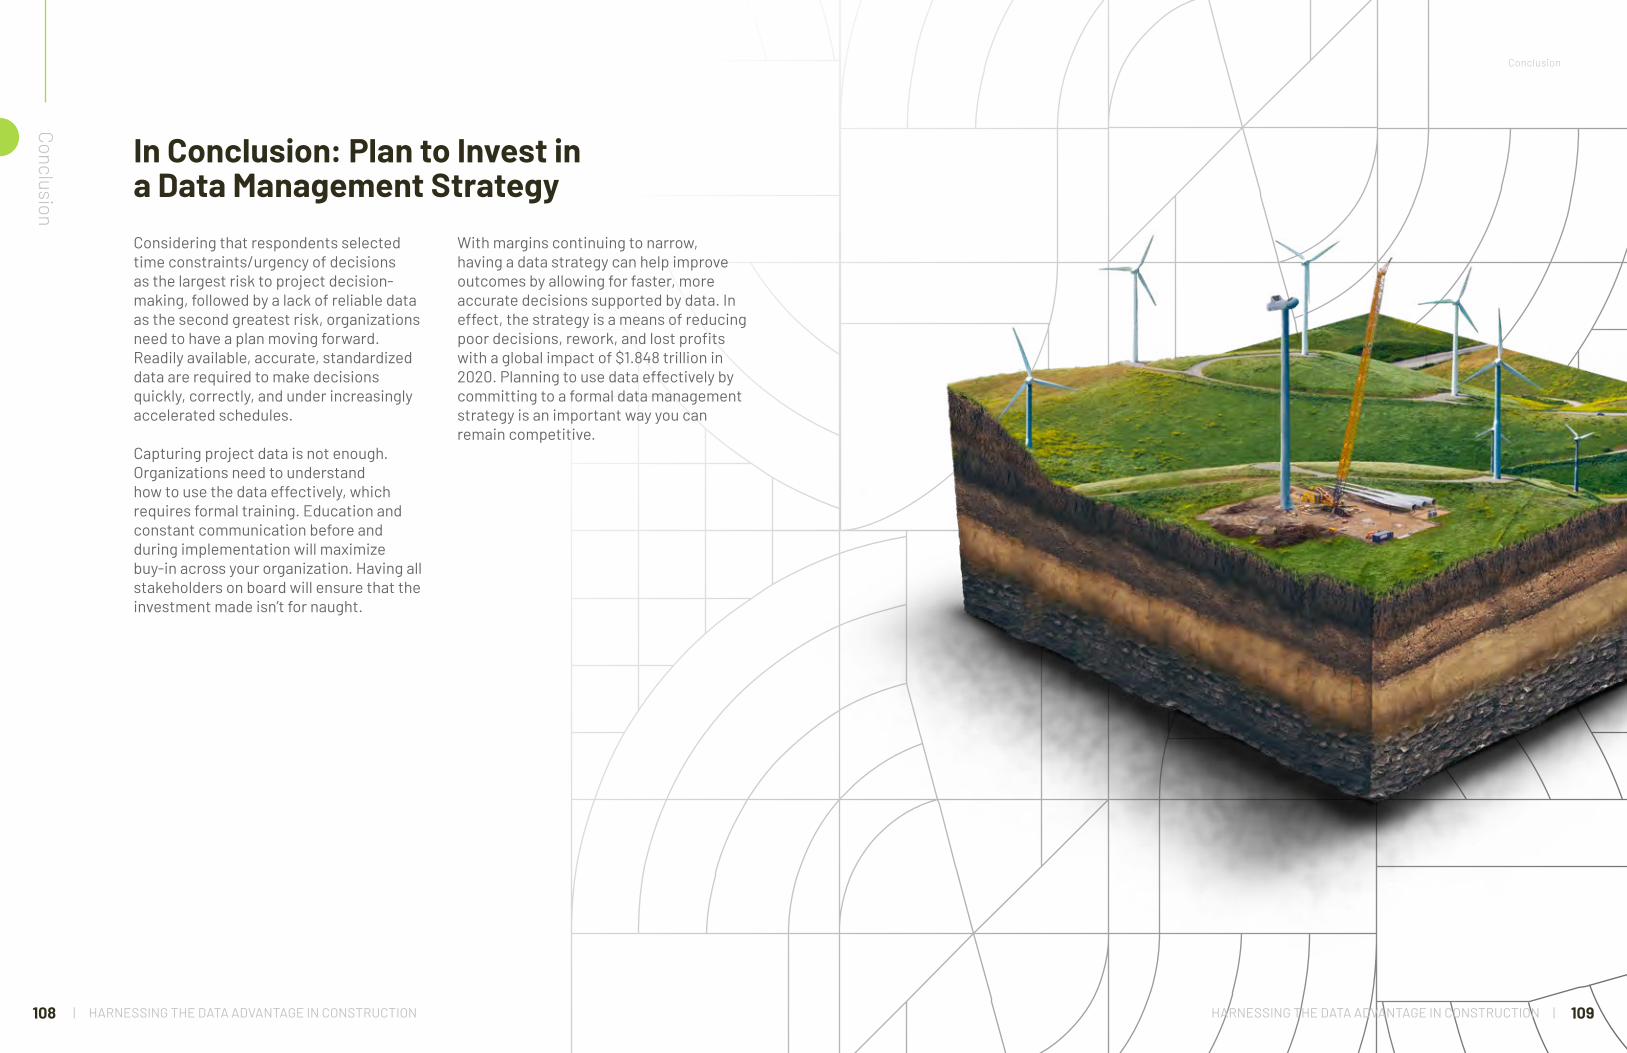
| HARNESSING THE DATA ADVANTAGE IN CONSTRUCTION HARNESSING THE DATA ADVANTAGE IN CONSTRUCTION | 108 109
Considering that respondents selected time constraints/urgency of decisions as the largest risk to project decision-making, followed by a lack of reliable data as the second greatest risk, organizations need to have a plan moving forward. Readily available, accurate, standardized data are required to make decisions quickly, correctly, and under increasingly accelerated schedules.
Capturing project data is not enough. Organizations need to understand how to use the data effectively, which requires formal training. Education and constant communication before and during implementation will maximize buy-in across your organization. Having all stakeholders on board will ensure that the investment made isn’t for naught.
In Conclusion: Plan to Invest in a Data Management Strategy
With margins continuing to narrow, having a data strategy can help improve outcomes by allowing for faster, more accurate decisions supported by data. In effect, the strategy is a means of reducing poor decisions, rework, and lost profits with a global impact of $1.848 trillion in 2020. Planning to use data effectively by committing to a formal data management strategy is an important way you can remain competitive.
Conclusion
Conclusion
| HARNESSING THE DATA ADVANTAGE IN CONSTRUCTION HARNESSING THE DATA ADVANTAGE IN CONSTRUCTION | 110 111
REFERENCES
References 1. Report: Global construction waste will almost double by 2025, Slowey www.constructiondive.com
2. The construction productivity imperative, Changali et al. www.mckinsey.com
3. Bad Data Costs the U.S. $3 Trillion Per Year hbr.org
4. Global construction growth to outpace GDP this decade - PwC, Roumeliotis & Correspondent www.reuters.com
5. Construction Disconnected: The High Cost of Poor Data and Miscommunication [Report], Schott et al. blog.plangrid.com
6. The impact of rework on construction & some practical remedies, Dougherty and Hughes www.cmaanet.org
7. Decision making in the age of urgency www.mckinsey.com
8. The Human Impact of Data Literacy [Report], Accenture www.accenture.com
9. Data Standards & Processes in Construction Report construction.autodesk.com
AUTHORS
DESIGNERS
Eric Thomas Manager, Construction Thought LeadershipAutodesk
Jay Bowman Managing Director of Research & AnalyticsFMI
Lynn-Kai Chao Senior Graphic DesignerAutodesk
Daniel Millan Senior Brand DesignerAutodesk
Alexandra Price Graphic DesignerAutodesk