hart-scott-rodino annual report - federal trade commission · hart-scott-rodino annual report ......
TRANSCRIPT

hart-scott-rodino annual reportFiscal Year 2014
Section 7A of the Clayton ActHart-Scott-Rodino Antitrust Improvements Act of 1976
(Thirty-Seventh Annual Report)
Edith RamirezChairwoman
Federal Trade Commission
William J. BaerAssistant Attorney General
Antitrust Division
FEDERAL TRADE COMMISSIONBUREAU OF COMPETITION
DEPARTMENT OF JUSTICEANTITRUST DIVISION
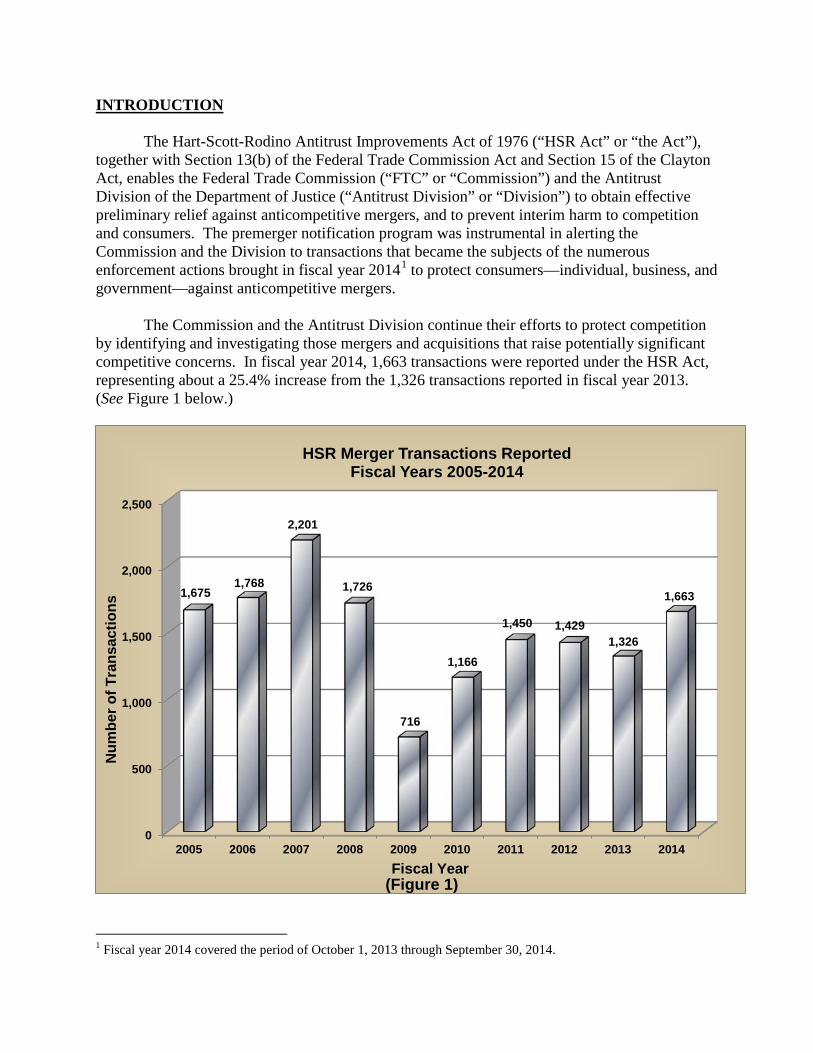
INTRODUCTION The Hart-Scott-Rodino Antitrust Improvements Act of 1976 (“HSR Act” or “the Act”), together with Section 13(b) of the Federal Trade Commission Act and Section 15 of the Clayton Act, enables the Federal Trade Commission (“FTC” or “Commission”) and the Antitrust Division of the Department of Justice (“Antitrust Division” or “Division”) to obtain effective preliminary relief against anticompetitive mergers, and to prevent interim harm to competition and consumers. The premerger notification program was instrumental in alerting the Commission and the Division to transactions that became the subjects of the numerous enforcement actions brought in fiscal year 20141 to protect consumers—individual, business, and government—against anticompetitive mergers. The Commission and the Antitrust Division continue their efforts to protect competition by identifying and investigating those mergers and acquisitions that raise potentially significant competitive concerns. In fiscal year 2014, 1,663 transactions were reported under the HSR Act, representing about a 25.4% increase from the 1,326 transactions reported in fiscal year 2013. (See Figure 1 below.)
1 Fiscal year 2014 covered the period of October 1, 2013 through September 30, 2014.
0
500
1,000
1,500
2,000
2,500
2005 2006 2007 2008 2009 2010 2011 2012 2013 2014
1,675 1,768
2,201
1,726
716
1,166
1,450 1,429 1,326
1,663
Num
ber o
f Tra
nsac
tions
Fiscal Year
HSR Merger Transactions Reported Fiscal Years 2005-2014
(Figure 1)

2
During fiscal year 2014, the Commission brought seventeen merger enforcement challenges,2 including thirteen in which it accepted consent orders for public comment, all of which resulted in final orders; three in which the transactions were abandoned or restructured as a result of antitrust concerns raised during the investigation; and one in which the Commission initiated administrative litigation. In the administrative matter, the Commission voted to authorize staff to seek a preliminary injunction, but the parties abandoned their plans and the administrative complaint was withdrawn. These enforcement actions preserved competition in numerous sectors of the economy, including consumer goods and services, pharmaceuticals, hospitals, high tech and industrial goods, and energy. In April 2015, the Commission successfully concluded its challenge of St. Luke’s Health System’s acquisition of Saltzer Medical Group, which combined Idaho’s largest health system and its largest independent, multi-specialty physician practice group. The Commission, together with the Idaho Attorney General, initiated an action in federal district court challenging the transaction. The four-week bench trial concluded in October 2013. In January of 2014, the U.S. District Court for the District of Idaho found that the acquisition violated Section 7 of the Clayton Act and the Idaho Competition Act, and permanently enjoined the consummated acquisition and ordered St. Luke’s to fully divest itself of Saltzer’s physicians and assets. St. Luke’s appealed the decision to the U.S. Court of Appeals for the Ninth Circuit, which affirmed the decision in February 2015, and denied a petition for rehearing en banc in April 2015. In another health care matter, in April 2014, the Sixth Circuit, in the first favorable appellate ruling in a hospital merger enforcement action in nearly three decades, upheld the Commission’s order in ProMedica Health System v. FTC, finding that ProMedica’s acquisition of rival St. Luke’s Hospital violated the antitrust laws and would likely lead to higher prices for patients living in the Toledo, Ohio area. The Supreme Court denied certiorari in May 2015. In April 2014, the FTC also concluded its 2013 challenge to Ardagh Group SA’s proposed acquisition of Saint-Gobain Containers, Inc. The $1.7 billion merger would have allegedly concentrated most of the $5 billion U.S. glass container industry in two companies – the newly combined Ardagh/Saint-Gobain, and Owens-Illinois, Inc. These two companies would have controlled about 85 percent of the glass container market for brewers and 77 percent of the market for distillers, reducing competition and likely leading to higher prices for customers that purchase beer or spirits glass containers. The FTC filed suit in July 2013 to stop the proposed transaction. While the challenge was pending, Ardagh agreed to sell six of its nine glass container manufacturing plants in the United States to a Commission-approved buyer.
During fiscal year 2014, the Antitrust Division challenged sixteen merger transactions. In seven, the Antitrust Division filed a complaint in U.S. district court. In each of these court challenges, the Division filed settlement papers simultaneously with the complaint. One of the Division’s notable challenges was the suit brought to block the formation of a joint venture that would have combined the flour milling assets of ConAgra Mills and Horizon Milling, a joint venture between Cargill and CHS. The proposed joint venture would have created the largest flour milling company in North America, and resulted in higher prices in the sale of hard and soft 2 To avoid double-counting, this Report includes only those merger enforcement actions in which the Commission or the Antitrust Division took its first public action during fiscal year 2014.
3
wheat flour in four major regions of the U.S. The settlement, which was entered by the court on October 2, 2014, requires the parties to divest four competitively significant flour mills to a named acquirer, Miller Milling Company, in order to create an independent competitor in each of the four relevant regions affected by the proposed joint venture.
The Division also preserved competition and prevented increased prices for broadcast television spot advertising in two local markets. First, the Division required Gannett Co., Inc., Belo Corp., and Sander Media LLC to divest their interests in KMOV-TV, a CBS affiliate in St. Louis, in order to proceed with Gannett’s acquisition of Belo, and Sander’s related acquisition of six Belo television stations. The required divestiture prevented Gannett from gaining a dominant position in the broadcast television spot advertising market in the St. Louis Area and from likely increasing prices to advertisers. On November 18, 2014, the final judgment was entered by the Court. In addition, the Division, along with the Pennsylvania Office of Attorney General, challenged the proposed acquisition of Perpetual Corp. by Sinclair Broadcast Group. The proposed acquisition would have resulted in Sinclair owning or controlling three of the six broadcast stations selling advertising in central Pennsylvania. The proposed settlement, filed simultaneously with the complaint, requires the parties to divest all assets primarily used in the operation of WHTM-TV, an ABC affiliate in central Pennsylvania, preserving competition in the market for television spot advertising. On November 25, 2014, the final judgment was entered by the Court.
In fiscal year 2014, the Division also successfully concluded its challenges to US Airways Group Inc.’s acquisition of AMR Corporation (the parent company of American Airlines) and Bazaarvoice, Inc.’s proposed acquisition of PowerReviews, Inc. On April 25, 2014, the court in US Airways entered a final decree requiring US Airways and AMR Corporation to divest slots and gates in key constrained airports across the United States. These divestitures were the largest ever in an airline merger and have allowed low-cost carriers to expand service and enhance competition throughout the country. In Bazaarvoice, on December 2, 2014, the court entered the final decree that required Bazaarvoice to divest all of the PowerReviews assets and adhere to other requirements to fully restore competition in the provision of online ratings and reviews platforms.
In fiscal year 2014, the Commission’s Premerger Notification Office (“PNO”) continued to respond to thousands of telephone calls seeking information about the reportability of transactions under the HSR Act, and the details involved in completing and filing the Notification and Report Form (the filing form). The Commission continued to provide information necessary for the notification process on its HSR website,3 which serves as HSR practitioners’ primary source of information on the HSR form, instructions and tips for completion, the premerger notification statute and rules, current filing thresholds, notices of grants of early termination, filing fee instructions, and procedures for submitting post-consummation filings. The website also provides training materials for new practitioners, information on scheduled HSR events, frequently asked questions regarding HSR filing requirements, and contact information for PNO staff. The website also includes a catalogue of informal interpretation letters, giving the public ready access to PNO staff interpretations of the premerger notification rules and the Act. New this year, the PNO staff provides tips for avoiding
3 See https://www.ftc.gov/enforcement/premerger-notification-program.
4
common filing mistakes in blog posts on the Commission’s Competition Matters blog. As always, PNO staff is available to help HSR practitioners comply with HSR notification requirements. BACKGROUND OF THE HSR ACT Section 201 of the Hart-Scott-Rodino Antitrust Improvements Act of 1976, Pub. L. No. 94-435 (“HSR Act” or “the Act”), amended the Clayton Act by adding a new Section 7A, 15 U.S.C. § 18a. In general, the HSR Act requires that certain proposed acquisitions of voting securities or assets be reported to the Commission and the Antitrust Division prior to consummation. The parties must then wait a specified period, usually 30 days (or 15 days in the case of a cash tender offer or bankruptcy sale), before they may complete the transaction. Whether a particular acquisition is subject to these requirements depends on the value of the acquisition and, in certain acquisitions, the size of the parties as measured by their sales and assets. Acquisitions valued below a certain threshold, acquisitions involving parties with assets and sales below a certain threshold, and certain classes of acquisitions that are less likely to raise antitrust concerns are excluded from the Act’s coverage. The primary purpose of the statutory scheme, as the legislative history makes clear, is to provide the antitrust enforcement agencies with the opportunity to review mergers and acquisitions before they occur. The premerger notification program, with its filing and waiting period requirements, provides the agencies with both the time and the information necessary to conduct this antitrust review. Much of the information for a preliminary antitrust evaluation is included in the notification filed with the agencies by the parties to the proposed transactions. If either agency determines during the waiting period that further inquiry is necessary, the agency is authorized by Section 7A(e) of the Clayton Act to issue a request for additional information and documentary material (“Second Request”).4 The Second Request extends the waiting period for a specified period of time (usually 30 days, but 10 days in the case of a cash tender offer or bankruptcy sale) after all parties have complied with the Second Request (or, in the case of a tender offer or bankruptcy sale, after the acquiring person complies). This additional time provides the reviewing agency with the opportunity to analyze the information and to take appropriate action before the transaction is consummated. If the reviewing agency believes that a proposed transaction may substantially lessen competition, it may seek an injunction in federal district court to prohibit consummation of the transaction. The Commission also may challenge the transaction in administrative litigation. The Commission, with the concurrence of the Assistant Attorney General for the Antitrust Division, promulgated final rules implementing the premerger notification program on July 31, 1978. At that time, a comprehensive Statement of Basis and Purpose also was published, containing a section-by-section analysis of the rules and an item-by-item analysis of
4 15 U.S.C. §18a(e)(1)(a) (“The Federal Trade Commission or the Assistant Attorney General may, prior to the expiration of the 30-day waiting period (or in the case of a cash tender offer, the 15-day waiting period)…require the submission of additional information or documentary material relevant to the proposed acquisition”).
5
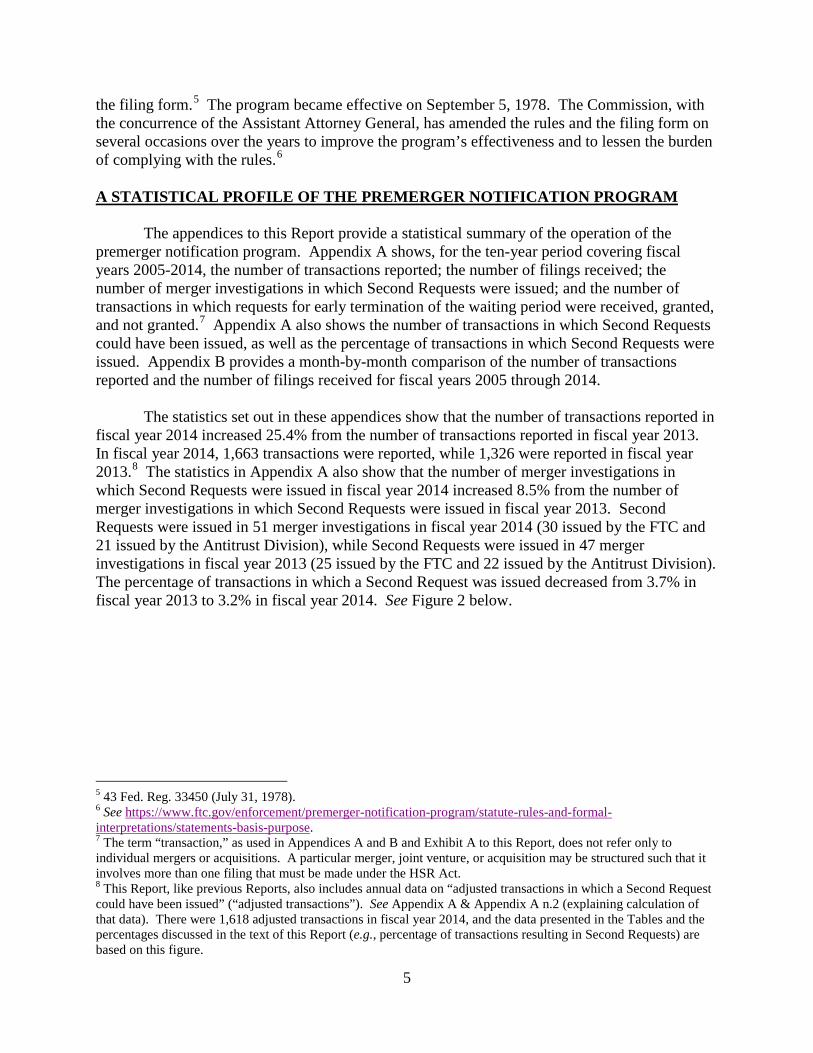
the filing form.5 The program became effective on September 5, 1978. The Commission, with the concurrence of the Assistant Attorney General, has amended the rules and the filing form on several occasions over the years to improve the program’s effectiveness and to lessen the burden of complying with the rules.6 A STATISTICAL PROFILE OF THE PREMERGER NOTIFICATION PROGRAM The appendices to this Report provide a statistical summary of the operation of the premerger notification program. Appendix A shows, for the ten-year period covering fiscal years 2005-2014, the number of transactions reported; the number of filings received; the number of merger investigations in which Second Requests were issued; and the number of transactions in which requests for early termination of the waiting period were received, granted, and not granted.7 Appendix A also shows the number of transactions in which Second Requests could have been issued, as well as the percentage of transactions in which Second Requests were issued. Appendix B provides a month-by-month comparison of the number of transactions reported and the number of filings received for fiscal years 2005 through 2014. The statistics set out in these appendices show that the number of transactions reported in fiscal year 2014 increased 25.4% from the number of transactions reported in fiscal year 2013. In fiscal year 2014, 1,663 transactions were reported, while 1,326 were reported in fiscal year 2013.8 The statistics in Appendix A also show that the number of merger investigations in which Second Requests were issued in fiscal year 2014 increased 8.5% from the number of merger investigations in which Second Requests were issued in fiscal year 2013. Second Requests were issued in 51 merger investigations in fiscal year 2014 (30 issued by the FTC and 21 issued by the Antitrust Division), while Second Requests were issued in 47 merger investigations in fiscal year 2013 (25 issued by the FTC and 22 issued by the Antitrust Division). The percentage of transactions in which a Second Request was issued decreased from 3.7% in fiscal year 2013 to 3.2% in fiscal year 2014. See Figure 2 below.
5 43 Fed. Reg. 33450 (July 31, 1978). 6 See https://www.ftc.gov/enforcement/premerger-notification-program/statute-rules-and-formal- interpretations/statements-basis-purpose. 7 The term “transaction,” as used in Appendices A and B and Exhibit A to this Report, does not refer only to individual mergers or acquisitions. A particular merger, joint venture, or acquisition may be structured such that it involves more than one filing that must be made under the HSR Act. 8 This Report, like previous Reports, also includes annual data on “adjusted transactions in which a Second Request could have been issued” (“adjusted transactions”). See Appendix A & Appendix A n.2 (explaining calculation of that data). There were 1,618 adjusted transactions in fiscal year 2014, and the data presented in the Tables and the percentages discussed in the text of this Report (e.g., percentage of transactions resulting in Second Requests) are based on this figure.

6
The statistics in Appendix A also show that early termination of the waiting period was requested in the majority of transactions. In fiscal year 2014, early termination was requested in 78.7% (1274) of the transactions reported. In fiscal year 2013, early termination was requested in 77% (990) of the transactions reported. The percentage of requests granted out of the total requested decreased from 80.5% in fiscal year 2013 to 80.1% in fiscal year 2014. The tables (Tables I through XI) in Exhibit A contain information regarding the agencies’ enforcement activities for transactions reported in fiscal year 2014. The tables provide, for example, various characteristics of transactions, the number and percentage of transactions in which one antitrust agency granted to the other clearance to commence an investigation, and the number of merger investigations in which either agency issued Second Requests. Table III of Exhibit A shows that in fiscal year 2014, the agencies received clearance to conduct an initial investigation in 16.9% of the total number of transactions reported. The tables also provide the number of transactions based on the dollar value of transactions reported and the reporting threshold indicated in the notification report. In fiscal year 2014, the dollar value of reported transactions was $1.5 trillion.9
9 The information on the value of reported adjusted transactions for fiscal year 2014 is drawn from a database maintained by the Premerger Notification Office.
0.0%
0.5%
1.0%
1.5%
2.0%
2.5%
3.0%
3.5%
4.0%
4.5%
5.0%
2005 2006 2007 2008 2009 2010 2011 2012 2013 2014
3.1%
2.6%
3.0%
2.5%
4.5%
3.7% 3.9%
3.5% 3.7%
3.2%
Perc
ent o
f Tra
nsac
tions
Fiscal year
Percentage of Transactions Resulting in Second Request Fiscal Years 2005-2014
(Figure 2)

7
Tables X and XI provide the number of transactions by industry group in which the acquiring person or the acquired entity derived the most revenue. Figure 3 illustrates the percentage of reportable transactions within industry groups for fiscal year 2014 based on the acquired entity’s operations.10
10 The category designated as “Other” consists of industry segments that include construction, educational services, performing arts, recreation, and other non-classifiable businesses.
Consumer Goods & Services, 30.8%
Other, 16.7%
Banking & Insurance, 8.4%
Manufacturing, 14.9%
Information Technology, 8.7%
Energy & Natural Resources, 7.5%
Health Services, 4.1%
Chemicals & Pharmaceuticals,
6.6% Transportation, 2.3%
Percentage of Transactions By Industry Group of Acquired Entity Fiscal Year 2014
(Figure 3)

8
DEVELOPMENTS WITHIN THE PREMERGER PROGRAM 1. Threshold Adjustments
The 2000 amendments to the HSR Act require the Commission to publish adjustments to the Act’s jurisdictional and filing fee thresholds annually, based on the change in the gross national product, in accordance with Section 8(a)(5) of the Clayton Act for each fiscal year beginning after September 30, 2004. The Commission amended the rules in 2005 to provide a method for future adjustments as required by the 2000 amendments, and to reflect the revised thresholds contained in the rules. The Commission publishes the revised thresholds annually in January, and they become effective 30 days after publication.
On January 23, 2014, the Commission published a notice11 to reflect adjustment of the reporting thresholds as required by the 2000 amendments12 to Section 7A of the Clayton Act, 15 U.S.C. § 18a. The revised thresholds, including an increase in the size of transaction threshold from $70.9 million to $75.9 million, became effective February 24, 2014. 2. Compliance The Commission and the Antitrust Division continued to monitor compliance with the premerger notification program’s filing and waiting period requirements, and initiated a number of compliance investigations in fiscal year 2014. The agencies use several methods to oversee compliance, including monitoring news outlets and industry publications for transactions that may not have been reported in accordance with the HSR Act’s requirements. Industry sources, such as competitors, customers, and suppliers, interested members of the public, and, in certain cases, the parties themselves, also provide the agencies with information about transactions and possible violations of the Act’s requirements. Under Section 7A(g)(1) of the Act, any person that fails to comply with the Act’s notification and waiting period requirements is liable for a civil penalty of up to $16,000 for each day the violation continues.13 The antitrust agencies examine the circumstances of each violation to determine whether to seek penalties.14 During fiscal year 2014, 23 post-consummation “corrective” filings were received, and the agencies brought one enforcement action, resulting in $896,000 in civil penalties.
11 79 Fed. Reg. 3814 (Jan. 23, 2014). 12 15 U.S.C. §18a(a). See Pub. L. No. 106-553, 114 Stat. 2762. 13 Dollar amounts specified in civil monetary penalty provisions within the Commission’s jurisdiction are adjusted for inflation in accordance with the Debt Collection Improvement Act of 1996, Pub. L. No. 104-134 (Apr. 26, 1996). The adjustments have included an increase in the maximum civil penalty from $10,000 to $11,000 for each day during which a person is in violation of Section 7A(g)(1) (61 Fed. Reg. 54548 (Oct. 21, 1996), corrected at 61 Fed. Reg. 55840 (Oct. 29, 1996)) and to $16,000 effective February 10, 2009 (74 Fed. Reg. 857 (Jan. 9, 2009)). 14 If parties inadvertently fail to file, the agencies generally will not seek penalties so long as the parties promptly submit corrective filings after discovering the failure to file, submit an acceptable explanation of their failure to file, and have not previously violated the Act.
9
In United States v. Berkshire Hathaway Inc.,15 the complaint alleged that Berkshire Hathaway Inc. (“Berkshire Hathaway”) changed convertible notes it owned in USG Corporation (“USG”) into 21.4 million voting securities on December 9, 2013. As a result of the conversion, the value of its USG holdings exceeded $283.6 million, the premerger reporting threshold under the HSR Act at the time. The company subsequently made a corrective filing, and acknowledged that the transaction should have been reported under the HSR Act. Just six months prior, Berkshire Hathaway made a corrective filing in connection with a June 2013 acquisition of $41 million of voting securities in Symetra Financial Corporation (“Symetra”), a transaction that resulted in Berkshire Hathaway holding Symetra voting securities valued at more than $283.6 million. The Commission and the Antitrust Division had taken no action against Berkshire Hathaway following its first HSR Act violation. Despite the firm’s assurances that it would implement appropriate HSR monitoring procedures going forward, Berkshire Hathaway did not timely report the USG acquisition described above. Under the terms of the consent decree filed simultaneously with the complaint, Berkshire Hathaway agreed to pay a civil penalty of $896,000 to settle the charges. MERGER ENFORCEMENT ACTIVITY16 1. The Department of Justice
During fiscal year 2014, the Antitrust Division challenged sixteen merger transactions
that would have substantially lessened competition if allowed to proceed as proposed. In seven of these challenges, the Antitrust Division filed a complaint in U.S. district court. In each, the Division filed settlement papers simultaneously with the complaint. Of the nine fiscal year 2014 challenges where the Division did not file a complaint, the parties abandoned the proposed transaction in four instances, and in five other instances the parties restructured the proposed transaction, thus resolving the Division’s concerns.17
In United States v. Gannett Co., Inc., Belo Corp., and Sander Media LLC,18 the Division challenged Gannett Co., Inc.’s (“Gannett”) proposed acquisition of Belo Corp. (“Belo”) and related agreements between Gannett and Sander Holdings Co. LLC, a subsidiary of Sander Media LLC (collectively, “Sander”). As proposed, Sander would have acquired six Belo
15 United States v. Berkshire Hathaway Inc., No. 1:14-cv-01420 (D.D.C.) (final judgment issued Aug. 20, 2014), available at https://www.ftc.gov/enforcement/cases-proceedings/141-0095/berkshire-hathaway-inc. 16 The cases listed in this section were not necessarily reportable under the premerger notification program. Given the confidentiality of information obtained pursuant to the Act, it would be inappropriate to identify the cases initiated under the program except in those instances in which that information has already been disclosed. 17 Sinclair Broadcast Group, Inc.’s acquisition of 18 Television Stations owned by Barrington Broadcasting Group, LLC (television broadcasting); Dean Foods Co.’s proposed acquisition of Oakhurst Dairy (fluid milk and raw milk); Rockwell Collins, Inc.’s proposed acquisition of ARINC Inc. from The Carlyle Group (air-ground communication systems); Cunningham Broadcasting Corp.’s proposed acquisition of WWCP-TV station and WATM-TV’s Licensing Marketing Agreement (television spot advertising and local retransmission rights); Huntington Bancshares Inc.’s proposed acquisition of Camco Financial Corp. (banks); Louisiana-Pacific Corp.’s proposed acquisition of Ainsworth Lumber Co. Ltd. (oriented strand board industry); Umpqua Holdings Corp.’s proposed acquisition of Sterling Financial Corp. (banks); Sprint Corp.’s proposed acquisition of T-Mobile (mobile wireless telecommunications services); and an undisclosed healthcare matter. 18 United States v. Gannett Co., Inc., Belo Corp., and Sander Media LLC, No. 1:13-CV-01984 (D.D.C. filed Dec. 16, 2013).

10
television stations that Gannett could not hold under Federal Communications Commission rules, including KMOV-TV in St. Louis, Missouri. The related agreements included an option for Gannett to assign or acquire the Belo stations sold to Sander, a financing guarantee, and a long-term shared services agreement. The complaint alleged that the proposed transaction would lessen competition in the sale of broadcast television spot advertising in the St. Louis area. As two of the three largest commercial broadcast stations in the St. Louis area, Gannett’s KSDK-TV (NBC affiliate), and Belo’s KMOV-TV (CBS affiliate), are vigorous competitors, and the various agreements between Gannett and Sander (the proposed owner of the Belo station) would have aligned the incentives of the two stations. A proposed consent decree was filed simultaneously with the complaint settling the suit. Under the terms of the decree, the parties must divest their interests in KMOV-TV to an independent purchaser that will not be permitted to have any agreements with Gannett that could limit competition with KSDK-TV. On November 18, 2014, the final judgment was entered by the Court.
In United States v. Heraeus Electro-Nite Co., LLC,19 the Division challenged Heraeus Electro-Nite Co., LLC’s (“Heraeus”) 2012 acquisition of Midwest Instrument Co., Inc. (“Minco”). The complaint alleged that the transaction substantially lessened competition in the U.S. market for the development, production, sale, and service of the single-use sensors and instruments (“S&I”) used to measure and monitor the temperature and chemical composition of molten steel in the steel manufacturing process. Prior to the acquisition, Heraeus and Minco were robust head-to-head competitors. The acquisition of Minco created a near-monopoly in the supply of S&I in the United States and eliminated Minco as an independent and strong competitor, resulting in higher prices, reduced service, and less innovation in supplying S&I. A proposed consent decree was filed simultaneously with the complaint, requiring Heraeus to divest certain assets acquired from Minco to Keystone Sensors, LLC (“Keystone”). Keystone will offer customers an additional alternative to Heraeus. The settlement also requires Heraeus to waive non-compete provisions it had imposed on some former employees, enabling Keystone to hire experienced individuals with expertise in this specialized business. On April 7, 2014, the final judgment was entered by the Court.
In United States v. ConAgra Foods, Inc., Horizon Milling, LLC, Cargill, Inc. and CHS Inc.,20 the Division filed a complaint to block the proposed formation of Ardent Mills, a flour milling joint venture by ConAgra Foods, Inc., Cargill, Inc. (“Cargill”), CHS Inc. (“CHS”), and Horizon Milling, LLC (“Horizon”). The proposed joint venture would have combined the flour milling assets of ConAgra Mills, a subsidiary of ConAgra Foods, Inc. (collectively, “ConAgra”), and Horizon, a joint venture between Cargill and CHS. The complaint alleged that the proposed joint venture would have eliminated head-to-head competition between ConAgra Mills and Horizon, creating the largest flour milling company in North America and resulting in higher prices in the sale of hard and soft wheat flour in four major geographic markets: Northern California, Southern California, Northern Texas, and the upper Mid-West. A proposed consent decree was filed simultaneously with the complaint. The terms of the decree require divestiture of four competitively significant flour mills to Miller Milling Company LLC, creating an independent and viable competitor in each relevant market. Further, the decree prohibits Cargill, CHS, and ConAgra from disclosing to Ardent Mills certain non-public information relating to 19 United States v. Heraeus Electro-Nite Co., LLC, No. 1:14-CV-00005 (D.D.C. filed Dec. 16, 2014). 20 United States v. Conagra Foods, Inc., Horizon Milling, LLC, Cargill, Inc., and CHS Inc., No. 1:14-CV-00823 (D.D.C. filed May 20, 2014).
11
sales to or use by customers to which companies have sold wheat. The Division was assisted in its investigation by the California Attorney General’s Office. On October 2, 2014, the consent decree was entered by the Court.
In United States and State of Texas v. Martin Marietta Materials, Inc. and Texas Industries, Inc.,21 the Division and the state of Texas challenged the proposed acquisition of Texas Industries, Inc. (“Texas Industries”) by Martin Marietta Materials, Inc. (“Martin Marietta”). The complaint alleged that the transaction, as originally proposed, would have created the largest producer of aggregate in the United States, resulting in higher prices for purchasers of aggregate in parts of the Dallas metropolitan area. Aggregate is crushed stone produced at quarries or mines and used in a variety of applications, such as road construction, and for the production of ready-mix concrete and asphalt. Martin Marietta and Texas Industries were two of only three suppliers of Texas Department of Transportation-approved aggregate in Dallas County and parts of the surrounding area. For customers handling Texas Department of Transportation projects, the merger would have resulted in increased prices and less competition. A proposed consent decree was filed simultaneously with the complaint. Under the terms of the proposed consent decree, Martin Marietta must divest its North Troy aggregate quarry in Mill Creek, Oklahoma; its rail yard in Dallas; and its rail yard in Frisco, Texas to ensure the continued benefits of vigorous competition for aggregate customers in the affected geographic market. On September 30, 2014, the consent decree was entered by the Court.
In United States and Commonwealth of Pennsylvania v. Sinclair Broadcast Group, Inc. and Perpetual Corp.,22 the Division and the Pennsylvania Office of Attorney General challenged the proposed acquisition of Perpetual Corp. by Sinclair Broadcast Group, Inc. (“Sinclair”). Perpetual owns WHTM-TV (ABC affiliate), a direct competitor of WHP-TV (CBS affiliate) and WLYH-TV (CW affiliate), two stations owned or operated by Sinclair in central Pennsylvania. As originally structured, the proposed acquisition would have lessened competition in the broadcast television spot advertising market in parts of central Pennsylvania. The proposed acquisition would have resulted in Sinclair owning or controlling the sale of advertising for three of the six broadcast stations selling advertising in the area. The proposed settlement, filed simultaneously with the complaint, requires the parties to divest all assets primarily used in the operation of WHTM-TV to Media General, an independent purchaser approved by the Division. On November 25, 2014, the final judgment was entered by the Court.
In United States v. LM U.S. Corp Acquisition Inc. and Ross Aviation, LLC,23 the Division challenged the proposed acquisition of Ross Aviation (“Ross”) by Landmark Aviation (“Landmark”), the third largest fixed base operator (“FBO”) in the United States. FBOs provide fuel, flight support, and other services (e.g., hangar and office space rentals) to general aviation customers (charter, private, and corporate aircraft operators). As originally structured, the proposed acquisition would have combined the only two FBOs serving general aviation customers at Scottsdale Municipal Airport (“SDL”) in Scottsdale, Arizona, resulting in a
21 United States et al. v. Martin Marietta Materials, Inc. and Texas Industries, Inc., No. 1:14-CV-01079 (D.D.C. filed Jun. 26, 2014). 22 United States et al. v. Sinclair Broadcast Group, Inc. and Perpetual Corp., No. 1:14-CV-01186 (D.D.C. filed Jul. 15, 2014). 23 United States v. LM U.S. Corp Acquisition Inc. and Ross Aviation, LLC, No: 1:14-CV-01291 (D.D.C. filed Jul. 30, 2014).

12
monopoly, higher prices, and lower quality of services. A proposed consent decree was filed simultaneously settling the suit. In order to proceed with the acquisition, Landmark is required to divest Ross’s FBO assets at SDL to Signature Flight Support Corporation or another buyer approved by the Division. On October 30, 2014, the final judgment was entered by the Court.
In United States et al. v. Tyson Foods, Inc. and The Hillshire Brands Co.,24 the Division and the state attorneys general from Illinois, Iowa, and Missouri filed a lawsuit blocking Tyson Foods, Inc.’s (“Tyson”) proposed acquisition of The Hillshire Brands Co. (“Hillshire”). As originally structured, the acquisition would have combined two of the major purchasers of sows—female pigs raised for breeding hogs—from farmers in the United States. At the end of their productive breeding life, sows are sold for slaughter by farmers for processing into pork sausage. Both Tyson (through its Heinold Hog Markets Division) and Hillshire compete directly in the procurement of sows from U.S. farmers. As originally proposed, the transaction would have eliminated the strong head-to-head competition between Tyson and Hillshire, and would have left farmers with fewer outlets for their sows and lower prices for sow purchases from farmers in a critical agricultural market. A proposed consent decree was filed simultaneously settling the suit. The decree requires Tyson to divest Heinold Hog Markets in order to proceed with the acquisition. On November 20, 2014, the final judgment was entered by the Court.
The Antitrust Division also successfully concluded several merger challenges in fiscal year 2014. In United States, et al. v. US Airways Group, Inc. and AMR Corporation,25 the Division and the states of Texas, Arizona, Pennsylvania, Florida, Tennessee, Virginia, and the District of Columbia challenged the proposed $11 billion merger between US Airways Group, Inc. (“US Airways”) and American Airlines’ parent company, AMR Corporation. On April 25, 2014, the court entered the consent decree requiring US Airways and AMR Corporation to divest slots and gates in key constrained airports across the United States. These divestitures, the largest ever in an airline merger, have allowed low cost carriers to fly more direct and connecting flights in competition with legacy carriers and have enhanced system-wide competition in the airline industry. In addition, in United States v. Bazaarvoice, Inc.,26 the Division challenged Bazaarvoice, Inc.’s (“Bazaarvoice”) 2012 acquisition of PowerReviews, Inc. (“PowerReviews”). Prior to the acquisition, Bazaarvoice and PowerReviews were aggressive competitors in the market for online product ratings and reviews platforms. On January 8, 2014, the district court concluded that Bazaarvoice’s acquisition violated the antitrust laws. On December 2, 2014, the court entered the final judgment, requiring Bazaarvoice to divest the assets it acquired from PowerReviews and adhere to other requirements to restore competition. Finally, in United States and State of New York v. Twin America, LLC, et al., the consent decree settling the suit was filed on March 16, 2015 and is awaiting entry by the court.27
2. The Federal Trade Commission During fiscal year 2014, the Commission brought seventeen merger enforcement actions. Those actions included thirteen matters in which the Commission accepted consent orders for 24 United States et al. v. Tyson Foods, Inc., and The Hillshire Brands Co., No. 1:14-CV-01474 (D.D.C. filed Aug. 27, 2014). 25 See the HSR Annual Report, Fiscal Year 2013 for a description of this case. 26 See the HSR Annual Report, Fiscal Year 2013 for a description of this case. 27 See the HSR Annual Report, Fiscal Year 2013 for a description of this case.

13
public comment, all resulting in final orders; three in which the transaction was abandoned as a result of antitrust concerns raised during the investigation; and one in which the Commission authorized an administrative complaint and initiated proceedings to obtain a preliminary injunction in federal district court to enjoin the acquisition pending resolution of the Commission’s administrative litigation. In Jostens/American Achievement Group,28 the Commission issued an administrative complaint and authorized staff to seek a preliminary injunction in federal district court enjoining Jostens, Inc.’s proposed $500 million acquisition of American Achievement Corp. The Commission alleged that the acquisition would have substantially reduced quality and price competition in the high school and college class rings markets. Shortly after the Commission filed its administrative complaint, the parties abandoned the transaction.
The Commission also accepted for public comment and finalized consent orders in the following thirteen merger matters.
In Albertson’s/United Supermarkets,29 the Commission challenged Albertson’s acquisition of United Supermarkets (“United”). Albertson’s operated 606 grocery stores, including 72 in Texas. United owned 51 supermarkets and 7 convenience stores across North and West Texas. As proposed, the transaction would likely have reduced competition in local grocery markets and harmed consumers in the Amarillo and Wichita Falls, TX areas through higher prices, lower quality, and reduced service levels. To resolve these charges, the Commission issued a consent order that required Albertson’s to sell its stores in both Amarillo and Wichita Falls, TX to MAL Enterprises, thereby preserving competition in these markets. The order included provisions designed to ensure that MAL Enterprises was well positioned to compete in both markets. Following a public comment period, the Commission approved the final order on February 4, 2014.
In SCI/Stewart Enterprises,30 the Commission challenged Service Corporation International’s (“SCI”) $1.4 billion acquisition of Stewart Enterprises, Inc. (“Stewart”). SCI, the nation’s largest funeral and cemetery services provider, owned and operated more than 1,449 funeral services locations and 374 cemeteries, including 213 combined funeral service/cemetery locations, as well as 100 crematories. Stewart, the second largest funeral and cemetery services provider in the nation, operated 217 funeral homes and 141 cemeteries. The Commission’s complaint alleged that the proposed acquisition would eliminate direct and substantial competition between the two firms in 59 highly concentrated local markets. The Commission further charged that the deal would allow the merged firm to unilaterally raise prices charged to consumers in the affected local markets and would increase the risk of collusion between SCI and the few remaining competitors in the affected areas. To remedy these concerns and maintain competition, the Commission issued a consent order requiring SCI to sell 53 funeral homes and 28 In the Matter of Visant Corp., , FTC Dkt. No. 9362 (compl. filed Apr. 17, 2014), available at https://www.ftc.gov/enforcement/cases-proceedings/141-0033/visantjostensamerican-achievement-matter. 29 In the Matter of AB Acquisition LLC, FTC Dkt. No. C-4424 (final order issued Feb. 4, 2014), available at https://www.ftc.gov/enforcement/cases-proceedings/131-0227/ab-acquisition-llc-matter. 30 In the Matter of Service Corp. Int’l, FTC Dkt. No. C-4423 (final order issued May 6, 2014), available at https://www.ftc.gov/enforcement/cases-proceedings/131-0163/service-corporation-international-stewart-enterprises-inc.
14
38 cemeteries as well as certain related assets and property. Following a public comment period, the Commission approved the final order on May 6, 2014.
In Fidelity National Financial/Lender Processing Services,31 the Commission challenged Fidelity National Financial, Inc.’s (“Fidelity”) $2.9 billion acquisition of Lender Processing Services, Inc. (“LPS”). The Commission charged that the acquisition would likely reduce competition by combining the firms’ title plant assets in several local markets in Oregon. Title plants are databases used to determine the title status of real property. Oregon law requires title insurers to own an interest in a title plant in each county in which they issue policies, creating a barrier to entry for new firms seeking to provide title insurance underwriting. The consent order required Fidelity to sell a copy of LPS’s title plants serving the affected Oregon counties and an ownership interest equivalent to LPS’s share of a jointly owned title plant in the Portland, Oregon metropolitan area. The order remedies the likely anticompetitive effects of the transaction without interfering with any efficiencies that might arise from the combination of the two firms. Following a public comment period, the Commission approved the final order on March 5, 2014.
In Community Health Systems/Health Management Associates,32 the Commission challenged Community Health Systems, Inc.’s (“CHS”) $7.6 billion acquisition of rival health system Health Management Associates, Inc. (“HMS”). CHS is a for-profit health system that owned 135 hospitals in 29 states and was the second-largest hospital chain in the United States. HMA is a for-profit health system that owned 71 hospitals in 15 states. The Commission charged that the acquisition would likely have lessened competition for general acute care inpatient services sold to commercial health plans and provided to commercially insured patients in Etowah County (including Gadsden), Alabama and Darlington County, South Carolina. The consent order required CHS to sell Riverview Regional Medical Center and all of its associated operations and businesses near Gadsden, AL, and the Carolina Pines Regional Medical Center and all of its associated operations and businesses near Hartsville, SC. The settlement also required the companies to hold separate the assets to be divested pending the sale. Following a public comment period, the Commission approved the final order on April 15, 2014.
In Thermo Fisher/Life Technologies,33 the Commission challenged Thermo Fisher Scientific Inc.’s (“Thermo Fisher”) $13.6 billion acquisition of Life Technologies Corporation (“Life”). Thermo Fisher is a global manufacturer and distributor of scientific products and laboratory equipment and consumables. Life Technologies also manufactures and supplies a wide range of laboratory equipment and consumables globally. The Commission charged that the merger of Thermo Fisher and Life would have eliminated competition and increased concentration in the markets for small interfering ribonucleic acid (“siRNA”) reagents, cell
31 In the Matter of Fidelity Nat’l Fin., Inc., FTC Dkt. No. C-4425 (final order issued Mar. 5, 2014), available at https://www.ftc.gov/enforcement/cases-proceedings/131-0159/fidelity-national-financial-inc-lender-processing-services. 32 In the Matter of Community Health Sys., Inc., FTC File No. 131-0202 (final order issued Apr. 15, 2014), available at https://www.ftc.gov/enforcement/cases-proceedings/131-0202/community-health-systems-health-management-associates-matter. 33 In the Matter of Thermo Fisher Scientific Inc., FTC Dkt. No. C-4431 (final order issued Apr. 2, 2014), available at https://www.ftc.gov/enforcement/cases-proceedings/131-0134/thermo-fisher-scientific-inc-matter.

15
culture media, and cell culture sera. This would have led to increased prices and reduced quality for customers, including research labs, universities, and pharmaceutical companies. The consent order required Thermo Fisher to divest its gene modulation business (which includes its siRNA reagents business) to Dharmacon and its cell culture media and sera businesses to GE Healthcare, along with all intellectual property and expertise necessary to operate the divested businesses. Commission staff cooperated with antitrust agencies in Australia, Canada, the European Union, Japan, China, and South Korea to analyze the proposed transaction and potential remedies to reach outcomes that benefited consumers in the United States. Following a public comment period, the Commission approved the final order on April 2, 2014.
In Endo Health Solutions/Boca Life Science,34 the Commission challenged Endo Health Solutions’ (“Endo”) $225 million acquisition of Boca Life Science Holdings (“Boca”). Endo is a global company that develops, produces, and markets pharmaceuticals and active pharmaceutical ingredients. Boca is a specialty drug company that develops and sells generic prescription drugs nationwide. Boca is the exclusive marketer and distributor of four prescription multivitamin drop products owned and manufactured by Sonar Products, Inc. (“Sonar”), competing with Endo’s prescription multivitamin drops. The Commission charged that the merger would have led to significantly higher prices for U.S. consumers for each of four generic drugs and would have eliminated one likely future entrant from a very limited pool of future entrants in three additional generic drug markets. The consent order required the companies to relinquish their rights to market and distribute four generic multivitamin fluoride drops for children to Sonar, and to sell the three other generic drugs in development. Following a public comment period, the Commission approved the final order on March 21, 2014.
In Bi-Lo Holdings/Delhaize Group,35 the Commission charged that the $265 million acquisition of Delhaize America by Bi-Lo Holdings, LLC (“Bi-Lo”) would have harmed competition in several local markets throughout Florida, Georgia, and South Carolina by raising prices and reducing quality and service levels. Bi-Lo is the parent company of the BI-LO and Winn Dixie grocery store chains with 685 supermarkets throughout the southeastern United States. Delhaize America owned and operated 1,553 supermarkets throughout the eastern United States. The consent order required Bi-Lo to sell 12 stores to Rowes IGA Supermarkets, HAC, Inc., W. Lee Flowers & Co., Inc. and Food Giant. However, Rowes IGA subsequently withdrew its commitment to purchase four Sweetbay stores in Florida, forcing Bi-Lo to find an alternative buyer or buyers for those stores. Despite investing substantial time and effort, Bi-Lo was unable to find buyers for three of the four stores. Accordingly, on January 15, 2015, the Commission approved a modified final order, which required Bi-Lo to divest the store in Wauchula, Florida to Sunripe Market.
In CoreLogic/TPG,36 the Commission challenged CoreLogic’s $661 million acquisition of DataQuick Information Systems, Inc. from TPG VI Ontario 1 AIV L.P. (“TPG”). The 34 In the Matter of Endo Health Solutions Inc., FTC Dkt. No. C-4430 (final order issued Mar. 21, 2014), available at https://www.ftc.gov/enforcement/cases-proceedings/131-0225/endo-health-solutions-inc-boca-life-science-holdings-llc-boca. 35 In the Matter of Bi-Lo Holdings, LLC, FTC Dkt. No. C-4440 (final order issued Jan. 15, 2014), available at https://www.ftc.gov/enforcement/cases-proceedings/131-0162/bi-lo-holdings-llc. 36 In the Matter of CoreLogic, Inc., FTC File No. 131-0199 (final order issued May 21, 2014), available at https://www.ftc.gov/enforcement/cases-proceedings/131-0199/corelogic-inc-matter.

16
acquisition would have eliminated one of only three providers of national assessor and recorder bulk data, which include current and historical public record data on property ownership, status, and value for the vast majority of properties in the United States. The transaction would have increased the risk of anticompetitive coordination between the two remaining market participants and the risk that CoreLogic would unilaterally exercise market power and raise prices. To resolve these concerns, the Commission approved a consent order, requiring CoreLogic to license to Renwood RealtyTrac national assessor and recorder bulk data as well as several ancillary data sets that DataQuick provides to its customers. Following a public comment period, the Commission approved the final order on May 21, 2014.
In Akorn/Hi-Tech Pharmacal,37 the Commission accepted a consent order to resolve charges that Akorn Inc.’s (“Akorn”) $640 million acquisition of Hi-Tech Pharmacal (“Hi-Tech”) was anticompetitive and would lead to higher prices for consumers. The order required either Akorn or Hi-Tech to sell to Watson Laboratories Inc. (“Watson”), the rights and assets to three generic prescription eye medications and two generic topical anesthetics. The order also required Akorn to assign Watson its contract for making branded and generic EMLA cream. Both companies were required to maintain the drugs’ viability, marketability, and competitiveness pending their divestiture. Following a public comment period, the Commission approved the final order on June 20, 2014.
In Forest Laboratories/Actavis,38 the Commission charged that Actavis plc’s (“Actavis”) acquisition of Forest Laboratories, Inc. (“Forest”) would likely have lessened competition in the markets for three current generic drug products and one future generic drug. Under the terms of the settlement, Actavis and Forest relinquished their rights to one generic drug to Valeant Pharmaceuticals International, Inc., sold two generic products to Impax Laboratories, Inc., and sold one generic product to Catalent Pharma Solutions, Inc. Actavis and Forest were required to ensure the viability, marketability, and competitiveness of the drugs until completion of the sale. Following a public comment period, the Commission approved the final order on September 5, 2014.
In Valeant Pharmaceuticals International/Precision Dermatology,39 the Commission challenged Valeant Pharmaceuticals International, Inc.’s (“Valeant”) $475 million acquisition of Precision Dermatology, Inc. (“Precision”). The deal would have eliminated current competition between the only two significant suppliers of branded single-agent topical tretinoins and would have given Valeant a monopoly in four of five versions of generic Retin-A and reduced competition in the remaining version. The consent order required Valeant to sell Precision’s assets related to Tretin-X to Actavis and assets related to Retin-A to Matawan Pharmaceuticals LLC. Actavis and Matawan each received partial assignments of the manufacturing contracts for both Tretin-X and generic Retin-A. Following a public comment period, the Commission approved the final order on August 21, 2014. 37 In the Matter of Akorn, Inc., FTC Dkt. No. C-4452 (final order issued June 20, 2014), available at https://www.ftc.gov/enforcement/cases-proceedings/131-0221/akorn-hi-tech-pharmacal-matter. 38 In the Matter of Actavis PLC, FTC File No. 141-0098 (final order issued Sept. 5, 2014), available at https://www.ftc.gov/enforcement/cases-proceedings/141-0098/actavis-plc-forest-laboratories-matter. 39 In the Matter of Valeant Pharmaceuticals Int’l, Inc., FTC Dkt. No. C-4477 (final order issued Aug. 21, 2014), available at https://www.ftc.gov/enforcement/cases-proceedings/141-0101/valeant-pharmaceuticals-international-precision-dermatology.
17
In Akorn/VersaPharm,40 the Commission charged that Akorn Inc.’s (“Akorn”) $324
million acquisition of VersaPharm Inc. and its parent company, VPI Holdings Corp. (collectively, “VersaPharm”), would likely have been anticompetitive. Only VersaPharm and two other firms currently have FDA approval to sell generic injectable rifampin. There are no viable substitutes for rifampin as a course of treatment for tuberculosis. The FTC alleged that if Akorn had consummated its acquisition of VersaPharm as originally proposed, the combined company would have been likely to delay or cancel the introduction of Akorn’s generic injectable rifampin. The consent order required Akorn to divest to Watson Laboratories Inc. its Abbreviated New Drug Application (“ANDA”) for generic injectable rifampin – which is currently pending before the Food and Drug Administration. The order also appointed an interim monitor to ensure Akorn provides Watson with any information the FDA requests, assists Watson with FDA approval for the pending ANDA, and provides transitional services so that Watson can develop the ability to manufacture generic injectable rifampin independently. Following a public comment period, the Commission approved the final order on September 19, 2014.
In Prestige Brands Holdings/Insight Pharmaceuticals,41 the Commission challenged Prestige Brands Holdings, Inc.’s (“Prestige”) $750 million acquisition of Insight Pharmaceuticals Corporation (“Insight”). Prestige’s Dramamine and Insight’s Bonine are the only two branded products with significant sales in the market for over-the-counter motion-sickness drugs. Absent a remedy, the acquisition would have eliminated the close competition between Dramamine and Bonine, likely leading to higher prices for consumers. The consent order required Prestige to divest assets and marketing rights for Bonine to Wellspring Pharmaceuticals. Following a public comment period, the Commission approved the final order on October 14, 2014. In addition to these new merger enforcement actions, the FTC also concluded litigation initiated in prior fiscal years, including its case against Ardagh Group/Compagnie de Saint-Gobain,42 discussed above, and continued to pursue litigation initiated in fiscal year 2011, including the FTC’s challenge to ProMedica Health System’s acquisition of rival St. Luke’s Hospital,43 also discussed above, and Phoebe Putney Health System’s acquisition of Palmyra Park Hospital.44
40 In the Matter of Akorn, Inc., FTC File No. 141-0162 (final order issued Sept. 19, 2014), available at https://www.ftc.gov/enforcement/cases-proceedings/141-0162/akorn-inc-matter. 41 In the Matter of Prestige Brands Holdings, Inc., FTC File No. 141-0159 (final order issued Oct. 14, 2014), available at https://www.ftc.gov/enforcement/cases-proceedings/141-0159/prestige-brands-holdings-inc-insight-pharmaceuticals. 42 In the Matter of Ardagh Group S.A., , FTC Dkt. No. 9356 (final order issued June 18, 2014; divestiture application approved Jun. 18, 2014), available at https://www.ftc.gov/enforcement/cases-proceedings/131-0087/ardagh-group-sa-saint-gobain-containers-inc-compagnie-de. 43 In the Matter of ProMedica Health Sys., Inc., FTC Dkt. No. 9346 (compl. issued Jan. 6, 2011), available at https://www.ftc.gov/enforcement/cases-and-proceedings/cases/2012/06/matter-promedica-health-system-inc-corporation. 44 In the Matter of Phoebe Putney Health Sys. Inc., FTC Dkt. No. 9348 (final order issued Mar. 31, 2015), available at https://www.ftc.gov/enforcement/cases-proceedings/111-0067/phoebe-putney-health-system-inc-phoebe-putney-memorial.

18
In Phoebe Putney, on February 19, 2013, the U.S. Supreme Court ruled in a unanimous opinion that the state action doctrine did not immunize Phoebe Putney’s acquisition of its sole rival in Albany, Georgia, Palmyra Park Hospital, from the federal antitrust laws, and remanded the case for further proceedings.45 In August 2013, the Commission accepted for public comment a consent order but returned the matter to adjudication in September 2014. In January 2015, the Commission again withdrew the matter from administrative litigation for purposes of settlement negotiation after it became clear that structural relief, the Commission’s preferred type of relief and available when the Commission initiated the case, was no longer feasible because of Georgia’s strict certificate of need laws. On March 31, 2015, the FTC entered into a settlement agreement with the parties, which includes a requirement that Phoebe Putney notify the FTC in advance of acquiring any part of a hospital or a controlling interest in other healthcare providers in the Albany, Georgia area for the next 10 years. ONGOING REASSESSMENT OF THE EFFECTS OF THE PREMERGER NOTIFICATION PROGRAM The Commission and the Antitrust Division continually review the impact of the premerger notification program on the business community and antitrust enforcement. As indicated in previous annual reports, the HSR program ensures that the antitrust agencies review virtually every relatively large merger and acquisition that affects U.S. consumers prior to consummation. The agencies generally have the opportunity to challenge unlawful transactions before they occur, thus avoiding the problem of constructing effective post-acquisition relief. As a result, the HSR Act is doing what Congress intended—giving the government the opportunity to investigate and challenge those relatively large mergers that are likely to harm consumers before injury can arise. Prior to the premerger notification program, businesses could, and often did, consummate transactions that raised significant antitrust concerns before the agencies had an opportunity to consider adequately their competitive effects. This practice forced the agencies to engage in lengthy post-acquisition litigation, during the course of which the transaction’s anticompetitive effects continued to harm consumers (and afterwards as well, where the achievement of effective post-acquisition relief was not practicable). Because the premerger notification program requires reporting before consummation, the agencies’ ability to obtain timely, effective relief to prevent anticompetitive effects has vastly improved. The antitrust enforcement agencies regularly examine the premerger notification program’s effectiveness and impact, and continually seek ways to speed up and improve the review process and minimize regulatory burdens. Thus, as they have in the past, the agencies will continue their ongoing assessment of the HSR program to increase accessibility, promote transparency, and reduce the burden on the filing parties without compromising the agencies’ ability to investigate and interdict proposed transactions that may substantially lessen competition.
45 FTC v. Phoebe Putney Health System, Inc., 568 U.S. ___ (2013), available at https://www.ftc.gov/sites/default/files/documents/cases/2013/02/130219phoebeopinion.pdf.

LIST OF APPENDICES
Appendix A: Summary of Transactions, Fiscal Years 2005 - 2014 Appendix B: Number of Transactions Reported and Filings Received by Month for Fiscal
Years 2005 - 2014
LIST OF EXHIBITS
Exhibit A: Statistical Tables for Fiscal Year 2014 – Data Profiling Hart-Scott-Rodino Notification Filings and Enforcement Interests

APPENDIX A
SUMMARY OF TRANSACTIONS
FISCAL YEARS 2005 – 2014

APPENDIX A SUMMARY OF TRANSACTIONS BY FISCAL YEAR
2005 2006 2007 2008 2009 2010 2011 2012 2013 2014
Transactions Reported 1,675 1,768 2,201 1,726 716 1,166 1,450 1,429 1,326 1,663
Filings Received1 3,287 3,510 4,378 3,455 1,411 2,318 2,882 2,829 2,628 3,307
Adjusted Transactions In Which A Second Request Could Have Been Issued2
1,610 1,746 2,108 1,656 684 1,128 1,414 1,400 1,286 1,618
Investigations in Which Second Requests Were Issued 50 45 63 41 31 42 55 49 47 51
FTC3 25 28 31 21 15 20 24 20 25 30
Percent4 1.6% 1.6% 1.5% 1.3% 2.2% 1.8% 1.7% 1.4% 1.9% 1.9%
DOJ3 25 17 32 20 16 22 31 29 22 21
Percent4 1.6% 1.0% 1.5% 1.2% 2.3% 2.0% 2.2% 2.1% 1.7% 1.3%
Transactions Involving a Request For Early Termination5 1,385 1,468 1,840 1,385 575 953 1,157 1,094 990 1,274
Granted5 997 1,098 1,402 1,021 396 704 888 902 797 1,020
Not Granted5 388 370 438 364 179 249 269 192 193 254 Note: The data for FY 2005 “Transactions Reported” and for FY 2005 – FY 2007 “Filings Received” reflect corrections to some prior Annual reports to account for a coding error. Additionally, the data for FY 2010 and FY 2011 reflect corrections to some prior annual reports and the DOJ number of investigations in which second requests were issued and the percentage of transactions in which second requests were issued by DOJ.
1 Usually, two filings are received, one from the acquiring person and one from the acquired person when a transaction is reported. Only one application is received when an
acquiring party files for an exemption under Section 7A (c )(6) or (c )(8) of the Clayton Act. 2 These figures omit from the total number of transactions reported all transactions for which the agencies were not authorized to request additional information. These include (1)
incomplete transactions (only one party filed a complete notification); (2) transactions reported pursuant to the exemption provisions of Sections 7A (c)(6) and 7A(c)(8) of the Act; (3) transactions which were found to be non-reportable; and (4) transactions withdrawn before the waiting period began. In addition, where a party filed more than one notification in the same year to acquire voting securities of the same corporation, e.g., filing one threshold and later filing for a higher threshold, only a single consolidated transaction has been counted because as a practical matter the agencies do not issue more than one Second Request in such a case. These statistics also omit from the total number the transactions reported secondary acquisitions filed pursuant to §801.4 of the Premerger Notification rules. Secondary acquisitions have been deducted in order to be consistent with the statistics presented in most of the prior annual reports.
3 These statistics are based on the date the Second Request was issued and not the date the investigation was opened. 4 Second Request investigations are a percentage of the total number of adjusted transactions. The total percentage reflected in Figure 2 may not equal the sum of reported
component values due to rounding. 5 These statistics are based on the date of the HSR filing and not the date action was taken on the request.
APPENDIX B
NUMBER OF TRANSACTIONS REPORTED
AND
FILINGS RECEIVED BY MONTH
FOR
FISCAL YEARS 2005 - 2014

APPENDIX B TABLE 1. NUMBER OF TRANSACTIONS REPORTED BY MONTH FOR FISCAL YEARS
2005 2006 2007 2008 2009 2010 2011 2012 2013 2014
October 139 130 201 158 91 66 128 122 127 124
November 160 148 189 191 85 135 217 169 260 159
December 126 137 151 172 37 84 91 95 92 108
January 138 142 143 158 42 62 97 104 78 125
February 99 124 157 119 32 61 81 90 82 114
March 121 150 194 131 42 116 97 111 87 100
April 121 125 156 128 60 92 96 96 77 140
May 171 158 250 150 58 108 142 117 117 157
June 153 172 202 146 51 108 117 142 90 150
July 118 141 219 128 62 94 120 130 91 162
August 170 186 200 126 77 120 164 133 122 151
September 159 155 139 119 79 120 100 120 103 173
TOTAL 1,675 1,768 2,201 1,726 716 1,166 1,450 1,429 1,326 1,663 Note: The data for FY 2005 “Transactions Reported” reflect corrections to some prior Annual reports to account for a coding error.
APPENDIX B TABLE 2. NUMBER OF FILINGS RECEIVED1 BY MONTH FOR FISCAL YEARS
2005 2006 2007 2008 2009 2010 2011 2012 2013 2014
October 277 261 401 319 185 146 252 242 255 247
November 324 311 376 380 165 242 422 332 511 325
December 238 260 294 343 79 177 193 188 180 211
January 259 279 288 316 77 126 188 203 151 244
February 201 257 317 246 63 116 157 185 169 236
March 239 309 381 242 81 232 195 215 172 195
April 242 270 312 272 119 182 190 193 151 271
May 337 300 481 294 114 216 284 231 228 315
June 297 346 403 293 99 213 231 275 181 304
July 236 255 441 259 121 187 240 269 186 323
August 328 367 396 251 149 238 329 259 240 292
September 309 295 288 240 159 243 201 237 204 344
TOTAL 3,287 3,510 4,378 3,455 1,411 2,318 2,882 2,829 2,628 3,307 Note: The data for FY 2005 – FY 2007 “Filings Received” reflect corrections to some prior Annual reports to account for a coding error.
1 Usually, two filings are received, one from the acquiring person and one from the acquired person, when the transaction is reported. Only one filing is received when an acquiring person files for a transaction that is exempt under Sections 7A(c)(6) and (c)(8) of the Clayton Act.

EXHIBIT A
STATISTICAL TABLES
FOR
FISCAL YEAR 2014
DATA PROFILING HART-SCOTT-RODINO PREMERGER
NOTIFICATION FILINGS AND ENFORCEMENT INTERESTS

TABLE IFISCAL YEAR 2014
ACQUISITIONS BY SIZE OF TRANSACTION (BY SIZE RANGE)
TRANSACTION RANGE($MILLIONS)
HSR TRANSACTIONS CLEARANCE GRANTED TO FTC OR DOJ SECOND REQUEST INVESTIGATIONS
PERCENT OFTRANSACTION RANGE
GROUPNUMBER PERCENT NUMBERPERCENT OF
TRANSACTION RANGEGROUP
FTC DOJ FTC DOJ TOTAL FTC DOJ FTC DOJ TOTAL
NUMBER
12
3
4
50M - 100M 171 10.6% 13 10 7.6% 5.8% 13.5% 1 0.6%2 1.2% 1.8%5
100M - 150M 304 18.8% 20 10 6.6% 3.3% 9.9% 1 0.3%1 0.3% 0.7%5
150M - 200M 186 11.5% 18 5 9.7% 2.7% 12.4% 0 0.0%1 0.5% 0.5%5
200M - 300M 188 11.6% 13 8 6.9% 4.3% 11.2% 1 0.5%2 1.1% 1.6%5
300M - 500M 244 15.1% 35 18 14.3% 7.4% 21.7% 5 2.0%2 0.8% 2.9%5
500M - 1000M 300 18.5% 28 15 9.3% 5.0% 14.3% 6 2.0%4 1.3% 3.3%5
Over 1000M 225 13.9% 54 27 24.0% 12.0% 36.0% 16 7.1%9 4.0% 11.1%5
ALL TRANSACTIONS 100.0% 181 93 11.2%1,618 5.7% 16.9% 30 1.9%21 1.3% 3.2%

TABLE IIFISCAL YEAR 2014
ACQUISITIONS BY SIZE OF TRANSACTION (CUMULATIVE)
TRANSACTION RANGE($MILLIONS)
HSR TRANSACTIONS CLEARANCE GRANTED TO FTC OR DOJ SECOND REQUEST INVESTIGATIONS
PERCENTAGE OFTOTAL NUMBER OF
CLEARANCES NUMBER PERCENT NUMBERPERCENTAGE OF
TOTAL NUMBER OF SECOND REQUESTS
FTC DOJ FTC DOJ TOTAL FTC DOJ FTC DOJ TOTAL
NUMBER
12
3
4
LESS THAN 50M 0 0.0% 0 0 0.0% 0.0% 0.0% 0 0 0.0% 0.0% 0.0%5
LESS THAN 100M 171 10.6% 13 10 4.7% 3.6% 8.4% 1 2 2.0% 3.9% 5.9%5
LESS THAN 150M 475 29.4% 33 20 12.0% 7.3% 19.3% 2 3 3.9% 5.9% 9.8%5
LESS THAN 200M 661 40.9% 51 25 18.6% 9.1% 27.7% 2 4 3.9% 7.8% 11.8%5
LESS THAN 300M 849 52.5% 64 33 23.4% 12.0% 35.4% 3 6 5.9% 11.8% 17.6%5
LESS THAN 500M 1,093 67.6% 99 51 36.1% 18.6% 54.7% 8 8 15.7% 15.7% 31.4%5
LESS THAN 1000M 1,390 85.9% 127 66 46.4% 24.1% 70.4% 14 12 27.5% 23.5% 51.0%5
ALL TRANSACTIONS 181 93 301,618 21 58.8% 41.2% 100.0%66.1% 33.9% 100.0%
TABLE IIIFISCAL YEAR 2014
TRANSACTIONS INVOLVING THE GRANTING OF CLEARANCE BY AGENCY
TRANSACTION RANGE($MILLIONS)
CLEARANCES GRANTED TO
AGENCY
CLEARANCE GRANTED AS A PERCENTAGE OF:
TRANSACTIONS IN EACH TRANSACTION RANGE
GROUP
FTC DOJ TOTAL FTC DOJ FTC DOJ TOTAL
1
FTC DOJ
TOTAL NUMBEROF CLEARANCES
PER AGENCY
TOTAL NUMBER OFCLEARANCES
GRANTED
TOTAL
50M - 100M 13 10 23 5.8%7.6% 13.5% 7.2% 10.8% 4.7% 3.6% 8.4%5
100M - 150M 20 10 30 3.3%6.6% 9.9% 11.0% 10.8% 7.3% 3.6% 10.9%5
150M - 200M 18 5 23 2.7%9.7% 12.4% 9.9% 5.4% 6.6% 1.8% 8.4%5
200M - 300M 13 8 21 4.3%6.9% 11.2% 7.2% 8.6% 4.7% 2.9% 7.7%5
300M - 500M 35 18 53 7.4%14.3% 21.7% 19.3% 19.4% 12.8% 6.6% 19.3%5
500M - 1000M 28 15 43 5.0%9.3% 14.3% 15.5% 16.1% 10.2% 5.5% 15.7%5
Over 1000M 54 27 81 12.0%24.0% 36.0% 29.8% 29.0% 19.7% 9.9% 29.6%5
ALL TRANSACTIONS 181 93 274 16.9%5.7%11.2% 100.0%100.0% 33.9%66.1% 100.0%

TABLE IVFISCAL YEAR 2014
TRANSACTIONS IN WHICH SECOND REQUESTS WERE ISSUED
TRANSACTION RANGE($MILLIONS)
INVESTIGATIONS IN WHICH SECOND REQUEST WERE
ISSUED
SECOND REQUESTS ISSUED AS A PERCENTAGE OF:
TOTAL NUMBER OF TRANSACTIONS
FTC DOJ TOTAL FTC DOJ FTC DOJ TOTAL
1
FTC DOJ
TRANSACTIONS INEACH TRANSACTION
RANGE GROUP
TOTAL NUMBER OFSECOND REQUEST INVESTIGATIONS
TOTAL
3
TOTAL
50M - 100M 1 2 3 0.1%0.1% 0.2% 0.6% 1.2% 2.0% 3.9% 5.9%1.8%5
100M - 150M 1 1 2 0.1%0.1% 0.1% 0.3% 0.3% 2.0% 2.0% 3.9%0.7%5
150M - 200M 0 1 1 0.1%0.0% 0.1% 0.0% 0.5% 0.0% 2.0% 2.0%0.5%5
200M - 300M 1 2 3 0.1%0.1% 0.2% 0.5% 1.1% 2.0% 3.9% 5.9%1.6%5
300M - 500M 5 2 7 0.1%0.3% 0.4% 2.0% 0.8% 9.8% 3.9% 13.7%2.9%5
500M - 1000M 6 4 10 0.2%0.4% 0.6% 2.0% 1.3% 11.8% 7.8% 19.6%3.3%5
Over 1000M 16 9 25 0.6%1.0% 1.5% 7.1% 4.0% 31.4% 17.6% 49.0%11.1%5
ALL TRANSACTIONS 30 21 51 3.2%1.3%1.9% 58.8% 41.2% 100.0%1.3%1.9% 3.2%

TABLE VFISCAL YEAR 2014
ACQUISITIONS BY REPORTING THRESHOLD
THRESHOLD
HSR TRANSACTIONS CLEARANCE GRANTED TO FTC OR DOJ SECOND REQUEST INVESTIGATIONS
PERCENT OFTHRESHOLD GROUPNUMBER PERCENT NUMBER
FTC DOJ FTC DOJ TOTAL FTC DOJ FTC DOJ TOTAL
NUMBER
1
3
6 PERCENT OFTHRESHOLD GROUP
101 6.2% 1 3 1.0% 3.0% 4.0% 0 0.0%1 1.0% 1.0%$50M (as adjusted)
137 8.5% 7 1 5.1% 0.7% 5.8% 0 0.0%0 0.0% 0.0%$100M (as adjusted)
37 2.3% 5 2 13.5% 5.4% 18.9% 0 0.0%1 2.7% 2.7%$500M (as adjusted)
515 31.8% 55 35 10.7% 6.8% 17.5% 7 1.4%6 1.2% 2.5%ASSETS ONLY
10 0.6% 2 2 20.0% 20.0% 40.0% 1 10.0%0 0.0% 10.0%25%
780 48.2% 107 46 13.7% 5.9% 19.6% 22 2.8%13 1.7% 4.5%50%
38 2.3% 4 4 10.5% 10.5% 21.1% 0 0.0%0 0.0% 0.0%N/A
ALL TRANSACTIONS 100.0% 181 93 11.2%1,618 5.7% 16.9% 30 1.9%21 1.3% 3.2%

TABLE VIFISCAL YEAR 2014
TRANSACTION BY ASSETS OF ACQUIRING PERSON
ASSET RANGE($MILLIONS)
HSR TRANSACTIONS CLEARANCE GRANTED TO FTC OR DOJ SECOND REQUEST INVESTIGATIONS
PERCENT OFASSET RANGE
GROUPNUMBER PERCENT NUMBERPERCENT OF
ASSET RANGEGROUP
FTC DOJ FTC DOJ TOTAL FTC DOJ FTC DOJ TOTAL
NUMBER
1
3
Below 50M 165 10.2% 1 7 0.6% 4.2% 4.8% 1 0.6%0 0.0% 0.6%
50M - 100M 16 1.0% 0 0 0.0% 0.0% 0.0% 0 0.0%0 0.0% 0.0%
100M - 150M 28 1.7% 2 1 7.1% 3.6% 10.7% 0 0.0%0 0.0% 0.0%
150M - 200M 38 2.3% 1 1 2.6% 2.6% 5.3% 0 0.0%0 0.0% 0.0%
200M - 300M 61 3.8% 3 3 4.9% 4.9% 9.8% 0 0.0%1 1.6% 1.6%
300M - 500M 83 5.1% 2 4 2.4% 4.8% 7.2% 1 1.2%0 0.0% 1.2%
500M - 1000M 150 9.3% 11 9 7.3% 6.0% 13.3% 3 2.0%0 0.0% 2.0%
Over 1000M 1,077 66.6% 161 68 14.9% 6.3% 21.3% 25 2.3%20 1.9% 4.2%
ALL TRANSACTIONS 100.0% 181 93 11.2%1,618 5.7% 16.9% 30 1.9%21 1.3% 3.2%
TABLE VIIFISCAL YEAR 2014
TRANSACTION BY SALES OF ACQUIRING PERSON
SALES RANGE($MILLIONS)
HSR TRANSACTIONS CLEARANCE GRANTED TO FTC OR DOJ SECOND REQUEST INVESTIGATIONS
PERCENT OFSALES RANGE
GROUPNUMBER PERCENT NUMBERPERCENT OF
SALES RANGEGROUP
FTC DOJ FTC DOJ TOTAL FTC DOJ FTC DOJ TOTAL
NUMBER
1
3
Below 50M 151 9.3% 4 1 2.6% 0.7% 3.3% 0 0.0%0 0.0% 0.0%7
50M - 100M 55 3.4% 1 2 1.8% 3.6% 5.5% 0 0.0%0 0.0% 0.0%7
100M - 150M 34 2.1% 0 1 0.0% 2.9% 2.9% 1 2.9%0 0.0% 2.9%7
150M - 200M 47 2.9% 3 3 6.4% 6.4% 12.8% 0 0.0%1 2.1% 2.1%7
200M - 300M 58 3.6% 2 2 3.4% 3.4% 6.9% 1 1.7%0 0.0% 1.7%7
300M - 500M 81 5.0% 5 5 6.2% 6.2% 12.3% 0 0.0%0 0.0% 0.0%7
500M - 1000M 161 10.0% 16 12 9.9% 7.5% 17.4% 3 1.9%1 0.6% 2.5%7
Over 1000M 920 56.9% 150 61 16.3% 6.6% 22.9% 25 2.7%19 2.1% 4.8%7
Sales Not Available 111 6.9% 0 6 0.0% 5.4% 5.4% 0 0.0%0 0.0% 0.0%7
ALL TRANSACTIONS 100.0% 181 93 11.2%1,618 5.7% 16.9% 30 1.9%21 1.3% 3.2%

TABLE VIIIFISCAL YEAR 2014
TRANSACTION BY ASSETS OF ACQUIRED ENTITIES
ASSET RANGE($MILLIONS)
HSR TRANSACTIONS CLEARANCE GRANTED TO FTC OR DOJ SECOND REQUEST INVESTIGATIONS
PERCENT OFASSET RANGE
GROUPNUMBER PERCENT NUMBERPERCENT OF
ASSET RANGEGROUP
FTC DOJ FTC DOJ TOTAL FTC DOJ FTC DOJ TOTAL
NUMBER
1
3
8
Below 50M 238 14.7% 16 2 6.7% 0.8% 7.6% 0 0.0%0 0.0% 0.0%8
50M - 100M 192 11.9% 23 13 12.0% 6.8% 18.8% 2 1.0%3 1.6% 2.6%8
100M - 150M 135 8.3% 17 3 12.6% 2.2% 14.8% 3 2.2%0 0.0% 2.2%8
150M - 200M 97 6.0% 15 1 15.5% 1.0% 16.5% 0 0.0%1 1.0% 1.0%8
200M - 300M 125 7.7% 15 12 12.0% 9.6% 21.6% 1 0.8%3 2.4% 3.2%8
300M - 500M 121 7.5% 11 5 9.1% 4.1% 13.2% 1 0.8%0 0.0% 0.8%8
500M - 1000M 148 9.1% 20 12 13.5% 8.1% 21.6% 6 4.1%4 2.7% 6.8%8
Over 1000M 352 21.8% 42 22 11.9% 6.3% 18.2% 11 3.1%9 2.6% 5.7%8
Assets Not Available 210 13.0% 22 23 10.5% 11.0% 21.4% 6 2.9%1 0.5% 3.3%8
ALL TRANSACTIONS 100.0% 181 93 11.2%1,618 5.7% 16.9% 30 1.9%21 1.3% 3.2%

TABLE IXFISCAL YEAR 2014
TRANSACTION BY SALES OF ACQUIRED ENTITIES
SALES RANGE($MILLIONS)
HSR TRANSACTIONS CLEARANCE GRANTED TO FTC OR DOJ SECOND REQUEST INVESTIGATIONS
PERCENT OFSALES RANGE
GROUPNUMBER PERCENT NUMBERPERCENT OF
SALES RANGEGROUP
FTC DOJ FTC DOJ TOTAL FTC DOJ FTC DOJ TOTAL
NUMBER
1
3
9
Below 50M 224 13.8% 19 9 8.5% 4.0% 12.5% 1 0.4%2 0.9% 1.3%10
50M - 100M 227 14.0% 22 3 9.7% 1.3% 11.0% 1 0.4%1 0.4% 0.9%10
100M - 150M 185 11.4% 20 10 10.8% 5.4% 16.2% 2 1.1%1 0.5% 1.6%10
150M - 200M 117 7.2% 13 9 11.1% 7.7% 18.8% 4 3.4%1 0.9% 4.3%10
200M - 300M 140 8.7% 17 8 12.1% 5.7% 17.9% 3 2.1%0 0.0% 2.1%10
300M - 500M 159 9.8% 16 14 10.1% 8.8% 18.9% 1 0.6%1 0.6% 1.3%10
500M - 1000M 155 9.6% 20 13 12.9% 8.4% 21.3% 2 1.3%3 1.9% 3.2%10
Over 1000M 347 21.4% 44 25 12.7% 7.2% 19.9% 12 3.5%9 2.6% 6.1%10
Sales not Available 64 4.0% 10 2 15.6% 3.1% 18.8% 4 6.3%3 4.7% 10.9%10
ALL TRANSACTIONS 100.0% 181 93 11.2%1,618 5.7% 16.9% 30 1.9%21 1.3% 3.2%

TABLE XFISCAL YEAR 2014
INDUSTRY GROUP OF ACQUIRING PERSON
3 DIGIT NAICS CODE
INDUSTRY DESCRIPTION PERCENTOF TOTAL
SECOND REQUESTINVESTIGATIONS
FTC DOJ TOTAL
1
3% POINTS CHANGEFROM FY
2013
NUMBER
CLEARANCEGRANTED TO FTC
OR DOJ
FTC DOJ TOTAL
11
12
4
000 Not Available 114 7.0% 1 6 7 1 0 1-1.5%13
112 Animal Production 2 0.1% 0 0 0 0 0 00.1%13
113 Forestry and and Logging 3 0.2% 0 0 0 0 0 00.2%13
211 Oil and Gas Extraction 30 1.9% 2 1 3 1 0 10.4%13
212 Mining (except Oil and Gas) 7 0.4% 1 1 2 0 1 1-0.2%13
213 Support Activities for Mining 13 0.8% 0 1 1 0 0 0-0.2%13
221 Utilities 34 2.1% 0 6 6 0 0 00.1%13
233 Construction 1 0.1% 0 0 0 0 0 00.1%13
236 Construction of Buildings 4 0.2% 0 0 0 0 0 00.1%13
237 Heavy and Civil Engineering Construction 11 0.7% 0 0 0 0 0 0-0.5%13
238 Specialty Trade Contractors 7 0.4% 0 0 0 0 0 00.0%13
311 Food and Kindred Products 48 3.0% 5 6 11 0 1 10.1%13
312 Beverage and Tobacco Product Manufacturing 9 0.6% 3 0 3 0 0 00.3%13
321 Wood Product Manufacturing 4 0.2% 0 1 1 0 2 2-0.3%13
322 Paper Manufacturing 8 0.5% 1 3 4 1 2 3-0.1%13
323 Printing and Related Support Actitivies 9 0.6% 2 1 3 0 0 00.3%13
324 Petroleum and Coal Products Manufacturing 26 1.6% 2 3 5 1 1 20.4%13
325 Chemical Manufacturing 111 6.9% 43 1 44 10 0 101.1%13
326 Plastics and Rubber Manfuacturing 18 1.1% 4 0 4 0 0 00.0%13
327 Nonmetallic Mineral Product Manufacturing 4 0.2% 3 0 3 1 0 1-0.3%13
331 Primary Metal Manufacturing 16 1.0% 1 5 6 0 0 0-0.2%13

TABLE XFISCAL YEAR 2014
INDUSTRY GROUP OF ACQUIRING PERSON
3 DIGIT NAICS CODE
INDUSTRY DESCRIPTION PERCENTOF TOTAL
SECOND REQUESTINVESTIGATIONS
FTC DOJ TOTAL
1
3% POINTS CHANGEFROM FY
2013
NUMBER
CLEARANCEGRANTED TO FTC
OR DOJ
FTC DOJ TOTAL
11
12
4
332 Fabricated Metal Product Manufacturing 16 1.0% 0 0 0 0 0 0-0.2%13
333 Machinery Manufacturing 33 2.0% 2 6 8 0 1 1-0.4%13
334 Computer and Electronic Product Manufacturing 54 3.3% 13 2 15 1 1 20.2%13
335 Electrical Equipment, Applicance, and Component Manufacturing 11 0.7% 1 0 1 0 0 00.2%13
336 Transportation Equipment Manufacturing 47 2.9% 2 3 5 0 2 20.3%13
337 Furniture and Related Product Manufacturing 3 0.2% 0 0 0 0 0 0-0.2%13
339 Miscellaneous Manufacturing 28 1.7% 11 0 11 1 0 10.3%13
423 Merchant Wholesalers, Durable Goods 64 4.0% 9 1 10 0 0 0-0.3%13
424 Merchant Wholesales, Nondurable Goods 74 4.6% 16 3 19 4 0 4-0.7%13
425 Wholesale Electric Markets and Agent and Brokers 4 0.2% 0 0 0 0 0 00.0%13
441 Motor Vehicle and Parts Dealers 12 0.7% 1 0 1 0 0 00.2%13
442 Furniture and Home Furnishing Stores 2 0.1% 0 0 0 0 0 00.1%13
444 Electronics and Appliance Stores 1 0.1% 0 0 0 0 0 00.0%13
445 Food and Beverage Stores 6 0.4% 2 0 2 2 0 20.0%13
446 Health and Personal Care Stores 4 0.2% 1 0 1 0 0 0-0.6%13
447 Gasoline Stations 1 0.1% 1 0 1 0 0 0-0.1%13
448 Clothing and Clothing Accessories Stores 12 0.7% 3 0 3 1 0 1-0.1%13
451 Sporting Goods, Hobby, Book, and Music Stores 2 0.1% 0 0 0 0 0 0-0.1%13
452 General Merchandise Stores 4 0.2% 2 0 2 1 0 10.0%13
453 Miscellaneous Store Retailers 2 0.1% 0 0 0 0 0 0-0.3%13
454 Nonstore Retailers 11 0.7% 0 0 0 0 0 00.2%13

TABLE XFISCAL YEAR 2014
INDUSTRY GROUP OF ACQUIRING PERSON
3 DIGIT NAICS CODE
INDUSTRY DESCRIPTION PERCENTOF TOTAL
SECOND REQUESTINVESTIGATIONS
FTC DOJ TOTAL
1
3% POINTS CHANGEFROM FY
2013
NUMBER
CLEARANCEGRANTED TO FTC
OR DOJ
FTC DOJ TOTAL
11
12
4
483 Water Transportation 5 0.3% 1 1 2 0 0 0-0.1%13
484 Truck Transportation 5 0.3% 0 1 1 0 0 00.2%13
485 Transit and Ground Transportation 1 0.1% 0 0 0 0 0 00.1%13
486 Pipeline Transportation 8 0.5% 0 0 0 0 0 00.3%13
488 Support Actitivies for Transportation 6 0.4% 0 0 0 0 0 00.1%13
492 Couriers 1 0.1% 0 0 0 0 0 00.1%13
511 Publishing Industries (except Internet) 42 2.6% 2 6 8 0 1 1-0.2%13
512 Motion Pictures and Sound Recording Industries 4 0.2% 0 0 0 0 0 0-0.4%13
514 Information Services and Data Processing Services 1 0.1% 0 0 0 0 0 00.1%13
515 Broadcasting (except Internet) 24 1.5% 0 3 3 0 2 2-0.1%13
517 Telecommunications 45 2.8% 0 6 6 0 3 30.5%13
518 Internet Service Providers, Web Search Portals, and Data Processing Services 20 1.2% 2 1 3 1 0 10.9%13
519 Other Information Services 9 0.6% 0 1 1 1 0 1-0.3%13
522 Credit Intermediation and Related Activities 30 1.9% 2 1 3 0 0 0-0.7%13
523 Securitites, Commodity Contracts, and Other Financial Investments and Related Activities 176 10.9% 3 4 7 0 0 00.4%13
524 Insurance Carriers and Related Actitivities 61 3.8% 4 2 6 1 1 20.2%13
525 Funds, Trusts, and Other Financial Vehicles 46 2.8% 2 0 2 0 0 00.5%13
531 Real Estate 10 0.6% 0 1 1 0 0 0-0.3%13
532 Rental and Leasing Services 4 0.2% 0 0 0 0 0 0-0.1%13
533 Lessors of Nonfinancial Intangible Assets (except Copyrighted Works) 8 0.5% 1 2 3 0 0 00.3%13
541 Professional, Scientific, and Technical Services 112 6.9% 7 9 16 0 2 22.8%13

TABLE XFISCAL YEAR 2014
INDUSTRY GROUP OF ACQUIRING PERSON
3 DIGIT NAICS CODE
INDUSTRY DESCRIPTION PERCENTOF TOTAL
SECOND REQUESTINVESTIGATIONS
FTC DOJ TOTAL
1
3% POINTS CHANGEFROM FY
2013
NUMBER
CLEARANCEGRANTED TO FTC
OR DOJ
FTC DOJ TOTAL
11
12
4
561 Administrative and Support Services 29 1.8% 3 1 4 1 0 1-0.1%13
562 Waste Management and Remediation Services 6 0.4% 0 3 3 0 0 00.1%13
611 Educational Services 4 0.2% 0 0 0 0 0 0-0.3%13
621 Ambulatory Health Care Services 26 1.6% 6 0 6 0 0 00.4%13
622 Hospitals 27 1.7% 13 1 14 1 1 2-1.7%13
623 Nursing Care Facilities 6 0.4% 1 0 1 0 0 0-0.4%13
711 Performing Arts, Spector Sports, and Related Industries 2 0.1% 0 0 0 0 0 0-0.1%13
713 Amusement, Gambling, and Recreation Industries 8 0.5% 1 0 1 0 0 00.2%13
721 Accommodation 1 0.1% 0 0 0 0 0 00.0%13
722 Food Services and Drinking Places 11 0.7% 0 0 0 0 0 0-0.2%13
811 Repairs and Maintenance 2 0.1% 0 0 0 0 0 00.0%13
812 Personal and Laundry Services 4 0.2% 1 0 1 0 0 00.1%13
813 Religious, Grantmaking, Civic, Professional, and Similar Organizations 4 0.2% 0 0 0 0 0 00.2%13
1,618 100.0% 181 93 274 30 21 51
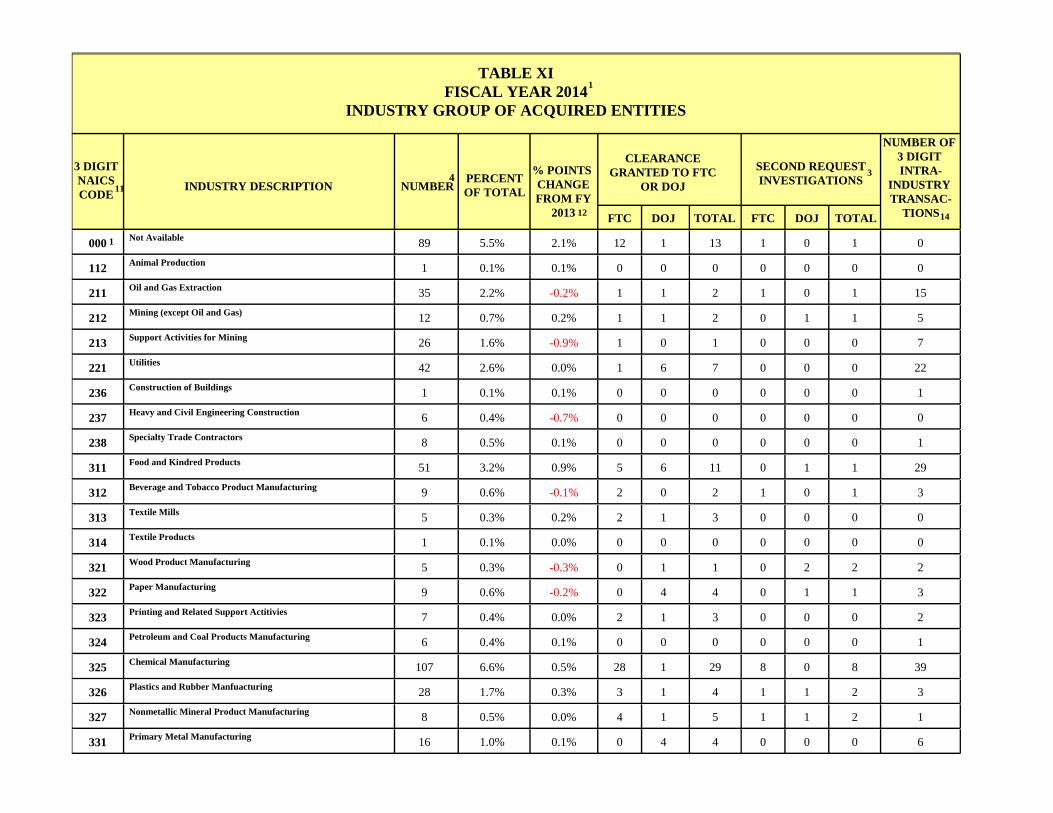
TABLE XIFISCAL YEAR 2014
INDUSTRY GROUP OF ACQUIRED ENTITIES
3 DIGIT NAICS CODE
INDUSTRY DESCRIPTIONPERCENTOF TOTAL
SECOND REQUESTINVESTIGATIONS
FTC DOJ TOTAL
1
3% POINTS CHANGEFROM FY
2013
NUMBER
CLEARANCEGRANTED TO FTC
OR DOJ
FTC DOJ TOTAL
11
NUMBER OF 3 DIGIT INTRA-
INDUSTRY TRANSAC-
TIONS
4
12 14
000 Not Available 89 5.5% 12 1 13 1 0 12.1% 01
112 Animal Production 1 0.1% 0 0 0 0 0 00.1% 01
211 Oil and Gas Extraction 35 2.2% 1 1 2 1 0 1-0.2% 151
212 Mining (except Oil and Gas) 12 0.7% 1 1 2 0 1 10.2% 51
213 Support Activities for Mining 26 1.6% 1 0 1 0 0 0-0.9% 71
221 Utilities 42 2.6% 1 6 7 0 0 00.0% 221
236 Construction of Buildings 1 0.1% 0 0 0 0 0 00.1% 11
237 Heavy and Civil Engineering Construction 6 0.4% 0 0 0 0 0 0-0.7% 01
238 Specialty Trade Contractors 8 0.5% 0 0 0 0 0 00.1% 11
311 Food and Kindred Products 51 3.2% 5 6 11 0 1 10.9% 291
312 Beverage and Tobacco Product Manufacturing 9 0.6% 2 0 2 1 0 1-0.1% 31
313 Textile Mills 5 0.3% 2 1 3 0 0 00.2% 01
314 Textile Products 1 0.1% 0 0 0 0 0 00.0% 01
321 Wood Product Manufacturing 5 0.3% 0 1 1 0 2 2-0.3% 21
322 Paper Manufacturing 9 0.6% 0 4 4 0 1 1-0.2% 31
323 Printing and Related Support Actitivies 7 0.4% 2 1 3 0 0 00.0% 21
324 Petroleum and Coal Products Manufacturing 6 0.4% 0 0 0 0 0 00.1% 11
325 Chemical Manufacturing 107 6.6% 28 1 29 8 0 80.5% 391
326 Plastics and Rubber Manfuacturing 28 1.7% 3 1 4 1 1 20.3% 31
327 Nonmetallic Mineral Product Manufacturing 8 0.5% 4 1 5 1 1 20.0% 11
331 Primary Metal Manufacturing 16 1.0% 0 4 4 0 0 00.1% 61
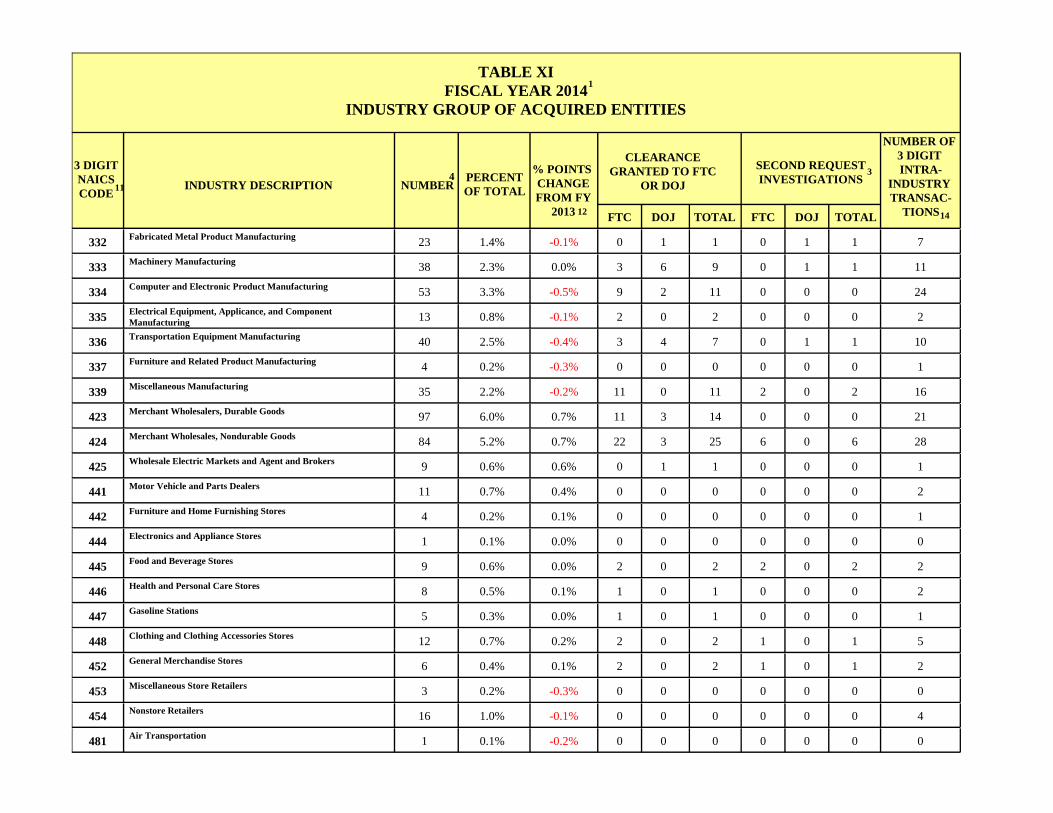
TABLE XIFISCAL YEAR 2014
INDUSTRY GROUP OF ACQUIRED ENTITIES
3 DIGIT NAICS CODE
INDUSTRY DESCRIPTIONPERCENTOF TOTAL
SECOND REQUESTINVESTIGATIONS
FTC DOJ TOTAL
1
3% POINTS CHANGEFROM FY
2013
NUMBER
CLEARANCEGRANTED TO FTC
OR DOJ
FTC DOJ TOTAL
11
NUMBER OF 3 DIGIT INTRA-
INDUSTRY TRANSAC-
TIONS
4
12 14
332 Fabricated Metal Product Manufacturing 23 1.4% 0 1 1 0 1 1-0.1% 71
333 Machinery Manufacturing 38 2.3% 3 6 9 0 1 10.0% 111
334 Computer and Electronic Product Manufacturing 53 3.3% 9 2 11 0 0 0-0.5% 241
335 Electrical Equipment, Applicance, and Component Manufacturing 13 0.8% 2 0 2 0 0 0-0.1% 21
336 Transportation Equipment Manufacturing 40 2.5% 3 4 7 0 1 1-0.4% 101
337 Furniture and Related Product Manufacturing 4 0.2% 0 0 0 0 0 0-0.3% 11
339 Miscellaneous Manufacturing 35 2.2% 11 0 11 2 0 2-0.2% 161
423 Merchant Wholesalers, Durable Goods 97 6.0% 11 3 14 0 0 00.7% 211
424 Merchant Wholesales, Nondurable Goods 84 5.2% 22 3 25 6 0 60.7% 281
425 Wholesale Electric Markets and Agent and Brokers 9 0.6% 0 1 1 0 0 00.6% 11
441 Motor Vehicle and Parts Dealers 11 0.7% 0 0 0 0 0 00.4% 21
442 Furniture and Home Furnishing Stores 4 0.2% 0 0 0 0 0 00.1% 11
444 Electronics and Appliance Stores 1 0.1% 0 0 0 0 0 00.0% 01
445 Food and Beverage Stores 9 0.6% 2 0 2 2 0 20.0% 21
446 Health and Personal Care Stores 8 0.5% 1 0 1 0 0 00.1% 21
447 Gasoline Stations 5 0.3% 1 0 1 0 0 00.0% 11
448 Clothing and Clothing Accessories Stores 12 0.7% 2 0 2 1 0 10.2% 51
452 General Merchandise Stores 6 0.4% 2 0 2 1 0 10.1% 21
453 Miscellaneous Store Retailers 3 0.2% 0 0 0 0 0 0-0.3% 01
454 Nonstore Retailers 16 1.0% 0 0 0 0 0 0-0.1% 41
481 Air Transportation 1 0.1% 0 0 0 0 0 0-0.2% 01

TABLE XIFISCAL YEAR 2014
INDUSTRY GROUP OF ACQUIRED ENTITIES
3 DIGIT NAICS CODE
INDUSTRY DESCRIPTIONPERCENTOF TOTAL
SECOND REQUESTINVESTIGATIONS
FTC DOJ TOTAL
1
3% POINTS CHANGEFROM FY
2013
NUMBER
CLEARANCEGRANTED TO FTC
OR DOJ
FTC DOJ TOTAL
11
NUMBER OF 3 DIGIT INTRA-
INDUSTRY TRANSAC-
TIONS
4
12 14
483 Water Transportation 9 0.6% 4 1 5 0 0 00.3% 31
484 Truck Transportation 5 0.3% 0 2 2 0 0 00.0% 11
486 Pipeline Transportation 8 0.5% 0 0 0 0 0 0-0.2% 11
488 Support Actitivies for Transportation 14 0.9% 0 0 0 0 1 10.0% 31
492 Couriers 1 0.1% 0 0 0 0 0 0-0.1% 01
493 Warehousing and Storage 7 0.4% 0 0 0 0 0 00.3% 01
511 Publishing Industries (except Internet) 71 4.4% 2 6 8 0 1 10.7% 171
512 Motion Pictures and Sound Recording Industries 11 0.7% 0 0 0 0 0 00.0% 21
515 Broadcasting (except Internet) 25 1.5% 0 7 7 0 3 3-0.1% 101
517 Telecommunications 28 1.7% 1 7 8 0 3 3-0.6% 131
518 Internet Service Providers, Web Search Portals, and Data Processing Services 42 2.6% 3 1 4 1 0 10.7% 61
519 Other Information Services 17 1.1% 0 0 0 1 0 10.0% 31
522 Credit Intermediation and Related Activities 25 1.5% 1 1 2 0 0 0-1.3% 81
523 Securitites, Commodity Contracts, and Other Financial Investments and Related Activities 44 2.7% 1 4 5 0 1 10.2% 211
524 Insurance Carriers and Related Actitivities 50 3.1% 0 3 3 0 1 1-0.1% 231
531 Real Estate 5 0.3% 0 0 0 0 0 0-0.1% 21
532 Rental and Leasing Services 17 1.1% 1 1 2 0 0 00.0% 21
533 Lessors of Nonfinancial Intangible Assets (except Copyrighted Works) 17 1.1% 3 0 3 0 0 00.7% 21
541 Professional, Scientific, and Technical Services 123 7.6% 8 6 14 1 0 10.6% 371
551 Management Companies and Enterprises 1 0.1% 0 0 0 0 0 00.1% 01
561 Administrative and Support Services 27 1.7% 1 1 2 0 0 0-0.7% 81
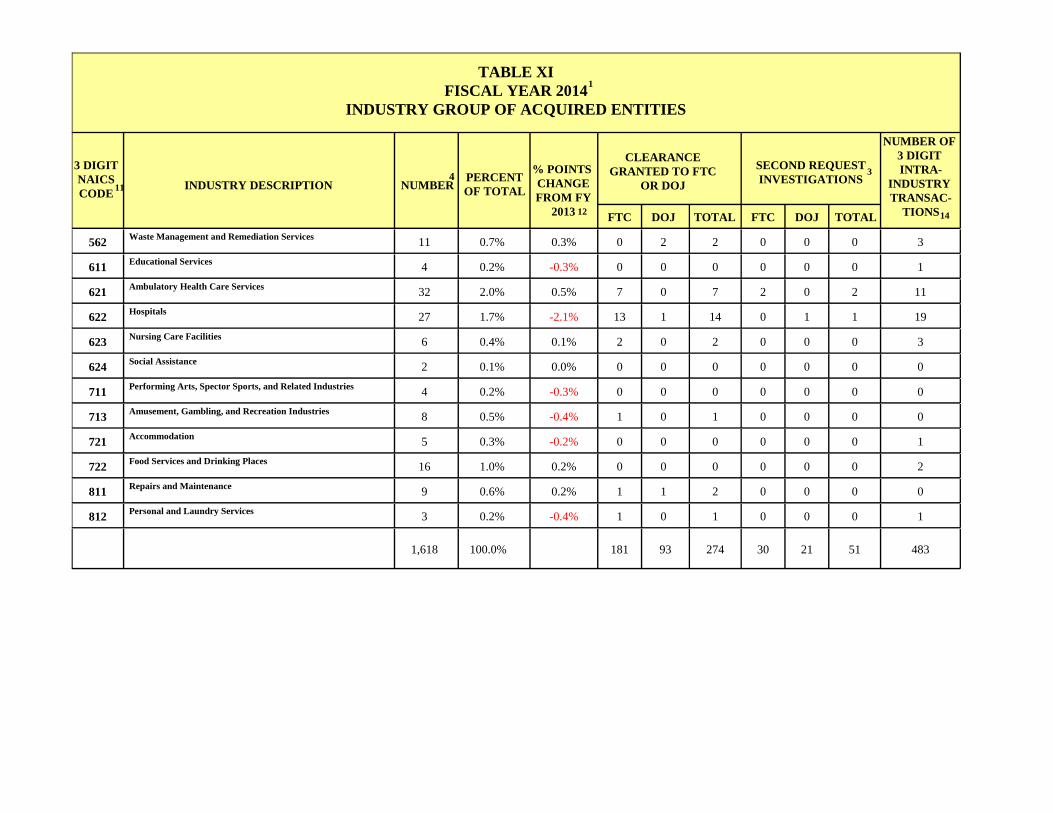
TABLE XIFISCAL YEAR 2014
INDUSTRY GROUP OF ACQUIRED ENTITIES
3 DIGIT NAICS CODE
INDUSTRY DESCRIPTIONPERCENTOF TOTAL
SECOND REQUESTINVESTIGATIONS
FTC DOJ TOTAL
1
3% POINTS CHANGEFROM FY
2013
NUMBER
CLEARANCEGRANTED TO FTC
OR DOJ
FTC DOJ TOTAL
11
NUMBER OF 3 DIGIT INTRA-
INDUSTRY TRANSAC-
TIONS
4
12 14
562 Waste Management and Remediation Services 11 0.7% 0 2 2 0 0 00.3% 31
611 Educational Services 4 0.2% 0 0 0 0 0 0-0.3% 11
621 Ambulatory Health Care Services 32 2.0% 7 0 7 2 0 20.5% 111
622 Hospitals 27 1.7% 13 1 14 0 1 1-2.1% 191
623 Nursing Care Facilities 6 0.4% 2 0 2 0 0 00.1% 31
624 Social Assistance 2 0.1% 0 0 0 0 0 00.0% 01
711 Performing Arts, Spector Sports, and Related Industries 4 0.2% 0 0 0 0 0 0-0.3% 01
713 Amusement, Gambling, and Recreation Industries 8 0.5% 1 0 1 0 0 0-0.4% 01
721 Accommodation 5 0.3% 0 0 0 0 0 0-0.2% 11
722 Food Services and Drinking Places 16 1.0% 0 0 0 0 0 00.2% 21
811 Repairs and Maintenance 9 0.6% 1 1 2 0 0 00.2% 01
812 Personal and Laundry Services 3 0.2% 1 0 1 0 0 0-0.4% 11
1,618 100.0% 181 93 274 30 21 51 483

1 Fiscal year 2014 figures include transactions reported between October 1, 2013 and September 30, 2014.
2 The size of transaction is based on the aggregate total amount of voting securities, non-corporate interests and/or assets held by the acquiring person as a result of the transaction and are taken from the response to Item 2(d)(iii), 2(d)(vii), and 2(d)(ix) of the Notification and Report Form.
3 These statistics are based on the date the Second Request was issued.
4 During fiscal year 2014, 1663 transactions were reported under the HSR Premerger Notification program. The smaller number, 1618, reflects the adjustments to eliminate the following types of transactions: (1) transactions reported under Section 7A(c)(6) and (c)(8) (transactions involving certain regulated industries and financial businesses); (2) transactions deemed non-reportable; (3) incomplete transactions (only one party in each transaction filed a compliant notification); and (4) transactions withdrawn before the waiting period began. The table does not,however, exclude competing offers or multiple HSR transactions resulting from a single business transaction (where there are multiple acquiring persons or acquired persons).
5 The total number of filings under $50M submitted in Fiscal Year 2014 reflects corrective filings.
6 In February 2001, legislation raised the size of transaction from $15 million to $50 million with annual adjustments beginning in February 2005.
7 The category labeled “Sales Not Available” includes newly-formed acquiring persons, foreign acquiring person with no United States revenues, and acquiring persons who had not derived any revenues from their investments at the time of filing.
8 Assets of an acquired entity are not available when the acquired entity’s financial data is consolidated within its ultimate parent.
9 Sales of an acquired entity are taken from responses to Item 4(a) and (b) (SEC documents and annual reports) or item 5 (dollar revenues) of the Premerger Notification and Report Form.
10 This category includes acquisition of newly-formed entities from which no sales were generated, and acquisitions of assets which produced no sales revenues during the prior year to filing the Notification and Report Form.
11 The 3-digit codes are part of the North American Industrial Classification System (NAICS) established by the United States Government North American Industrial Classification System 1997, Executive Office of the President, Office of Management and Budget. The NAICS groups used in this table were determined from responses submitted by the parties to Item 5 of the Premerger Notification and Report Form.
12 This represents the deviation from the fiscal year 2013 percentage.
13 This category includes transactions by newly-formed entities.
14 The intra-industry transactions column identifies the number of acquisitions in which both the acquiring and acquired person derived revenues from the same 3-digit NAICS code.