harvestable biomass of katelysia spp. in the south
TRANSCRIPT

Harvestable biomass of Katelysia spp. in the
South Australian commercial Mud Cockle
Fishery
J. Dent, S. Mayfield and J. Carroll
SARDI Publication No. F2014/000191-2 SARDI Research Report Series No. 898
SARDI Aquatics Sciences PO Box 120 Henley Beach SA 5022
May 2016
Report to PIRSA Fisheries and Aquaculture

Dent, J. et al. (2016) Harvestable biomass of mud cockles
II
Harvestable biomass of Katelysia spp. in the
South Australian commercial Mud Cockle
Fishery
Report to PIRSA Fisheries and Aquaculture
J. Dent, S. Mayfield and J. Carroll
SARDI Publication No. F2014/000191-2 SARDI Research Report Series No. 898
May 2016

Dent, J. et al. (2016) Harvestable biomass of mud cockles
III
This publication may be cited as: Dent, J., Mayfield, S. and Carroll, J. (2016). Harvestable biomass of Katelysia spp. in the South Australian commercial Mud Cockle Fishery. Report to PIRSA Fisheries and Aquaculture. South Australian Research and Development Institute (Aquatic Sciences), Adelaide. SARDI Publication Number. F2014/000191-2. SARDI Research Report Series No. 898. 29pp.
Cover photo: Katelysia sp. J. Dent
South Australian Research and Development Institute SARDI Aquatic Sciences 2 Hamra Avenue West Beach SA 5024 Telephone: (08) 8207 5400 Facsimile: (08) 8207 5406 http://www.pir.sa.gov.au/research
DISCLAIMER The authors warrant that they have taken all reasonable care in producing this report. The report has been through the SARDI internal review process, and has been formally approved for release by the Research Chief, Aquatic Sciences. Although all reasonable efforts have been made to ensure quality, SARDI does not warrant that the information in this report is free from errors or omissions. SARDI does not accept any liability for the contents of this report or for any consequences arising from its use or any reliance placed upon it. The SARDI Report Series is an Administrative Report Series which has not been reviewed outside the department and is not considered peer-reviewed literature. Material presented in these Administrative Reports may later be published in formal peer-reviewed scientific literature. © 2016 SARDI This work is copyright. Apart from any use as permitted under the Copyright Act 1968 (Cth), no part may be reproduced by any process, electronic or otherwise, without the specific written permission of the copyright owner. Neither may information be stored electronically in any form whatsoever without such permission.
Printed in Adelaide: May 2016 SARDI Publication No. F2014/000191-2 SARDI Research Report Series No. 898
Author(s): J. Dent, S. Mayfield and J. Carroll Reviewer(s): G. Ferguson, L. McLeay (SARDI) and B. McGrath-Steer (PIRSA) Approved by: Q. Ye Science Leader – Inland Waters & Catchment Ecology Signed: Date: 25 May 2016 Distribution: PIRSA Fisheries and Aquaculture, SAASC Library, SARDI Waite Executive
Library, Parliamentary Library, State Library and National Library Circulation: Public Domain

Dent, J. et al. (2016) Harvestable biomass of mud cockles
IV
TABLE OF CONTENTS
ACKNOWLEDGEMENTS ........................................................................................................ VII
EXECUTIVE SUMMARY ........................................................................................................... 1
1. INTRODUCTION ................................................................................................................ 2
1.1 Background ...................................................................................................................... 2
2. METHODS .......................................................................................................................... 5
2.1 Catch statistics ................................................................................................................. 5
2.2 Survey design and transect location ................................................................................. 5
2.3 Survey methods ................................................................................................................ 6
2.4 Estimates of harvestable biomass .................................................................................... 7
2.5 Temporal change in mud cockle density and stock structure ............................................ 8
3. RESULTS .............................................................................................................................. 9
3.1 Fishery Statistics .............................................................................................................. 9
3.2 Coffin Bay ........................................................................................................................11
3.3 West Coast ......................................................................................................................14
DISCUSSION............................................................................................................................20
4.1 Status of the South Australian mud cockle fishery ...........................................................20
4.1.1 Coffin Bay .................................................................................................................21
4.1.2 West Coast ...............................................................................................................23
4.2 Future research needs .....................................................................................................25
5. REFERENCES .....................................................................................................................27

Dent, J. et al. (2016) Harvestable biomass of mud cockles
V
LIST OF FIGURES
Figure 1. Map showing locations of commercial cockle fishing zones in South Australia: Port River, Coffin Bay and the West Coast. The West Coast zone comprises Smoky Bay (1), Streaky Bay (2) and Venus Bay (3). ......................................................................................................... 4
Figure 2. Percentage (%) of catch comprising K. scalarina (A; grey bars) and K. rhytiphora (B; yellow bars) and percentage of harvestable biomass (black bars) from previous biomass assessments from 2010/11 to 2014/15 fishing seasons in Coffin Bay. Note scales on y-axes vary. ................................................................................................................................................. 10
Figure 3. Percentage (%) of catch harvested from Smoky Bay (A; brown bars), Streaky Bay (B; green bars) and Venus Bay (C; blue bars), and percentage of harvestable biomass (black bars) from previous biomass assessments from 2009/10 to 2014/15 fishing seasons for the West Coast. Note scales on y-axes vary. ........................................................................................... 10
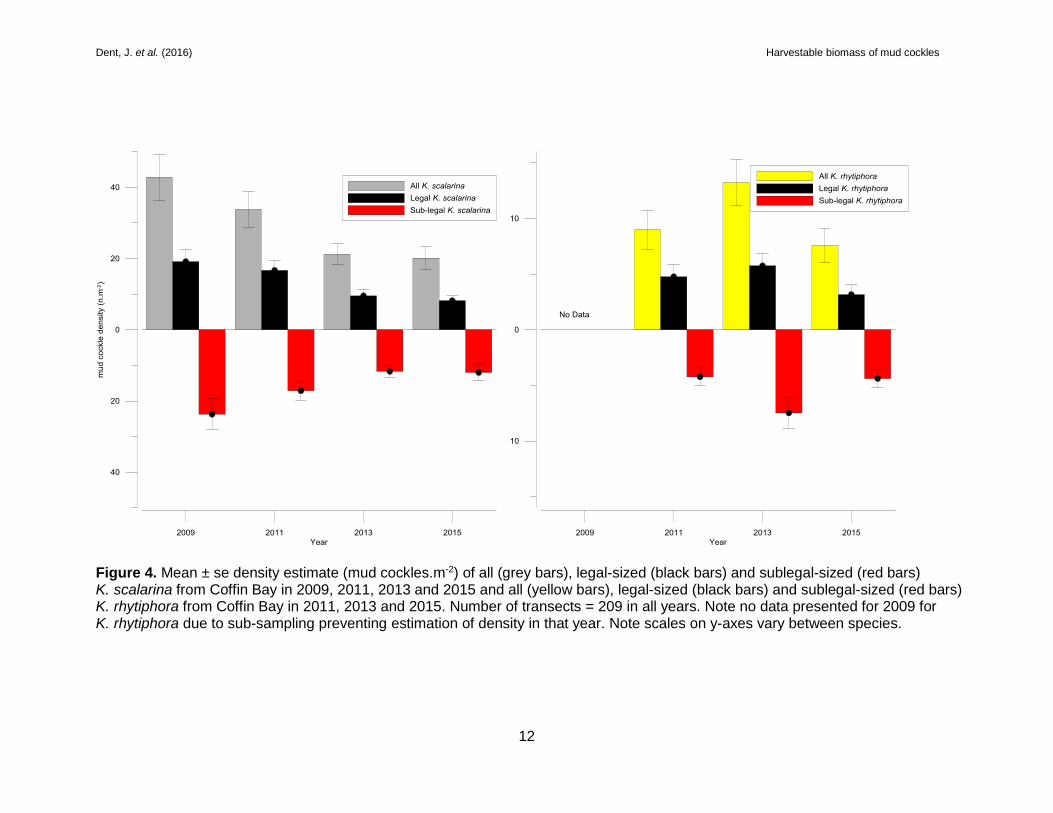
Figure 4. Mean ± se density estimate (mud cockles.m-2) of all (grey bars), legal-sized (black bars) and sublegal-sized (red bars) K. scalarina from Coffin Bay in 2009, 2011, 2013 and 2015 and all (yellow bars), legal-sized (black bars) and sublegal-sized (red bars) K. rhytiphora from Coffin Bay in 2011, 2013 and 2015. Number of transects = 209 in all years. Note no data presented for 2009 for K. rhytiphora due to sub-sampling preventing estimation of density in that year. Note scales on y-axes vary between species. .............................................................................................. 12
Figure 5. Length-frequency distributions for K. scalarina (grey bars) and K. rhytiphora (yellow bars) from Coffin Bay in 2009, 2011, 2013 and 2015. The red line indicates the current MLLs in place under a Ministerial exemption (K. scalarina 30 mm SL and K. rhytiphora 35 mm SL). Plots with blue lines represent all length data from that year, with n (number of cockles sampled) and percentage legal in blue text. Bars and black text indicate data from the consistently sampled transects (209 transects for K. rhytiphora and 33 transects for K. scalarina). Percent legal refers to the proportion of SLs ≥ MLL. Note scales on y-axes vary between species but not among years. ................................................................................................................................................. 13
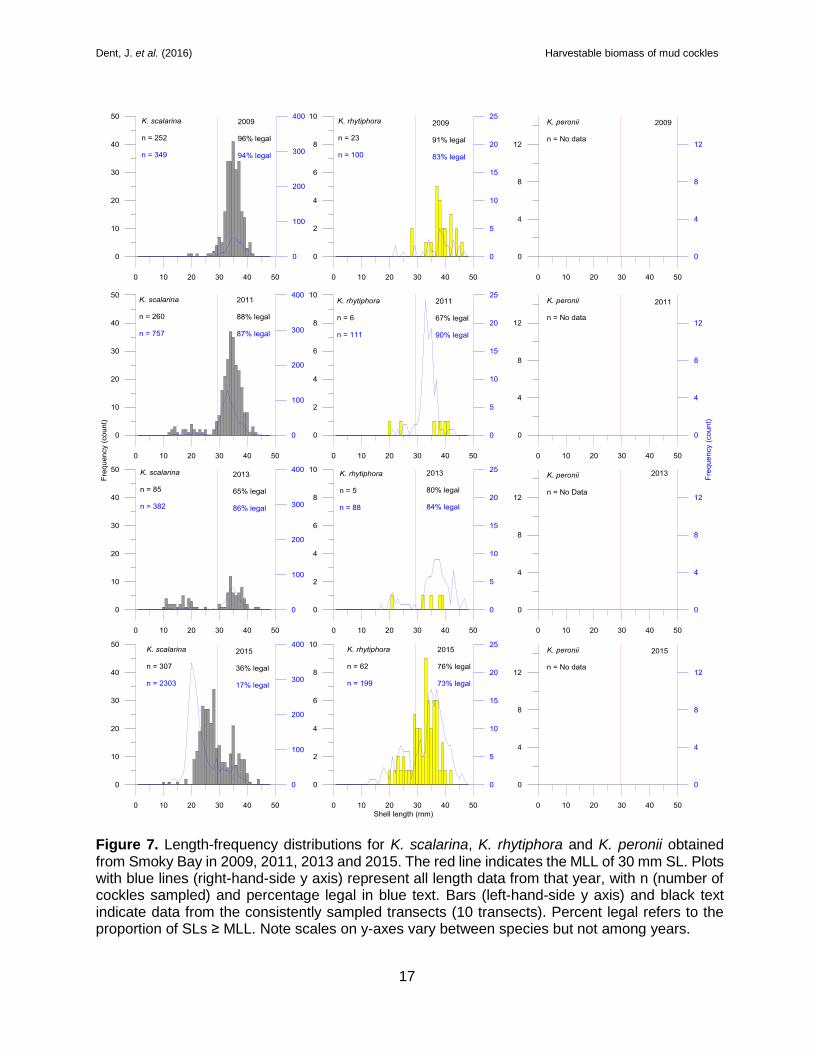
Figure 7. Length-frequency distributions for K. scalarina, K. rhytiphora and K. peronii obtained from Smoky Bay in 2009, 2011, 2013 and 2015. The red line indicates the MLL of 30 mm SL. Plots with blue lines (right-hand-side y axis) represent all length data from that year, with n (number of cockles sampled) and percentage legal in blue text. Bars (left-hand-side y axis) and black text indicate data from the consistently sampled transects (10 transects). Percent legal refers to the proportion of SLs ≥ MLL. Note scales on y-axes vary between species but not among years. ........................................................................................................................................ 17
Figure 8. Length-frequency distributions for K. scalarina, K. rhytiphora and K. peronii obtained from Streaky Bay in 2009, 2011, 2014 and 2015. The red line indicates the MLL of 30 mm SL. Plots with blue lines (right-hand-side y axis) represent all length data from that year, with n (number of cockles sampled) and percentage legal in blue text. Bars (left-hand-side y axis) and black text indicate data from the consistently sampled transects (20 transects). Percent legal refers to the proportion of SLs ≥ MLL. Note scales on y-axes vary between species but not among years. ........................................................................................................................................ 18
Figure 9. Length-frequency distributions for K. scalarina, K. rhytiphora and K. peronii obtained from Venus Bay in 2009, 2011, 2013 and 2015. The red line indicates the MLL of 30 mm SL. Plots with blue lines (right-hand-side y axis) represent all length data from that year, with n (number of

Dent, J. et al. (2016) Harvestable biomass of mud cockles
VI
cockles sampled) and percentage legal in blue text. Bars (left-hand-side y axis) and black text indicate data from the consistently sampled transects (31 transects). Percent legal refers to the proportion of SLs ≥ MLL. Note scales on y-axes vary between species but not among years. .. 19
LIST OF TABLES
Table 1. Management milestones in the South Australian mud cockle fishery ............................ 3
Table 2. Estimated harvestable biomass (t, whole weight; 10–90% quantiles) of K. scalarina, K. rhytiphora and K. peronii in Coffin Bay (A) and West Coast (B) comprised of Smoky Bay, Streaky Bay and Venus Bay between October 2015 and February 2016. .............................................. 16

Dent, J. et al. (2016) Harvestable biomass of mud cockles
VII
ACKNOWLEDGEMENTS
Funds for this research were provided by Primary Industries and Regions South Australia (PIRSA)
Fisheries and Aquaculture, obtained through licence fees. The South Australian Research and
Development Institute (SARDI) Aquatic Sciences provided substantial in-kind support. The
willingness of commercial mud cockle fishers from all zones to identify productive fishing grounds
is gratefully acknowledged. Mud cockle biomass surveys in 2015 were conducted by Matthew
Cummings, Geoff Cummings, Reece Gynell, Fred Romanowycz, Dave Sherry and Peter
Williamson. From SARDI Aquatic Sciences we thank Toby Fox for assistance with fieldwork and
processing samples, Dr Nicole Hancox for assistance with processing samples and Dr Ben
Stobart and Dr Owen Burnell for assistance with data analysis. This report was formally reviewed
by Dr Lachlan McLeay and Dr Greg Ferguson from SARDI Aquatic Sciences and Dr Belinda
McGrath-Steer from PIRSA Fisheries and Aquaculture. It was formally approved for release by
A/Prof Qifeng Ye, Science Leader; Inland Waters & Catchment Ecology, SARDI Aquatic
Sciences.

Dent, J. et al. (2016) Harvestable biomass of mud cockles
1
EXECUTIVE SUMMARY
This is the fourth report to provide estimates of harvestable biomass of mud cockles (Katelysia
spp.) across the South Australian commercial fishery. Along with the harvest strategy in the
Management Plan and previous estimates of size at maturity, these provide the most robust
information for determining appropriate total allowable commercial catches (TACCs).
The Mud Cockle Fishery consists of three fishing zones and is based on three species:
Katelysia scalarina (“greys”), K. rhytiphora (“yellows”), and K. peronii (“whites”). The current
(2015/16) TACCs in Coffin Bay and the West Coast cockle fishing zones are 50.0 t and 16.0 t,
respectively. These correspond to harvest fractions of 6.2% and 3.2% from the 2013 survey,
respectively.
Best estimates (from the 50% quantile) of harvestable biomass from the Coffin Bay fishing
zone in 2015 were 990.2 t for K. rhytiphora (≥35 mm shell length (SL)), 158.6 t for K. scalarina
(≥30 mm SL) and 0.0 t for K. peronii (≥35 mm SL). Collectively, this provided a total best
estimate of harvestable biomass of 1148.8 t. There was an 80% probability that the estimate
was at least 867.7 t.
The combined best estimate of harvestable biomass (≥30 mm SL) from the West Coast fishing
zone in October and November 2015 was 603.5 t, most of which was in Streaky Bay (50%).
The best estimates of harvestable biomass were 335.7 t for K. scalarina, 188.5 t for
K. rhytiphora and 79.3 t for K. peronii. There was an 80% probability that the total harvestable
biomass was at least 478.1 t.
The harvest strategy for the fishery allows a maximum harvest fraction of 7.5% (at the 80%
quantile) permitting a maximum TACC in the Coffin Bay fishing zone of 65.1 t and 35.9 t for
the West Coast fishing zone. Maintaining the 2015/16 TACC in the Coffin Bay (50.0 t) and
West Coast (16.0 t) cockle fishing zones, would translate to harvest fractions of 5.8% and
3.3%, respectively.
The collective evidence of high harvestable biomass, low current exploitation rates and recent
evidence of recruitment indicates that the stocks in the Coffin Bay and West Coast mud cockle
fisheries are unlikely to be recruitment overfished and that current levels of fishing pressure
are unlikely to cause these to become recruitment overfished. Using the national framework
for stock status reporting (Flood et al. 2014), the Coffin Bay and West Coast mud cockle
fisheries are classified as ‘sustainable’.

Dent, J. et al. (2016) Harvestable biomass of mud cockles
2
1. INTRODUCTION
1.1 Background
This is the fourth report on the harvestable biomass of mud cockles in South Australia and
follows from Gorman et al. (2010) and Dent et al. (2012, 2014). The objective of this report
is to provide an estimate of harvestable biomass of mud cockles in the Coffin Bay and
West Coast fishing zones (hereafter referred to as Coffin Bay and West Coast,
respectively). Information on changes in mud cockle density and population structure
through time, as well as catch history, is also provided. Collectively, this information will
be used in conjunction with the harvest strategy to establish TACCs for the 2016/17 fishing
season.
The genus Katelysia (Family Veneridae), commonly known as mud cockles or vongole, is
a group of commercially important bivalves that comprise a major faunal component of
shallow estuarine and marine embayments (Roberts 1984). In Australia, the genus is
represented by three species – Katelysia scalarina (Lamarck 1818) known as “greys”,
K. rhytiphora (Lamy 1835) known as “yellows” and K. peronii (Lamarck 1818) known as
“whites” – all of which are broadly distributed around the temperate coastline from
Augusta, Western Australia to Port Jackson, New South Wales (Roberts 1984).
Mud cockles have been harvested in South Australia since the early 1960s, with
management arrangements changing throughout that 55-year period (see Table 1). Prior
to 1985, most of the catch was obtained from the Port River and Kangaroo Island for use
as bait. Since then, mud cockles have largely been used for human consumption,
particularly in Melbourne. Despite increasing demand, the fishery remained lightly
exploited until 1995/96, when the State-wide annual catch first exceeded 50 t. From
1996/97, catches increased rapidly to a peak of 375 t in 2005/06. Most of the catch during
this period was obtained from the Port River and Coffin Bay. Given the large number of
licenses (>600) with access to the resource and the rapid increases in catch, concerns for
the sustainability of the fishery were raised, which led to implementation of a quota
management system across the three cockle fishing zones (Port River, Coffin Bay and
West Coast; Figure 1) in October 2008.
The initial total allowable commercial catch (TACC) in 2008/09 was based primarily on
catch history. The combined TACC for all zones in 2008/09 was 195 t. Of this, 171 t

Dent, J. et al. (2016) Harvestable biomass of mud cockles
3
(including the catch used as bait and berley) was landed with a value of AU$1.28M (Knight
and Tsolos 2012). In 2009/10, advice from fishers (West Coast and Coffin Bay) and survey
estimates of biomass (Port River fishing zone) led to concerns over fishing sustainability
and TACCs were reduced in all three cockle fishing zones (Table 1).
Following the first assessment of harvestable biomass (Gorman et al. 2010), TACCs for
2010/11 were set at 11.3 t for the Port River, 48.1 t for Coffin Bay and 21.0 t for the West
Coast (total 80.4 t). In response to further concerns around sustainability, the Mud Cockle
Fishery in the Port River was closed from 1 July 2011, while the TACC for the West Coast
was reduced for the 2011/12 season (Table 1). In the 2015/16 fishing season, the TACC
for Coffin Bay was increased to 50 t (6.2% harvest fraction), while the TACC for the West
Coast was 16.0 t (3.2% harvest fraction) for the 2014/15 and 2015/16 fishing seasons. In
Coffin Bay, the MLLs for K. scalarina and K. rhytiphora were reduced in 2012 and 2015,
respectively (Table 1), following a re-analysis of size at maturity.
Table 1. Management milestones in the South Australian Mud Cockle Fishery
Date Milestone
1960 Fishery started
Minimum legal length (MLL) set at 30 mm shell length (SL) state wide
1990 MLL at Coffin Bay increased to 38 mm SL for all three Katelysia species
2005 State wide catches peaked at 375 t
2008 TACCs introduced; 100.0 t Port River, 70.0 t Coffin Bay and 25.0 t West Coast
2009 TACCs reduced to 22.6 t Port River, 56.0 t Coffin Bay and 15.0 t West Coast
2010 MLL at Coffin Bay reduced to 33 mm SL for all three species by ministerial exemption (ME)
2010 TACCs amended to 11.3 t Port River, 48.1 t Coffin Bay and 21.0 t West Coast
2010 Trial to harvest cockles at Coffin Bay in the ratio they exist (yellow to grey cockles 2:1)
2011 Port River mud-cockle fishery closed due to concerns over sustainability
2011 TACCs amended to 48.1 t Coffin Bay and 18.0 t for West Coast
2012 TACCs increased to 50.0 t Coffin Bay and 18.5 t West Coast
2012 MLL for K. scalarina at Coffin Bay reduced to 30 mm SL by ME
2012 MLLs for K. rhytiphora and K. peronii at Coffin Bay returned to legislated 38 mm SL
2013 New Management Plan for SA commercial marine scalefish fishery (PIRSA 2013)
2014 TACCs reduced to 46.0 t Coffin Bay and 16.0 t West Coast
2015 TACC for Coffin Bay increased to 50.0 t
2015 MLL for K. rhytiphora and K. peronii at Coffin Bay amended to 35 mm SL by ME

Dent, J. et al. (2016) Harvestable biomass of mud cockles
4
Figure 1. Map showing locations of commercial cockle fishing zones in South Australia: Port River, Coffin Bay and the West Coast. The West Coast zone comprises Smoky Bay (1), Streaky Bay (2) and Venus Bay (3).

Dent, J. et al. (2016) Harvestable biomass of mud cockles
5
2. METHODS
The focus of the study was to provide estimates of the harvestable biomass of mud cockles
(i.e. ≥ MLL) within two of the three commercial mud cockle fishing zones: Coffin Bay and
the West Coast. The West Coast comprises Smoky Bay, Streaky Bay and Venus Bay
(Figure 1). Surveys of mud cockles were undertaken in bounded, stratified survey regions
of Coffin Bay in October and November 2015, and January and February 2016. These
data were pooled and are referred to as 2015. For the West Coast, surveys were
undertaken in October and November 2015.
2.1 Catch statistics
Commercial fishers provide daily data on catch, effort and fishing location. Since 2010/11,
Coffin Bay fishers have also been able to voluntarily report the catch by species. Using all
available records, the daily catch data were aggregated within financial year, by species
and location. These data were used to determine the percentage of the catch between
species (Coffin Bay) and among fishing grounds (West Coast).
2.2 Survey design and transect location
The overall survey design was consistent with previous assessments of the mud cockle
resource in South Australia (Gorman et al. 2010; 2011; Dent et al. 2012; 2014) and
integrated design principles of fishery-independent research with knowledge obtained
from commercial fishers. This approach is similar to that undertaken for the South
Australian Abalone Fishery (Mayfield et al. 2008; 2009). Within each cockle fishing zone,
fishers identified areas of high and low productivity in the fishing grounds on large-scale
aerial photographs. This information was digitized using a Geographic Information System
package (ArcGIS V10.3.1) and used to identify areas of high and low density strata. Maps
depicting areas of varying mud cockle density were generated and returned to fishers for
confirmation. Point sampling locations (transects) were then distributed systematically
within the high and low density strata comprising each survey region. To improve survey
precision, sampling intensity was greater in areas with expected high densities of mud
cockles (high density strata, transects separated by 30-100 m) than those of expected low
densities of mud cockles (low density strata, transects separated by 250-360 m).
Surveys of the mud cockle resource are undertaken biennially. In 2015, the Coffin Bay
survey comprised twelve strata, while that for the West Coast survey comprised 23 strata:
nine in Smoky Bay, three in Streaky Bay and sixteen in Venus Bay. In Coffin Bay, there

Dent, J. et al. (2016) Harvestable biomass of mud cockles
6
have been several changes to the survey design since the first survey in 2009. These
include (1) exclusion of several previously surveyed areas, resulting in a reduction in area
of the low density strata; and (2) incorporation of additional survey areas, notably near to
“Dead Man’s Corner” in the north-western part of Coffin Bay. Collectively, these changes
were made to exclude/include areas on the basis of their perceived status as commercial
viability. This approach increased the efficiency of the survey.
Several changes to the West Coast survey areas have also been implemented over time.
These include (1) incorporation of additional areas at Smoky Bay in 2013 and 2015; and
(2) incorporation of additional and removal of one area at Streaky Bay in 2013. The Venus
Bay survey design has had the most substantial changes in recent years with areas both
removed and added in 2011 and 2013, and several areas added in 2015 to capture fishing
grounds for K. peronii and K. rhytiphora. The latter changes were implemented following
advice from fishers that cockles without clean shells were now highly marketable and
commonly targeted.
2.3 Survey methods
The fishery-independent surveys were conducted by survey teams which included a South
Australian Research and Development Institute (SARDI) observer and a commercial
fisher. Sampling was done at fixed sites selected prior to the commencement of surveys
and located using coordinates (latitude, longitude) stored in handheld global positioning
system (GPS) units. At each sampling site a commercial fisher used a cockle rake (~40
cm in width by ~20 cm in height) with a mesh bag insert (2 cm diagonal mesh size) to
collect mud cockles along a transect length of 2 m (i.e. ~0.8 m2). Samples were sieved
through 7 mm square mesh in the base of a plastic crate to remove sand. Live and dead
mud cockles were bagged, labelled and frozen for subsequent processing in the
laboratory.
In the laboratory, each sample was sorted to remove dead shells and identify mud cockles
to species (after Edwards 1999). For the West Coast, samples were separated into legal
(≥30 mm shell length (SL)) and sublegal-sized (<30 mm SL) components using digital
calipers. For Coffin Bay, all species were split into legal and sublegal-sized components
(K. scalarina <30 mm SL and ≥30 mm SL; K. rhytiphora and K. peronii <35 mm SL and
≥35 mm SL). Mud cockles in each size category were counted and weighed to the nearest
gram.
Dent, J. et al. (2016) Harvestable biomass of mud cockles
7
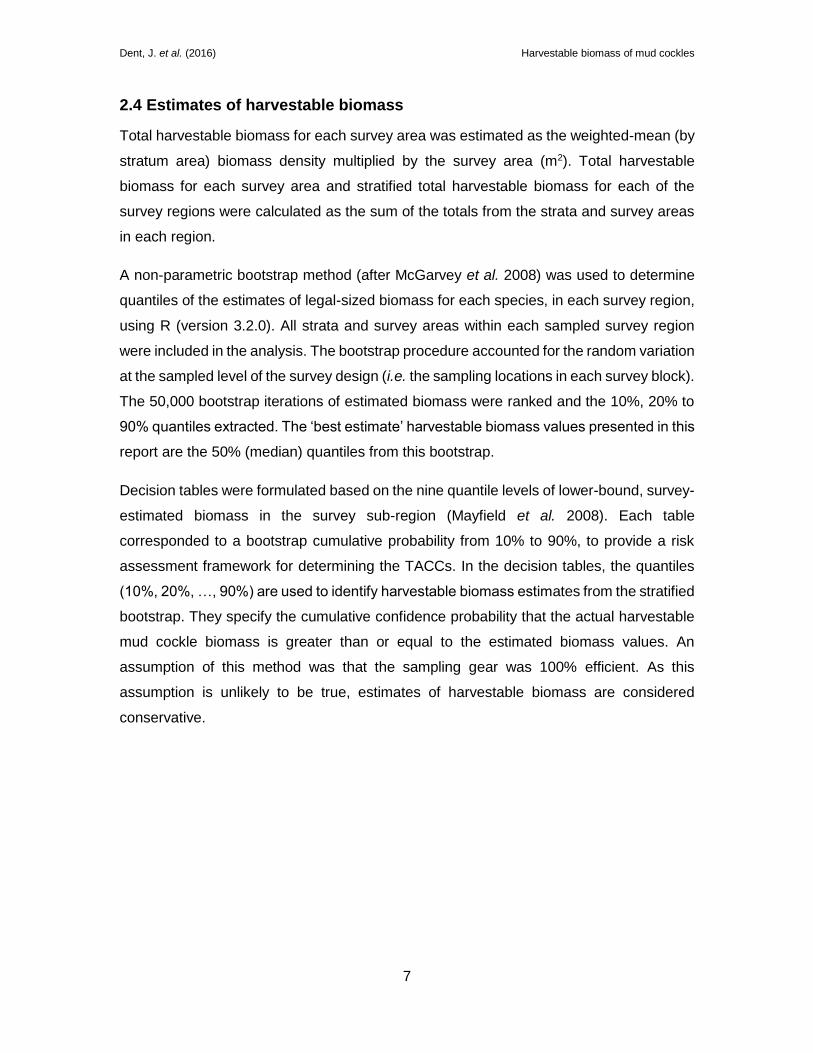
2.4 Estimates of harvestable biomass
Total harvestable biomass for each survey area was estimated as the weighted-mean (by
stratum area) biomass density multiplied by the survey area (m2). Total harvestable
biomass for each survey area and stratified total harvestable biomass for each of the
survey regions were calculated as the sum of the totals from the strata and survey areas
in each region.
A non-parametric bootstrap method (after McGarvey et al. 2008) was used to determine
quantiles of the estimates of legal-sized biomass for each species, in each survey region,
using R (version 3.2.0). All strata and survey areas within each sampled survey region
were included in the analysis. The bootstrap procedure accounted for the random variation
at the sampled level of the survey design (i.e. the sampling locations in each survey block).
The 50,000 bootstrap iterations of estimated biomass were ranked and the 10%, 20% to
90% quantiles extracted. The ‘best estimate’ harvestable biomass values presented in this
report are the 50% (median) quantiles from this bootstrap.
Decision tables were formulated based on the nine quantile levels of lower-bound, survey-
estimated biomass in the survey sub-region (Mayfield et al. 2008). Each table
corresponded to a bootstrap cumulative probability from 10% to 90%, to provide a risk
assessment framework for determining the TACCs. In the decision tables, the quantiles
(10%, 20%, …, 90%) are used to identify harvestable biomass estimates from the stratified
bootstrap. They specify the cumulative confidence probability that the actual harvestable
mud cockle biomass is greater than or equal to the estimated biomass values. An
assumption of this method was that the sampling gear was 100% efficient. As this
assumption is unlikely to be true, estimates of harvestable biomass are considered
conservative.

Dent, J. et al. (2016) Harvestable biomass of mud cockles
8
2.5 Temporal change in mud cockle density and stock structure
Changes in the estimates of harvestable biomass among years reflect changes in the area
surveyed, MLLs and mud cockle density. To evaluate temporal changes in legal and
sublegal-sized mud cockle density in Coffin Bay and for each of the bays comprising the
West Coast, historical density estimates were re-calculated using (1) only those transects
sampled in all years; and (2) current size limits for each species. The numbers of
consistent transects used in this analysis were 209 at Coffin Bay, 10 at Smoky Bay, 20 at
Streaky Bay and 31 at Venus Bay. Due to historical sub-sampling and multiple changes
in the MLL for K. rhytiphora over time at Coffin Bay, estimates of density for 2009 could
not be calculated. In all other years, K. rhytiphora density estimates were calculated using
length frequency data to allow comparisons among years. For Streaky Bay, the November
2013 survey data were ignored and the February 2014 data were used. This was done
because Streaky Bay was re-surveyed in February 2014 following a mortality event in
January 2014 (Dent et al. 2014). Data presented are mean ± SE. Following data
transformation (SQRT(X+1)) one-way ANOVA outputs from PERMANOVA followed by
testing of pairwise outcomes using uncorrected SNK was used to evaluate statistically
significant differences in densities between years.
Digital calipers were used to measure all individuals to the nearest 0.1 mm along the
longest axis (SL) following previous methods (Gorman et al. 2010; Dent et al. 2012; 2014).
Historically, large sample sizes from Coffin Bay necessitated sub-sampling. However, in
2015, all mud cockles from Coffin Bay were measured to facilitate sample processing and
provide robust comparisons among years. Similarly to the estimates of density, the length-
frequency data from only those transects sampled in all years for the West Coast and from
2011 to 2015 for Coffin Bay were used to evaluate changes in population size composition
among surveys (Gorman et al. 2010; Dent et al. 2012; 2014). For K. rhytiphora at Coffin
Bay, data from 2009 were excluded because of sampling methodology changes between
2009 and 2011. As above for Streaky Bay, the November 2013 survey data were ignored
and the February 2014 data were used.

Dent, J. et al. (2016) Harvestable biomass of mud cockles
9
3. RESULTS
3.1 Fishery Statistics
The total catch over the past five seasons has been stable at ~50 t, reflecting the annual
TACC. Since 2010/11, the relative proportions of K. scalarina and K. rhytiphora in the
catch from Coffin Bay have varied among years with, respectively, a general reduction
and increase in the relative proportions of these two species. However, as a high
proportion of the catch is recorded as ‘mud cockle’ (e.g. 37.5% in 2014/15) rather than by
species, the species composition of the catch remains poorly understood.
For catches from Coffin Bay where the species of mud cockle was also reported, the
proportional contribution by each species to the catch did not correspond with results from
the fishery independent surveys (Figure 2). For example in the 2010/11 and 2011/12
fishing seasons, ~30% of the reported catch consisted of K. scalarina, while the
harvestable biomass contribution from this species was estimated at ~10%. Since
2012/13, the proportion of K. scalarina in the harvestable biomass has exceeded its
proportion on the catch. The opposite trend was evident for K. rhytiphora.
The total catches from the West Coast since 2010/11 have been relatively stable at
approximately 20 t.yr-1, reflecting the TACC. The spatial distribution of catch among the
three bays comprising the West Coast has varied among years, particularly between
Venus Bay and Streaky Bay. For Smoky Bay, catches have been consistently low (range:
0% to 14% of West Coast catch). The distribution of catches was poorly correlated with
the levels of harvestable biomass among the three bays (Figure 3.) Notably, harvests at
Smoky Bay have been much lower than the percentage contribution to the harvestable
biomass from this area, with the reverse trend evident for Streaky Bay and Venus Bay.

Dent, J. et al. (2016) Harvestable biomass of mud cockles
10
Figure 2. Percentage (%) of catch comprising K. scalarina (A; grey bars) and K. rhytiphora (B; yellow bars) and percentage of harvestable biomass (black bars) from previous biomass assessments from 2010/11 to 2014/15 fishing seasons in Coffin Bay. Note scales on y-axes vary.
Figure 3. Percentage (%) of catch harvested from Smoky Bay (A; brown bars), Streaky Bay (B; green bars) and Venus Bay (C; blue bars), and percentage of harvestable biomass (black bars) from previous biomass assessments from 2009/10 to 2014/15 fishing seasons for the West Coast. Note scales on y-axes vary.

Dent, J. et al. (2016) Harvestable biomass of mud cockles
11
3.2 Coffin Bay
A total of 5,375 mud cockles were obtained from 223 transects in Coffin Bay. The dominant
species was K. scalarina (number of cockles (n) = 3,244; ~60%), followed by K. rhytiphora
(n=2,113; ~39%) and K. peronii (n=18; ~1%). Legal-sized K. rhytiphora (≥35 mm SL) and
K. scalarina (≥30 mm SL) individuals were observed in eight of the twelve strata. Sublegal-
sized individuals of K. rhytiphora and K. scalarina were collected from ten and nine of the
twelve strata, respectively. Sublegal-sized (<35 mm SL) K. peronii were observed in two
of the twelve strata surveyed, but no legal-sized individuals were sampled from Coffin Bay.
In 2015, the mean estimates of density for legal and sublegal-sized K. scalarina in 2015,
from the 209 transects consistently sampled since 2009, were 8.2±1.6 and 12.0±2.3 mud
cockles.m-2, respectively (Figure 4). These were similar to 2013 values (legal-sized:
9.5±1.8; sub-legal-sized: 11.7±1.7), but significantly lower, than the mean density
estimates in 2009 (legal-sized: 19.2±3.3; sublegal-sized: 23.7±4.3; F = 5.5, P < 0.01 and
F = 2.8, P < 0.05, respectively). For legal-sized and sublegal-sized K. rhytiphora, the mean
estimates of density in 2015 were 3.2±0.9 and 4.4±0.8 mud cockles.m-2, respectively.
Aside from elevated mean densities in 2013, there were no obvious temporal trends in the
densities of either legal-sized or sublegal-sized K. rhytiphora in Coffin Bay.
The best estimate (50% probability) of total harvestable biomass for all species in Coffin
Bay was 1,148.8 t. The majority of the biomass comprised K. rhytiphora (990.2 t, ~86%;
MLL ≥35 mm SL) with a smaller contribution from K. scalarina (158.6 t, ~14%; MLL ≥30
mm SL). No legal-sized individuals (MLL ≥35 mm SL) of K. peronii were observed,
therefore, the biomass estimate was 0 t (Table 2).
In 2015, legal-sized (≥ 30 mm SL) K. scalarina comprised 55% of the sample. This was
similar to the values observed in 2011 and 2013 (Figure 5) and indicates some recruitment
has occurred for this species. Length frequency data for both 2011 (22-28 mm SL) and
2015 (16-18 mm SL) indicate the presence of pre-recruits (sublegal-sized mud cockles) in
the population in these years. Legal-sized (>35 mm SL) K. rhytiphora comprised 53% of
the sample collected in 2015, which was similar to that in 2011 and 2013 (Figure 5). Length
frequency data in 2011 (18-24 mm SL) and 2015 (20-25 mm SL) also support the presence
of pre-recruits in the population.
Dent, J. et al. (2016) Harvestable biomass of mud cockles
12
Figure 4. Mean ± se density estimate (mud cockles.m-2) of all (grey bars), legal-sized (black bars) and sublegal-sized (red bars) K. scalarina from Coffin Bay in 2009, 2011, 2013 and 2015 and all (yellow bars), legal-sized (black bars) and sublegal-sized (red bars) K. rhytiphora from Coffin Bay in 2011, 2013 and 2015. Number of transects = 209 in all years. Note no data presented for 2009 for K. rhytiphora due to sub-sampling preventing estimation of density in that year. Note scales on y-axes vary between species.

Dent, J. et al. (2016) Harvestable biomass of mud cockles
13
Figure 5. Length-frequency distributions for K. scalarina (grey bars) and K. rhytiphora (yellow bars) from Coffin Bay in 2009, 2011, 2013 and 2015. The red line indicates the current MLLs in place under a Ministerial exemption (K. scalarina 30 mm SL and K. rhytiphora 35 mm SL). Plots with blue lines represent all length data from that year, with n (number of cockles sampled) and percentage legal in blue text. Bars and black text indicate data from the consistently sampled transects (209 transects for K. rhytiphora and 33 transects for K. scalarina). Percent legal refers to the proportion of SLs ≥ MLL. Note scales on y-axes vary between species but not among years.
Dent, J. et al. (2016) Harvestable biomass of mud cockles
14
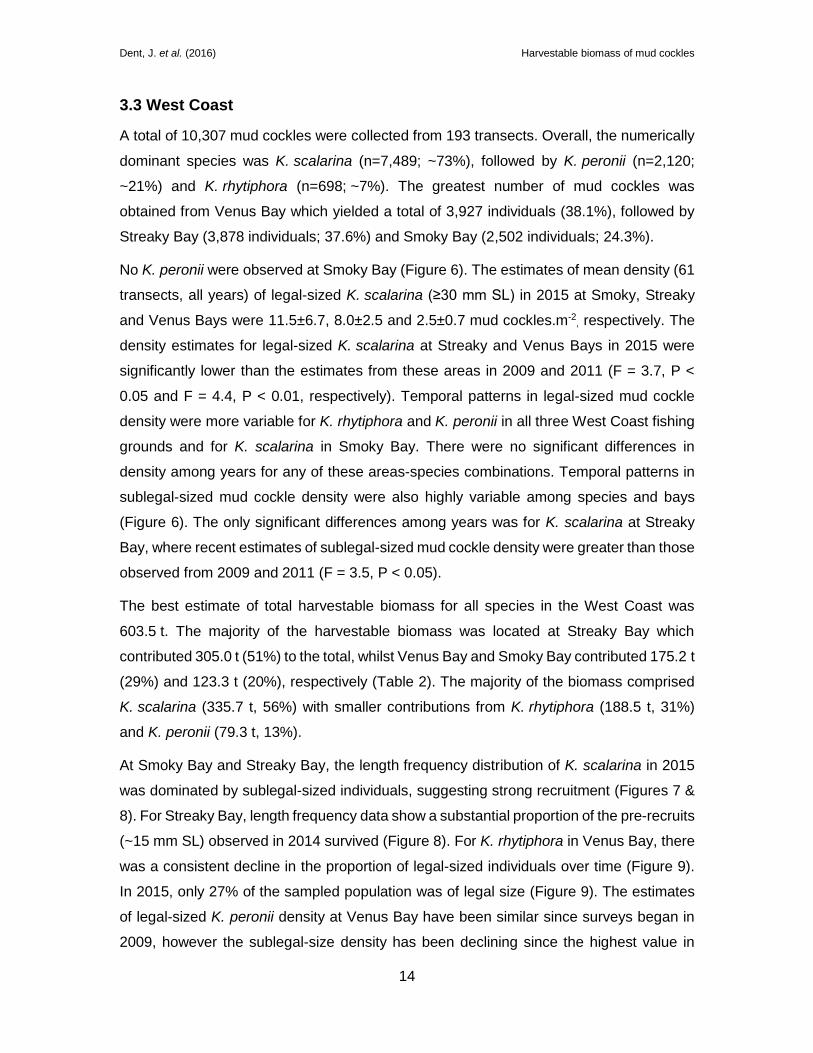
3.3 West Coast
A total of 10,307 mud cockles were collected from 193 transects. Overall, the numerically
dominant species was K. scalarina (n=7,489; ~73%), followed by K. peronii (n=2,120;
~21%) and K. rhytiphora (n=698; ~7%). The greatest number of mud cockles was
obtained from Venus Bay which yielded a total of 3,927 individuals (38.1%), followed by
Streaky Bay (3,878 individuals; 37.6%) and Smoky Bay (2,502 individuals; 24.3%).
No K. peronii were observed at Smoky Bay (Figure 6). The estimates of mean density (61
transects, all years) of legal-sized K. scalarina (≥30 mm SL) in 2015 at Smoky, Streaky
and Venus Bays were 11.5±6.7, 8.0±2.5 and 2.5±0.7 mud cockles.m-2, respectively. The
density estimates for legal-sized K. scalarina at Streaky and Venus Bays in 2015 were
significantly lower than the estimates from these areas in 2009 and 2011 (F = 3.7, P <
0.05 and F = 4.4, P < 0.01, respectively). Temporal patterns in legal-sized mud cockle
density were more variable for K. rhytiphora and K. peronii in all three West Coast fishing
grounds and for K. scalarina in Smoky Bay. There were no significant differences in
density among years for any of these areas-species combinations. Temporal patterns in
sublegal-sized mud cockle density were also highly variable among species and bays
(Figure 6). The only significant differences among years was for K. scalarina at Streaky
Bay, where recent estimates of sublegal-sized mud cockle density were greater than those
observed from 2009 and 2011 (F = 3.5, P < 0.05).
The best estimate of total harvestable biomass for all species in the West Coast was
603.5 t. The majority of the harvestable biomass was located at Streaky Bay which
contributed 305.0 t (51%) to the total, whilst Venus Bay and Smoky Bay contributed 175.2 t
(29%) and 123.3 t (20%), respectively (Table 2). The majority of the biomass comprised
K. scalarina (335.7 t, 56%) with smaller contributions from K. rhytiphora (188.5 t, 31%)
and K. peronii (79.3 t, 13%).
At Smoky Bay and Streaky Bay, the length frequency distribution of K. scalarina in 2015
was dominated by sublegal-sized individuals, suggesting strong recruitment (Figures 7 &
8). For Streaky Bay, length frequency data show a substantial proportion of the pre-recruits
(~15 mm SL) observed in 2014 survived (Figure 8). For K. rhytiphora in Venus Bay, there
was a consistent decline in the proportion of legal-sized individuals over time (Figure 9).
In 2015, only 27% of the sampled population was of legal size (Figure 9). The estimates
of legal-sized K. peronii density at Venus Bay have been similar since surveys began in
2009, however the sublegal-size density has been declining since the highest value in

Dent, J. et al. (2016) Harvestable biomass of mud cockles
15
2011. Evaluating temporal changes in the length frequency distributions of K. rhytiphora
and K. peronii in the West Coast was impeded by small sample sizes in most years.
K. scalarina K. rhytiphora K. peronii
Figure 6. Mean ± se of density estimates (mud cockles.m-2) of all, legal-sized (black bars) and sublegal-sized (red bars) mud cockles in the West Coast cockle fishing zone at Smoky Bay (A; n=10) and Venus Bay (C; n=31) for 2009, 2011, 2013 and 2015. For Streaky Bay (B; n=20) in 2009, 2011, 2014 and 2015. Denisty of all K. scalarina (grey bars), all K. rhytiphora (yellow bars) and all K. peronii (white bars). Note scales on y-axes vary between species and sites.

Dent, J. et al. (2016) Harvestable biomass of mud cockles
16
Table 2. Estimated harvestable biomass (t, whole weight; 10–90% quantiles) of K. scalarina, K. rhytiphora and K. peronii in Coffin Bay (A) and West Coast (B) comprised of Smoky Bay, Streaky Bay and Venus Bay between October 2015 and February 2016. Bold indicates total harvestable biomass estimates, by species, for each fishing zone.
A Coffin Bay
Probability (%) of legal biomass estimate (t) species
90% 80% 70% 60% 50% 40% 30% 20% 10%
K. scalarina (30 mm) 126.4 136.9 144.9 151.9 158.6 165.6 173.4 182.5 195.6 K. rhytiphora (35 mm) 603.4 730.8 825.3 909.5 990.2 1072.5 1163.8 1270.0 1427.8 K. peronii (35 mm) 0.0 0.0 0.0 0.0 0.0 0.0 0.0 0.0 0.0
Total 729.8 867.7 970.2 1061.3 1148.8 1238.1 1337.2 1452.5 1623.4
B West Coast MLL 30 mm SL
Probability (%) of legal biomass estimate (t) species
90% 80% 70% 60% 50% 40% 30% 20% 10%
K. scalarina 250.2 278.2 299.4 317.9 335.6 353.8 373.0 396.4 429.2 K. rhytiphora 119.6 141.8 159.1 174.0 188.5 202.9 218.7 237.4 263.3 K. peronii 48.4 58.1 65.8 72.4 79.3 85.3 93.2 102.3 115.2
Total 418.2 478.1 524.3 564.3 603.5 642.0 685.0 736.0 807.7
Smoky Bay MLL 30 mm SL
Probability (%) of legal biomass estimate (t) species
90% 80% 70% 60% 50% 40% 30% 20% 10%
K. scalarina 55.1 63.1 69.6 75.2 80.4 85.9 91.6 98.5 108.3 K. rhytiphora 26.2 31.6 35.7 39.3 42.9 46.5 50.6 55.3 61.8 K. peronii 0.0 0.0 0.0 0.0 0.0 0.0 0.0 0.0 0.0
Streaky Bay MLL 30 mm SL
Probability (%) of legal biomass estimate (t) species
90% 80% 70% 60% 50% 40% 30% 20% 10%
K. scalarina 125.0 140.2 151.6 161.6 171.1 180.8 191.2 203.9 221.6 K. rhytiphora 82.0 97.3 109.4 119.7 129.7 139.5 150.3 163.0 180.7 K. peronii 0.1 1.3 2.5 3.1 4.2 4.3 5.6 6.9 8.5
Venus Bay MLL 30 mm SL
Probability (%) of legal biomass estimate (t) species
90% 80% 70% 60% 50% 40% 30% 20% 10%
K. scalarina 70.0 74.8 78.2 81.2 84.1 87.0 90.2 94.0 99.3 K. rhytiphora 11.4 12.9 14.0 15.0 15.9 16.9 17.9 19.1 20.9 K. peronii 48.3 56.8 63.3 69.3 75.1 81.0 87.7 95.4 106.7
Dent, J. et al. (2016) Harvestable biomass of mud cockles
17
Figure 7. Length-frequency distributions for K. scalarina, K. rhytiphora and K. peronii obtained from Smoky Bay in 2009, 2011, 2013 and 2015. The red line indicates the MLL of 30 mm SL. Plots with blue lines (right-hand-side y axis) represent all length data from that year, with n (number of cockles sampled) and percentage legal in blue text. Bars (left-hand-side y axis) and black text indicate data from the consistently sampled transects (10 transects). Percent legal refers to the proportion of SLs ≥ MLL. Note scales on y-axes vary between species but not among years.

Dent, J. et al. (2016) Harvestable biomass of mud cockles
18
Figure 8. Length-frequency distributions for K. scalarina, K. rhytiphora and K. peronii obtained from Streaky Bay in 2009, 2011, 2014 and 2015. The red line indicates the MLL of 30 mm SL. Plots with blue lines (right-hand-side y axis) represent all length data from that year, with n (number of cockles sampled) and percentage legal in blue text. Bars (left-hand-side y axis) and black text indicate data from the consistently sampled transects (20 transects). Percent legal refers to the proportion of SLs ≥ MLL. Note scales on y-axes vary between species but not among years.

Dent, J. et al. (2016) Harvestable biomass of mud cockles
19
Figure 9. Length-frequency distributions for K. scalarina, K. rhytiphora and K. peronii obtained from Venus Bay in 2009, 2011, 2013 and 2015. The red line indicates the MLL of 30 mm SL. Plots with blue lines (right-hand-side y axis) represent all length data from that year, with n (number of cockles sampled) and percentage legal in blue text. Bars (left-hand-side y axis) and black text indicate data from the consistently sampled transects (31 transects). Percent legal refers to the proportion of SLs ≥ MLL. Note scales on y-axes vary between species but not among years.

Dent, J. et al. (2016) Harvestable biomass of mud cockles
20
DISCUSSION
4.1 Status of the South Australian Mud Cockle Fishery
Optimising harvests in multi-species, spatially-structured fisheries is challenging and typically
requires information on the composition, distribution, abundance, biomass and biology of the
component species (Mangel et al. 1996; Haddon et al. 2006). The complexities in developing
appropriate harvest strategies for the South Australian Mud Cockle Fishery was exhibited in the
large reductions in TACCs first introduced in 2008/09 based on available catch history data, then
modified following fishery independent surveys introduced in 2009 that provided the first estimates
of harvestable biomass (Gorman et al. 2010; 2011).
The information presented in this report, which is the fourth to document the results of fishery
independent surveys across the spatial extent of the fishery, remains the most suitable for
informing management decisions relating to TACCs and MLLs (Mayfield et al. 2008; McGarvey
et al. 2008; Gorman et al. 2010; 2011; Dent et al. 2012; 2014). The estimates of harvestable
biomass and measures of size at maturity (SAM50) obtained in these studies provide the most
robust information for setting TACCs (Mayfield et al. 2008, 2009; McGarvey et al. 2008) because
(1) the precision of the biomass estimates was optimised by targeting survey effort into productive
fishing grounds identified by commercial fishers, with less sampling effort in less productive areas
(Ault et al. 1999); and (2) measures of SAM50 have been obtained from large sample sizes
(>3,000 and >700 mud cockles) across Coffin Bay and the West Coast, respectively (Gorman et
al. 2010; Dent et al. 2012). When applying this information for determining management
arrangements for the fishery, consideration also needs to be made of the risk of depletion of
populations in these fisheries (Ripley and Caswell 2006). Biomass declines have been shown to
occur in cockle fisheries as a result of fluctuating abundance due to episodic recruitment (Warner
and Chesson 1985; Sakurai et al. 1998; Ripley and Caswell 2006). For example, in Coffin Bay,
modes of small individuals in size structures that indicated recruitment of K. scalarina in 2011 and
2015 were not observed in 2009 or 2013.
There is, however, some uncertainty in the assessment of harvestable biomass, population
structure and stock status. First, transects are sampled by commercial fishers using cockle rakes
of varying design, in addition to assumed differences in operator efficiency. Differences in rake-
width among fishers are accounted for by standardising density results to an area of one square
metre, but potential differences in operator efficiency are ignored. Second, the length-frequency

Dent, J. et al. (2016) Harvestable biomass of mud cockles
21
distributions do not account for “stunting”. This is where animals do not achieve the average
maximum size for that species, resulting in many individuals failing to reach the MLL, as has been
observed for abalone (Saunders and Mayfield 2008). While this makes interpreting future
recruitment levels difficult because ‘stunted’ and sublegal-sized cockles are indistinguishable,
these ‘stunted’ cockles likely contribute to the spawning biomass. Third, the current Management
Plan (PIRSA 2013) does not identify performance indicators or limit reference points below which
the stock would be classified as ‘recruitment overfished’ under the national stock status framework
(Flood et al. 2014). Future selection of appropriate performance indicators and reference points
should consider estimates of density and biomass across species and fishing grounds. The
absence of a definition for ‘recruitment overfished’ means this assessment uses a ‘weight-of-
evidence’ approach to determine stock status.
The MLLs and TACCs are the primary tools used to manage exploitation of mud cockles in South
Australia. The TACC is determined as a fraction of the harvestable biomass estimate (at the 80%
quantile), up to a maximum of 7.5% (PIRSA 2013). Surveys are currently undertaken biennially,
requiring annual TACC review using fisher information. The biennial surveys undertaken from
2009 to 2015 will be replaced with triennial surveys starting in 2016/17; approximately one third
of Coffin Bay and the West Coast will be surveyed each year. This will result in additional
uncertainty in the harvestable biomass and recruitment levels – known to be episodic – due to
the increased time period between surveys.
The annual TACCs for the Mud Cockle Fishery have been determined from an aggregated
estimate of legal-sized biomass for each species across all fishing grounds. Recent differences
in the temporal trends in densities among species and fishing grounds and differing exploitation
rates across these may compromise future sustainability of the fishery. Management
arrangements that match harvest levels to species and/or area-specific productivity has the
potential to mitigate localised high and/or unsustainable exploitation rates on species, fishing
grounds or a combination of these.
4.1.1 Coffin Bay
In the 2014/15 and 2015/16 fishing seasons, the TACC for Coffin Bay was 46.0 t and 50.0 t
respectively, which represented a 5.7% and 6.2% harvest fraction, respectively, from the 80%
quantile of the biomass estimate in 2013. Thus, recent total catches from Coffin Bay have been
below the maximum harvest fraction of 7.5% (80% quantile), prescribed in the Management Plan
(PIRSA 2013). Under the current MLLs, application of a 7.5% harvest fraction would yield a TACC
of 65.1 t (10.3 t of K. scalarina ≥ 30 mm SL; 54.8 t of K. rhytiphora ≥ 35 mm SL). Maintaining the

Dent, J. et al. (2016) Harvestable biomass of mud cockles
22
TACC at 50.0 t would reflect an exploitation rate of 5.8%. Consequently, the TACC could be
increased whilst remaining within the rules of the harvest strategy.
At Coffin Bay, changes in the estimates of harvestable biomass among years also reflect changes
in the survey design, as well as changes in species-specific MLLs and mud cockle abundance.
The survey design changes reflect refinement to areas of commercial importance. Notably, in
2015, a commercially important area for K. rhytiphora was added to the survey area and the
harvestable biomass for this species estimated for a reduced MLL (35 mm SL vs 38 mm SL
historically). To separate changes in harvestable biomass estimates among years from
differences in stock abundance, density estimates of legal-sized and sub-legal-sized K. scalarina
and K. rhytiphora were determined from those sampling locations surveyed in all years and
standardised to the current MLLs. These data show that the density of legal-sized and sub-legal-
sized K. scalarina in 2013 and 2015 were significantly lower (by approximately 50%) than the
estimates from the first two surveys (i.e. 2009 and 2011). Although the density of K. scalarina has
not declined between 2013 and 2015, the lower density estimates from 2013 suggest a
conservative approach to TACC setting and regular monitoring in future years are warranted. In
contrast, a consistent temporal trend in legal-sized abundance was not observed for K. rhytiphora.
For both species, the length-frequency data show that a high proportion of the cockles sampled
in 2015 were below the MLL and it is anticipated these will recruit into the fishable stock over the
next 1-2 years.
In 2015, no legal-sized K. peronii were observed. Consequently, the contribution of this species
to the total estimate of harvestable biomass was zero. The harvestable biomass in 2015 was
dominated by K. rhytiphora (86%), with only a small contribution from K. scalarina (14%). This
reflects the localised, higher densities of the larger K. rhytiphora compared with the more broadly
distributed, less dense and smaller K. scalarina.
Historically, the relationships between the proportional contribution of each species to the
harvestable biomass and catch have been inconsistent. While these differences reflect the higher
market demand for K. scalarina during this period, they highlight the difficulty of optimising
exploitation rates across species when a ‘global’ TACC is set on the combined harvestable
biomass of all species. Although in more recent years at Coffin Bay there has been a closer
relationship between the proportional contributions of each species to the harvestable biomass
compared to the catch, these differences highlight the need to consider directly linking exploitation
rates to species-specific productivity because productivity, and responses to being fished,
inherently vary among species.
Dent, J. et al. (2016) Harvestable biomass of mud cockles
23
Despite the dynamics identified above, the exploitation rate in Coffin Bay is below the maximum
of 7.5%, MLLs are set at a size that enable the majority of mud cockles to reproduce prior to being
available for harvest and there is evidence of recent recruitment for both species. Given there is
no evidence to indicate that the (1) stock is recruitment overfished; or (2) current fishing pressure
is likely to result in the stock becoming recruitment overfished, the stock status of mud cockles in
Coffin Bay is classified as ‘sustainable’.
4.1.2 West Coast
The West Coast comprises three areas – Smoky Bay, Streaky Bay and Venus Bay. In 2014/15
and 2015/16, the TACC for the West Coast was set at 16.0 t. This reflected an exploitation rate
(harvest fraction) of 3.2% at the 80% quantile of the 2013 biomass estimate. This relatively low
TACC (and low harvest fraction) was set predominantly because commercial fishers identified
that there was inadequate fishing capacity to harvest a larger TACC (Gorman et al. 2011), such
as that permitted under the Management Plan’s maximum 7.5% harvest fraction (i.e. 37.6 t). For
2016/17, the maximum available TACC permitted for the West Coast by the harvest strategy in
the Management Plan is 35.9 t. If the TACC in 2016/17 was set at the same level as in 2015/16
(i.e. 16.0 t) this would reflect a harvest fraction of 3.3% (at 80% quantile).
On the West Coast, similar to Coffin Bay, changes in the estimates of harvestable biomass among
years are affected by differences in survey design and abundance – the survey design changes
again reflect refinement to areas of commercial importance. Notably, additional survey areas have
potentially contributed to substantial increases in the median estimates of legal-size biomass at
Venus Bay (32.0 t increase) and Smoky Bay (28.0 t increase) between 2013 (Dent et al. 2014)
and 2015 (Table 2), contrasting with the 107.0 t (34%) decrease in the median estimate of legal
biomass of K. scalarina at Streaky Bay over the same time period.
As with Coffin Bay, mud cockle density estimates were determined from only those transects
surveyed in all years, to more robustly assess temporal changes in harvestable biomass
estimates by eliminating the potential bias caused by changes in the areas included in survey
design. These data show that the abundance of legal-sized K. scalarina in Streaky Bay and Venus
Bay in 2015 were significantly lower when compared with 2009 and 2011, but the densities of
sublegal-sized K. scalarina in recent years in Streaky Bay were substantially (approximately
double) and significantly higher in 2013 and 2015 when compared with older density estimates.
Although these juveniles are likely to recruit into the fishable stock over the next 1-2 years, the
spatially-consistent declines in the density of legal-sized K. scalarina (i.e. at Streaky Bay, Venus
Bay and Coffin Bay) reinforce the need for a conservative approach to TACC setting and regular

Dent, J. et al. (2016) Harvestable biomass of mud cockles
24
monitoring in future years. Temporal patterns in legal-sized mud cockle density were more
variable for K. rhytiphora and K. peronii in all three West Coast fishing grounds and for K. scalarina
in Smoky Bay, with no significant differences among years identified.
Length-frequency distributions for Smoky Bay and Streaky Bay indicate a large cohort of
individuals just below the MLL at the time of survey, which will likely recruit to the harvestable
biomass in the next few years. The length frequency distributions between 2014 and 2015 for
K. scalarina at Streaky Bay also provide some insight into the growth rate of juveniles of this
species. Between February 2014 and November 2015 (20 months or 1.7 years), the dominant bin
class (14 mm SL) was replaced by the 27 mm SL size class, suggesting a growth rate of
~7.5 mm.y-1. It should be noted that this period includes two winters but only one summer so it is
possible that this is an underestimate of growth, particularly if growth occurs seasonally during
the warmer months.
The median estimate of total harvestable biomass in 2015 was dominated by K. scalarina (56%)
and K. rhytiphora (31%), with only a small contribution from K. peronii (13%). Most of the biomass
was in Streaky Bay (51%), followed by Venus Bay (29%) and Smoky Bay (20%).
Relationships between the proportional contribution of each bay to the harvestable biomass and
catch have been historically inconsistent. For example, 80% of the catch in 2009/10 was
harvested from Venus Bay, despite this area having about 38% of the total harvestable biomass.
Similarly, in 2010/11, 2011/12 and 2013/14, the same patterns were observed for Streaky Bay. In
contrast, Smoky Bay was relatively lightly fished in most years as the proportion of total catches
reported as being from this area was substantially lower than the proportion of the harvestable
biomass (e.g. 5% of catch vs 18% of harvestable biomass in 2012/13). These differences highlight
the (1) difficulty of achieving consistent, optimal exploitation rates across fishing grounds when
there is a ‘global’ TACC based on their combined harvestable biomass; and (2) opportunity for
high (and highly variable) exploitation rates among fishing grounds, species and years. As the
mud cockle populations in each of the three West Coast cockle fishing grounds likely comprise
separate stocks, incorporation of this spatial structure into management of the fishery should be
considered (Taylor and Dizon 1999; Lorenzen et al. 2010). While one way to achieve this would
be to harvesting catches from areas in approximate proportion to the biomass available for
harvest, this would likely require a greater level of spatial management for this fishery, that may
be impeded because of a paucity of data and the necessary increases in research and
management costs.

Dent, J. et al. (2016) Harvestable biomass of mud cockles
25
Overall, the exploitation rate in the West Coast is below the maximum of 7.5%, MLLs are in place
that enable the majority of mud cockles to reproduce prior to being available for harvest and there
is some evidence of recent recruitment across the fishery. Given there is no evidence to indicate
that (1) the stock is recruitment overfished; or (2) current fishing pressure is likely to result in the
stock becoming recruitment overfished, the stock status of mud cockles in the West Coast is
classified as ‘sustainable’.
4.2 Future research needs
The most important component of future research is to standardise the survey sampling design
for the West Coast and Coffin Bay for future surveys. This is required because, to inform
sustainable management of the stock, it is essential to develop a robust time-series of harvestable
biomass estimates that are unaffected by changes in survey design. If this was achieved, then
changes in harvestable biomass would accurately reflect changes in population abundance,
rather than a combination of changes in both abundance and survey design. This is particularly
important for a species that has highly variable recruitment and is vulnerable to environmental
mortality events.
Standardising the survey design requires several considerations. The first is to ensure that the
survey design excludes areas that are unsuitable for commercial fishing, thereby preventing
overestimation of the harvestable biomass. Areas (1) with low (i.e. commercially unviable) mud
cockle density, (2) that are inaccessible (e.g. within private oyster leases), and/or (3) contain a
high proportion of ‘stunted mud cockles’ requiring extensive catch measurement to ensure
compliance with MLLs, should be considered for exclusion. Secondly, identification of a standard
cockle rake for data collection would eliminate the need to correct for variable rake widths among
operators, standardise gear efficiency and ensure that the population structure data are collected
in a more consistent manner. Whilst this would eliminate several current aspects of uncertainty,
it would not standardise across the capabilities of the commercial fishers undertaking the surveys.
This could be achieved in future years using the method already established for pipi (Ferguson et
al. 2015) where catch weights for each fisher are compared statistically and an efficiency
correction applied where necessary.
Given the documented spatial variation in the biology of molluscs (Cranfield and Michael 2001)
and other benthic marine invertebrates – at both local and regional scales as is the case for
abalone populations (Saunders and Mayfield 2008), the lower estimate of SAM50 obtained for
K. scalarina in the West Coast (23.2 mm SL; Dent et al. 2012), whilst similar to previous estimates
Dent, J. et al. (2016) Harvestable biomass of mud cockles
26
(Fowler and Eglinton 2002), was smaller than that obtained from nearby Coffin Bay (26.1 mm SL;
Gorman et al. 2011). However, the large increase in the proportion of K. rhytiphora comprising
the harvestable biomass in the West Coast between surveys, and the lack of similar spatially-
resolved data, suggests the need for more robust estimates of SAM50 for this species.
Determining the proportion of each species in the catch is difficult because reporting of catch by
species is voluntary. Few catch records contain this information for Coffin Bay (Figure 2) and
there is almost no reporting by species from the West Coast. Mandatory reporting of catch, by
species, in both cockle fishing zones would provide useful information to inform management
aimed at protection of the harvestable/spawning biomass for each of the 10 stocks (three species
by four bays with K. peronii absent from two bays).
Studies are underway to evaluate the potential for the estimate of biomass provided in these
reports to be based on length, rather than weight. Currently, samples are split into sublegal and
legal-sized components and then counted and weighed. A relationship between SL and weight
could be used to estimate the weight of each cockle based on its shell length. This approach is
similar to that used in the stock assessment of abalone in South Australia (Stobart et al. 2015)
and provides several advantages including increased efficiency in sample processing and to
enable more effective comparisons between years.
Dent, J. et al. (2016) Harvestable biomass of mud cockles
27
5. REFERENCES
Ault, J. S., Diaz, G. A., Smith, S. G., Luo, J. and Serafy, J. E. (1999). An efficient sampling survey design to estimate pink shrimp population abundance in Biscayne Bay. North American Journal of Fisheries Management. 19(3): 696-712. Cranfield, H. J. and Michael, K. P. (2001). Growth rates of five species of surf clams on a southern North Island beach, New Zealand. New Zealand Journal of Marine and Freshwater Research. 35(5): 909-924. Dent, J., Mayfield, S., Burch, P., Gorman, D. and Ward, T. M. (2012). Distribution, harvestable biomass and fisheries biology of Katelysia spp. in the South Australian commercial mud-cockle fishery. Report to PIRSA Fisheries and Aquaculture. South Australian Research and Development Institute (Aquatic Sciences), Adelaide. SARDI Publication No. F2010/000263-2. SARDI Research Report Series No. 595. 23pp. Dent, J., Mayfield, S., Ferguson, G., Carroll, J. and Burch, P. (2014). Harvestable biomass of Katelysia spp. in the South Australian commercial mud cockle fishery. Report to PIRSA Fisheries and Aquaculture. South Australian Research and Development Institute (Aquatic Sciences), Adelaide. SARDI Publication No. F2014/000191-1. SARDI Research Report Series No. 766. 22pp. Edwards, J. (1999). Population biology of mud cockles, Katelysia spp. in the Port River of South Australia. The University of Adelaide. Ferguson, G.J., Ward, T.M. and Gorman, D. (2015). Recovery of a Surf Clam Donax deltoides Population in Southern Australia: Successful Outcomes of Fishery-Independent Surveys. North American Journal of Fisheries Management. 35: 1185-1195. Flood, M, Stobutzki, I, Andrews, J, Ashby, C, Begg, G, Fletcher, R, Gardner, C, Georgeson, L, Hansen, S, Hartmann, K, Hone, P, Horvat, P,Maloney, L, McDonald, B, Moore, A, Roelofs, A, Sainsbury, K, Saunders, T, Smith, T, Stewardson, C, Stewart, J & Wise, B. (2014), Status of key Australian fish stocks reports (2014). Fisheries Research and Development Corporation, Canberra. Fowler, A. J. and Eglinton, Y. M. (2002). Mud Cockles (Katelysia spp.) Fishery Assessment Report to PIRSA for the MSF Fishery Management Committee. South Australian Fisheries Assessment Series. South Australian Research and Development Institute 01/12 27. Gorman, D., Mayfield, S., Burch, P. and Ward, T. M. (2010). Distribution, harvestable biomass and fisheries biology of Katelysia spp. in the South Australian commercial mud cockle fishery. South Australain Research and Development Institute (Aquatic Sciences), Adelaide. SARDI Publication No. F2010/000263-1. SARDI Research Report Series No. 442. 36p. Gorman, D., Mayfield, S., Ward, T. M. and Burch, P. (2011). Optimising harvest strategies in a multi-species bivalve fishery. Fisheries Management and Ecology. 18(4): 270-281. Haddon, M., Harrington, J. J. and Semmens, J. M. (2006). Juvenile scallop discard rates and bed dynamics: testing the management rules for scallops in Bass Strait. Final report to the Fisheries Research and Development Corporation. Project No. 2003/017 Tasmanian Aquaculture and Fisheries Institute, Hobart, Australia.

Dent, J. et al. (2016) Harvestable biomass of mud cockles
28
Knight, M. and Tsolos, A. (2012). South Australian Wild Fisheries Information and Statistics Report South Australian Research and Development Institute, (Aquatic Sciences) Adelaide. SARDI publication number F2008/000804-4, SARDI Research Report Series No. 612.57pp. Lorenzen, K., Steneck, R. S., Warner, R. R., Parma, A. M., Coleman, F. C. and Leber, K. M. (2010). The Spatial Dimension of Fisheries: Putting it all in place. Bulletin of Marine Science. 86(2): 169-177. Mangel, M., Talbot, L. M., Meffe, G. K., Agardy, M. T., Alverson, D. L., Barlow, J., Botkin, D. B., Budowski, G., Clark, T., Cooke, J., Crozier, R. H., Dayton, P. K., Elder, D. L., Fowler, C. W., Funtowicz, S., Giske, J., Hofman, R. J., Holt, S. J., Kellert, S. R., Kimball, L. A., Ludwig, D., Magnusson, K., Malayang, B. S., Mann, C., Norse, E. A., Northridge, S. P., Perrin, W. F., Perrings, C., Peterman, R. M., Rabb, G. B., Regier, H. A., Reynolds, J. E., Sherman, K., Sissenwine, M. P., Smith, T. D., Starfield, A., Taylor, R. J., Tillman, M. F., Toft, C., Twiss, J. R., Wilen, J. and Young, T. P. E. A.-. (1996). Principles for the conservation of wild living resources. Ecological Applications 6: 338-362. Mayfield, S., McGarvey, R., Carlson, I. J. and Dixon, C. (2008). Integrating commercial and research surveys to estimate the harvestable biomass, and establish a quota, for an "unexploited" abalone population. Ices Journal of Marine Science. 65(7): 1122-1130. Mayfield, S., McGarvey, R., Gorfine, H., Burch, P. and Sharma, S. (2009). Biomass of blacklip abalone (Haliotis rubra) between Pt. Fairy and the Crags in the Western Zone of the Victorian abalone fishery. Report for the Western Abalone Divers Association. South Australian Research and Development Institute (Aquatic Sciences), Adelaide. SARDI Publication number F2009/000443-1. SARDI Research Report Series No. 384. 36pp. McGarvey, R., Mayfield, S., Byth, K., Saunders, T., Chick, R., Foureur, B., Feenstra, J. E., Preece, P. and Jones, A. (2008). A diver survey design to estimate absolute density, biomass, and spatial distribution of abalone. Canadian Journal of Fisheries and Aquatic Sciences. 65(9): 1931-1944. PIRSA (2013). Management plan for the South Australian commercial marine scalefish fishery. Adelaide: 141pp. Ripley, B. J. and Caswell, H. (2006). Recruitment variability and stochastic population growth of the soft-shell clam, Mya arenaria. Ecological Modelling. 193(3-4): 517-530. Roberts, D. (1984). The genus Katelysia (Bivalvia: Verenidae) in South Australia. Journal of the Malacological Society of Australia 6(3-9): 191-204. Sakurai, I., Horii, T., Murakami, O. and Nakao, S. (1998). Population dynamics and stock size prediction for the sunray surfclam, Mactra chinensis, at Tomakomai, southwest Hokkaido, Japan. Fishery Bulletin. 96(2): 344-351. Saunders, T. and Mayfield, S. (2008). Predicting biological variation using a simple morphometric marker in the sedentary marine invertebrate Haliotis rubra. Marine Ecology-Progress Series. 366: 75-89. Stobart, B., Mayfield, S. and Dent, J. (2015) Assessment of the Western Zone Blacklip Abalone (Haliotis rubra) Fishery in 2014. Fishery Stock Assessment Report to PIRSA Fisheries and

Dent, J. et al. (2016) Harvestable biomass of mud cockles
29
Aquaculture. South Australian Research and Development Institute (Aquatic Sciences), Adelaide. SARDI Publication F2015/000407 -11. SARDI Research Report Series No. 864. 68pp. Taylor, B. L. and Dizon, A. E. (1999). First policy then science: why a management unit based solely on genetic criteria cannot work. Molecular Ecology. 8(12): S11-S16. Warner, R. R. and Chesson, P. L. (1985). Coexistence mediated by recruitment fluctuations - A field guide to the storage effect. American Naturalist. 125(6): 769-787.