harvey: immediate - stedc.tamucc.edustedc.tamucc.edu/files/harvey_update_stedc_2018q2.pdf · small...
TRANSCRIPT
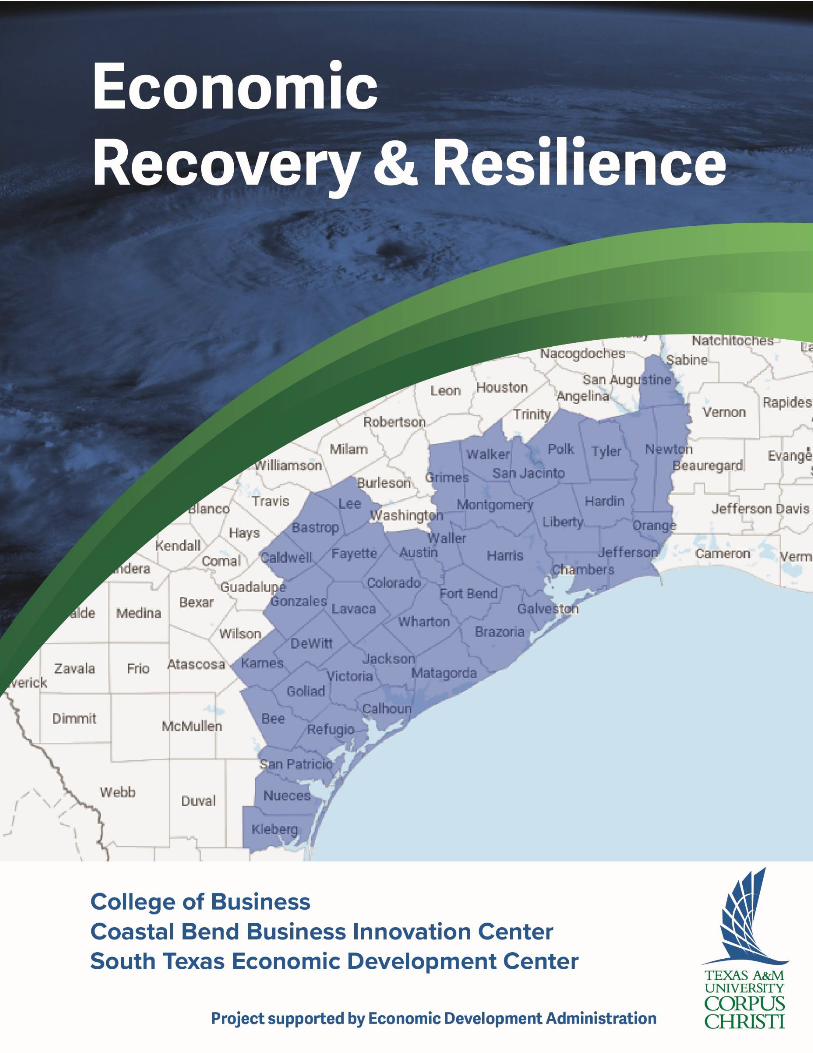
HARVEY: IMMEDIATE IMPACT & RECOVERY
1
Post-Harvey Update: 2018 Q2
Economic Recovery & Resilience Project
HARVEY: IMMEDIATE
IMPACT & RECOVERY

HARVEY: IMMEDIATE IMPACT & RECOVERY
1
SUMMARY
This report describes changes in the local economies of Harvey’s affected region
following the event. County-level data reveal not only the severity of economic
shocks inflicted by the hurricane but also the diversity and resilience of this
Texas Gulf Coast region. Consistent with the state’s report for Texas as a whole,
the local economies appear to have bounced back to pre-Harvey conditions due
largely to relief and rebuilding efforts in response to the disaster.
This update is part of the Economic Recovery and Resilience project funded by
the U.S. Economic Development Administration (EDA).
Read the online version of this report at stedc.atavist.com.
HIGHLIGHTS
Economic impact and subsequent recovery varied remarkably across
affected counties.
Indirect economic losses in terms of employment have been mitigated by
an influx of employed workforce in response to disaster relief and
rebuilding activities.
Early signs of economic recovery in full swing.
EDITORIAL TEAM
Jim Lee, Director, South Texas Economic Development Center
Email: [email protected]
Back Cover Graphic: Sonny Martinez, Graphic Designer, Coastal Bend Business
Innovation Center
Email: [email protected]
HARVEY: IMMEDIATE IMPACT & RECOVERY
2
ECONOMIC RECOVERY & RESILIENCE PROJECT TEAM
Coastal Bend Business Innovation Center
College of Business
South Texas Economic Development Center
ACKNOWLEDGEMENTS
This project benefits from collaboration with various government agencies and
other organizations. For this report, the author is grateful to first-hand data
provided by the following organizations and individuals:
FEMA Community Planning and Capacity Building: Rick Martin
Rockport-Fulton Chamber of Commerce: Diane Probst, Mike Woods
Santos McBain Management & Planning: Maryann Carl, Ray De Los
Santos
Small Business Administration: David Elizondo, Richard Jenkins, Mark
Randle
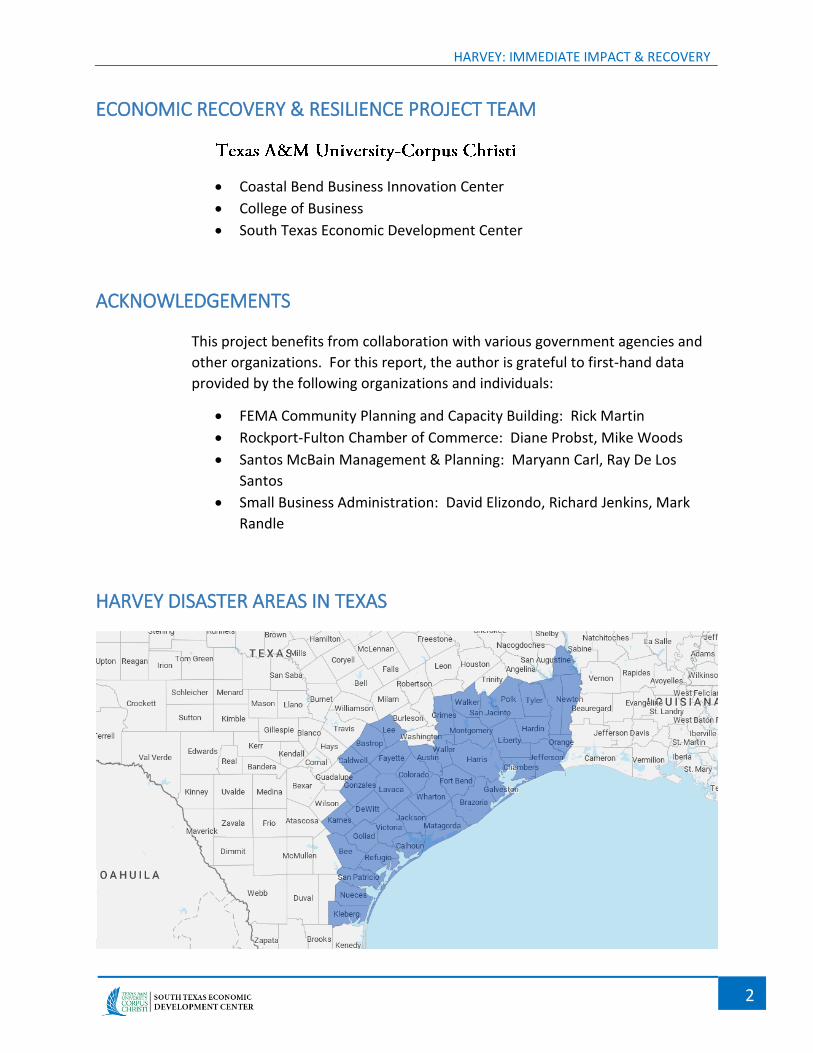
HARVEY DISASTER AREAS IN TEXAS
HARVEY: IMMEDIATE IMPACT & RECOVERY
3
INTRODUCTION
It’s been nine months since Hurricane Harvey wreaked havoc on Texas. This
historic storm left unprecedented property destruction to a widespread region
along the state’s Gulf Coast. Although it’s still too early to know its full impact,
public data allow us to understand the extent of Harvey’s immediate impact on
the regional economy other than property losses. This report takes a look at the
changes of economic activity so far, both negative and positive, in the local
communities devastated by Harvey.
Among the 41 counties designated as Harvey disaster areas, the Federal
Emergency Management Agency (FEMA) has rated 22 counties as those
sustaining medium or high property damage.[1] This report draws on popular
measures of economic activity, such as unemployment and employment, for
those 22 counties that bore the brunt of Harvey’s impact. These data are not
publicly available for cities or towns.
ECONOMIC COSTS
Harvey made its first landfall in Aransas County, devastating its cities of Rockport
and Fulton, and nearby communities, particularly Port Aransas in Nueces County
and Bayside in Refugio County. After continuing to head north toward San
Antonio, the storm detoured toward Houston. Whereas record amounts of
rainfall caused catastrophic flooding in southeastern Texas inland cities, such as
Houston and Beaumont, most property and infrastructure damages in the
western half of the Harvey impact zone were caused by destructive winds over
130 miles per hour and storm surge over 7 feet above ground.
Harvey is widely expected to be one of the costliest natural disasters in U.S.
history. The National Oceanic and Atmospheric Administration (NOAA) has
estimated this storm’s total costs to be at least $125 billion. But how a storm’s
economic impacts are calculated is not an exact science.
The most obvious of those costs represent direct damage to structures and other
properties, such as vehicles, and infrastructure, such as roads, bridges and power
lines. Those losses alone do not show up in the government’s regular economic
reports because they represent economic activity or spending that has already
taken place. Put simply, property damage or destruction alone does not affect
the conventional measures of economic activity, such as output.
HARVEY: IMMEDIATE IMPACT & RECOVERY
4
In addition to direct damage, natural disasters like Harvey cause indirect
economic losses, which include disruptions in business and other productive
activities due to evacuation and lost utilities, damage to structures and
equipment, displaced employees and so on. These affect the economy indirectly
through reductions in business sales, lost jobs and wage earnings.
But changes in the economy of an affected area in the wake of a natural disaster
are the outcomes of not only losses but also gains as a result of subsequent
rebuilding activity. The inflow of disaster relief funds from various government
agencies and insurance payments in the wake of the storm have raised overall
spending that would have spurred job and income growth. For instance, FEMA
has committed more than $30 billion for Harvey-related relief and the Small
Business Administration (SBA) has approved more than $3.3 billion in disaster
loans in Texas.
The following describes Harvey’s local economic impact and recovery that take
into consideration of these indirect losses and gains.
ECONOMIC SHOCKS
One way to understand the impact of Harvey on an affected area’s economy is to
look at changes in its labor market conditions following the storm. The scatter
plot on the next page shows FEMA’s scores for the storm’s impact on individual
counties (horizontal axis) against the scores for each county’s own rebuilding
capacity (vertical axis). The bubbles depict the extent of changes in the local
labor market.
The primary factor for the impact score of a county is the number of applicants
for FEMA’s individual assistance relative to the total number of households
within that county. With more than 80 percent of local residents registering
with FEMA, Aransas, Jefferson and Orange Counties received the highest score of
3.
Factors for determining the rebuilding capacity of a county include its local
governments’ own budget sizes and other financial resources. A score of zero
indicates the lowest institutional capacity to recover. Among the 22 counties,
Aransas County has the lowest score closed to zero, whereas Harris County has
the highest score above 1.5.

HARVEY: IMMEDIATE IMPACT & RECOVERY
5
In the scatter plot, a location closer to the lower-left corner of the plot means
the area sustained more property damage from Harvey but it has less rebuilding
capacity. As the smallest of these 22 counties by area, Aransas County is not
only most affected by Harvey but it has the least financial capacity to rebuild
without external assistance.
Closest to the upper-right corner of the plot is Harris County. As part of the
Houston metro area, Harris is the most populous county in Texas. Despite no
more than 25 percent of this county’s residents applied for FEMA assistance, the
number of applicants exceeded 130,000 due to the sheer size of its population.
The size of each bubble in the scatter plot reflects the immediate impact of
Harvey on a county’s unemployment rate. This impact measure is the difference
between the actual unemployment rate in September and a baseline for
comparison. A baseline is a modeling projection for periods following Harvey
under the counterfactual assumption of no hurricane event in August.[2]
Aransas5.08
Bastrop-0.27
Brazoria0.12Bee
-0.17
Calhoun0.90
Colorado-0.29
DeWitt-0.29
Goliad0.17
Hardin0.77
Harris0.03
Jackson0.00
Jasper-0.49
Jefferson1.61
Newton-0.10
Nueces0.17
Orange2.01
Polk-0.14
Refugio2.65
San Jacinto-0.22
San Patricio1.75
Tyler-0.08
Victoria0.19
0.0
1.0
1.02.03.0
Rebuil
din
g C
apacit
y (
0=lo
west)
Impact Score (3=highest)
SOURCES: FEMA, October 2017; STEDC.
HARVEY: IMMEDIATE IMPACT & RECOVERY
6
Not surprisingly, Aransas County, where Harvey made its first landfall,
experienced the most economic impact. Its unemployment rate nearly doubled
from 5.4 percent in July and August to 10.3 percent in September.
Counties with higher FEMA impact scores also tended to face larger
deterioration in their labor market conditions (or larger bubbles). But
unemployment did not rise immediately in all affected areas. Such counties as
Bastrop, DeWitt, and Jasper actually experienced lower unemployment in
September than expected.
The plot also suggests that larger counties tended to be more able to absorb
Harvey’s impact on their local economies. Relatively smaller counties,
particularly Aransas, Refugio and Jefferson, faced a sizable jump in the
unemployment rate in September. Meanwhile, the largest counties, such as
Harris and Nueces, saw little change.
ROAD TO RECOVERY
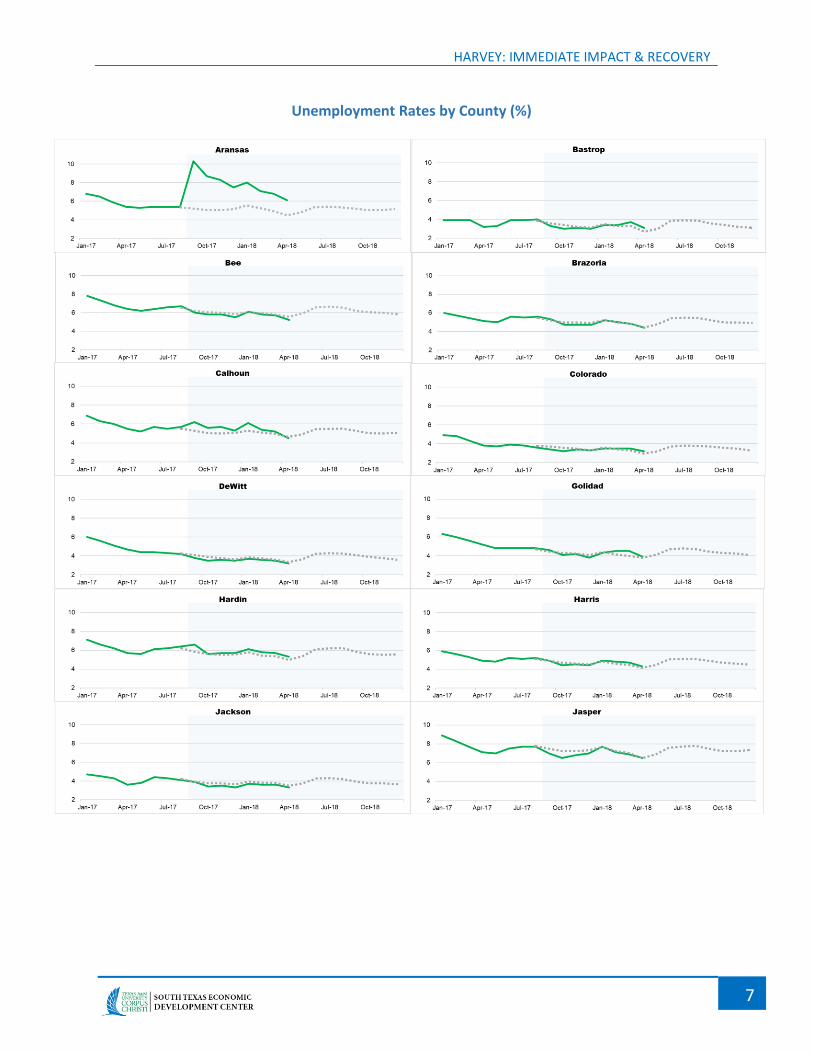
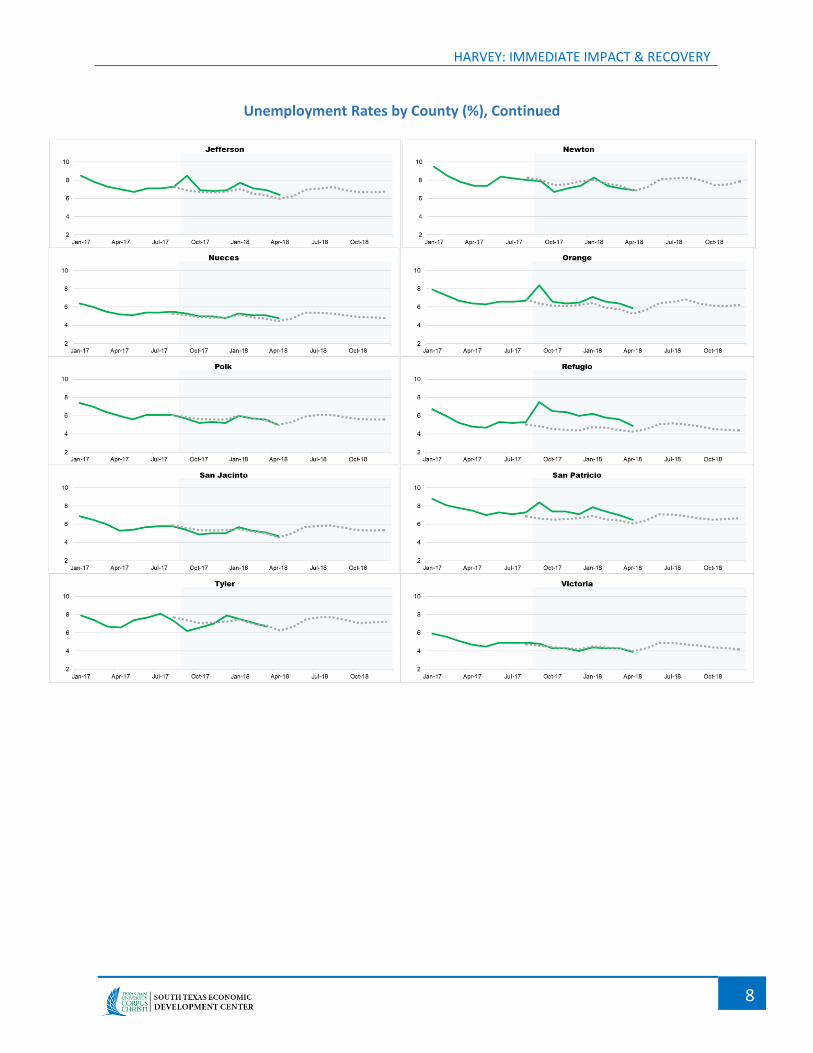
Changes in local unemployment rates since September help us visualize how the
Harvey impacted communities have responded to the storm so far. The set of
charts on the next page displays historical unemployment rates for each county
along with our baseline projection (dash line) under the assumption that the
storm event did not occur. The projected data reflects the unemployment rates
consistent with pre-Harvey conditions. For most counties, the baseline
beginning September 2017 is relatively flat except for movements that capture
seasonal changes.
This is not the case for actual unemployment. For Aransas County, the
unemployment rate has been declining steadily after a dramatic surge in
September. By April, its local unemployment rate reached 6.1 percent,
compared to the projected rate at 4.5 percent. This pattern of persistent
improvement is shared by its neighboring Refugio County, which also
experienced a steady decline in unemployment from 7.5 percent in September
to 4.9 percent in the following April. These two counties consist of
neighborhoods where Harvey made landfall.
The majority of other counties also saw declining unemployment rates since
September, but the sizes of improvement were relatively smaller. Still Harvey’s
negative impact on local economies is not noticeable for some counties, such as
Bee, DeWitt and Goliad. In these cases, the actual unemployment rates are
exceptionally close to the baseline.
HARVEY: IMMEDIATE IMPACT & RECOVERY
7
Unemployment Rates by County (%)
HARVEY: IMMEDIATE IMPACT & RECOVERY
8
Unemployment Rates by County (%), Continued

HARVEY: IMMEDIATE IMPACT & RECOVERY
9
EMPLOYMENT AND EARNINGS
The observed unemployment impacts over time can be translated into losses in
jobs and wage earnings. For each county, the employment loss in a particular
month after Harvey is first measured by the size of its existing local labor force
times the difference between the actual unemployment rate and baseline
unemployment rate. The loss in total wage earnings equals the county’s average
employee earnings times the estimated employment loss.[3]
The following bar chart shows the estimates for cumulative local wage impacts
by the end of April. While half of the counties experienced the widely expected
employment and wage losses, the other half counties saw an overall gain by
April.
-50 -40 -30 -20 -10 0 10
Brazoria
Jasper
Victoria
Polk
Dewitt
Bee
Jackson
Newton
San Jacinto
Colorado
Bastrop
Tyler
Goliad
Refugio
Hardin
Calhoun
Aransas
San Patricio
Orange
Nueces
Jefferson
Harris
SOURCES: BLS, EMSI, STEDC.
Impact on Wage Earnings as of April 2018 ($M)
HARVEY: IMMEDIATE IMPACT & RECOVERY
10
By April, the 22 counties collectively saw a net loss of $107 million in employee
earnings. Harris County stood to lose $46.7 million due to Harvey’s impact on its
overall employment level. Nueces County, which encompasses Port Aransas that
was devastated during Harvey’s landfall, has lost $11 million so far.
On the contrary, Brazoria County, another part of the Houston metro area, has
experienced a net income gain of nearly $6 million so far. This gain was a result
of a higher than expected employment level during seven of the first nine
months following Harvey.
The observation that half of the 22 counties had already experienced a net
employment or income gain by April underscores the role of recovery and
rebuilding efforts across the Harvey impacted communities. Yet the labor force
in those communities in the wake of the storm might have changed for different
reasons. Destroyed homes might have reduced the size of the local labor force
due to the loss of displaced workers who left the affected community
permanently. Other things being equal, the expected loss of population and thus
labor force in the affected counties would have reduced their unemployment
rates without creating any new jobs.
On the other hand, losses in labor force due to out-migration may be offset by
temporary gains of workers coming from the rest of the nation. Along with the
influx of workers for restoring utilities and infrastructure and cleaning up debris,
Harvey-related relief and reconstruction funds from the government and other
sources might have kick-started the recovery process before the end of 2017.
How much has the local labor force changed in the Harvey impacted areas? The
bar chart on the next page shows the difference between the labor force size of
each county over the post-Harvey period so far and the size during 12-month
period immediately before Harvey (August 2016 to July 2017). While 13 of the
22 counties saw a net decline in the local labor force during the post-Harvey
period, other counties actually saw a net gain as much as 3.4 percent.
The range between -4 percent (Tyler) and 3.4 percent (Colorado) is remarkable.
This highlights the importance of restoration and reconstruction efforts in our
measure of Harvey’s full impact.

HARVEY: IMMEDIATE IMPACT & RECOVERY
11
LABOR FORCE CHANGES
Now we consider the effect of labor force changes in our measure of Harvey’s
impact on local employment. The following charts compare for each of the 22
counties the employment impact in percentage terms based on the
counterfactual assumption of no effect of Harvey on the labor force against
estimates that take into account net labor force changes following Harvey.
For each month, the first column (blue) represents Harvey’s impact on
employment without possible effects of the storm or the subsequent relief and
rebuilding activities on the labor force. The second column (orange) depicts
Harvey’s employment impact that accounts for the net change in the local labor
force associated with the effects of displaced workers (which reduced the labor
force) and an influx of workers to the county due to relief and reconstruction-
related spending (which would have raised the labor force).[4]
-4% -2% 0% 2% 4%
Tyler
Bee
Refugio
Calhoun
Goliad
Jasper
Victoria
Newton
Nueces
San Patricio
Hardin
Polk
Jefferson
Orange
Jackson
San Jacinto
Dewitt
Harris
Brazoria
Aransas
Bastrop
Colorado
SOURCES: BLS, EMSI, STEDC.
Post-Harvey Labor Force Change

HARVEY: IMMEDIATE IMPACT & RECOVERY
12
Employment Impacts by County, Without & With Labor Force Change
HARVEY: IMMEDIATE IMPACT & RECOVERY
13
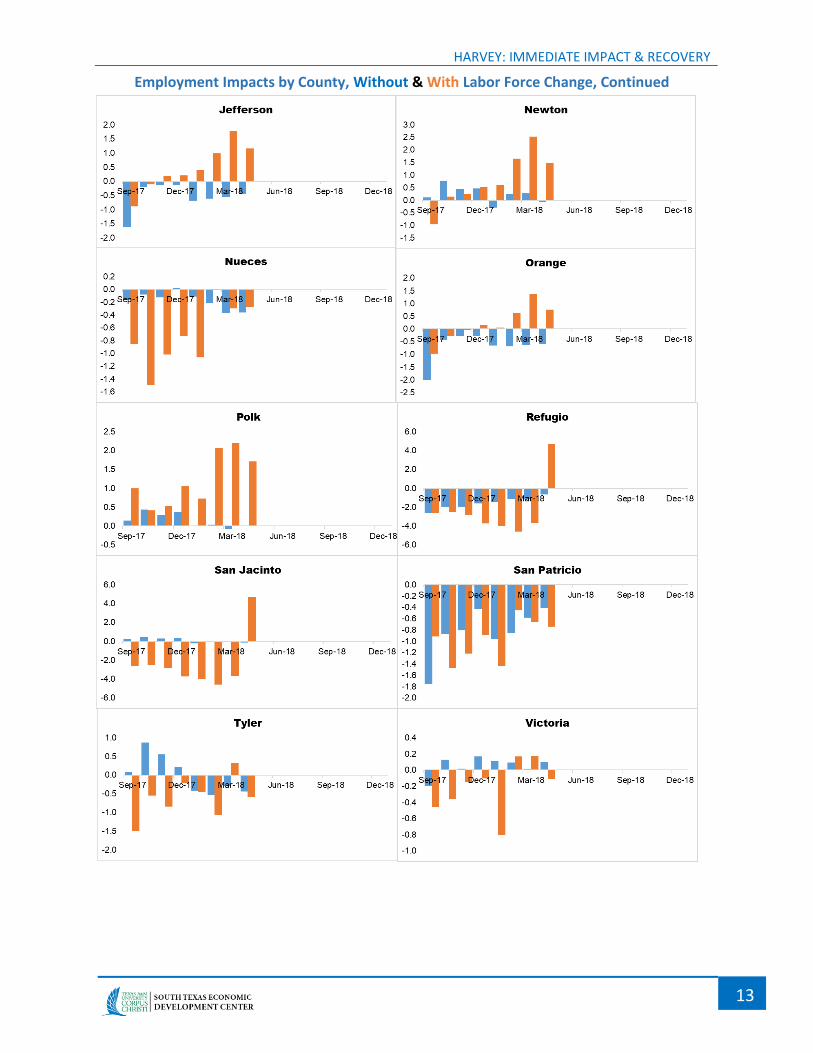
Employment Impacts by County, Without & With Labor Force Change, Continued
HARVEY: IMMEDIATE IMPACT & RECOVERY
14
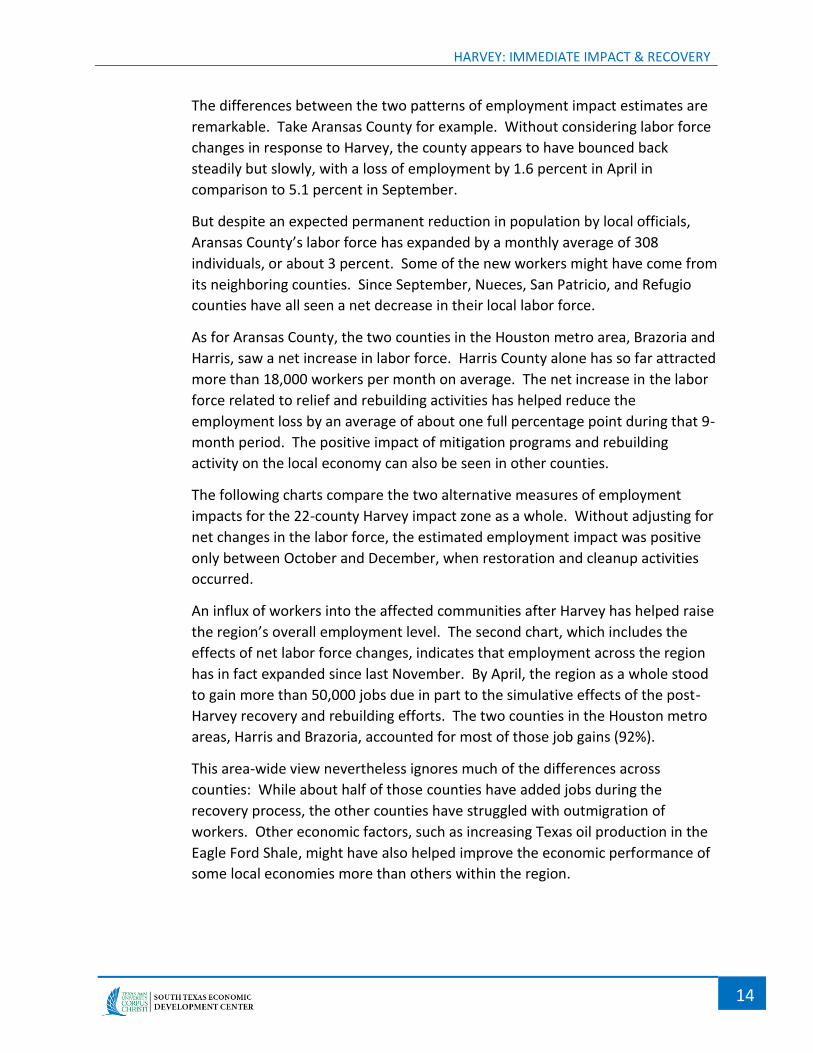
The differences between the two patterns of employment impact estimates are
remarkable. Take Aransas County for example. Without considering labor force
changes in response to Harvey, the county appears to have bounced back
steadily but slowly, with a loss of employment by 1.6 percent in April in
comparison to 5.1 percent in September.
But despite an expected permanent reduction in population by local officials,
Aransas County’s labor force has expanded by a monthly average of 308
individuals, or about 3 percent. Some of the new workers might have come from
its neighboring counties. Since September, Nueces, San Patricio, and Refugio
counties have all seen a net decrease in their local labor force.
As for Aransas County, the two counties in the Houston metro area, Brazoria and
Harris, saw a net increase in labor force. Harris County alone has so far attracted
more than 18,000 workers per month on average. The net increase in the labor
force related to relief and rebuilding activities has helped reduce the
employment loss by an average of about one full percentage point during that 9-
month period. The positive impact of mitigation programs and rebuilding
activity on the local economy can also be seen in other counties.
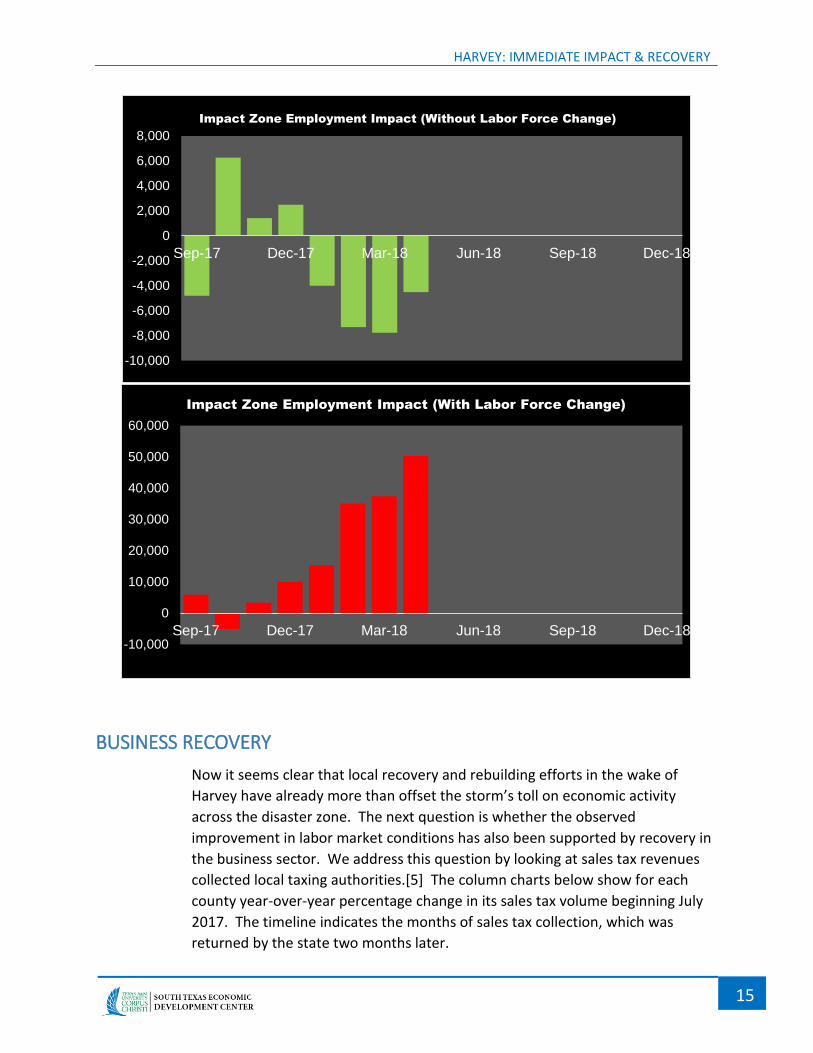
The following charts compare the two alternative measures of employment
impacts for the 22-county Harvey impact zone as a whole. Without adjusting for
net changes in the labor force, the estimated employment impact was positive
only between October and December, when restoration and cleanup activities
occurred.
An influx of workers into the affected communities after Harvey has helped raise
the region’s overall employment level. The second chart, which includes the
effects of net labor force changes, indicates that employment across the region
has in fact expanded since last November. By April, the region as a whole stood
to gain more than 50,000 jobs due in part to the simulative effects of the post-
Harvey recovery and rebuilding efforts. The two counties in the Houston metro
areas, Harris and Brazoria, accounted for most of those job gains (92%).
This area-wide view nevertheless ignores much of the differences across
counties: While about half of those counties have added jobs during the
recovery process, the other counties have struggled with outmigration of
workers. Other economic factors, such as increasing Texas oil production in the
Eagle Ford Shale, might have also helped improve the economic performance of
some local economies more than others within the region.
HARVEY: IMMEDIATE IMPACT & RECOVERY
15
BUSINESS RECOVERY
Now it seems clear that local recovery and rebuilding efforts in the wake of
Harvey have already more than offset the storm’s toll on economic activity
across the disaster zone. The next question is whether the observed
improvement in labor market conditions has also been supported by recovery in
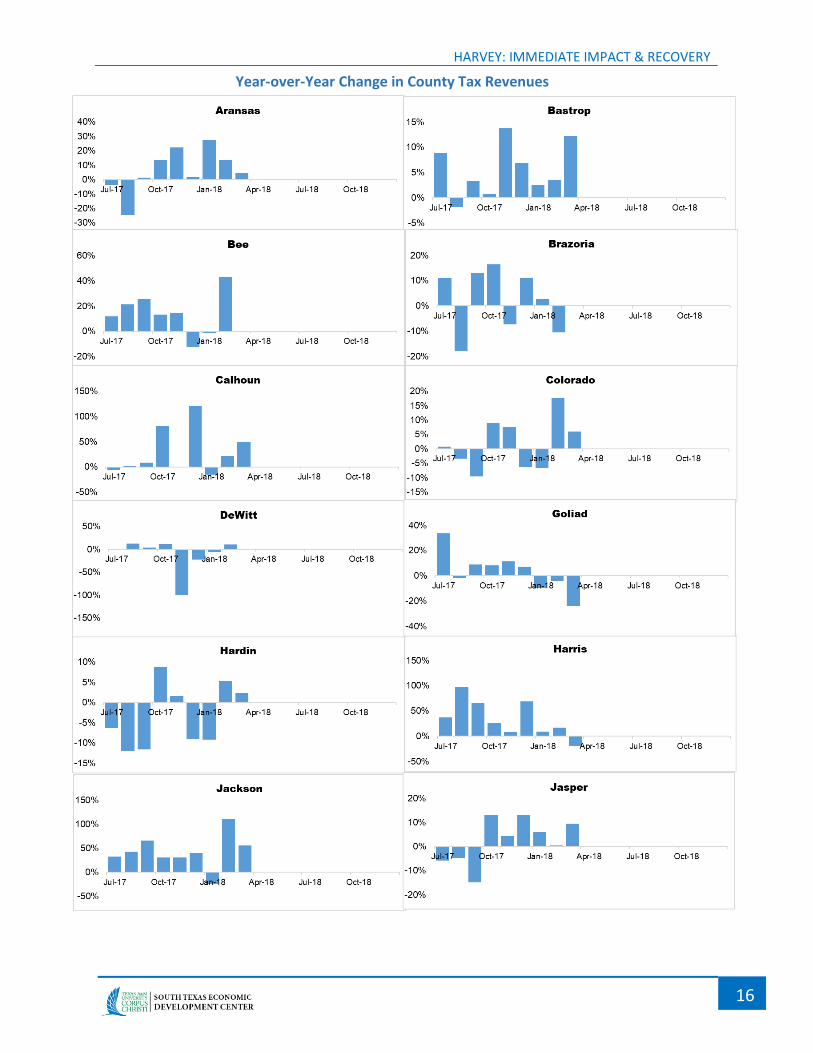
the business sector. We address this question by looking at sales tax revenues
collected local taxing authorities.[5] The column charts below show for each
county year-over-year percentage change in its sales tax volume beginning July
2017. The timeline indicates the months of sales tax collection, which was
returned by the state two months later.
-10,000
-8,000
-6,000
-4,000
-2,000
0
2,000
4,000
6,000
8,000
Sep-17 Dec-17 Mar-18 Jun-18 Sep-18 Dec-18
Impact Zone Employment Impact (Without Labor Force Change)
-10,000
0
10,000
20,000
30,000
40,000
50,000
60,000
Sep-17 Dec-17 Mar-18 Jun-18 Sep-18 Dec-18
Impact Zone Employment Impact (With Labor Force Change)
HARVEY: IMMEDIATE IMPACT & RECOVERY
16
Year-over-Year Change in County Tax Revenues
HARVEY: IMMEDIATE IMPACT & RECOVERY
17
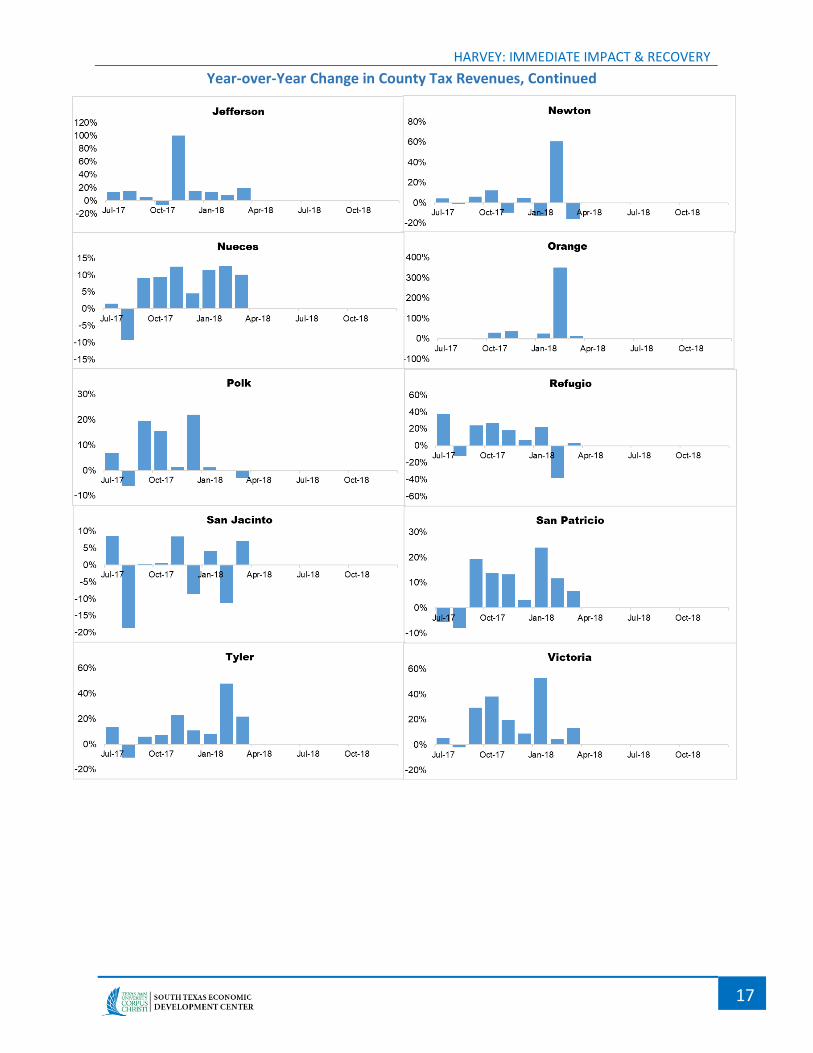
Year-over-Year Change in County Tax Revenues, Continued
HARVEY: IMMEDIATE IMPACT & RECOVERY
18
The charts reveal the impact of Harvey on businesses especially in late August
when most businesses in the affected areas were closed. But since then sales
tax revenues have grown for most counties. Hardin County, part of the
Beaumont-Port Arthur metro area, is a notable exception.
The business sector in most counties is not fully restored yet. In Aransas County,
Harvey damaged nearly 80 percent of its business establishments, but over
three-quarters of businesses in the Rockport-Fulton area are now back in
operation. Meanwhile, home repair and other reconstruction activities are a
boon to local retail sales and thus sales tax revenues.
BEYOND RECOVERY
Despite Harvey’s widespread devastation to infrastructure and property,
measures of changes in local employment and business activity have helped us
better understand the transitory nature of its economic impacts. This
observation is consistent with an economic impact analysis for the hurricane
conducted by the Texas Comptroller of Public Account.[6]
The Comptroller’s office expects the state to lose $3.8 billion in Gross State
Product (GSP), the broadest measure of economic activity for the state, within
the first year of Harvey. This estimate is the difference between the estimated
losses of $16.8 billion in economic activity immediately after the storm and the
estimated gains of $13 billion during the subsequent recovery process. In the
second year, Harvey is are expected to generate a net gain of $2.1 billion in GSP.
These estimates depict net changes in Texas’ economy as a whole. In all, the
state economy should have already bounced back to pre-Harvey level by the end
of 2017. Our overall findings across the disaster zone bode well with this high-
level perspective.
As another hurricane season is approaching, government officials and
policymakers alike can rest assured that Harvey’s economic recovery is taking
shape across Texas. Government disaster-related aid and rebuilding activity
might have offset much of Harvey’s economic toll on the affected communities.
After all, evidence of wide-ranging impacts and recovery speeds among
individual communities implies that we should pay also particular attention to
the performance of local economies. Future studies may benefit from more
granular data, such as individual sectors within a city, or an analysis of the effects
of resource allocations during the recovery phase, such as the relief and
reconstruction funds from government and other sources.
HARVEY: IMMEDIATE IMPACT & RECOVERY
19
ENDNOTES
[1] The 22 counties that bore the brunt of the devastation by Harvey are
Aransas, Bastrop, Bee, Brazoria, Calhoun, Colorado, DeWitt, Goliad, Hardin,
Harris, Jackson, Jasper, Jefferson, Newton, Nueces, Orange, Polk, Refugio,
San Jacinto, San Patricio, Tyler, and Victoria. Except Brazoria and Harris of
the 9-county Houston metro area, all counties has an overall FEMA storm
impact score of 2, which represents a medium or higher storm impact. The
impact score for Brazoria and Harris Counties is 1.7, but some of its cities
have a score of 2 or higher.
[2] For each county, we made a baseline projection for its unemployment rate
and labor force size between September 2017 and December 2018. These
projected data, or forecasts, are constructed by applying a statistical model
that best fits the actual monthly data between January 2000 and July 2017.
This model takes into consideration of the historical trend over a long period
and seasonal patterns within a year.
[3] For each county, the estimate is the total wage impact equals the 9-month
equivalent of the county’s average annual wage earnings times the average
of the monthly employment impact estimates during the 9-month period
between September and April.
[4] The measure of employment impacts corresponds to the vertical difference
between the actual unemployment rate and the baseline shown in the
corresponding unemployment chart above. The measure without the net
effect of labor force changes equals the negative of that difference times the
average labor force size of the 12-month period immediately before Harvey
(August 2016-July 2017). The measure with the net effect of labor force
changes is the above measure plus Harvey’s impact on the labor force. For
each month beginning September 2017, Harvey’s impact on the labor force
size is measured by the difference between the actual size and its baseline
projected by the same method as for the unemployment rates above.
[5] For counties that do not impose a sales tax, such as Newton, we used the
data of it largest city.
[6] Texas Comptroller of Public Account, “A Storm to Remember: Hurricane
Harvey and the Texas Economy,” Fiscal Notes, February 2018.
HARVEY: IMMEDIATE IMPACT & RECOVERY
20
ABOUT SOUTH TEXAS ECONOMIC DEVELOPMENT CENTER
Our mission is to catalyze economic development in South Texas by providing data-driven
analytics and technical assistance to leaders and other decision makers in the public and
public sectors.
For other Harvey related economic data and updates, visit us online at
http://stedc.tamucc.edu/harvey
Related Articles
“Hotel Performance after Harvey,” South Texas Economic Pulse, 2018, Issue 7.
“Business Recovery after Harvey,” South Texas Economic Pulse, 2018, Issue 6.
“Harvey’s Impact on Corpus Christi,” South Texas Economic Pulse, 2018, Issue 3.
Post-Harvey Update: 2018 Q2
Economic Recovery & Resilience Project